Review

Spaceborne L-Band Synthetic Aperture Radar Data for Geoscientific Analyses in Coastal Land Applications: A Review

1
German Aerospace Center (DLR), German Remote Sensing Data Center (DFD), D-82234 Wessling, Germany
2
Institute for Geography and Geology, University of Wuerzburg, Am Hubland, D-97074 Wuerzburg, Germany
*
Author to whom correspondence should be addressed.
Remote Sens. 2020, 12(14), 2228; https://doi.org/10.3390/rs12142228
Submission received: 20 June 2020 / Revised: 8 July 2020 / Accepted: 8 July 2020 / Published: 11 July 2020

Abstract

:
The coastal zone offers among the world’s most productive and valuable ecosystems and is experiencing increasing pressure from anthropogenic impacts: human settlements, agriculture, aquaculture, trade, industrial activities, oil and gas exploitation and tourism. Earth observation has great capability to deliver valuable data at the local, regional and global scales and can support the assessment and monitoring of land- and water-related applications in coastal zones. Compared to optical satellites, cloud-cover does not limit the timeliness of data acquisition with spaceborne Synthetic Aperture Radar (SAR) sensors, which have all-weather, day and night capabilities. Hence, active radar systems demonstrate great potential for continuous mapping and monitoring of coastal regions, particularly in cloud-prone tropical and sub-tropical climates. The canopy penetration capability with long radar wavelength enables L-band SAR data to be used for coastal terrestrial environments and has been widely applied and investigated for the following geoscientific topics: mapping and monitoring of flooded vegetation and inundated areas; the retrieval of aboveground biomass; and the estimation of soil moisture. Human activities, global population growth, urban sprawl and climate change-induced impacts are leading to increased pressure on coastal ecosystems causing land degradation, deforestation and land use change. This review presents a comprehensive overview of existing research articles that apply spaceborne L-band SAR data for geoscientific analyses that are relevant for coastal land applications.

Graphical Abstract

1. Introduction

The coastal zone is a transitional zone between marine and terrestrial ecosystems, and one of the most important regions for human activities. This zone includes river deltas, coastal plains, estuaries, bays, lagoons, wetlands and mangroves, which offer rich water resources and biodiversity [1,2] and are one of the planet’s most productive and valued ecosystems [3,4]. Throughout history, the coastal zone has been a preferential region for human settlement, providing many resources and trading opportunities. More recently, rapid socio-economic development and expansion of international trade have accelerated population movements towards the urbanized centers and megacities located along the coasts of our planet [5]. Coastal habitats across the world experience strong population pressure [6,7] with half of the global population living within 100 km from the coast today [8]. Coastal regions are used for human settlement, agriculture, aquaculture, trade, industrial activities, sand mining and oil and gas exploitation as well as tourism (see Figure 1). With a growing global population, it can be expected that future development in coastal areas will be heavily threatened if human activities and exploitation will cause suitable habitats and freshwater availability to decline.
The rapid development is accompanied by social, economic and environmental challenges: urbanization [9], the development of infrastructure, industrial and tourism-related activities [10], aquaculture [11,12] and fishing and agricultural intensification [13] can lead to rapid degradation of coastal habitats and resources. As free space is becoming scarce in many coastal regions, there is increasing competition between different land uses [14,15] with growing pressure on coastal ecosystems. On the other hand, climate change-induced impacts, such as sea level rise [16], heightened frequency and severity of storm surges, coastal flooding [17,18] and salinization of soils and freshwater resources, increase the risk to humans, infrastructures and economies [19].
Satellite remote sensing enables large-scale and high-resolution mapping of the Earth’s surface and has great potential for land- and water-related applications and information derivation in the coastal zone [20,21,22]. Cloud cover limits the timeliness of data acquisition and the availability of time series data from optical satellite sensors and is a major issue in many coastal regions. The advantage of spaceborne active microwave instruments is their all-weather, day and night capabilities, and thus cloud-cover is not a limiting factor. Synthetic Aperture Radar (SAR) sensors demonstrate a potential for the continuous mapping and monitoring of coastal regions, particularly in cloud-prone tropical and sub-tropical climates [12]. Despite the limitations and the difficulties in the interpretation of radar imagery, spaceborne SAR is a valuable tool for coastal research and can provide valuable satellite imagery of large and remote areas on a regular basis.
SAR systems onboard Earth Observation satellites commonly use frequencies of the X, C- or L-band for geoscientific applications, such as topography, oceanography, glaciology, geology and forestry. An overview of the utility and capabilities of synthetic aperture radars for investigating terrestrial ecosystems such as wetlands, rivers and lakes was presented by Hall [23] and Kasischke et al. [24]. Comprehensive reviews on the current state-of-the-art regarding the use of multi-frequency (X-, C- and L-band) SAR sensors were presented by Tsyganskaya et al. [25] for the detection of flooded vegetation as well as by Mohammadimanesh et al. [26] on the use of Interferometric SAR (InSAR) for hydrological monitoring of wetlands. Spaceborne SAR sensors operating in the C-band and X-band have been widely used for studies of coastal land applications, e.g., for the analysis of coastal floods with C-band [27,28] and X-band SAR data [29,30,31] or for the monitoring of coastal wetlands with C-band [24,32,33,34,35] or X-band [35,36,37] sensors. Advanced high-resolution X-band SAR sensors, such as TerraSAR-X/Tandem-X and COnstellation of small Satellites for the Mediterranean basin Observation (COSMO)-Skymed, enable acquisition of high-resolution imagery of up to a 1 m resolution. The availability of dense SAR time series, as provided by the free and open C-band SAR data of the European Sentinel-1 mission, enables the processing and analysis of large data stacks and is particularly suitable for monitoring land cover changes.
While L-band SAR can penetrate through dense vegetation, such as forest canopies, and is commonly used for forest cover mapping, it provides a clear distinction between vegetated and non-vegetated areas. For this reason, L-band SAR is particularly useful for geoscientific research on wetland and forest change mapping. The availability of L-band SAR data from airborne sensors (e.g., German E-SAR and F-SAR, the US National Aeronautics and Space Administration (NASA)/Jet Propulsion Laboratory (JPL) AIRSAR and the Danish EMISAR) and spaceborne systems (Shuttle Imaging Radar (SIR)-C/X, Japanese Earth Resources Satellite (JERS)-1, Advanced Land Observing Satellites (ALOS)/Phased Array L-band Synthetic Aperture Radar (PALSAR)) have initiated significant research of radar remote sensing for geoscientific land applications in coastal regions. For example, L-band data have been applied and investigated for the following topics: the detection and mapping of flooded vegetation and inundated areas; the retrieval of aboveground biomass; and the estimation of soil moisture. Vegetation-related research is the most-often published subject; a lot of work has been done in the field of forestry [38,39,40,41] and wetland research [42,43,44,45,46,47,48]. In the context of coastal zone-related studies, the potential of L-band SAR data has been demonstrated for the mapping and monitoring of flooded vegetation [25,49,50], wetland extents and wetland inundation [26,51,52,53,54,55,56] and for the assessment of mangrove forests [47,57,58].
In this article, we present the first available overview on L-band SAR studies for coastal land applications. Specifically, we reviewed L-band SAR studies that are directly located in the coastal zone as well as associated studies whose research is not directly located in coastal areas but transferable to coastal environments. We focus on the coastal zone, which belongs to the most densely populated regions and is facing increased pressure from rapid human development and climate change. Nowadays the coastal zone holds the majority of the world’s population and ongoing population growth is expected to have a large impact on human development and natural resources. Therefore, the coastal zone is essential for socio-economic development in the coming decades and is most relevant for research in the context of human and environmental health. Moreover, the coastal zone represents the interface between land and the ocean, building a complex system with a high diversity of ecosystems including riverine forest wetlands, swamp forests, marshes, peatlands and agricultural areas. The objective of this review is to analyze and highlight the advantages and challenges of L-band SAR for land applications (see Figure 2) and to provide a comprehensive overview of the utility of L-band SAR for geoscientific analyses relevant to the coastal zone.

2. Characteristics of Radar Remote Sensing

Active radar (RAdio Detection and Ranging) systems use antennas to transmit and receive electromagnetic radiation (microwave energy). The transmitted pulses of energy travel towards and interact with the Earth’s surface (radar beams) and the backscattered signal from various objects is then recorded by the antenna. There are three main types of active radar systems: (1) SAR systems, (2) scatterometers and (3) altimeters. SAR systems and scatterometers have a side-looking viewing geometry, while radar altimeters are nadir-looking instruments and are mainly used to measure surface height. Radar altimeters and scatterometers are commonly applied for ocean applications to estimate wave heights and sea levels on the one hand, and speed and direction of the sea wind on the other hand. While active radar systems provide their own energy source and measure the backscattered portion from the emitted radar pulse, passive microwave sensors (microwave radiometer) record microwave radiation that is naturally emitted by the Earth’s surface [59]. Recent active imaging SAR sensors, such as the X-band operating TerraSAR-X/Tandem-X or COSMO-SkyMed sensors, offer high spatial resolution of up to 1 m and are suitable for object detection, water body mapping and monitoring of inundation and flood dynamics. In comparison, scatterometers and passive microwave systems operate generally at a coarser resolution and are mainly used to derive wind speed and direction and wave height and direction [60].
Active SAR sensors take advantage of longer wavelength signals (higher than 3 cm, see Table 1), which enables cloud-penetrating capabilities. The typical wavelengths used in optical spaceborne remote sensing range from visible (0.4 to 0.7 micrometers) to the Near InfraRed (NIR, 0.7 to 1.5 micrometers), Short Wavelength InfraRed (SWIR, 1.5 to 3 micrometers) up to Thermal InfraRed (TIR, 15 micrometers), which are short enough to be scattered by clouds and therefore its use is limited to clear-sky conditions [61]. Active SAR Imaging radar sensors take advantage of longer wavelength signals (higher than 3 cm), which enables cloud-penetrating capabilities. With their all-weather and all-time imaging capability, spaceborne SAR sensors have the advantage of operating at day and night and are able to continuously monitor the earth’s surface independently of weather conditions. The ability of SAR to penetrate cloud cover makes it particularly valuable for mapping and monitoring cloud-prone coastal regions [12]. Since long-wavelength SAR sensors also have the potential to penetrate deeper into vegetation cover and detect sub-canopy conditions, radar remote sensing can be very beneficial for the monitoring of coastal wetlands [61].

2.1. Radar Wavelength

SAR sensors commonly use either X-band, C-band or L-band (see Table 1), operating at wavelengths of around 3.0 cm (X-band) to 5.6 cm (C-band) and up to around 24 cm for L-band radars [24]. Imaging radar systems send either horizontally (H) or vertically (V) polarized electromagnetic energy and then receive one of these polarizations. There are four different polarization combinations in use: HH, HV, VH and VV.
The availability of multi-decadal radar data from various long-term SAR missions, such as the European C-band systems onboard the European Remote Sensing Satellites 1 and 2 (ERS-1/2) and Environmental Satellite Advanced Synthetic Aperture Radar (ENVISAT-ASAR) or the Japanese L-band systems Phased Array L-band Synthetic Aperture Radar (PALSAR, PALSAR-2) aboard the Advanced Land Observing Satellites (ALOS, ALOS-2), foster the use of earth observation data and products for geoscientific analyses [60]. The ALOS/PALSAR and ALOS-2/PALSAR-2 sensors have acquired data from across the globe for more than one decade and provide good historical reference [62]. The advent of advanced SAR sensors with high spatial resolution, such as the C-band RADARSAT-2, or the X-band sensors COSMO-SkyMed and TerraSAR-X/TanDEM-X (TSX/TDX) offer large possibilities for coastal applications through the advanced polarimetric and interferometric capabilities for vegetation and agriculture monitoring of these SAR systems [63]. More recently, the European Copernicus program has become increasingly important due to its value in big earth observation data processing and global-scale mapping [64], offering free and open access to its C-band SAR constellation with its systematic monitoring opportunities [12]. The current fleet of more than 10 civil imaging radar missions in orbit provides a large amount of observations in different radar frequencies and supports the capabilities of imaging radar sensors for future continuous monitoring [65].

2.2. Penetration Depth of Radar Signals: Coastal (Forested) Wetlands

The X-, C- and L-band radar signals interact differently with vegetation. In contrast to instruments operating in the shorter microwave X- and C-bands, L-band SAR sensors have the ability to penetrate dense vegetation layers and benefit from sub-canopy backscatter variations as a function of vegetation structure, soil moisture, surface roughness, and the presence or absence of standing water [67,68]. For this reason, longer wavelength SAR systems (e.g., JERS-1, ALOS/PALSAR) are able to characterize vegetation parameters, such as vertical structure [69] or biomass [70,71,72]. The higher sensitivity to surface and vertical structures is a clear advantage of L-band SAR data, which have great potential for coastal habitat research and have been used in many mangrove studies.
Figure 3 illustrates the signal penetration of different radar wavelengths for an exemplary forested wetland and shows that the interaction of radar signals with the forest canopy is determined by the SAR wavelength. With a shorter wavelength and a lower penetration, X-band and C-band radar signals are more sensitive to crown properties as well as the structure and heterogeneity of the canopy [35]. Radar waves of X-band SAR sensors scatter at the tips of tree tops, while C-band signals penetrate deeper into the vegetation volume [73]. The radar signals in the L-band wavelength generally provide greater penetration than the shorter C-band or X-band because the wavelength is longer than leaf sizes within the forest canopy [71,74]. While X-band as well as C-band signals cannot fully pass the forest canopy layer, L-band data have an increased capability to penetrate the dense vegetation layers and detect inundated surfaces [28,75,76,77] or flooded vegetation below such canopy cover [25,28,51,78,79].
Several studies proved the potential of L-band SAR sensors to detect flooded vegetation since the longer wavelengths have the capability to transmit the upper vegetation layers and interact with the smooth water surface on the ground, leading to specular reflection and/or double-bounce effects. This is particularly true for dense forests or coastal mangrove stands along coastal tropical regions where leaf-on conditions can be found all year long. For leaf-off conditions (e.g., flooded conditions for forests located in temperate climates) or sparse forests, even shorter radar wavelengths are suitable to detect flooded conditions [49,71,80,81].
The interaction of SAR wavelengths varies greatly with different vegetation types depending on the size. Therefore, the selection of a suitable SAR wavelength depends on the wetland classes, e.g., the shorter wavelengths (e.g., C- and X-bands) may be preferred for monitoring herbaceous vegetation [44] and open water mapping [65], while the longer wavelengths are more suitable for wooded wetlands because the incoming SAR signal interacts with larger trunks and branches [44,82,83].

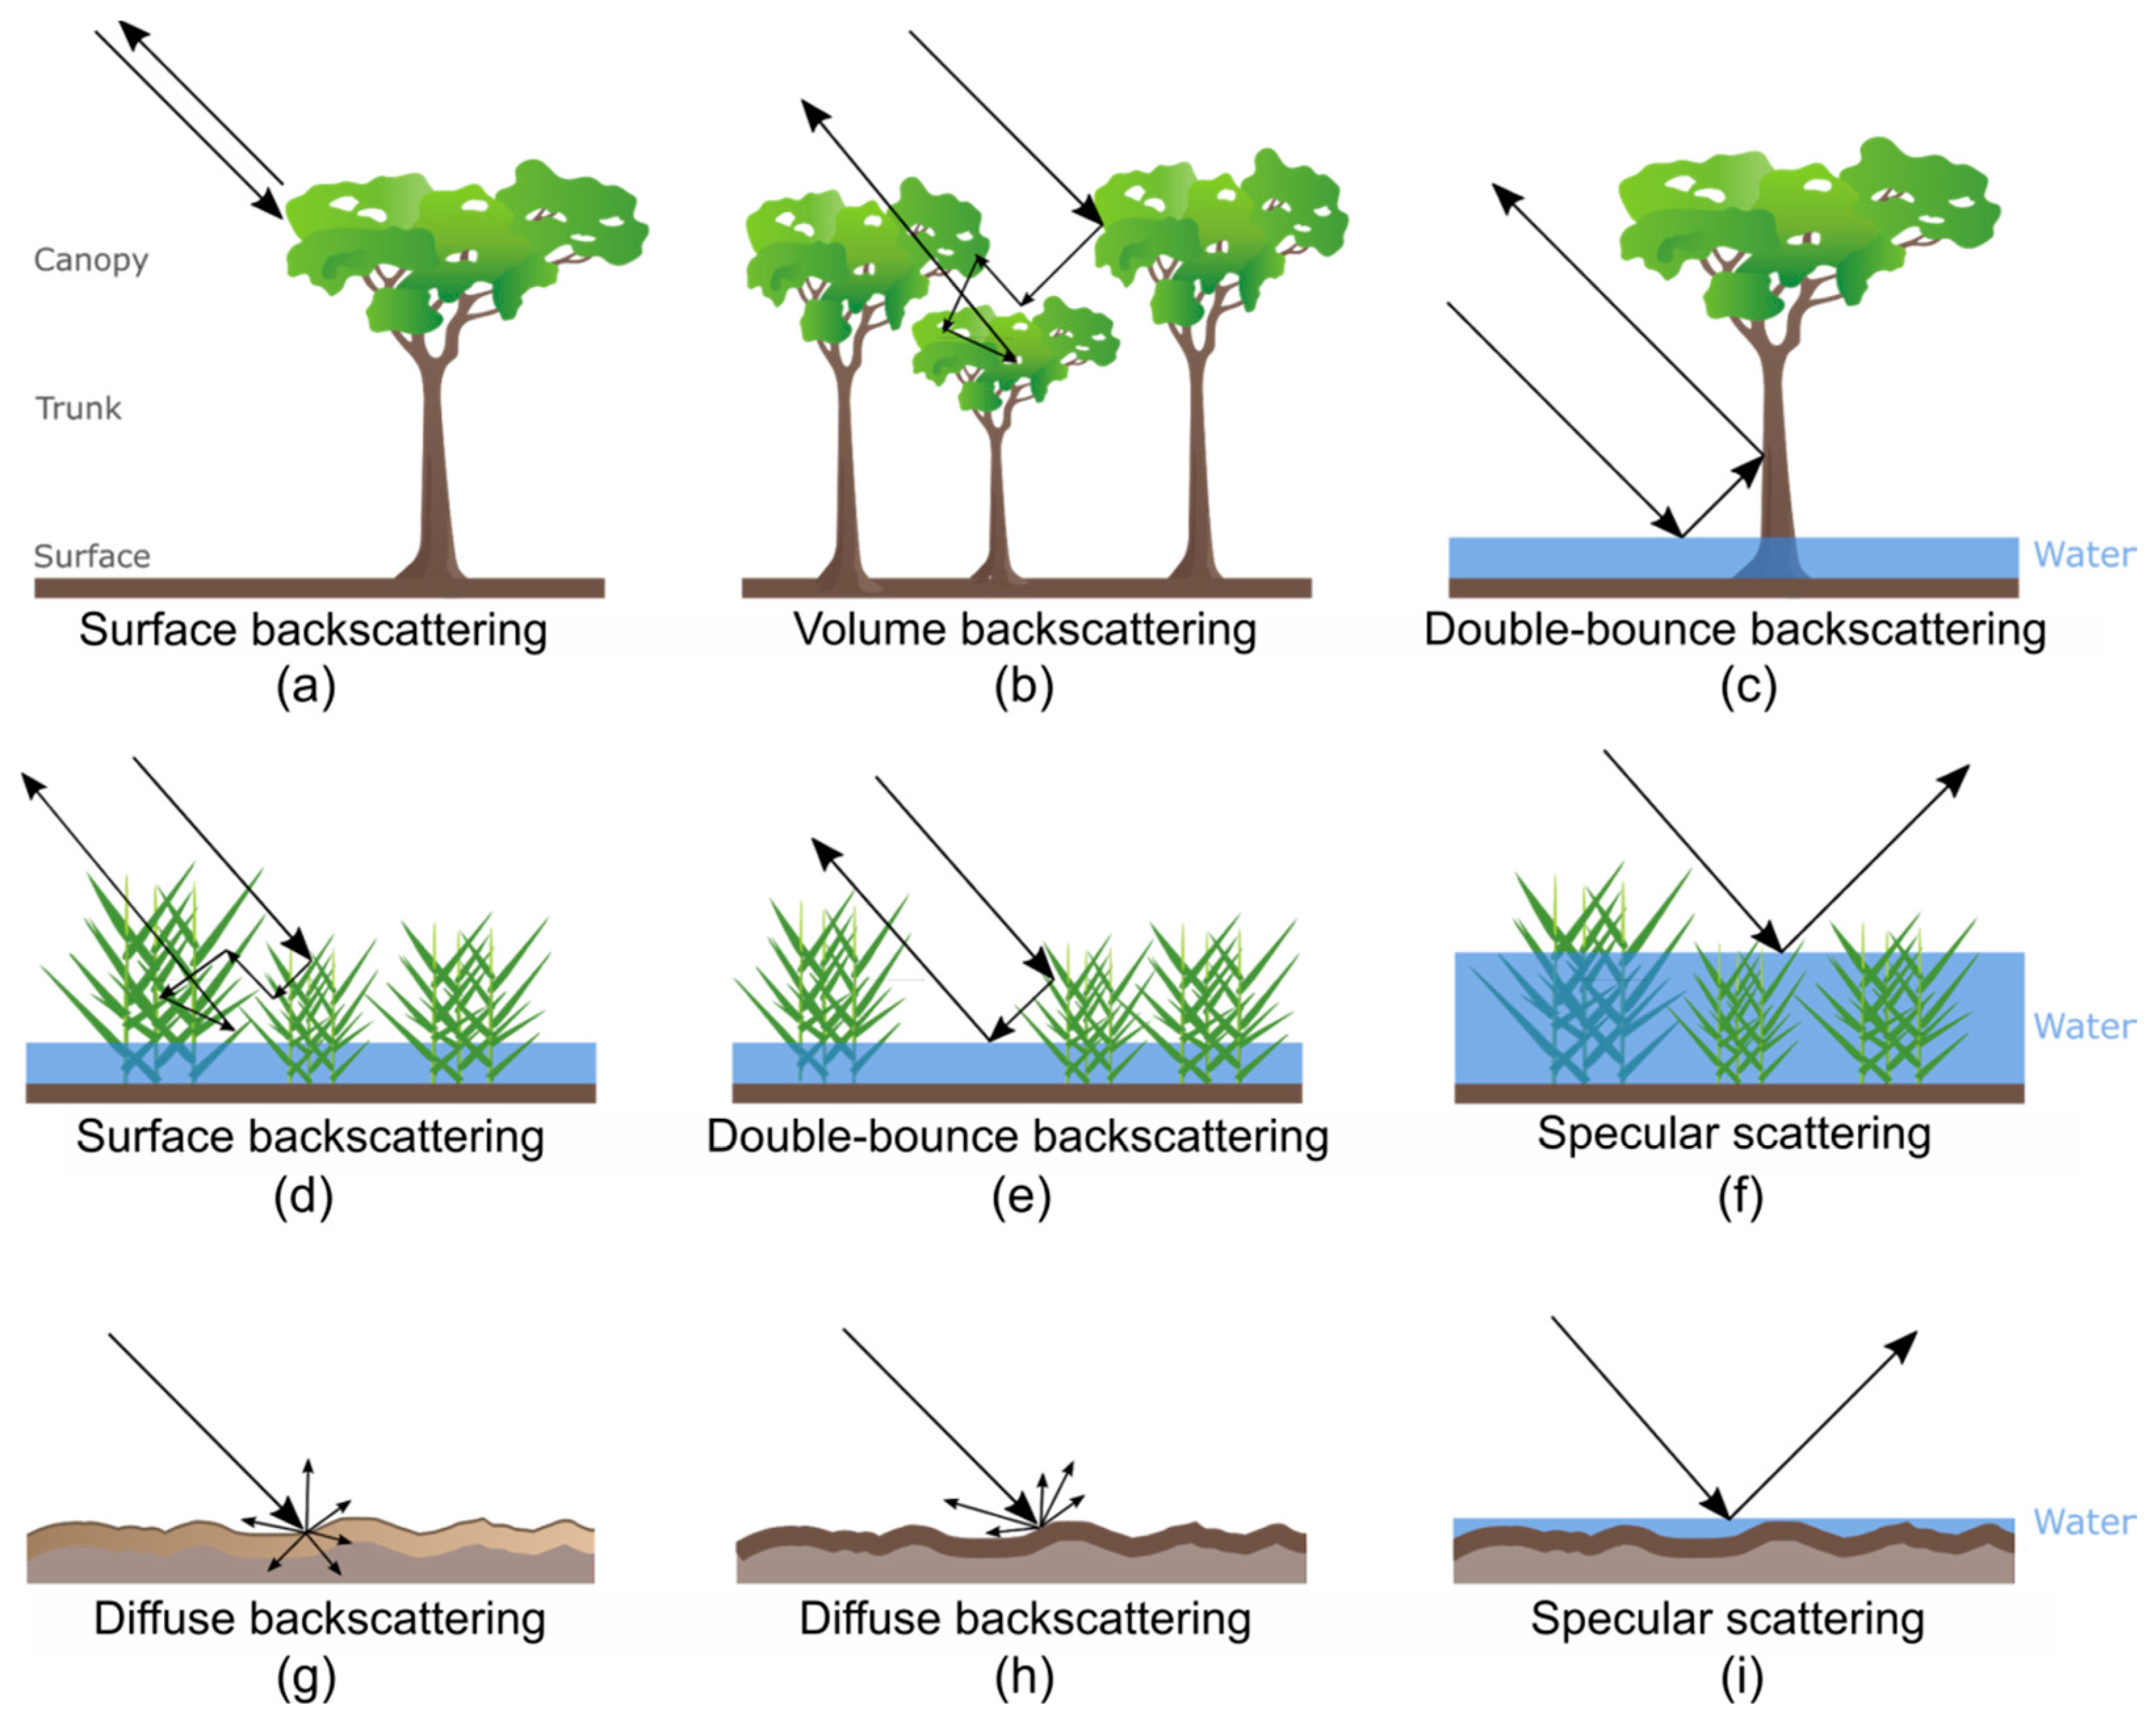
2.3. Radar Backscatter Characteristics for Different Surfaces

The sensitivity of microwave scattering to dielectric properties, surface roughness and target structure makes L-band SAR sensors an important tool to provide valuable information for a wide range of coastal applications [84], e.g., in the field of hydrology (flood/wetland mapping, soil moisture mapping), forestry (mangrove cover, forest structure), agriculture (vegetation height, crop type mapping, soil moisture) land cover or land subsidence [85,86,87]. Microwave backscatter for different surfaces under flooded and non-flooded conditions is shown in Figure 3, which addresses the main scattering types, including surface backscattering, volume backscattering and double-bounce backscattering.
The amount of energy that is reflected and scattered by a surface and thus returned to the sensor is also influenced by the wavelength and polarization of the microwave energy. Additionally, surface roughness and the dielectric constant of the targeted surface are dominant factors in determining the amount of radar backscatter. Smooth water surfaces (Figure 4i) can easily be detected by their very low backscatter signal since they act as a specular reflector and the transmitted radiation is almost completely scattered away from the sensor, resulting in a very low backscatter signal [23,61,88]. Volume scattering occurs primarily in tree crowns (Figure 4b), while surface scattering can be found on bare soil (Figure 4g,h) or the canopy (Figure 4a) dependent on leaf size, density, etc.
The presence of standing water beneath the vegetation cover (surface inundation) significantly leads to double-bounce backscattering and increases radar backscatter from forests and grasslands. Double bounce scattering occurs as soon as vegetation—grass or even trees—is flooded (Figure 4c,e) and the radar signal is reflected from the water surface and then re-directed back to the sensor by the vegetation trunk [61,88]. An increase in radar backscatter as a result of double-bounce effects between water surface and inundated tree trunks is rare in natural environments [88] and is usually reported for many wetland studies applying long wavelength SAR data. Here, L-band SAR signals are capable of penetrating the canopy of flooded vegetation (forests, grassland) down to the ground and interacting with smooth water surface and trunk geometry [44,78,89], which make a significant contribution to the total backscatter [90]. As reported by Touzi et al. [91], it is a challenging task to separate wetland forests from upland forests using shorter wavelength SAR of limited penetration capabilities within the forest canopy. L-band SAR has a potential for enhanced wetland mapping and monitoring due to its better penetration capabilities and separation of flooded and non-flooded vegetation.
For SAR data collected at long wavelengths, [80] depicted the usefulness of HH polarization for the detection of flooded forests with L-band. Rosenqvist et al. [78] reported that the use of HH (see Figure 5) and VV polarizations provides the best penetration through the vegetation canopy for L-band data, while HV and VH polarizations provide more information about the canopy structure.

3. L-Band Radar Systems

3.1. Spaceborne L-Band SAR systems

Since the late 1970s, SAR sensors have been mounted on several Earth Observation satellite missions and greatly expanded the opportunities of remote sensing for mapping and monitoring applications in the coastal zone. Figure 6 shows a timeline of SAR sensors that have been launched in the past and provide a large amount of imaging radar observations in different frequencies (see Figure 6). More than 10 civil imaging radar missions are currently in operation, such as the X-band TerraSAR-X/TanDEM-X, C-band Sentinel-1, and L-band ALOS-2/PALSAR-2, enabling weather-independent and continuous monitoring of the Earth’s surface as well as the generation of multi-frequency datasets [92]. SeaSat, which was launched in 1978, carried an L-band HH polarization SAR onboard and was the first spaceborne SAR sensor used for scientific purposes. Since then, many new SAR missions operating in the L-band, including fully polarimetric instruments, were launched and supported earth observations from space, as shown in the timeline of Figure 6. The Office of Space and Terrestrial Applications-1 and -3 (OSTA-1/OSTA-3) payloads flying on NASA Space Shuttle missions STS-2 and STS41G in the years 1981 and 1984 carried the experimental L-band SAR instruments Shuttle Imaging Radar-A (SIR-A) and Shuttle Imaging Radar-B (SIR-B). The Spaceborne Imaging Radar-C, X-Band Synthetic Aperture Radar (SIR-C/X-SAR) payload was launched on the Space Shuttle Endeavour for two ten-day missions in the spring and fall of 1994 and provided the first spaceborne, multi-frequency (L-, C- X-band) SAR datasets [92,93,94].
The increasing availability of L-band SAR imagery from spaceborne instruments, such as the Japanese Earth Resources Satellite (JERS-1) and PALSAR aboard the Japan Aerospace Exploration Agency (JAXA) ALOS satellite, enabled new opportunities for sensing sub-canopy conditions and thus the continuous monitoring and mapping of wetlands in the coastal regions [78,79]. Currently, the operational satellite-based microwave sensors of ALOS-2/PALSAR-2 and the recently launched SAOCOM-1A (Satélite Argentino de Observación Con Microondas) as part of a SAR constellation of Argentina’s space agency (CONAE) are the only operational spaceborne L-band SAR systems in orbit. As depicted in Table 2, the Japanese Space Agency (JAXA) has continuously developed longer-wavelength radar technology, with Japan being the only country for many years to fly satellites with L-band SAR instruments.

3.2. Airborne L-Band SAR Systems

Airborne SAR systems offer significant advantages compared to spaceborne SAR, including the capability of targeted deployment to a specific area of rapid and short-time repeat imaging [96]. However, monitoring large-scale areas with airborne SAR systems is not feasible since airborne sensors remain limited to local and regional aspects [97]. A comprehensive review about the abilities of very high-resolution airborne SAR technology and its applications is given by Reigber et al. [97].
Various airborne Synthetic Aperture Radar (SAR) systems operating in the L-band have been developed, such as the fully polarimetric Danish EMISAR system, the E-SAR [98] and F-SAR systems by the German Aerospace Center (DLR), the polarimetric L-band Imaging SAR (PLIS) system, AIRSAR, and UAVSAR system, the French SETHI system by the Office National d’Etudes et de Recherches Aérospatiales (ONERA), the Japan Aerospace Exploration Agency’s (JAXA) Polarimetric and Interferometric Pi-SAR-L2 and PiSAR systems or the US NASA’s Passive and Active L- and S-band (PALS) system and UAVSAR system. Unmanned Aerial Vehicles (UAVs) can also be equipped with SAR systems, offering operational flexibility through rapid and frequent visit capabilities of remote areas of interest. Small drones have become very popular and widely used for many applications in recent years and thus hold potential for radar imaging and environmental monitoring [99]. With drones being capable of carrying more volume and mass, they could provide an interesting cost-effective alternative to aircraft.
Using airborne L-band SAR, various studies have been conducted in coastal applications, showing the high potential of L-band measurements for the investigations of waterline mapping in flooded vegetation [100], inferring surface currents [101], vegetation water content [102] and water level change [103] within wetland areas, and discrimination and mapping of coastal wetlands [104,105,106,107].

3.3. Spaceborne Passive Microwave Sensors

The development of spaceborne missions with passive L-band microwave instruments is primarily driven by the objective to provide continuous and global mapping of surface soil moisture [108,109,110,111,112,113]. Launched in 2009, the European Space Agency (ESA) Soil Moisture and Ocean Salinity (SMOS) satellite was the first L-band radiometer mission, followed by the joined American–Argentinean (NASA, CONAE) Aquarius/Satélite de Aplicaciones Científicas (SAC)-D mission in 2011, and the NASA Soil Moisture Active Passive (SMAP) satellite launched in 2015 [114].

4. Review of Studies Using Spaceborne L-Band SAR Data for Geoscientific Analyses

In this section, we first provide a broad overview of the literature search. Secondly, we evaluate the used L-band sensor systems of the reviewed research articles and the synergetic use of the respective L-band sensors with multispectral optical sensor systems as well as with other C- and X-band SAR systems. Afterwards, we provide a more detailed review of the identified research foci, presenting key results and findings of the reviewed studies.

4.1. Methodology

We located all available research articles investigating geoscientific analyses of coastal land surface and surface water parameters using primarily spaceborne L-band SAR data. In general, the terms “coastal regions”, “coastal areas” and “coastal zone” are not always provided with the keywords or the title or abstract descriptions of the reviewed articles. A simplified literature search on the subject “L-band SAR in coastal areas” would exclude many relevant L-band studies, since these did either not list the keywords “coast” or the study region may not be explicitly described as a coastal region. In addition, there are studies using L-band sensor data that are not classified as a coastal region but their application foci may also be relevant to the geoscientific research question in the coastal zone. Therefore, the selection of research articles in this review is based on L-band studies that focus on environmental research in the field of forestry, wetland, and inundation in coastal regions. A literature search was conducted based on the bibliographic databases of Web of Science, Scopus and Google Scholar, including research articles published between 1994 and end of the first quarter of 2020. For the literature search we used the keywords “L-band”, “SAR”, “wetland”, “flooded vegetation” and “vegetation” in the following keyword combinations: “wetland, L-band, SAR”, “SAR, flooded vegetation”, “SAR, flood, L-band” and “SAR, L-band, vegetation”. This search query resulted in more than 350 research articles. It must be noted that this review focused primarily on studies utilizing spaceborne active L-band SAR acquisitions. Hence, we reduced the number of research articles by pre-selection, limiting the reviewed articles to spaceborne imaging SAR sensors, since passive microwave sensors (e.g., Aquarius, SMAP, and other) and airborne L-band SAR sensors were not considered for this review. The remaining 202 studies were analyzed to extract relevant information for this review, such as the research focus parameters, employed L-band sensor, synergistic use of L-band SAR with optical systems and synergetic use of L-band SAR with shorter wavelength X- and C-band SAR sensors.

4.2. Employed L-Band Sensors in Reviewed Research Articles

Regarding the satellite sensors used in all the reviewed L-band studies, it was found that ALOS/PALSAR data were used most frequently (see Figure 7). Specifically, 67% of all studies relied on ALOS/PALSAR imagery, 15% of all studies applied JERS-1, 9% used ALOS-2/PALSAR-2 and 8% used SIR-C/X SAR data.
L-band SAR data are often combined with optical data (see Figure 8), in particular with multispectral data of the sensors onboard the Landsat fleet: Thematic Mapper (TM, Landsat-4/5), Enhanced Thematic Mapper (ETM, Landsat-7) and the Operational Land Imager (OLI, Landsat-8). Other optical sensors that were used in combination—especially with ALOS/PALSAR—were the Moderate Resolution Imaging Spectroradiometer (MODIS), Satellite Pour l’Observation de la Terre (SPOT-4/5), IKONOS, Rapideye, the Advanced Visible and Near Infrared Radiometer type 2 (AVNIR-2) sensor, Formosat-2 and Advanced Spaceborne Thermal Emission and Reflection Radiometer (ASTER).
We identified that 35 of all reviewed studies applied L-band SAR data in synergetic use with C-band (74%) and X-band (26%) SAR systems (see Figure 9). Two-thirds of the synergetic SAR studies used ALOS/PALSAR, most frequently in combination with C-band SAR data from the Canadian RADARSAT-1/2 (45%) and the German TerraSAR-X/TanDEM-X (20%) satellites.

4.3. Review of Research Foci

Regarding this review’s focus on geoscientific coastal land applications, we categorized all research articles into research foci. The categories “non-tidal wetlands” and “tidal wetlands” as sub-categories of wetlands were studied in almost one third of the reviewed investigations. Within this category, the main research focus was on mapping flooded vegetation and water level dynamics. Following this, forest and woodland were studied in one fourth (25%) of all investigations (Figure 10). The research foci “inundation/flooding” were studied in almost 10% of all reviewed articles. These studies primarily focused on surface water extent mapping as well as on the quantification of coastal flooding and inundation dynamics. Studies associated with the research foci “soil moisture”, “agriculture” and “land cover” amounted to a share of 7.5%, 6% and 6%, respectively.

4.3.1. Biosphere/Hydrosphere: Wetlands

During the literature review, we found that 35% (69) of all reviewed articles were used for analyzing wetlands. Wetlands represent one of the world’s most important ecosystems [115], providing valuable natural resources and ecosystem services such as flood control, water purification and food supply [116]. With an estimated carbon storage capacity of 12%, wetland ecosystems also play an important role in the global climate [117]. Located at the land–sea interface, coastal wetlands, such as mangrove forests or salt marshes, are among the most productive and carbon-rich ecosystems. Coastal wetlands are at risk from a variety of threats as they are highly exposed to climate change-induced impacts, such as sea level rise [118], increased storm surge frequency [119,120,121] and saline intrusion [122], which threaten wetlands. This can be observed especially in wide low-topography coastal plains, where the influence of the rising sea level on wetland vegetation communities is strictly controlled by tidal hydroperiods [123]. Human activities, such as draining wetlands for the conversion to agriculture [13] and aquaculture [12] (e.g., rice and shrimp farming in Southeast Asia) or building construction, causes destruction or degradation of wetlands around the globe [115]. The assessment of the extent of wetlands is of great importance for the quantification of environmental change in the coastal zone. Earth observation-derived spatio-temporal information on regional wetland extents and dynamics is baseline information for decision-makers and support coastal management. Davidson et al. [51] reviewed estimates of global and regional wetland area from global mapping and remote sensing and pointed to the improved availability of spaceborne sensing and canopy penetration capabilities with long wavelength L-band SAR instruments for the detection of wetlands and flooded vegetation, although mapping the variety of wetland types at the global scale using such SAR data has yet to be accomplished.
In general, wetlands are ecosystems that are either permanently or temporarily flooded and include swamps, mangroves and other coastal communities. The delimitation and definition of wetlands is challenging and widely discussed and led to the development of different national and regional wetland classifications. Although a universal definition of wetland does not exist, the Ramsar Convention on Wetlands developed a definition for international purposes. The majority of the wetland-related studies of our reviewed articles focused on mapping of wetland areas, flooded vegetation, investigations of wetland inundation, and water level variations in wetlands. For this reason we classified wetlands according to the United States Environmental Protection Agency (EPA) into two general categories: (1) coastal or tidal wetlands and (2) inland or non-tidal wetlands.

Non-Tidal Wetlands

We found that more than half of the non-tidal wetland studies (55%) were conducted for the mapping of flooded vegetation. Riverine floodplains have important ecological functions for water storage, biodiversity, and agricultural use [124]. Mapping spatial and temporal patterns of floodplain vegetation as well as monitoring seasonal dynamics of vegetation in large river systems is an important task. Here, the Amazon floodplain is one of the most intensively investigated regions, for example in a study by Forsberg et al. [125] who used a mosaic of JERS-1 L-band SAR images to investigate the influence of tectonic faults on wetland distributions in central Amazon lowland. A large-scale analysis on wetland extent for a study area of more than 1.7 million square kilometers of the Central Amazon Basin was performed by Hess et al. [126]. In their study they presented a dual-season mapping of wetland inundation and vegetation under both low-water and high-water conditions at a 100-m resolution for the Central Amazon Basin using mosaics of HH-polarized L-band JERS-1 SAR images that were taken as part of the Global Rain Forest Mapping (GRFM) project. In another approach, spatial analyses on vegetation distribution and flood dynamics in the Amazon floodplain was performed by [127] using multi-temporal JERS-1 SAR data. Further on, Costa [128] used C-band RADARSAT and L-band JERS-1 data to map zonation of vegetation communities in the Amazon floodplain. Costa’s analysis showed that the backscatter values of both the C- and L-band data were lowest in periods of minimal water level, and secondly, JERS-1 data showed a larger dynamic range of backscatter in response to the ground cover. In addition, vegetation structure and inundation patterns derived from ALOS/PALSAR were combined to characterize major vegetation types in the Central Amazon floodplain [129]. In another study, Sartori et al. [130] extracted polarimetric radar attributes from fully polarimetric ALOS/PALSAR data to discriminate aquatic plants in the Amazon floodplain wetlands, and applied a rule-based classification to map macrophyte species with an overall accuracy of 0.87 [130]. An object-based image analysis and decision tree classification for the mapping of vegetation in a late Quaternary landform in the Amazonian wetlands was performed by Cordeiro and Rossetti [131]. In South America, L-band studies were also carried out by Evans et al. [132], Evans and Costa [133], and Evans et al. [134] who performed object-based image analysis using dual season and dual polarization L-band ALOS/PALSAR and C-band RADARSAT-2 data to map ecosystems of the Brazilian Pantanal wetlands showing the spatial distribution of terrestrial and aquatic habitats.
In Africa, an analysis by Simard et al. [45] used the JERS-1 Global Rain Forest Mapping (GRFM) and ERS-1 Central Africa Mosaic Project (CAMP) datasets to map tropical coastal vegetation at the west coast of Gabon using a decision tree classifier. They found that the combined use of L-band and C-band SAR datasets improved the overall classification results by 18% compared to single-band classification. For a wetland area in the Congo Basin, Betbeder et al. [135] characterized land cover patterns based on multi-sensor. In their study, land cover types were delineated with phenological differences derived from a MODIS Enhanced Vegetation Index (EVI) time series while L-band PALSAR imagery was used to map flooded areas in the Congo Basin during different seasons. Rebelo [136] combined multi-temporal L-band ALOS/PALSAR datasets with Landsat TM and Advanced Spaceborne Thermal Emission and Reflection Radiometer (ASTER) images, digital elevation models, and vegetation species data to provide information on wetland ecology and hydrology for two inland wetland sites in Malawi and Mozambique. In this study, a hybrid classification approach with decision tree and principal components analysis was performed to depict the spatial distribution of vegetation species and wetland dynamics with more than 80% accuracy.
The potential of imaging radar for mapping and monitoring wetland extent and inundation pattern in sub-tropical regions has been shown by Kim et al. [43], who analyzed coherence variations for various wetland vegetation types in Southern Florida, including sawgrass and mangrove marsh. They used JERS-1, ERS-1/2, ENVISAT-ASAR and RADARSAT-1 data to investigate the effect of acquisition parameters and temporal baseline, and their results suggested that the correlation between coherence and the backscatter coefficient over wetlands is best obtained with HH-polarized L-band data. Mitchell et al. [52] used a sequence of ALOS/PALSAR and TerraSAR-X images to capture wetlands in dry, wet and transitional phases for a marsh nature reserve in New South Wales, Australia. They concluded that the presence of surface water and high soil moisture content could be detected with L-band time series data and improved the discrimination of wetland composition.
In the temperate latitudes, several studies using L-band SAR for mapping and monitoring wetlands were conducted in North America. Here, Bourgeau-Chavez et al. [137] evaluated the utility of NASA’s Shuttle Imaging Radar-C (SIR-C) sensor for wetland mapping for a riparian wetland ecosystems along a river that exist in the southeastern United States. They used a combination of fully polarimetric L- and C-band data and determined that L-band HV polarized data were best for discriminating woody from herbaceous vegetation, whereas it was concluded that L-band HH was more suitable to discriminate forested wetland from upland. In a study by Bourgeau-Chavez et al. [138], multi-season and multi-year HH and HV polarized ALOS/PALSAR data were used to map the distribution of Phragmites stands along the US coast of the Great Lakes and achieved basin-wide accuracy of 87%. In Europe, Koch et al. [139] evaluated the contributions of C-band RADARSAT-2 and L-band ALOS/PALSAR full polarimetric SAR data. They characterized and mapped wetland conditions in a semi-arid environment in Central Spain and pointed to the potential of L-band data for determining wetness conditions of the ground surface in areas covered by vegetation. Dabrowska-Zielinska et al. [140] utilized ALOS/PALSAR HV polarized data supplemented by optical data to monitor a wetland ecosystem in Northeast Poland. Furthermore, Fu et al. [141] used multi-source satellite data, acquired by the optical Gaofen-1 (GF-1), L-band ALOS/PALSAR and C-band RADARSAT-2 sensors, to examine the performance of object-based and pixel-based random forest algorithms for mapping wetland vegetation for an alluvial plain in China. They found that the synergistic use of all feature types extracted from optical and SAR data improved the overall accuracy to over 89%.
In the northern latitudes, mapping vegetated wetlands has been performed by Whitcomb et al. [142], who produced a thematic map of wetlands throughout Alaska employing JERS-1 SAR satellite imagery. Another study used multi-temporal SAR data acquired by the L-band ALOS/PALSAR, C-band RADARSAT-2, and X-band TerraSAR-X sensors to determine the influence of SAR frequency, polarization and temporal baselines on the coherence of various wetland classes for a study site in Canada [44]. They achieved an overall classification accuracy of 74% through the synergistic use of SAR backscatter and interferometric coherence and found that L-band intensity and X-band coherence observations had the best discrimination capabilities for identifying wetland classes.
Wetlands located in upland and mountainous areas, which can also be within the coastal zone, play an important role in the hydrology of basin areas, e.g., by regulating river flows. Pistolesi et al. [143] tested the effectiveness of single- and dual-season dual-polarization L-band ALOS/PALSAR data and National Wetlands Inventory ground reference data for classifying swamp forest wetlands in the Hudson Highlands, US, and indicated that dual-season imagery produced the highest overall accuracy for forested wetlands. In another study on deciduous forested swamp mapping using ALOS/PALSAR data for a nature reserve in the Changbai Mountain region in China, [144] concluded that L-band HH polarization in the leaf-off season was the best choice for detecting hydrological characteristics under the forest canopy.
The water level in wetlands is an important ecological variable for the quantification of water storage. Moreover, the range and frequency of water level fluctuations have an effect on plant growth in wetlands [145]. In an earlier study, Alsdorf et al. [50] used interferometric SAR data taken by the SIR-C instruments aboard the Space Shuttle imaging radar mission over the Central Amazon to measure subtle water level changes in a flood plain area. Similarly, Wdowinski et al. [146] analyzed surface water level changes in the Everglades wetlands, US, from JERS-1 L-band SAR interferometry. In a further study on the Everglades, Kim et al. [53] combined ALOS/PALSAR L-band and RADARSAT-1 C-band data with daily mean water heights to compare SAR backscatter coefficients and water levels. Their study revealed that L-band SAR backscatter coefficients were closely related to water level in freshwater marshes, whereas C-band radar does not produce a reasonable relationship with the fluctuation of water level. Moreover, Hong and Wdowinski [42] presented an improved Interferometric Synthetic Aperture Radar (InSAR) technique for wetlands, which uses multitrack SAR data and ground-based water level data to generate a time series of water level maps with high spatial resolution. In relation to this, Mohammadimanesh et al. [26] provided a comprehensive review on wetland water level monitoring using InSAR. In this context, most articles used ALOS/PALSAR data for the detection of water level changes for wetland areas. For example, InSAR was used for wetlands in the Helmand River Basin [147], and the Differential Synthetic Aperture Radar Interferometry (DInSAR) technique applied for a hydrographical unit of the Danube Delta [55]. Xie et al. [56] used HH polarization L-band PALSAR SAR data in conjunction with synchronous field measurements to detect water level changes for different wetland types in the Yellow River Delta, China. In addition to this, Yuan et al. [148] analyzed the relation between L-band ALOS/PALSAR data and seasonal water level changes obtained from ENVISAT altimetry for a wetland in the Congo Basin and found that denser vegetation canopies were less sensitive to variations in relation to the water level changes. Additionally, Kim et al. [54] estimated spatio-temporal water level variations in the Congo River mainstem covered with aquatic plants using ALOS/PALSAR ScanSAR images and water level data from altimetry data. Furthermore, Zhu et al. [149] investigated the extraction of archaeological water cultivation information in Honghe National Nature Reserve, Northeast China with L-band ALOS/PALSAR data and an X-band TSX/TDX-generated Digital Elevation Model (DEM).

Tidal Wetlands

Tidal wetlands, such as salt marshes and mangroves, provide valuable ecosystem services [150] but are increasingly threatened by coastal squeeze as a result of accelerating sea-level rise and land development [151,152]. Mangrove ecosystems dominate the coastal wetlands of tropical and subtropical regions throughout the world [2], play an important role in coastal erosion protection and provide various ecological and economical ecosystem services [153]. Losses of more than 50% of mangrove habitats are reported for some regions in the world [154,155] as a result of emerging population pressure and economic development in the coastal zone [156]. The continued decline of mangrove forests can be largely attributed to the conversion to agriculture, aquaculture, tourism and urban development [7].
In an earlier study, textural classification analysis with SIR-C data by Pasqualini et al. [157] revealed that low cross-polarized low frequency (VH L-band) performed best for the mapping of mangroves and other tropical plant formations for a coastal marsh in Northwestern Madagascar. A review on recent advancements in remote-sensed data and techniques for large-scale monitoring of mangroves was given by Heumann [158], who also pointed to future opportunities for data fusion. In this context, Lucas et al. [159] presented an overview of L-band SAR for mangrove assessment. They evaluated L-band capability for mangrove applications, applying airborne SAR and spaceborne JERS-1 SAR, and indicated that mapping is most effective where differences in structure, as a function of species, growth stage and biomass distributions occur between zones. Further on, Rocha de Souza Pereira et al. [47] mapped mangrove forests on the southern coast of São Paulo State in Brazil using frequency-based contextual classification of multi-polarized ALOS/PALSAR data and obtained best results applying incoherent attributes and SAR vegetation indices. Moreover, we identified studies conducted for Guinea, West Africa [160] and Brazil [161] that dealt with the mapping of mangroves with ALOS/PALSAR data with object-based image analysis. Furthermore, Cornforth et al. [162] quantified coastline retreat as a result of a cyclone event and anthropogenic degradation in the Sundarbans mangrove forest using L-band ALOS/PALSAR data. For another major mangrove region, Pham et al. [163] assessed the spatial distribution of mangrove species and their changes from 2010 to 2015 in Hai Phong City, Vietnam, using the ALOS/PALSAR. In the same region, Pham and Yoshino [164] examined the potential of HH and HV backscatter from the ALOS-2/PALSAR-2 sensor in high sensitive mode to estimate the aboveground biomass of mangrove species in Hai Phong City, Vietnam. With a more global focus, Thomas et al. [165] used time-series JERS-1 and ALOS/PALSAR data to analyze drivers of mangrove forest change across the tropics for the period of 1996–2010. They manually interpreted multi-temporal radar mosaics to interpret for evidence of loss and gain in forest extent and its associated driver. Similarly to the aforementioned study, Thomas et al. [57] presented an approach to monitor mangrove extents using time-series data from JERS-1 SAR and ALOS/PALSAR sensors at nine locations around the world where common change mechanisms are linked to natural and anthropogenic events and processes.
Studies on reed marshes were made by Zhang et al. [166], who used multi-temporal ALOS/PALSAR data to monitor hydrological conditions beneath reed marshes based on a statistical analysis of the coherence distributions for reed marshes under wet and dry conditions using interferometric SAR. In their study, they showed that L-band interferometric coherence is very sensitive to the subsurface conditions of wetlands. Here, Zhang et al. [83] analyzed backscattering characteristics and interferometric fringes for reed marshes and rice fields using multi-mode VV-polarized C-band ASAR and HH-polarized L-band ALOS/PALSAR data for the estuary of the Liaohe River in Northeast China. For the same region, Zhang et al. [167] modeled temporal variations in microwave backscattering from C- and L-band frequencies for reed marshes.

4.3.2. Hydrosphere: Inundation/Flooding

The unique observing capability as a result of the penetration of longer SAR wavelengths enables L-band satellite radar to observe seasonal dynamics of flooding and inundation. This advantage is evident for areas that are permanently or temporarily covered by dense vegetation where microwaves of L-band SAR penetrate the canopy layer, with the result that inundated areas and flooding conditions can be observed from space. A comprehensive review of existing principles and methods for inundation mapping using SAR data was given by Shen et al. [76]. As one of the first studies, Hess et al. [168] applied a decision-tree model for a supervised classification to delineate floodplain inundation along the Negro and Amazon rivers in Brazil using multi-frequency, polarimetric SAR data from the SIR-C/X mission. They concluded that HH polarization was most suitable to distinguish flooded from non-flooded vegetation while cross-polarized L-band data allowed better separation between woody and non-woody vegetation. Multi-frequency SIR-C/X-SAR sensor data have also been applied to monitor spatial and temporal patterns of floodplain inundation over wetlands of the Yucatan Peninsula [169] and Australia [170]. A large-scale analysis of inundation dynamics was performed in the Amazon Basin in a study by Rosenqvist et al. [171], who employed time series of JERS-1 imagery to model CH4 emissions. To this aim, they utilized SAR-derived areal flood extent and linked it with daily in situ measurements of river stages to extrapolate non-spatial CH4 fluxes and model regional estimates of CH4 emissions. In another study by Hess et al. [126], inundation extent was mapped for the Central Amazon Basin, producing the first high-resolution wetlands map for the region. Monitoring flood dynamics has also been carried out with ALOS/PALSAR in studies for a wetland in the Brazilian Pantanal (Evans et al. [134]) and for coastal marshes within in the Gulf of Mexico (Ramsey et al. [77]). Furthermore, multi-temporal inundation maps derived from ALOS/PALSAR were applied for flood area detection for case studies in Indonesia (Yulianto et al. [172]), India (Manavalan et al. [173]), and Sri Lanka (Alahacoon et al. [174]). Incorporating multi-source and multi-frequency SAR, Ramsey et al. [17] mapped storm surge flooding and marsh response throughout the coastal wetlands of Louisiana before and after two Hurricane events in 2008, applying ENVISAT-ASAR C-band and ALOS/PALSAR L-band SAR data. On the one hand, they found that only L-band SAR enabled consistent subcanopy detection; on the other hand, the mapping performance of coastal marsh inundation was higher with PALSAR than with C-band ASAR data. In another study, Ward et al. [175] used classification tree modeling to combine ALOS L-band SAR and optical Landsat TM satellite data with field measurements to predict the seasonal and inter-annual vegetation and inundation dynamics in a floodplain in northern Australia. Moreover, Martinis and Rieke [81] used multi-temporal and multi-frequency SAR data and performed backscatter analysis of various semantic classes data to investigate the backscatter behavior of various semantic classes in the context of flood mapping. They used a time series of TerraSAR-X data supplemented by ALOS/PALSAR and RADARSAT-2 data, and evaluated backscatter variations between flood and normal water level conditions using different radar wavelengths.

4.3.3. Biosphere: Forest/Woodland

According to our analysis, forests and woodlands were investigated in 25% of all reviewed articles. The main investigated study fields included classification and mapping of forests, monitoring deforestation, estimation of forest structure, and estimation of aboveground biomass. The majority of the reviewed forest-related articles investigated classification and mapping approaches. Here, De Grandi et al. [176] presented results of the generation of wide-area radar mosaics for the tropical African rain forest from raw JERS-1 L-band SAR data as part of the processing phase of the international and Global Rain Forest Mapping Project (GRFM) managed by the National Space Development Agency of Japan (NASDA). In a further study, Simard et al. [177] used a decision tree algorithm to classify tropical vegetation based on GRFM JERS-1 SAR mosaics and multiscale texture measures. Kobayashi et al. [178] investigated the potential of combined microwave and optical information for revealing the forest stand characteristics. For this purpose, they analyzed L-band SAR backscattering characteristics coming from industrial fast-growing tree plantations in Sumatra, Indonesia using an integrated analysis of SAR and optical data acquired by the ALOS instruments PALSAR and AVNIR-2. They found that the cross-polarization component of the L-band SAR backscatter over acacia planted forests is characterized by higher correlation with the forest stand characteristics than the co-polarizations. Vaglio Laurin et al. [40] integrated the optical sensors Landsat TM and the ALOS/AVNIR-2 with the ALOS/PALSAR sensor in order to classify tropical fragmented landscapes and moist forested areas using maximum likelihood and neural networks classifiers. Accordingly, they identified that the integration of SAR and optical data produced the best overall classification accuracies using both classifiers. In addition, several studies classified woody vegetation with L-band ALOS/PALSAR data. For example, Garg and Singh [179] developed an efficient contextual algorithm to improve the segregation of tall vegetation and urban land cover classes using fully polarimetric ALOS/PALSAR SAR data. L-band SAR data were also applied in a study by Müller et al. [180] on support vector machine classification of woody patches in New Zealand. They achieved best classification results by combining cross-polarized (HV) ALOS/PALSAR in combination with the optical SPOT-5 shortwave infrared band. In comparison, Watanabe et al. [181] examined temporal variations in L-band backscatter and their correlation with precipitation for several trees in Japan. They used ten sets of ALOS/PALSAR data over four years to examine temporal variations and found that the functional relation of aboveground biomass and backscatter were dependent on precipitation. Moreover, Cremon et al. [39] employed a decision tree classifier to map forest and open vegetation over a residual megafan located in a wetland area in the Amazonian lowland based on the integration of optical Landsat TM and ALOS/PALSAR SAR data, and indicated that the vegetation distribution highlights a morphology attributed to a previously developed Quaternary megafan. At a global level, Shimada et al. [182] generated forest/non-forest maps based on annual mosaics derived from ALOS/PALSAR HH and HV polarization data at a 25-m spatial resolution for the years 2007 to 2010. Based on these data, Wilhelm et al. [41] presented an application-oriented approach to derive aboveground growing stock volume maps using the annual ALOS/PALSAR backscatter mosaics. In a further study, Qin et al. [183] developed an algorithm to map forests in monsoon Asia, with the use of structure and biomass information from the ALOS/PALSAR mosaic dataset and phenological information derived from the MODIS products MOD13Q1 and MOD09A1. Furthermore, Chen et al. [184] combined images from L-band SAR ALOS/PALSAR and ALOS-2/PALSAR-2 and optical Landsat TM/ETM+/OLI images to identify tropical forest dynamics on Hainan Island, China. They identified that high biomass crops, such as sugarcane and banana plantations, have similar HV backscatter coefficients to forests. Applications of L-band SAR data to map deforestation were found in studies on tropical deforestation in Indonesia [185], India [186] and Cambodia [187]. Mermoz and Le Toan [188] monitored forest disturbances and regrowth between 2007 and 2010 in Southeast Asia using L-band ALOS/PALSAR mosaic data.
The potential of L-band SAR data for assessing vegetation structure has been shown by Fransson [189] in a study on stem volume estimation in boreal forests using C-band ERS-1 and JERS-1 L-band SAR data. According to their findings, L-band SAR data show higher sensitivity to stem volumes than the C-band of ERS-1, resulting in larger backscatter contrast between nonforested areas and dense tree cover. Townsend [71] evaluated the potential of co-polarized SAR data for estimating forest structure in wetlands. In this study, multi-temporal RADARSAT, ERS-1, and JERS-1 images were employed to measure biophysical properties of forested wetlands in a coastal river floodplain in North Carolina, US. The results indicated that forest properties were more accurately estimated in flooded areas, where standing water minimizes the variations in surface conditions. Further on, Zhang et al. [190] introduced an innovative radiometric terrain correction algorithm using PolInSAR imagery from L-band ALOS/PALSAR, C-band RADARSAT-2 and BioSAR 2007 datasets for improving forest vertical structure parameter estimation. In addition, Joshi et al. [191] quantified the effect of biophysical forest structures on radar backscatter by relating L-band ALOS/PALSAR HV backscatter and LiDAR-derived vegetation cover, height and aboveground biomass over Denmark. A machine-learning approach for vegetation height estimation in Mexican tropical deciduous and evergreen forests was shown by Urbazaev et al. [192], who used dual-polarized ALOS-2/PALSAR-2 ScanSAR imagery. Studies of texture analyses over forests using spaceborne L-band sensors have been conducted by Miranda et al. [193], who classified JERS-1 SAR data from the rainforest-covered area of the Uaupés River (Brazil) using a semivariogram textural classifier. Another study by Rakwatin et al. [194] used first- and second-order texture features from ALOS/PALSAR to map tropical forests. Furthermore, Middinti et al. [195] proposed an approach for forest type classification with a support vector machine (SVM) classifier using ALOS/PALSAR full polarimetric data and achieved the highest accuracy by incorporating various polarimetric decompositions features and gray-level co-occurrence matrix textures.
Biomass is one of the most important biophysical parameter and it is attracting increasing interest in climate change research. Forest aboveground biomass estimations from L-band SAR were obtained at the regional scale with ALOS/PALSAR by Cartus et al. [196], Michelakis et al. [197], Mitchard et al. [198], Suzuki et al. [199], Hamdan et al. [200], Basuki et al. [201] and Peregon and Yamagata [202]. Tanase et al. [203] investigated the effectiveness of frequently used parametric and nonparametric models for biomass retrieval from ALOS/PALSAR L-band radar backscatter for two areas in Spain and Australia. Luckman et al. [204] described the development of a semi-empirical model for the retrieval of aboveground biomass density of regenerating tropical forests using the JERS-1 Synthetic Aperture Radar (SAR) for two test sites in Brazil. Moreover, Bispo et al. [205] generated a predictive model to estimate forest biomass in central Amazonia. They used incoherent target scattering decomposition polarimetric attributes extracted from ALOS-PALSAR data and topographic variables derived from the Shuttle Radar Topography Mission. The relationship between backscatter coefficient and forest biomass was investigated by Ni et al. [206] and Lucas et al. [70]. Here, Ni et al. [206] investigated the feasibility of forest biomass mapping through the data synthesis of backscattering coefficients and penetration depth by applying ALOS/PALSAR InSAR data and ASTER Global Digital Elevation Model. In this context, the authors concluded that integrating penetration depth improved the accuracy of forest biomass estimation. Furthermore, spaceborne L-band SAR data were used for the large-scale analysis of forest biomass retrieval for forest lands in Mexico [207] and woody vegetation in the forests of Guinea-Bissau in West Africa using ALOS/PALSAR data [208]. Yu and Saatchi [72] used more than three million aboveground biomass values derived from the Geoscience Laser Altimeter System (GLAS) LiDAR height metrics to empirically observe the L-band ALOS/PALSAR backscattering characteristics across different forest biomes in order to examine the sensitivity of the L-band frequency to aboveground biomass. In another study, Cartus et al. [38] mapped aboveground biomass and carbon stored in forests across Mexico employing empirical modeling on forest inventory and spaceborne optical and radar data using ALOS/PALSAR and Landsat imagery.

4.3.4. Biosphere: Agriculture

In terms of their ability to penetrate the vegetation cover, L-band SAR sensors are particularly effective for the detection and monitoring of flooded vegetation. Although it is reported that shorter radar wavelength show better performance in detecting crop area and capturing crop above-ground biomass [209], the potential of spaceborne L-band radar for the observation of agricultural surfaces was found in several studies. For example, Dabrowska-Zielinska et al. [210] extracted consistent information about soil moisture and various plant features to analyze crop growth conditions in an agricultural region in Poland using dual-frequency JERS-1 L-band SAR. Another regional scale study was conducted in Southwestern France by Fieuzal and Baup [211], who demonstrated the usefulness of radar satellite data in complement to or as a replacement for optical data for sunflower monitoring. They analyzed temporal signatures for X-band TerraSAR-X, C-band RADARSAT-2 and L-band ALOS/PALSAR and estimated vegetation height and Leaf Area Index (LAI). Moreover, Wang et al. [212] examined the potential of the integration of COSMO-SkyMed, ENVISAT-ASAR, and ALOS/PALSAR radar signals for pasture monitoring at the paddock scale in order to guide farmers for better management. Furthermore, Li et al. [213] tested the classification performance of SVM, decision tree and K-means algorithms to map oil palm plantations in Cameroon, using PALSAR 50-m orthorectified mosaics. In a further study, Mehta et al. [214] integrated polarimetric Radarsat-2 data acquired during peak mustard crop growth stage and ALOS PALSAR SAR data. The resulting multi-frequency image was used for discrimination of mustard and babul plantations. Flooded vegetation in agricultural fields were investigated by Guan et al. [209], who applied optical and radar data to map rice areas. For this purpose, they used fused time series of optical Landsat-8 and MODIS time series data as well as ALOS PALSAR-2 radar data and tested their performance for paddy rice mapping. The authors stated that both datasets performed similarly for the paddy rice mapping, but L-band SAR made little contribution to the rice yield estimation compared to the optical data.

4.3.5. Biosphere: Land Cover and Land Use

Earth observation for monitoring land cover and land as well as quantifying related land use land cover changes play an important role in exploring and understanding global environmental change. We found that 6% of all reviewed articles focused on land cover and land use classifications. Here, Saatchi et al. [215] examined the information content of the JERS-1 SAR data for the mapping of land cover types in the Amazon Basin using more than 1500 high-resolution images. For another region in Northeast Brazil, Li et al. [216] explored the use of ALOS/PALSAR and RADARSAT-2 C-band data for land cover classification of tropical moist and liane forest. They indicated that L-band data performed better than C-band data when coarse land cover classification system was applied; however, both radar datasets could not effectively separate finer vegetation classes. Furthermore, Evans and Costa [133] used multi-temporal L-band ALOS/PALSAR, C-band RADARSAT-2, and ENVISAT-ASAR data to map ecosystems and lake distribution in a tropical wetland and revealed that the combination of dual-season, high spatial resolution C- and L-band imagery was essential for proper separation among the land cover classes. Jin et al. [217] examined the synergetic use of numerous metrics derived from multitemporal dual-polarized ALOS/PALSAR imagery for vegetation and land cover mapping. In detail, the results indicated that a combination of polarimetric, interferometric and textural features, combined with the intensity metrics, contributed to an enhanced discrimination among different land cover types. The potential of synergetic use of satellite-based multispectral optical and L-band SAR data for land cover classification was conducted in further studies by De Alban et al. [218], Ali et al. [219] and Symeonakis et al. [220]. Moreover, Van Trung [221] used a time series of ALOS/PALSAR backscattering coefficients and MODIS normalized difference vegetation index (NDVI) 16-day composites to estimate the areal variation of land cover classes in relation to annual water level changes for the floodplain of Tonle Sap, Cambodia. Additionally, Trisasongko et al. [222] evaluated the performance of multiple pixel-wise classifiers, including Bayes, Artificial Neural Networks (ANNs), SVM, decision trees, random forests, and Gradient Boosting Trees (GBTs) to distinguish land cover classes for two sites in Indonesia using backscatter coefficient of linearly polarized ALOS/PALSAR data.

5. Discussion

Earth observation data and technologies can effectively support coastal management efforts, particularly in relation to environmental monitoring. The all-weather imaging capabilities of spaceborne radar add great value for geoscientific applications in regions with frequent cloud coverage. For this reason, spaceborne SAR-derived data and products have great potential to address research into coastal sustainability and support issues relating to climate-change-related impacts on coastal ecosystems in the coming decades. Here, continuous and repeated imaging at a high spatial resolution from satellites operating in the longer L-band wavelength could be used to map and monitor coastal wetlands, forests, and agricultural areas. The better penetration capabilities of L-band SAR sensors in comparison to the shorter C-band and X-band sensors allows for the detection and analysis of flooded and inundated vegetation, which can be found particularly in river floodplains and coastal ecosystems, such as river deltas, coastal plains, intertidal flats, lagoons and estuaries. Extensive geoscientific research has highlighted opportunities of L-band SAR for coastal applications and analyses, including wetland mapping, inundation and flood monitoring, deforestation monitoring, estimation vegetation structure and biomass retrieval, and land use/land cover and change.

5.1. Requirement of Continuous L-Band SAR Monitoring Capabilities

Although spaceborne L-band SAR instruments have been operating for a few decades, there is a limited availability of satellite-derived longer-wavelength SAR data. Recent spaceborne L-band measurements were limited to those provided by three JAXA missions: starting with the Japanese satellite JERS-1 (1992–1998), L-band data acquisitions were recorded by the PALSAR instrument aboard the ALOS satellite (2006–2011) for many years. ALOS-2 /PALSAR-2 is currently continuing the L-band SAR observations of the ALOS/PALSAR. However, these sensors have repetition times of a few weeks and thus limited monitoring capabilities, as they do not allow imaging the Earth’s surface with high temporal resolution. However, continuous and repeated imaging capabilities, as provided by the European C-band Sentinel-1 constellation, could enable essential time series information for the monitoring of land surface changes and dynamics in coastal ecosystem. L-band SAR instruments are particularly suitable for observations in tropical cloud-prone coastal regions with dense vegetation cover (e.g., tropical rainforests, mangrove forests) since the frequent presence of dense clouds can lead to strong attenuation in X-band and even in C-band radar data [223].

5.2. Future Spaceborne L-Band Systems

Over the past years, observation capabilities of spaceborne L-band SAR instruments have been enhanced in terms of higher spatial resolution (from several decimeters up to 1 m) and shorter revisit times (from 1.5 months to 1–2 weeks). Advanced L-Band SAR instruments with a very high spatial resolution and shorter repeat cycles are scheduled and may expand the possibilities of earth observation to achieve a breakthrough in understanding the coast zone. Currently, high-resolution satellite-based L-band imaging SAR data are only recorded by the ALOS-2 and the recently launched Argentinean L-band SAOCOM-1A sensors. This gap may be closed with the launch of upcoming spaceborne L-band missions ALOS-4 [224], the SAOCOM-1 constellation and the proposed L-band missions Tandem-L, ESA’s ROSE-L or the joint NASA–ISRO (Indian Space Reseach Organisation) dual frequency S- and L-band NISAR mission [225] in the next few years. New opportunities arise with upcoming commercial data providers and the launch of new Earth imaging satellites, such as the optical microsatellite constellation of the Earth imaging company Planet Labs. In this context, a particular focus is on the development of small satellites equipped with SAR sensors. However, building SAR payloads for small micro-satellite platforms is a challenging task due to peak power demands of conventional pulsed SARs, which tend to make the payloads heavy and expensive to produce [226]. On the other hand, SAR micro-satellites have a potential to increase the temporal resolution of spaceborne radar imaging and create new opportunities for geoscientific applications. Here, the private company ICEYE recently launched low-coast SAR (X-band) microsatellites into orbit. Moreover, Urata et al. [227] presented the development of a compact synthetic aperture radar microsatellite antenna system (ChibaSat) operating in the L-band.

5.3. Potential of Global L-Band SAR Products

Imaging the Earth’s surface at a continental or global scale over long time periods is needed for national coastal monitoring efforts and is important for identifying dynamics and trends. Over the last decade, many global remote sensing products became available. Earth observation at medium to high spatial resolution is necessary to provide valuable baseline information to support stakeholders and decision-makers with respect to sustainable coastal management. L-band sensors have gained importance for global mapping and monitoring of coastal forests and carbon stock estimation by assessing the aboveground biomass, and the assessment of forest dynamics, such as the amount of deforestation and regrowth [228]. L-band SAR data acquired by the satellite missions JERS-1, ALOS/PALSAR and ALOS-2/PALSAR-2 have been used for global mapping initiatives; within the Global Mangrove Watch (GMW) initiative, baseline information of mangrove areas and change is derived from JERS-1, ALOS/PALSAR and ALOS-2/PALSAR-2 radar data [229,230]. The GMW aims to provide geospatial information to assess mangrove extent and changes in the tropics and subtropics. The PALSAR Global Mosaic is a high-resolution slope-corrected and ortho-rectified L-band gamma-naught map acquired at 10-m resolution in a fine-beam dual-polarization mode [180]. A seamless global 25 m PALSAR/PALSAR-2 yearly mosaic was produced by mosaicking strips of SAR imagery from ALOS/PALSAR for the years 2007–2010 (ALOS/PALSAR), as well as data from ALOS-2/PALSAR-2 for each year from 2015 to 2017 [156,205,206,207]. In addition to this, Shimada et al. [182,231,232,233] created new global forest/non-forest maps based on annual global mosaics derived from ALOS-PALSAR HH and HV polarization data at a 25-m spatial resolution for the years 2007 to 2010.

6. Conclusions

This review provided an extensive overview of Earth observation-related research articles that apply spaceborne L-band SAR data for geoscientific analyses that are relevant for coastal land applications. Earth observation data acquired by satellite-based Synthetic Aperture Radar (SAR) sensors has been widely used for geoscientific research of coastal terrestrial environments as well as in applications that are not directly related to coastal land areas but are relevant for coastal research. Coastal environments provide various ecological and economical services while coastal wetlands and mangrove forests along the world’s shoreline provide natural coastal defenses for coastal erosion protection and prevention of coastal flooding. Emerging population pressure, continuing degradation and decline of mangrove forests as well as large-scale conversion of valuable habitats threaten this transitional zone between land and ocean with its valuable natural systems and human resources. On the other hand, the coastal regions are highly exposed to climate change-induced impacts, such as sea level rise, increased storm surge frequency, flooding and saline intrusion.
One of the reasons for the broad application of SAR in coastal research lies in its unique imaging capability, as it provides data independent of cloud coverage and daylight—a clear advantage over optical Earth observation sensors. Longer wavelength radar data have increased penetration capabilities and can provide important information about the structure and biomass of coastal wetlands and forests needed by a broad scientific community working on terrestrial ecology and carbon cycle issues.
During the literature review, we identified 202 research articles that applied spaceborne L-band SAR data and defined the major research foci related to biosphere- as well as hydrosphere-relevant coastal land studies. We also discussed the importance of future L-band SAR missions, the need for continuous monitoring capabilities and the potential of global products. The main findings of this study are:
(1)
The identified studies proved the potential of the penetration capabilities provided by L-band SAR sensors compared to shorter wavelength SAR operating in the C- and X-bands. The penetration of dense vegetation layers enables the detection of vegetation structures and sub-canopy conditions and enhances the monitoring and mapping of wetlands and flooded vegetation in coastal regions.
(2)
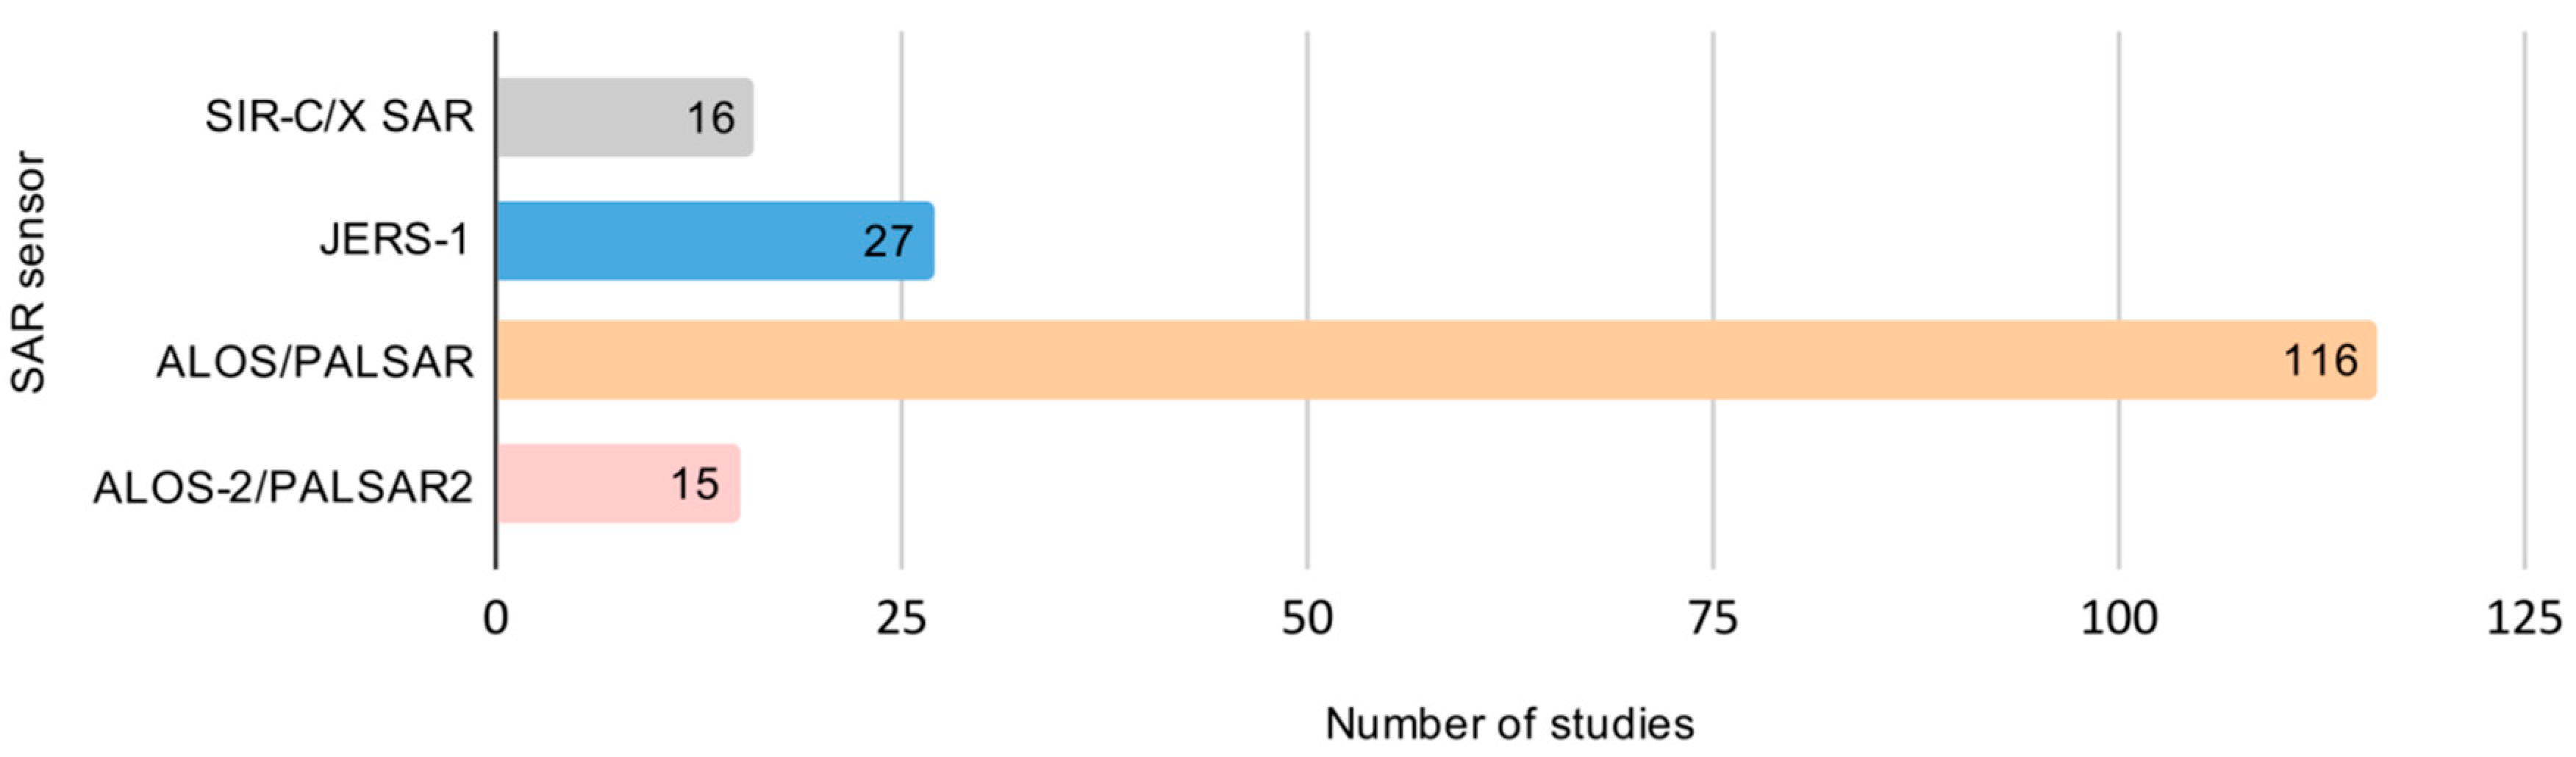
Throughout all research categories, data acquired by the ALOS/PALSAR sensor were most frequently used. Two-thirds (67%) of all studies used PALSAR imagery, followed by JERS-1 with 15%.
(3)
We identified that the synergetic use of multiple sensors has been integrated by more than one-fourth of all reviewed articles. These studies utilized L-band SAR sensors in combination with optical and shorter wavelength radar sensors. In detail, 18% combined L-band SAR sensors with other SAR sensors, of which C-band (14%) was much more represented than X-band SAR (4%); Radarsat-1/2 was employed in 9% of all reviewed studies in combination with L-band SAR sensors, followed by TSX with 4%. A synergistic combination of L-band radar with optical sensors was found in 14% of all articles; the instruments of the Landsat fleet were mostly employed as optical sensors, specifically in 8% of all studies.
(4)
It was found that the majority of studies either focused on wetlands, forests/woodlands, and inundation/flooding, agriculture, or land cover and land use, whereas other vegetation studies or the study of soil moisture were underrepresented. Wetlands (35%) and forest/woodlands (25%) were by far the most studied categories in all reviewed research articles. Within the (tidal) wetland category, mangroves play an important role and have been studied by a majority of authors.
(5)
The availability of continuous and long-term spaceborne L-band SAR observations, provided by ongoing and upcoming missions with improved repeat cycles, spatial coverage and resolution will improve the quantification of terrestrial ecosystems, particularly wetland mapping, submerged vegetation detection and biomass estimates, and foster monitoring capabilities of coastal regions worldwide.
With this review, a detailed overview of spaceborne L-band SAR-related geoscientific research studies that are most relevant for coastal land applications was provided for the first time. The results emphasize the importance and need for future L-band SAR missions to provide data and products for continuous mapping and monitoring activities in the coastal zone.

Author Contributions

Conceptualization, M.O. and C.K.; writing—original draft preparation, M.O.; writing—review and editing, M.O. and C.K.; visualization, M.O. All authors have read and agreed to the published version of the manuscript.

Funding

This research received no external funding.

Acknowledgments

The authors acknowledge the use of ALOS-2/PALSAR-2 data (©JAXA 2017) and Sentinel-2 data (©ESA 2017). Moreover, the authors thank Felix Bachofer and Juliane Huth for commenting on the original draft.

Conflicts of Interest

The authors declare no conflict of interest.

References

  1. Overeem, I.; Syvitski, J.P.M. Dynamics and Vulnerability of Delta Systems; LOICZ Reports & Studies No. 35; GKSS Research Center: Geesthacht, Germany, 2009; p. 54. [Google Scholar]
  2. Kuenzer, C.; Bluemel, A.; Gebhardt, S.; Quoc, T.V.; Dech, S. Remote Sensing of Mangrove Ecosystems: A Review. Remote Sens. 2011, 3, 878–928. [Google Scholar] [CrossRef] [Green Version]
  3. Crossland, C.J.; Baird, D.; Ducrotoy, J.-P.; Lindeboom, H.; Buddemeier, R.W.; Dennison, W.C.; Maxwell, B.A.; Smith, S.V.; Swaney, D.P. The Coastal Zone—A Domain of Global Interactions. In Coastal Fluxes in the Anthropocene: The Land-Ocean Interactions in the Coastal Zone Project of the International Geosphere-Biosphere Programme; Crossland, C.J., Kremer, H.H., Lindeboom, H.J., Marshall Crossland, J.I., Le Tissier, M.D.A., Eds.; Global Change—The IGBP Series; Springer: Berlin/Heidelberg, Germany, 2005; pp. 1–37. ISBN 978-3-540-27851-1. [Google Scholar]
  4. Baztan, J.; Chouinard, O.; Jorgensen, B.; Tett, P.; Vanderlinden, J.-P.; Vasseur, L. Introduction. In Coastal Zones; Baztan, J., Chouinard, O., Jorgensen, B., Tett, P., Vanderlinden, J.-P., Vasseur, L., Eds.; Elsevier: Amsterdam, The Netherlands, 2015; pp. xxi–xxiii. ISBN 978-0-12-802748-6. [Google Scholar]
  5. McGranahan, G.; Balk, D.; Anderson, B. The rising tide: Assessing the risks of climate change and human settlements in low elevation coastal zones. Environ. Urban. 2007, 19, 17–37. [Google Scholar] [CrossRef]
  6. Kim, M.; You, S.; Chon, J.; Lee, J. Sustainable Land-Use Planning to Improve the Coastal Resilience of the Social-Ecological Landscape. Sustainability 2017, 9, 1086. [Google Scholar] [CrossRef] [Green Version]
  7. Giri, C.; Ochieng, E.; Tieszen, L.L.; Zhu, Z.; Singh, A.; Loveland, T.; Masek, J.; Duke, N. Status and distribution of mangrove forests of the world using earth observation satellite data. Glob. Ecol. Biogeogr. 2011, 20, 154–159. [Google Scholar] [CrossRef]
  8. Primavera, J.H. Overcoming the impacts of aquaculture on the coastal zone. Ocean Coast. Manag. 2006, 49, 531–545. [Google Scholar] [CrossRef]
  9. Wei, C.; Taubenböck, H.; Blaschke, T. Measuring urban agglomeration using a city-scale dasymetric population map: A study in the Pearl River Delta, China. Habitat Int. 2017, 59, 32–43. [Google Scholar] [CrossRef] [Green Version]
  10. Samat, N.; Harun, N. Urban Development Pressure: Challenges in Ensuring Sustainable Tourism Development in Langkawi Island. Procedia Soc. Behav. Sci. 2013, 91, 385–394. [Google Scholar] [CrossRef] [Green Version]
  11. Ottinger, M.; Clauss, K.; Kuenzer, C. Aquaculture: Relevance, distribution, impacts and spatial assessments—A review. Ocean Coast. Manag. 2016, 119, 244–266. [Google Scholar] [CrossRef]
  12. Ottinger, M.; Clauss, K.; Kuenzer, C. Large-Scale Assessment of Coastal Aquaculture Ponds with Sentinel-1 Time Series Data. Remote Sens. 2017, 9, 440. [Google Scholar] [CrossRef] [Green Version]
  13. Clauss, K.; Ottinger, M.; Leinenkugel, P.; Kuenzer, C. Estimating rice production in the Mekong Delta, Vietnam, utilizing time series of Sentinel-1 SAR data. Int. J. Appl. Earth Obs. Geoinf. 2018, 73, 574–585. [Google Scholar] [CrossRef]
  14. Bostock, J.; McAndrew, B.; Richards, R.; Jauncey, K.; Telfer, T.; Lorenzen, K.; Little, D.; Ross, L.; Handisyde, N.; Gatward, I.; et al. Aquaculture: Global status and trends. Philos. Trans. R. Soc. Lond. B Biol. Sci. 2010, 365, 2897–2912. [Google Scholar] [CrossRef] [PubMed]
  15. Troell, M.; Metian, M.; Beveridge, M.; Verdegem, M.; Deutsch, L. Comment on ‘Water footprint of marine protein consumption—aquaculture’s link to agriculture’. Environ. Res. Lett. 2014, 9, 109001. [Google Scholar] [CrossRef]
  16. Syvitski, J.P.M.; Harvey, N.; Wolanski, E.; Burnett, W.C.; Perillo, G.M.E.; Gornitz, V.; Arthurton, R.K.; Bokuniewicz, H.; Campbell, J.W.; Cooper, L.; et al. Dynamics of the Coastal Zone. In Coastal Fluxes in the Anthropocene: The Land-Ocean Interactions in the Coastal Zone Project of the International Geosphere-Biosphere Programme; Crossland, C.J., Kremer, H.H., Lindeboom, H.J., Marshall Crossland, J.I., Le Tissier, M.D.A., Eds.; Global Change—The IGBP Series; Springer: Berlin/Heidelberg, Germany, 2005; pp. 39–94. ISBN 978-3-540-27851-1. [Google Scholar]
  17. Ramsey, E.; Werle, D.; Suzuoki, Y.; Rangoonwala, A.; Lu, Z. Limitations and Potential of Satellite Imagery to Monitor Environmental Response to Coastal Flooding. J. Coast. Res. 2012, 280, 457–476. [Google Scholar] [CrossRef]
  18. Taherkhani, M.; Vitousek, S.; Barnard, P.L.; Frazer, N.; Anderson, T.R.; Fletcher, C.H. Sea-level rise exponentially increases coastal flood frequency. Sci. Rep. 2020, 10, 1–17. [Google Scholar] [CrossRef] [PubMed]
  19. Xu, L.; Wang, X.; Liu, J.; He, Y.; Tang, J.; Nguyen, M.; Cui, S. Identifying the trade-offs between climate change mitigation and adaptation in urban land use planning: An empirical study in a coastal city. Environ. Int. 2019, 133, 105162. [Google Scholar] [CrossRef]
  20. Kuenzer, C.; Heimhuber, V.; Huth, J.; Dech, S. Remote Sensing for the Quantification of Land Surface Dynamics in Large River Delta Regions—A Review. Remote Sens. 2019, 11, 1985. [Google Scholar] [CrossRef] [Green Version]
  21. Tyler, A.N.; Hunter, P.D.; Spyrakos, E.; Groom, S.; Constantinescu, A.M.; Kitchen, J. Developments in Earth observation for the assessment and monitoring of inland, transitional, coastal and shelf-sea waters. Sci. Total Environ. 2016, 572, 1307–1321. [Google Scholar] [CrossRef] [Green Version]
  22. Politi, E.; Paterson, S.K.; Scarrott, R.; Tuohy, E.; O’Mahony, C.; Cámaro-García, W.C.A. Earth observation applications for coastal sustainability: Potential and challenges for implementation. Anthr. Coasts 2019, 2, 306–329. [Google Scholar] [CrossRef] [Green Version]
  23. Hall, D.K. Remote sensing applications to hydrology; imaging radar. Hydrol. Sci. J. 1996, 41, 609–624. [Google Scholar] [CrossRef]
  24. Kasischke, E.S.; Melack, J.M.; Craig Dobson, M. The use of imaging radars for ecological applications—A review. Remote Sens. Environ. 1997, 59, 141–156. [Google Scholar] [CrossRef]
  25. Tsyganskaya, V.; Martinis, S.; Marzahn, P.; Ludwig, R. SAR-based detection of flooded vegetation – a review of characteristics and approaches. Int. J. Remote Sens. 2018, 39, 2255–2293. [Google Scholar] [CrossRef]
  26. Mohammadimanesh, F.; Salehi, B.; Mahdianpari, M.; Brisco, B.; Motagh, M. Wetland Water Level Monitoring Using Interferometric Synthetic Aperture Radar (InSAR): A Review. Can. J. Remote Sens. 2018, 44, 247–262. [Google Scholar] [CrossRef]
  27. Kiage, L.M.; Walker, N.D.; Balasubramanian, S.; Babin, A.; Barras, J. Applications of Radarsat-1 synthetic aperture radar imagery to assess hurricane-related flooding of coastal Louisiana. Int. J. Remote Sens. 2005, 26, 5359–5380. [Google Scholar] [CrossRef]
  28. Kuenzer, C.; Guo, H.; Huth, J.; Leinenkugel, P.; Li, X.; Dech, S. Flood Mapping and Flood Dynamics of the Mekong Delta: ENVISAT-ASAR-WSM Based Time Series Analyses. Remote Sens. 2013, 5, 687–715. [Google Scholar] [CrossRef] [Green Version]
  29. Martinis, S.; Twele, A. A Hierarchical Spatio-Temporal Markov Model for Improved Flood Mapping Using Multi-Temporal X-Band SAR Data. Remote Sens. 2010, 2, 2240–2258. [Google Scholar] [CrossRef] [Green Version]
  30. Scarpino, S.; Albano, R.; Cantisani, A.; Mancusi, L.; Sole, A.; Milillo, G. Multitemporal SAR Data and 2D Hydrodynamic Model Flood Scenario Dynamics Assessment. IJGI 2018, 7, 105. [Google Scholar] [CrossRef] [Green Version]
  31. Martinis, S.; Kuenzer, C.; Wendleder, A.; Huth, J.; Twele, A.; Roth, A.; Dech, S. Comparing four operational SAR-based water and flood detection approaches. Int. J. Remote Sens. 2015, 36, 3519–3543. [Google Scholar] [CrossRef]
  32. Cazals, C.; Rapinel, S.; Frison, P.-L.; Bonis, A.; Mercier, G.; Mallet, C.; Corgne, S.; Rudant, J.-P. Mapping and Characterization of Hydrological Dynamics in a Coastal Marsh Using High Temporal Resolution Sentinel-1A Images. Remote Sens. 2016, 8, 570. [Google Scholar] [CrossRef] [Green Version]
  33. Zhen, J.; Liao, J.; Shen, G. Mapping Mangrove Forests of Dongzhaigang Nature Reserve in China Using Landsat 8 and Radarsat-2 Polarimetric SAR Data. Sensors 2018, 18, 4012. [Google Scholar] [CrossRef] [Green Version]
  34. Lu, Z.; Kwoun, O. Radarsat-1 and ERS InSAR Analysis Over Southeastern Coastal Louisiana: Implications for Mapping Water-Level Changes Beneath Swamp Forests. IEEE Trans. Geosci. Remote Sens. 2008, 46, 2167–2184. [Google Scholar] [CrossRef]
  35. Zhang, H.; Wang, T.; Liu, M.; Jia, M.; Lin, H.; Chu, L.; Devlin, A. Potential of Combining Optical and Dual Polarimetric SAR Data for Improving Mangrove Species Discrimination Using Rotation Forest. Remote Sens. 2018, 10, 467. [Google Scholar] [CrossRef] [Green Version]
  36. Rangoonwala, A.; Enwright, N.M.; Ramsey III, E.; Spruce, J.P. Radar and optical mapping of surge persistence and marsh dieback along the New Jersey Mid-Atlantic coast after Hurricane Sandy. Int. J. Remote Sens. 2016, 37, 1692–1713. [Google Scholar] [CrossRef]
  37. Guimarães, U.S.; da Silva Narvaes, I.; Galo, M.D.; da Silva, A.D.; de Oliveira Camargo, P. Radargrammetric approaches to the flat relief of the amazon coast using COSMO-SkyMed and TerraSAR-X datasets. ISPRS J. Photogramm. Remote Sens. 2018, 145, 284–296. [Google Scholar] [CrossRef] [Green Version]
  38. Cartus, O.; Kellndorfer, J.; Walker, W.; Franco, C.; Bishop, J.; Santos, L.; Fuentes, J. A National, Detailed Map of Forest Aboveground Carbon Stocks in Mexico. Remote Sens. 2014, 6, 5559–5588. [Google Scholar] [CrossRef] [Green Version]
  39. Cremon, É.; de Fátima Rossetti, D.; Zani, H. Classification of Vegetation over a Residual Megafan Landform in the Amazonian Lowland Based on Optical and SAR Imagery. Remote Sens. 2014, 6, 10931–10946. [Google Scholar] [CrossRef] [Green Version]
  40. Vaglio Laurin, G.; Liesenberg, V.; Chen, Q.; Guerriero, L.; Del Frate, F.; Bartolini, A.; Coomes, D.; Wilebore, B.; Lindsell, J.; Valentini, R. Optical and SAR sensor synergies for forest and land cover mapping in a tropical site in West Africa. Int. J. Appl. Earth Obs. Geoinf. 2013, 21, 7–16. [Google Scholar] [CrossRef]
  41. Wilhelm, S.; Hüttich, C.; Korets, M.; Schmullius, C. Large Area Mapping of Boreal Growing Stock Volume on an Annual and Multi-Temporal Level Using PALSAR L-Band Backscatter Mosaics. Forests 2014, 5, 1999–2015. [Google Scholar] [CrossRef] [Green Version]
  42. Hong, S.-H.; Wdowinski, S. Multitemporal Multitrack Monitoring of Wetland Water Levels in the Florida Everglades Using ALOS PALSAR Data With Interferometric Processing. IEEE Geosci. Remote Sens. Lett. 2014, 11, 1355–1359. [Google Scholar] [CrossRef]
  43. Kim, S.-W.; Wdowinski, S.; Amelung, F.; Dixon, T.H.; Won, J.-S. Interferometric Coherence Analysis of the Everglades Wetlands, South Florida. IEEE Trans. Geosci. Remote Sens. 2013, 51, 5210–5224. [Google Scholar] [CrossRef]
  44. Mohammadimanesh, F.; Salehi, B.; Mahdianpari, M.; Brisco, B.; Motagh, M. Multi-temporal, multi-frequency, and multi-polarization coherence and SAR backscatter analysis of wetlands. ISPRS J. Photogramm. Remote Sens. 2018, 142, 78–93. [Google Scholar] [CrossRef]
  45. Simard, M.; Grandi, G.D.; Saatchi, S.; Mayaux, P. Mapping tropical coastal vegetation using JERS-1 and ERS-1 radar data with a decision tree classifier. Int. J. Remote Sens. 2002, 23, 1461–1474. [Google Scholar] [CrossRef]
  46. Chen, Y.; He, X.; Wang, J. Classification of coastal wetlands in eastern China using polarimetric SAR data. Arab. J. Geosci. 2015, 8, 10203–10211. [Google Scholar] [CrossRef]
  47. Rocha de Souza Pereira, F.; Kampel, M.; Cunha-Lignon, M. Mapping of mangrove forests on the southern coast of São Paulo, Brazil, using synthetic aperture radar data from ALOS/PALSAR. Remote Sens. Lett. 2012, 3, 567–576. [Google Scholar] [CrossRef]
  48. Abdel-Hamid, A.; Dubovyk, O.; Abou El-Magd, I.; Menz, G. Mapping Mangroves Extents on the Red Sea Coastline in Egypt using Polarimetric SAR and High Resolution Optical Remote Sensing Data. Sustainability 2018, 10, 646. [Google Scholar] [CrossRef] [Green Version]
  49. Plank, S.; Jüssi, M.; Martinis, S.; Twele, A. Mapping of flooded vegetation by means of polarimetric Sentinel-1 and ALOS-2/PALSAR-2 imagery. Int. J. Remote Sens. 2017, 38, 3831–3850. [Google Scholar] [CrossRef]
  50. Alsdorf, D.E.; Melack, J.M.; Dunne, T.; Mertes, L.A.K.; Hess, L.L.; Smith, L.C. Interferometric radar measurements of water level changes on the Amazon flood plain. Nature 2000, 404, 174–177. [Google Scholar] [CrossRef]
  51. Davidson, N.C.; Fluet-Chouinard, E.; Finlayson, C.M. Global extent and distribution of wetlands: Trends and issues. Mar. Freshw. Res. 2018, 69, 620. [Google Scholar] [CrossRef] [Green Version]
  52. Mitchell, A.L.; Milne, A.K.; Tapley, I. Towards an operational SAR monitoring system for monitoring environmental flows in the Macquarie Marshes. Wetl. Ecol. Manag. 2015, 23, 61–77. [Google Scholar] [CrossRef]
  53. Kim, J.-W.; Lu, Z.; Jones, J.W.; Shum, C.K.; Lee, H.; Jia, Y. Monitoring Everglades freshwater marsh water level using L-band synthetic aperture radar backscatter. Remote Sens. Environ. 2014, 150, 66–81. [Google Scholar] [CrossRef]
  54. Kim, D.; Lee, H.; Laraque, A.; Tshimanga, R.M.; Yuan, T.; Jung, H.C.; Beighley, E.; Chang, C.-H. Mapping spatio-temporal water level variations over the central Congo River using PALSAR ScanSAR and Envisat altimetry data. Int. J. Remote Sens. 2017, 38, 7021–7040. [Google Scholar] [CrossRef]
  55. Poncos, V.; Teleaga, D.; Bondar, C.; Oaie, G. A new insight on the water level dynamics of the Danube Delta using a high spatial density of SAR measurements. J. Hydrol. 2013, 482, 79–91. [Google Scholar] [CrossRef]
  56. Xie, C.; Shao, Y.; Xu, J.; Wan, Z.; Fang, L. Analysis of ALOS PALSAR InSAR data for mapping water level changes in Yellow River Delta wetlands. Int. J. Remote Sens. 2013, 34, 2047–2056. [Google Scholar] [CrossRef]
  57. Thomas, N.; Lucas, R.; Itoh, T.; Simard, M.; Fatoyinbo, L.; Bunting, P.; Rosenqvist, A. An approach to monitoring mangrove extents through time-series comparison of JERS-1 SAR and ALOS PALSAR data. Wetl. Ecol. Manag. 2015, 23, 3–17. [Google Scholar] [CrossRef]
  58. Pereira, F.R.; Kampel, M.; Cunha-Lignon, M. Mangrove vegetation structure in Southeast Brazil from phased array L-band synthetic aperture radar data. JARS 2016, 10, 036021. [Google Scholar] [CrossRef] [Green Version]
  59. Kim, Y.; Kimball, J.S.; McDonald, K.C.; Glassy, J. Developing a Global Data Record of Daily Landscape Freeze/Thaw Status Using Satellite Passive Microwave Remote Sensing. IEEE Trans. Geosci. Remote Sens. 2011, 49, 949–960. [Google Scholar] [CrossRef]
  60. Kuenzer, C.; Ottinger, M.; Wegmann, M.; Guo, H.; Wang, C.; Zhang, J.; Dech, S.; Wikelski, M. Earth observation satellite sensors for biodiversity monitoring: Potentials and bottlenecks. Int. J. Remote Sens. 2014, 35, 6599–6647. [Google Scholar] [CrossRef] [Green Version]
  61. Töyrä, J.; Pietroniro, A. Towards operational monitoring of a northern wetland using geomatics-based techniques. Remote Sens. Environ. 2005, 97, 174–191. [Google Scholar] [CrossRef]
  62. Rosenqvist, A.; Shimada, M.; Suzuki, S.; Ohgushi, F.; Tadono, T.; Watanabe, M.; Tsuzuku, K.; Watanabe, T.; Kamijo, S.; Aoki, E. Operational performance of the ALOS global systematic acquisition strategy and observation plans for ALOS-2 PALSAR-2. Remote Sens. Environ. 2014, 155, 3–12. [Google Scholar] [CrossRef]
  63. Brisco, B.; Ahern, F.; Murnaghan, K.; White, L.; Canisus, F.; Lancaster, P. Seasonal Change in Wetland Coherence as an Aid to Wetland Monitoring. Remote Sens. 2017, 9, 158. [Google Scholar] [CrossRef] [Green Version]
  64. Corbane, C.; Pesaresi, M.; Politis, P.; Syrris, V.; Florczyk, A.J.; Soille, P.; Maffenini, L.; Burger, A.; Vasilev, V.; Rodriguez, D.; et al. Big earth data analytics on Sentinel-1 and Landsat imagery in support to global human settlements mapping. Big Earth Data 2017, 1, 118–144. [Google Scholar] [CrossRef] [Green Version]
  65. Irwin, K.; Braun, A.; Fotopoulos, G.; Roth, A.; Wessel, B. Assessing Single-Polarization and Dual-Polarization TerraSAR-X Data for Surface Water Monitoring. Remote Sens. 2018, 10, 949. [Google Scholar] [CrossRef] [Green Version]
  66. Li, W.; Tong, Q.; Xu, L.; Ji, P.; Dong, F.; Yu, Y.; Chen, J.; Zhao, L.; Zhang, L.; Xie, C.; et al. The P-band SAR Satellite: Opportunities and Challenges. In Proceedings of the 2019 6th Asia-Pacific Conference on Synthetic Aperture Radar (APSAR), Singapore, 1–4 September 2019; pp. 1–6. [Google Scholar]
  67. Kasischke, E.S.; Bourgeau-Chavez, L.L. Monitoring South Florida Wetlands Using ERS-1 SAR Imagery. Eng. Remote Sens. 1997, 63, 281–291. [Google Scholar]
  68. Lang, M.; Townsend, P.; Kasischke, E. Influence of incidence angle on detecting flooded forests using C-HH synthetic aperture radar data. Remote Sens. Environ. 2008, 112, 3898–3907. [Google Scholar] [CrossRef]
  69. Proisy, C.; Mougin, E.; Fromard, F.; Trichon, V.; Karam, M.A. On the influence of canopy structure on the radar backscattering of mangrove forests. Int. J. Remote Sens. 2002, 23, 4197–4210. [Google Scholar] [CrossRef]
  70. Lucas, R.; Armston, J.; Fairfax, R.; Fensham, R.; Accad, A.; Carreiras, J.; Kelley, J.; Bunting, P.; Clewley, D.; Bray, S.; et al. An Evaluation of the ALOS PALSAR L-Band Backscatter—Above Ground Biomass Relationship Queensland, Australia: Impacts of Surface Moisture Condition and Vegetation Structure. IEEE J. Sel. Top. Appl. Earth Obs. Remote Sens. 2010, 3, 576–593. [Google Scholar] [CrossRef]
  71. Townsend, P.A. Estimating forest structure in wetlands using multitemporal SAR. Remote Sens. Environ. 2002, 79, 288–304. [Google Scholar] [CrossRef]
  72. Yu, Y.; Saatchi, S. Sensitivity of L-Band SAR Backscatter to Aboveground Biomass of Global Forests. Remote Sens. 2016, 8, 522. [Google Scholar] [CrossRef] [Green Version]
  73. Flores-Anderson, A.I.; Herndon, K.E.; Cherrington, E.; Thapa, R.; Kucera, L.; Guyen, N.H.; Odour, P.; Wahome, A.; Tenneson, K.; Manane, B.; et al. SAR Handbook: Comprehensive Methodologies for Forest Monitoring and Biomass Estimation; Flores, A., Herndon, K., Thapa, R., Cherrington, E., Eds.; NASA: Washington, DC, USA, 2019.
  74. Pope, K.O.; Rey-Benayas, J.M.; Paris, J.F. Radar remote sensing of forest and wetland ecosystems in the Central American tropics. Remote Sens. Environ. 1994, 48, 205–219. [Google Scholar] [CrossRef]
  75. Manavalan, R. Review of synthetic aperture radar frequency, polarization, and incidence angle data for mapping the inundated regions. J. Appl. Rem. Sens. 2018, 12, 1. [Google Scholar] [CrossRef]
  76. Shen, X.; Wang, D.; Mao, K.; Anagnostou, E.; Hong, Y. Inundation Extent Mapping by Synthetic Aperture Radar: A Review. Remote Sens. 2019, 11, 879. [Google Scholar] [CrossRef] [Green Version]
  77. Ramsey, E.; Rangoonwala, A.; Bannister, T. Coastal Flood Inundation Monitoring with Satellite C-band and L-band Synthetic Aperture Radar Data. J. Am. Water Resour. Assoc. 2013, 49, 1239–1260. [Google Scholar] [CrossRef]
  78. Rosenqvist, A.; Finlayson, C.M.; Lowry, J.; Taylor, D. The potential of long-wavelength satellite-borne radar to support implementation of the Ramsar Wetlands Convention. Aquat. Conserv. Mar. Freshw. Ecosyst. 2007, 17, 229–244. [Google Scholar] [CrossRef]
  79. Chapman, B.; McDonald, K.; Shimada, M.; Rosenqvist, A.; Schroeder, R.; Hess, L. Mapping Regional Inundation with Spaceborne L-Band SAR. Remote Sens. 2015, 7, 5440–5470. [Google Scholar] [CrossRef] [Green Version]
  80. Townsend, P.A. Mapping Seasonal Flooding in Forested Wetlands Using Multi-Temporal Radarsat SAR. Photogramm. Eng. Remote Sens. 2001, 67, 857–864. [Google Scholar]
  81. Martinis, S.; Rieke, C. Backscatter Analysis Using Multi-Temporal and Multi-Frequency SAR Data in the Context of Flood Mapping at River Saale, Germany. Remote Sens. 2015, 7, 7732–7752. [Google Scholar] [CrossRef] [Green Version]
  82. Brisco, B.; Murnaghan, K.; Wdowinski, S.; Hong, S.-H. Evaluation of RADARSAT-2 Acquisition Modes for Wetland Monitoring Applications. Can. J. Remote Sens. 2015, 41, 431–439. [Google Scholar] [CrossRef]
  83. Zhang, M.; Li, Z.; Tian, B.; Zhou, J.; Tang, P. The backscattering characteristics of wetland vegetation and water-level changes detection using multi-mode SAR: A case study. Int. J. Appl. Earth Obs. Geoinf. 2016, 45, 1–13. [Google Scholar] [CrossRef]
  84. Kerbaol, V.; Collard, F. SAR-Derived coastal and marine applications: From research to operational products. IEEE J. Ocean. Eng. 2005, 30, 472–486. [Google Scholar] [CrossRef]
  85. Catalao, J.; Raju, D.; Nico, G. Insar Maps of Land Subsidence and Sea Level Scenarios to Quantify the Flood Inundation Risk in Coastal Cities: The Case of Singapore. Remote Sens. 2020, 12, 296. [Google Scholar] [CrossRef] [Green Version]
  86. Bekaert, D.P.S.; Hamlington, B.D.; Buzzanga, B.; Jones, C.E. Spaceborne Synthetic Aperture Radar Survey of Subsidence in Hampton Roads, Virginia (USA). Sci. Rep. 2017, 7, 14752. [Google Scholar] [CrossRef] [Green Version]
  87. Yastika, P.E.; Shimizu, N.; Abidin, H.Z. Monitoring of long-term land subsidence from 2003 to 2017 in coastal area of Semarang, Indonesia by SBAS DInSAR analyses using Envisat-ASAR, ALOS-PALSAR, and Sentinel-1A SAR data. Adv. Space Res. 2019, 63, 1719–1736. [Google Scholar] [CrossRef]
  88. Schmitt, A.; Brisco, B. Wetland Monitoring Using the Curvelet-Based Change Detection Method on Polarimetric SAR Imagery. Water 2013, 5, 1036–1051. [Google Scholar] [CrossRef]
  89. Smith, L.C. Satellite remote sensing of river inundation area, stage, and discharge: A review. Hydrol. Process. 1997, 11, 13. [Google Scholar] [CrossRef]
  90. Brolly, M.; Woodhouse, I.H. A “Matchstick Model” of microwave backscatter from a forest. Ecol. Model. 2012, 237–238, 74–87. [Google Scholar] [CrossRef]
  91. Touzi, R.; Deschamps, A.; Rother, G. Phase of Target Scattering for Wetland Characterization Using Polarimetric C-Band SAR. IEEE Trans. Geosci. Remote Sens. 2009, 47, 3241–3261. [Google Scholar] [CrossRef]
  92. Hagensieker, R.; Waske, B. Evaluation of Multi-Frequency SAR Images for Tropical Land Cover Mapping. Remote Sens. 2018, 10, 257. [Google Scholar] [CrossRef] [Green Version]
  93. Stofan, E.R.; Evans, D.L.; Schmullius, C.; Holt, B.; Plaut, J.J.; van Zyl, J.; Wall, S.D.; Way, J. Overview of results of Spaceborne Imaging Radar-C, X-Band Synthetic Aperture Radar (SIR-C/X-SAR). IEEE Trans. Geosci. Remote Sens. 1995, 33, 817–828. [Google Scholar] [CrossRef]
  94. Freeman, A.; Zink, M.; Caro, E.; Moreira, A.; Veilleux, L.; Werner, M. The legacy of the SIR-C/X-SAR radar system: 25 years on. Remote Sens. Environ. 2019, 231, 111255. [Google Scholar] [CrossRef]
  95. Guo, H. Spaceborne and Airborne SAR for Target Detection and Flood Monitoring. Photogramm. Eng. Remote Sens. 2000, 66, 611–617. [Google Scholar]
  96. Jones, C.E.; Holt, B. Experimental L-Band Airborne SAR for Oil Spill Response at Sea and in Coastal Waters. Sensors 2018, 18. [Google Scholar] [CrossRef] [Green Version]
  97. Reigber, A.; Scheiber, R.; Jager, M.; Prats-Iraola, P.; Hajnsek, I.; Jagdhuber, T.; Papathanassiou, K.P.; Nannini, M.; Aguilera, E.; Baumgartner, S.; et al. Very-High-Resolution Airborne Synthetic Aperture Radar Imaging: Signal Processing and Applications. Proc. IEEE 2013, 101, 759–783. [Google Scholar] [CrossRef] [Green Version]
  98. Hajnsek, I.; Jagdhuber, T.; Schon, H.; Papathanassiou, K.P. Potential of Estimating Soil Moisture under Vegetation Cover by Means of PolSAR. IEEE Trans. Geosci. Remote Sens. 2009, 47, 442–454. [Google Scholar] [CrossRef] [Green Version]
  99. Li, C.J.; Ling, H. Synthetic aperture radar imaging using a small consumer drone. In Proceedings of the 2015 IEEE International Symposium on Antennas and Propagation USNC/URSI National Radio Science Meeting, Vancouver, BC, USA, 19–24 July 2015; pp. 685–686. [Google Scholar]
  100. Horritt, M. Waterline mapping in flooded vegetation from airborne SAR imagery. Remote Sens. Environ. 2003, 85, 271–281. [Google Scholar] [CrossRef]
  101. Ayoub, F.; Jones, C.E.; Lamb, M.P.; Holt, B.; Shaw, J.B.; Mohrig, D.; Wagner, W. Inferring surface currents within submerged, vegetated deltaic islands and wetlands from multi-pass airborne SAR. Remote Sens. Environ. 2018, 212, 148–160. [Google Scholar] [CrossRef]
  102. Notarnicola, C.; Posa, F. Inferring Vegetation Water Content from C- and L-Band SAR Images. Ieee Trans. Geosci. Remote Sens. 2007, 45, 3165–3171. [Google Scholar] [CrossRef]
  103. Sato, R.; Yajima, Y.; Yamaguchi, Y.; Yamada, H. Seasonal Change Investigation of Water Area in Lake Sakata Based on POLSAR Image Analysis; The Institute of Electronics, Information and Communication Engineers: Tokyo, Japan, 2006; p. 5. [Google Scholar]
  104. Souza-Filho, P.W.M.; Paradella, W.R.; Rodrigues, S.W.P.; Costa, F.R.; Mura, J.C.; Gonçalves, F.D. Discrimination of coastal wetland environments in the Amazon region based on multi-polarized L-band airborne Synthetic Aperture Radar imagery. Estuar. Coast. Shelf Sci. 2011, 95, 88–98. [Google Scholar] [CrossRef]
  105. Sarti, M.; Migliaccio, M.; Nunziata, F.; Mascolo, L.; Brugnoli, E. On the sensitivity of polarimetric SAR measurements to vegetation cover: The Coiba National Park, Panama. Int. J. Remote Sens. 2017, 38, 6755–6768. [Google Scholar] [CrossRef]
  106. Clint Slatton, K.; Crawford, M.M.; Chang, L.-D. Modeling temporal variations in multipolarized radar scattering from intertidal coastal wetlands. ISPRS J. Photogramm. Remote Sens. 2008, 63, 559–577. [Google Scholar] [CrossRef]
  107. Ramsey, E.; Rangoonwala, A.; Chi, Z.; Jones, C.E.; Bannister, T. Marsh Dieback, loss, and recovery mapped with satellite optical, airborne polarimetric radar, and field data. Remote Sens. Environ. 2014, 152, 364–374. [Google Scholar] [CrossRef]
  108. Burgin, M.S.; van Zyl, J.J. Analysis of Polarimetric Radar Data and Soil Moisture from Aquarius: Towards a Regression-Based Soil Moisture Estimation Algorithm. IEEE J. Sel. Top. Appl. Earth Obs. Remote Sens. 2016, 9, 3497–3504. [Google Scholar] [CrossRef]
  109. Kim, S.-B.; Moghaddam, M.; Tsang, L.; Burgin, M.; Xu, X.; Njoku, E.G. Models of L-Band Radar Backscattering Coefficients Over Global Terrain for Soil Moisture Retrieval. IEEE Trans. Geosci. Remote Sens. 2014, 52, 1381–1396. [Google Scholar] [CrossRef]
  110. Liu, C.; Shi, J. Estimation of Vegetation Parameters of Water Cloud Model for Global Soil Moisture Retrieval Using Time-Series L-Band Aquarius Observations. IEEE J. Sel. Top. Appl. Earth Obs. Remote Sens. 2016, 9, 5621–5633. [Google Scholar] [CrossRef]
  111. Panciera, R.; Walker, J.P.; Jackson, T.J.; Gray, D.A.; Tanase, M.A.; Ryu, D.; Monerris, A.; Yardley, H.; Rudiger, C.; Wu, X.; et al. The Soil Moisture Active Passive Experiments (SMAPEx): Toward Soil Moisture Retrieval from the SMAP Mission. IEEE Trans. Geosci. Remote Sens. 2014, 52, 490–507. [Google Scholar] [CrossRef]
  112. Montzka, C.; Jagdhuber, T.; Horn, R.; Bogena, H.R.; Hajnsek, I.; Reigber, A.; Vereecken, H. Investigation of SMAP Fusion Algorithms With Airborne Active and Passive L-Band Microwave Remote Sensing. IEEE Trans. Geosci. Remote Sens. 2016, 54, 3878–3889. [Google Scholar] [CrossRef]
  113. Das, N.N.; Entekhabi, D.; Njoku, E.G.; Shi, J.J.C.; Johnson, J.T.; Colliander, A. Tests of the SMAP Combined Radar and Radiometer Algorithm Using Airborne Field Campaign Observations and Simulated Data. IEEE Trans. Geosci. Remote Sens. 2014, 52, 2018–2028. [Google Scholar] [CrossRef]
  114. Jonard, F.; Bircher, S.; Demontoux, F.; Weihermüller, L.; Razafindratsima, S.; Wigneron, J.-P.; Vereecken, H. Passive L-Band Microwave Remote Sensing of Organic Soil Surface Layers: A Tower-Based Experiment. Remote Sens. 2018, 10, 304. [Google Scholar] [CrossRef] [Green Version]
  115. Hu, S.; Niu, Z.; Chen, Y.; Li, L.; Zhang, H. Global wetlands: Potential distribution, wetland loss, and status. Sci. Total Environ. 2017, 586, 319–327. [Google Scholar] [CrossRef]
  116. Ludwig, C.; Walli, A.; Schleicher, C.; Weichselbaum, J.; Riffler, M. A highly automated algorithm for wetland detection using multi-temporal optical satellite data. Remote Sens. Environ. 2019, 224, 333–351. [Google Scholar] [CrossRef]
  117. Amani, M.; Salehi, B.; Mahdavi, S.; Brisco, B. Spectral analysis of wetlands using multi-source optical satellite imagery. ISPRS J. Photogramm. Remote Sens. 2018, 144, 119–136. [Google Scholar] [CrossRef]
  118. Schuerch, M.; Spencer, T.; Temmerman, S.; Kirwan, M.L.; Wolff, C.; Lincke, D.; McOwen, C.J.; Pickering, M.D.; Reef, R.; Vafeidis, A.T.; et al. Future response of global coastal wetlands to sea-level rise. Nature 2018, 561, 231–234. [Google Scholar] [CrossRef]
  119. Osland, M.J.; Enwright, N.M.; Day, R.H.; Gabler, C.A.; Stagg, C.L.; Grace, J.B. Beyond just sea-level rise: Considering macroclimatic drivers within coastal wetland vulnerability assessments to climate change. Glob. Chang. Biol. 2016, 22, 1–11. [Google Scholar] [CrossRef]
  120. Osland, M.J.; Gabler, C.A.; Grace, J.B.; Day, R.H.; McCoy, M.L.; McLeod, J.L.; From, A.S.; Enwright, N.M.; Feher, L.C.; Stagg, C.L.; et al. Climate and plant controls on soil organic matter in coastal wetlands. Glob. Chang. Biol. 2018, 24, 5361–5379. [Google Scholar] [CrossRef] [PubMed]
  121. Mehvar, S.; Filatova, T.; Sarker, M.H.; Dastgheib, A.; Ranasinghe, R. Climate change-driven losses in ecosystem services of coastal wetlands: A case study in the West coast of Bangladesh. Ocean Coast. Manag. 2019, 169, 273–283. [Google Scholar] [CrossRef]
  122. Quan, N.H.; Toan, T.Q.; Dang, P.D.; Phuong, N.L.; Anh, T.T.H.; Quang, N.X.; Quoc, D.P.; Quoi, L.P.; Hanington, P.; Sea, W.B. Conservation of the Mekong Delta wetlands through hydrological management. Ecol. Res. 2018, 33, 87–103. [Google Scholar] [CrossRef]
  123. Saintilan, N.; Rogers, K.; Kelleway, J.J.; Ens, E.; Sloane, D.R. Climate Change Impacts on the Coastal Wetlands of Australia. Wetlands 2019, 39, 1145–1154. [Google Scholar] [CrossRef]
  124. van Iersel, W.; Straatsma, M.; Addink, E.; Middelkoop, H. Monitoring height and greenness of non-woody floodplain vegetation with UAV time series. ISPRS J. Photogramm. Remote Sens. 2018, 141, 112–123. [Google Scholar] [CrossRef]
  125. Forsberg, B.R.; Hashimoto, Y.; Rosenqvist, Å.; Pellon de Miranda, F. Tectonic fault control of wetland distributions in the Central Amazon revealed by JERS-1 radar imagery. Quat. Int. 2000, 72, 61–66. [Google Scholar] [CrossRef]
  126. Hess, L. Dual-season mapping of wetland inundation and vegetation for the central Amazon basin. Remote Sens. Environ. 2003, 87, 404–428. [Google Scholar] [CrossRef]
  127. Martinez, J.; Letoan, T. Mapping of flood dynamics and spatial distribution of vegetation in the Amazon floodplain using multitemporal SAR data. Remote Sens. Environ. 2007, 108, 209–223. [Google Scholar] [CrossRef]
  128. Costa, M.P.F. Use of SAR satellites for mapping zonation of vegetation communities in the Amazon floodplain. Int. J. Remote Sens. 2004, 25, 1817–1835. [Google Scholar] [CrossRef]
  129. Ferreira-Ferreira, J.; Silva, T.S.F.; Streher, A.S.; Affonso, A.G.; de Almeida Furtado, L.F.; Forsberg, B.R.; Valsecchi, J.; Queiroz, H.L.; de Moraes Novo, E.M.L. Combining ALOS/PALSAR derived vegetation structure and inundation patterns to characterize major vegetation types in the Mamirauá Sustainable Development Reserve, Central Amazon floodplain, Brazil. Wetl. Ecol. Manag. 2014, 23, 41–59. [Google Scholar] [CrossRef]
  130. Sartori, L.R.; Imai, N.N.; Mura, J.C.; Novo, E.M.L.M.; Silva, T.S.F. Mapping Macrophyte Species in the Amazon Floodplain Wetlands Using Fully Polarimetric ALOS/PALSAR Data. IEEE Trans. Geosci. Remote Sens. 2011, 49, 4717–4728. [Google Scholar] [CrossRef]
  131. Cordeiro, C.L.; Rossetti, D.D. Mapping vegetation in a late Quaternary landform of the Amazonian wetlands using object-based image analysis and decision tree classification. Int. J. Remote Sens. 2015, 36, 3397–3422. [Google Scholar] [CrossRef]
  132. Evans, T.L.; Costa, M.; Tomas, W.M.; Camilo, A.R. Large-scale habitat mapping of the Brazilian Pantanal wetland: A synthetic aperture radar approach. Remote Sens. Environ. 2014, 155, 89–108. [Google Scholar] [CrossRef]
  133. Evans, T.L.; Costa, M. Landcover classification of the Lower Nhecolândia subregion of the Brazilian Pantanal Wetlands using ALOS/PALSAR, RADARSAT-2 and ENVISAT/ASAR imagery. Remote Sens. Environ. 2013, 128, 118–137. [Google Scholar] [CrossRef]
  134. Evans, T.L.; Costa, M.; Telmer, K.; Silva, T.S.F. Using ALOS/PALSAR and RADARSAT-2 to Map Land Cover and Seasonal Inundation in the Brazilian Pantanal. IEEE J. Sel. Top. Appl. Earth Obs. Remote Sens. 2010, 3, 560–575. [Google Scholar] [CrossRef]
  135. Betbeder, J.; Gond, V.; Frappart, F.; Baghdadi, N.N.; Briant, G.; Bartholome, E. Mapping of Central Africa Forested Wetlands Using Remote Sensing. IEEE J. Sel. Top. Appl. Earth Obs. Remote Sens. 2014, 7, 531–542. [Google Scholar] [CrossRef] [Green Version]
  136. Rebelo, L.-M. Eco-Hydrological Characterization of Inland Wetlands in Africa Using L-Band SAR. IEEE J. Sel. Top. Appl. Earth Obs. Remote Sens. 2010, 3, 554–559. [Google Scholar] [CrossRef]
  137. Bourgeau-Chavez, L.L.; Kasischke, E.S.; Brunzell, S.M.; Mudd, J.P.; Smith, K.B.; Frick, A.L. Analysis of space-borne SAR data for wetland mapping in Virginia riparian ecosystems. Int. J. Remote Sens. 2001, 22, 3665–3687. [Google Scholar] [CrossRef]
  138. Bourgeau-Chavez, L.L.; Kowalski, K.P.; Carlson Mazur, M.L.; Scarbrough, K.A.; Powell, R.B.; Brooks, C.N.; Huberty, B.; Jenkins, L.K.; Banda, E.C.; Galbraith, D.M.; et al. Mapping invasive Phragmites australis in the coastal Great Lakes with ALOS PALSAR satellite imagery for decision support. J. Great Lakes Res. 2013, 39, 65–77. [Google Scholar] [CrossRef]
  139. Koch, M.; Schmid, T.; Reyes, M.; Gumuzzio, J. Evaluating Full Polarimetric C- and L-Band Data for Mapping Wetland Conditions in a Semi-Arid Environment in Central Spain. IEEE J. Sel. Top. Appl. Earth Obs. Remote Sens. 2012, 5, 1033–1044. [Google Scholar] [CrossRef]
  140. Dabrowska-Zielinska, K.; Budzynska, M.; Tomaszewska, M.; Bartold, M.; Gatkowska, M.; Malek, I.; Turlej, K.; Napiorkowska, M. Monitoring Wetlands Ecosystems Using ALOS PALSAR (L-Band, HV) Supplemented by Optical Data: A Case Study of Biebrza Wetlands in Northeast Poland. Remote Sens. 2014, 6, 1605–1633. [Google Scholar] [CrossRef] [Green Version]
  141. Fu, B.; Wang, Y.; Campbell, A.; Li, Y.; Zhang, B.; Yin, S.; Xing, Z.; Jin, X. Comparison of object-based and pixel-based Random Forest algorithm for wetland vegetation mapping using high spatial resolution GF-1 and SAR data. Ecol. Indic. 2017, 73, 105–117. [Google Scholar] [CrossRef]
  142. Whitcomb, J.; Moghaddam, M.; McDonald, K.; Kellndorfer, J.; Podest, E. Mapping vegetated wetlands of Alaska using L-band radar satellite imagery. Can. J. Remote Sens. 2009, 20. [Google Scholar] [CrossRef]
  143. Pistolesi, L.I.; Ni-Meister, W.; McDonald, K.C. Mapping wetlands in the Hudson Highlands ecoregion with ALOS PALSAR: An effort to identify potential swamp forest habitat for golden-winged warblers. Wetl. Ecol. Manag. 2015, 23, 95–112. [Google Scholar] [CrossRef]
  144. Bian, H.; Yan, T.; Zhang, Z.; He, C.; Sheng, L. Mapping deciduous broad-leaved forested swamps using ALOS/Palsar data. Chin. Geogr. Sci. 2016, 26, 352–365. [Google Scholar] [CrossRef] [Green Version]
  145. Wei, G.-W.; Chen, Y.; Sun, X.-S.; Chen, Y.-H.; Luo, F.-L.; Yu, F.-H. Growth responses of eight wetland species to water level fluctuation with different ranges and frequencies. PLoS ONE 2019, 14, e0220231. [Google Scholar] [CrossRef]
  146. Wdowinski, S.; Kim, S.-W.; Amelung, F.; Dixon, T.H.; Miralles-Wilhelm, F.; Sonenshein, R. Space-based detection of wetlands’ surface water level changes from L-band SAR interferometry. Remote Sens. Environ. 2008, 112, 681–696. [Google Scholar] [CrossRef]
  147. Lu, Z.; Kim, J.-W.; Lee, H.; Shum, C.K.; Duan, J.; Ibaraki, M.; Akyilmaz, O.; Read, C.-H. Helmand River Hydrologic Studies Using ALOS PALSAR InSAR and ENVISAT Altimetry. Mar. Geod. 2009, 32, 320–333. [Google Scholar] [CrossRef]
  148. Yuan, T.; Lee, H.; Jung, H.C. Toward Estimating Wetland Water Level Changes Based on Hydrological Sensitivity Analysis of PALSAR Backscattering Coefficients over Different Vegetation Fields. Remote Sens. 2015, 7, 3153–3183. [Google Scholar] [CrossRef] [Green Version]
  149. Zhu, X.; Chen, F.; Guo, H. Reconstruction of the Water Cultivation Paleoenvironment Dating Back to the Han and Tang Dynasties Surrounding the Yangguan Frontier Pass Using X- and L-Band SAR Data. Remote Sens. 2018, 10, 1536. [Google Scholar] [CrossRef] [Green Version]
  150. Temmerman, S.; Moonen, P.; Schoelynck, J.; Govers, G.; Bouma, T.J. Impact of vegetation die-off on spatial flow patterns over a tidal marsh. Geophys. Res. Lett. 2012, 39. [Google Scholar] [CrossRef] [Green Version]
  151. Torio, D.D.; Chmura, G.L. Assessing Coastal Squeeze of Tidal Wetlands. J. Coast. Res. 2013, 29, 1049–1061. [Google Scholar] [CrossRef]
  152. Callaway, J.C.; Borgnis, E.L.; Turner, R.E.; Milan, C.S. Carbon Sequestration and Sediment Accretion in San Francisco Bay Tidal Wetlands. Estuaries Coasts 2012, 35, 1163–1181. [Google Scholar] [CrossRef]
  153. Vo, Q.T.; Kuenzer, C.; Vo, Q.M.; Moder, F.; Oppelt, N. Review of valuation methods for mangrove ecosystem services. Ecol. Indic. 2012, 23, 431–446. [Google Scholar] [CrossRef]
  154. Wolanski, E.; Spagnol, S.; Thomas, S.; Moore, K.; Alongi, D.M.; Trott, L.; Davidson, A. Modelling and Visualizing the Fate of Shrimp Pond Effluent in a Mangrove-fringed Tidal Creek. Estuar. Coast. Shelf Sci. 2000, 50, 85–97. [Google Scholar] [CrossRef]
  155. Valiela, I.; Bowen, J.L.; York, J.K. Mangrove Forests: One of the World’s Threatened Major Tropical EnvironmentsAt least 35% of the area of mangrove forests has been lost in the past two decades, losses that exceed those for tropical rain forests and coral reefs, two other well-known threatened environments. BioScience 2001, 51, 807–815. [Google Scholar] [CrossRef] [Green Version]
  156. Romañach, S.S.; DeAngelis, D.L.; Koh, H.L.; Li, Y.; Teh, S.Y.; Raja Barizan, R.S.; Zhai, L. Conservation and restoration of mangroves: Global status, perspectives, and prognosis. Ocean Coast. Manag. 2018, 154, 72–82. [Google Scholar] [CrossRef]
  157. Pasqualini, V.; Iltis, J.; Dessay, N.; Lointier, M.; Guelorget, O.; Polidori, L. Mangrove mapping in North-Western Madagascar using SPOT-XS and SIR-C radar data. Hydrobiologia 1999, 413, 127–133. [Google Scholar] [CrossRef]
  158. Heumann, B.W. Satellite remote sensing of mangrove forests: Recent advances and future opportunities. Prog. Phys. Geogr. Earth Environ. 2011, 35, 87–108. [Google Scholar] [CrossRef]
  159. Santiago, F.F.D.; Kovacs, J.M.; Lafrance, P. An object-oriented classification method for mapping mangroves in Guinea, West Africa, using multipolarized ALOS PALSAR L-band data. Int. J. Remote Sens. 2013, 34, 563–586. [Google Scholar] [CrossRef]
  160. Lucas, R.M.; Mitchell, A.L.; Rosenqvist, A.; Proisy, C.; Melius, A.; Ticehurst, C. The potential of L-band SAR for quantifying mangrove characteristics and change: Case studies from the tropics. Aquatic Conserv: Mar. Freshw. Ecosyst. 2007, 17, 245–264. [Google Scholar] [CrossRef]
  161. Nascimento, W.R.; Souza-Filho, P.W.M.; Proisy, C.; Lucas, R.M.; Rosenqvist, A. Mapping changes in the largest continuous Amazonian mangrove belt using object-based classification of multisensor satellite imagery. Estuar. Coast. Shelf Sci. 2013, 117, 83–93. [Google Scholar] [CrossRef]
  162. Cornforth, W.; Fatoyinbo, T.; Freemantle, T.; Pettorelli, N. Advanced Land Observing Satellite Phased Array Type L-Band SAR (ALOS PALSAR) to Inform the Conservation of Mangroves: Sundarbans as a Case Study. Remote Sens. 2013, 5, 224–237. [Google Scholar] [CrossRef] [Green Version]
  163. Pham, T.D.; Bui, D.T.; Yoshino, K.; Le, N.N. Optimized rule-based logistic model tree algorithm for mapping mangrove species using ALOS PALSAR imagery and GIS in the tropical region. Environ. Earth Sci. 2018, 77, 159. [Google Scholar] [CrossRef]
  164. Pham, T.D.; Yoshino, K. Aboveground biomass estimation of mangrove species using ALOS-2 PALSAR imagery in Hai Phong City, Vietnam. J. Appl. Remote Sens. 2017, 11, 026010. [Google Scholar] [CrossRef]
  165. Thomas, N.; Lucas, R.; Bunting, P.; Hardy, A.; Rosenqvist, A.; Simard, M. Distribution and drivers of global mangrove forest change, 1996–2010. PLoS ONE 2017, 12, e0179302. [Google Scholar] [CrossRef] [Green Version]
  166. Zhang, M.; Li, Z.; Tian, B.; Zhou, J.; Zeng, J. A method for monitoring hydrological conditions beneath herbaceous wetlands using multi-temporal ALOS PALSAR coherence data. Remote Sens. Lett. 2015, 6, 618–627. [Google Scholar] [CrossRef]
  167. Zhang, M.; Tian, B.; Li, Z.; Zhou, J. Modelling temporal variations in microwave backscattering from reed marshes. Int. J. Remote Sens. 2017, 38, 6930–6944. [Google Scholar] [CrossRef]
  168. Hess, L.L.; Melack, J.M.; Filoso, S.; Wang, Y. Delineation of inundated area and vegetation along the Amazon floodplain with the SIR-C synthetic aperture radar. IEEE Trans. Geosci. Remote Sens. 1995, 33, 896–904. [Google Scholar] [CrossRef] [Green Version]
  169. Pope, K.O.; Rejmankova, E.; Paris, J.F.; Woodruff, R. Detecting seasonal flooding cycles in marshes of the Yucatan Peninsula with SIR-C polarimetric radar imagery. Remote Sens. Environ. 1997, 59, 157–166. [Google Scholar] [CrossRef]
  170. Hess, L.L.; Melack, J.M. Remote sensing of vegetation and flooding on Magela Creek Floodplain (Northern Territory, Australia) with the SIR-C synthetic aperture radar. Hydrobiologia 2003, 500, 65–82. [Google Scholar] [CrossRef]
  171. Rosenqvist, Å.; Forsberg, B.R.; Pimentel, T.; Rauste, Y.A.; Richey, J.E. The use of spaceborne radar data to model inundation patterns and trace gas emissions in the central Amazon floodplain. Int. J. Remote Sens. 2002, 23, 1303–1328. [Google Scholar] [CrossRef]
  172. Yulianto, F.; Sofan, P.; Zubaidah, A.; Sukowati, K.A.D.; Pasaribu, J.M.; Khomarudin, M.R. Detecting areas affected by flood using multi-temporal ALOS PALSAR remotely sensed data in Karawang, West Java, Indonesia. Nat. Hazards 2015, 77, 959–985. [Google Scholar] [CrossRef]
  173. Manavalan, R.; Rao, Y.S.; Krishna Mohan, B. Comparative flood area analysis of C-band VH, VV, and L-band HH polarizations SAR data. Int. J. Remote Sens. 2017, 38, 4645–4654. [Google Scholar] [CrossRef]
  174. Alahacoon, N.; Matheswaran, K.; Pani, P.; Amarnath, G. A Decadal Historical Satellite Data and Rainfall Trend Analysis (2001–2016) for Flood Hazard Mapping in Sri Lanka. Remote Sens. 2018, 10, 448. [Google Scholar] [CrossRef] [Green Version]
  175. Ward, D.P.; Petty, A.; Setterfield, S.A.; Douglas, M.M.; Ferdinands, K.; Hamilton, S.K.; Phinn, S. Floodplain inundation and vegetation dynamics in the Alligator Rivers region (Kakadu) of northern Australia assessed using optical and radar remote sensing. Remote Sens. Environ. 2014, 147, 43–55. [Google Scholar] [CrossRef]
  176. De Grandi, G.; Mayaux, P.; Rauste, Y.; Rosenqvist, A.; Simard, M.; Saatchi, S.S. The Global Rain Forest Mapping Project JERS-1 radar mosaic of tropical Africa: Development and product characterization aspects. IEEE Trans. Geosci. Remote Sens. 2000, 38, 2218–2233. [Google Scholar] [CrossRef]
  177. Simard, M.; Saatchi, S.S.; De Grandi, G. The use of decision tree and multiscale texture for classification of JERS-1 SAR data over tropical forest. IEEE Trans. Geosci. Remote Sens. 2000, 38, 2310–2321. [Google Scholar] [CrossRef] [Green Version]
  178. Kobayashi, S.; Widyorini, R.; Kawai, S.; Omura, Y.; Sanga-Ngoie, K.; Supriadid, B. Backscattering characteristics of L-band polarimetric and optical satellite imagery over planted acacia forests in Sumatra, Indonesia. J. Appl. Remote Sens. 2012, 6, 063525. [Google Scholar] [CrossRef]
  179. Garg, A.; Singh, D. Development of an Efficient Contextual Algorithm for Discrimination of Tall Vegetation and Urban for PALSAR Data. IEEE Trans. Geosci. Remote Sens. 2018, 56, 3413–3420. [Google Scholar] [CrossRef]
  180. Müller, M.U.; Shepherd, J.D.; Dymond, J.R. Support vector machine classification of woody patches in New Zealand from synthetic aperture radar and optical data, with LiDAR training. J. Appl. Remote Sens. 2015, 9, 095984. [Google Scholar] [CrossRef] [Green Version]
  181. Watanabe, M.; Motohka, T.; Shiraishi, T.; Thapa, R.B.; Yonezawa, C.; Nakamura, K.; Shimada, M. Multitemporal Fluctuations in L-Band Backscatter From a Japanese Forest. IEEE Trans. Geosci. Remote Sens. 2015, 53, 5799–5813. [Google Scholar] [CrossRef]
  182. Shimada, M.; Itoh, T.; Motooka, T.; Watanabe, M.; Shiraishi, T.; Thapa, R.; Lucas, R. New global forest/non-forest maps from ALOS PALSAR data (2007–2010). Remote Sens. Environ. 2014, 155, 13–31. [Google Scholar] [CrossRef]
  183. Qin, Y.; Xiao, X.; Dong, J.; Zhang, G.; Roy, P.S.; Joshi, P.K.; Gilani, H.; Murthy, M.S.R.; Jin, C.; Wang, J.; et al. Mapping forests in monsoon Asia with ALOS PALSAR 50-m mosaic images and MODIS imagery in 2010. Sci. Rep. 2016, 6, 1–10. [Google Scholar] [CrossRef]
  184. Chen, B.; Xiao, X.; Ye, H.; Ma, J.; Doughty, R.; Li, X.; Zhao, B.; Wu, Z.; Sun, R.; Dong, J.; et al. Mapping Forest and Their Spatial–Temporal Changes From 2007 to 2015 in Tropical Hainan Island by Integrating ALOS/ALOS-2 L-Band SAR and Landsat Optical Images. IEEE J. Sel. Top. Appl. Earth Obs. Remote Sens. 2018, 11, 852–867. [Google Scholar] [CrossRef]
  185. Motohka, T.; Shimada, M.; Uryu, Y.; Setiabudi, B. Using time series PALSAR gamma nought mosaics for automatic detection of tropical deforestation: A test study in Riau, Indonesia. Remote Sens. Environ. 2014, 155, 79–88. [Google Scholar] [CrossRef]
  186. Khati, U.; Kumar, V.; Bandyopadhyay, D.; Musthafa, M.; Singh, G. Identification of forest cutting in managed forest of Haldwani, India using ALOS-2/PALSAR-2 SAR data. J. Environ. Manag. 2018, 213, 503–512. [Google Scholar] [CrossRef]
  187. Avtar, R.; Sawada, H.; Takeuchi, W.; Singh, G. Characterization of forests and deforestation in Cambodia using ALOS/PALSAR observation. Geocarto Int. 2012, 27, 119–137. [Google Scholar] [CrossRef]
  188. Mermoz, S.; Le Toan, T. Forest Disturbances and Regrowth Assessment Using ALOS PALSAR Data from 2007 to 2010 in Vietnam, Cambodia and Lao PDR. Remote Sens. 2016, 8, 217. [Google Scholar] [CrossRef] [Green Version]
  189. Fransson, J.E.S. Estimation of stem volume in boreal forests using ERS-1 C- and JERS-1 L-band SAR data. Int. J. Remote Sens. 1999, 20, 123–137. [Google Scholar] [CrossRef]
  190. Zhang, Y.; He, C.; Xu, X.; Chen, D. Forest Vertical Parameter Estimation Using PolInSAR Imagery Based on Radiometric Correction. IJGI 2016, 5, 186. [Google Scholar] [CrossRef] [Green Version]
  191. Joshi, N.; Mitchard, E.; Schumacher, J.; Johannsen, V.; Saatchi, S.; Fensholt, R. L-Band SAR Backscatter Related to Forest Cover, Height and Aboveground Biomass at Multiple Spatial Scales across Denmark. Remote Sens. 2015, 7, 4442–4472. [Google Scholar] [CrossRef] [Green Version]
  192. Urbazaev, M.; Cremer, F.; Migliavacca, M.; Reichstein, M.; Schmullius, C.; Thiel, C. Potential of Multi-Temporal ALOS-2 PALSAR-2 ScanSAR Data for Vegetation Height Estimation in Tropical Forests of Mexico. Remote Sens. 2018, 10, 1277. [Google Scholar] [CrossRef] [Green Version]
  193. Miranda, F.P.; Fonseca, L.E.N.; Carr, J.R. Semivariogram textural classification of JERS-1 (Fuyo-1) SAR data obtained over a flooded area of the Amazon rainforest. Int. J. Remote Sens. 1998, 19, 549–556. [Google Scholar] [CrossRef]
  194. Rakwatin, P.; Longépé, N.; Isoguchi, O.; Shimada, M.; Uryu, Y.; Takeuchi, W. Using multiscale texture information from ALOS PALSAR to map tropical forest. Int. J. Remote Sens. 2012, 33, 7727–7746. [Google Scholar] [CrossRef]
  195. Middinti, S.; Jha, C.S.; Reddy, T.B. Forest type classification with combination of advanced polarimetric decompositions and textures of L-band synthetic aperture radar data. J. Appl. Remote Sens 2017, 11, 016035. [Google Scholar] [CrossRef]
  196. Cartus, O.; Santoro, M.; Kellndorfer, J. Mapping forest aboveground biomass in the Northeastern United States with ALOS PALSAR dual-polarization L-band. Remote Sens. Environ. 2012, 124, 466–478. [Google Scholar] [CrossRef]
  197. Michelakis, D.; Stuart, N.; Brolly, M.; Woodhouse, I.H.; Lopez, G.; Linares, V. Estimation of Woody Biomass of Pine Savanna Woodlands From ALOS PALSAR Imagery. IEEE J. Sel. Top. Appl. Earth Obs. Remote Sens. 2015, 8, 244–254. [Google Scholar] [CrossRef]
  198. Mitchard, E.T.A.; Saatchi, S.S.; Lewis, S.L.; Feldpausch, T.R.; Woodhouse, I.H.; Sonké, B.; Rowland, C.; Meir, P. Measuring biomass changes due to woody encroachment and deforestation/degradation in a forest–savanna boundary region of central Africa using multi-temporal L-band radar backscatter. Remote Sens. Environ. 2011, 115, 2861–2873. [Google Scholar] [CrossRef] [Green Version]
  199. Suzuki, R.; Kim, Y.; Ishii, R. Sensitivity of the backscatter intensity of ALOS/PALSAR to the above-ground biomass and other biophysical parameters of boreal forest in Alaska. Polar Sci. 2013, 7, 100–112. [Google Scholar] [CrossRef] [Green Version]
  200. Hamdan, O.; Hasmadi, I.M.; Aziz, H.K.; Norizah, K.; Zulhaidi, M.H. L-Band saturation level for aboveground biomass of dipterocarp forests in peninsular Malaysia. J. Trop. For. Sci. 2015, 27, 388–399. [Google Scholar]
  201. Basuki, T.M.; Skidmore, A.K.; Hussin, Y.A.; Van Duren, I. Estimating tropical forest biomass more accurately by integrating ALOS PALSAR and Landsat-7 ETM+ data. Int. J. Remote Sens. 2013, 34, 4871–4888. [Google Scholar] [CrossRef] [Green Version]
  202. Peregon, A.; Yamagata, Y. The use of ALOS/PALSAR backscatter to estimate above-ground forest biomass: A case study in Western Siberia. Remote Sens. Environ. 2013, 137, 139–146. [Google Scholar] [CrossRef]
  203. Tanase, M.A.; Panciera, R.; Lowell, K.; Tian, S.; Garcia-Martin, A.; Walker, J.P. Sensitivity of L-Band Radar Backscatter to Forest Biomass in Semiarid Environments: A Comparative Analysis of Parametric and Nonparametric Models. IEEE Trans. Geosci. Remote Sens. 2014, 52, 4671–4685. [Google Scholar] [CrossRef]
  204. Luckman, A.; Baker, J.; Honzák, M.; Lucas, R. Tropical Forest Biomass Density Estimation Using JERS-1 SAR: Seasonal Variation, Confidence Limits, and Application to Image Mosaics. Remote Sens. Environ. 1998, 63, 126–139. [Google Scholar] [CrossRef]
  205. Bispo, P.C.; Santos, J.R.; Valeriano, M.M.; Touzi, R.; Seifert, F.M. Integration of Polarimetric PALSAR Attributes and Local Geomorphometric Variables Derived from SRTM for Forest Biomass Modeling in Central Amazonia. Can. J. Remote Sens. 2014, 40, 26–42. [Google Scholar] [CrossRef]
  206. Ni, W.; Zhang, Z.; Sun, G.; Guo, Z.; He, Y. The Penetration Depth Derived from the Synthesis of ALOS/PALSAR InSAR Data and ASTER GDEM for the Mapping of Forest Biomass. Remote Sens. 2014, 6, 7303–7319. [Google Scholar] [CrossRef] [Green Version]
  207. Rodríguez-Veiga, P.; Saatchi, S.; Tansey, K.; Balzter, H. Magnitude, spatial distribution and uncertainty of forest biomass stocks in Mexico. Remote Sens. Environ. 2016, 183, 265–281. [Google Scholar] [CrossRef] [Green Version]
  208. Carreiras, J.M.B.; Vasconcelos, M.J.; Lucas, R.M. Understanding the relationship between aboveground biomass and ALOS PALSAR data in the forests of Guinea-Bissau (West Africa). Remote Sens. Environ. 2012, 121, 426–442. [Google Scholar] [CrossRef]
  209. Guan, K.; Li, Z.; Rao, L.N.; Gao, F.; Xie, D.; Hien, N.T.; Zeng, Z. Mapping Paddy Rice Area and Yields Over Thai Binh Province in Viet Nam From MODIS, Landsat, and ALOS-2/PALSAR-2. IEEE J. Sel. Top. Appl. Earth Obs. Remote Sens. 2018, 11, 2238–2252. [Google Scholar] [CrossRef]
  210. Dabrowska-Zielinska, K.; Inoue, Y.; Kowalik, W.; Gruszczynska, M. Inferring the effect of plant and soil variables on C- and L-band SAR backscatter over agricultural fields, based on model analysis. Adv. Space Res. 2007, 39, 139–148. [Google Scholar] [CrossRef]
  211. Fieuzal, R.; Baup, F. Estimation of leaf area index and crop height of sunflowers using multi-temporal optical and SAR satellite data. Int. J. Remote Sens. 2016, 37, 2780–2809. [Google Scholar] [CrossRef]
  212. Wang, X.; Ge, L.; Li, X. Pasture Monitoring Using SAR with COSMO-SkyMed, ENVISAT ASAR, and ALOS PALSAR in Otway, Australia. Remote Sens. 2013, 5, 3611–3636. [Google Scholar] [CrossRef] [Green Version]
  213. Li, L.; Dong, J.; Njeudeng Tenku, S.; Xiao, X. Mapping Oil Palm Plantations in Cameroon Using PALSAR 50-m Orthorectified Mosaic Images. Remote Sens. 2015, 7, 1206–1224. [Google Scholar] [CrossRef] [Green Version]
  214. Mehta, R.L.; Parihar, N.; Sinha, A.; Shastri, B.P.; Chakraborty, M. Discrimination between Babul plantations and Mustard crop using Polarimetric C- and L- band data. J Indian Soc. Remote Sens. 2014, 42, 439–444. [Google Scholar] [CrossRef]
  215. Saatchi, S.S.; Nelson, B.; Podest, E.; Holt, J. Mapping land cover types in the Amazon Basin using 1 km JERS-1 mosaic. Int. J. Remote Sens. 2000, 21, 1201–1234. [Google Scholar] [CrossRef] [Green Version]
  216. Li, G.; Lu, D.; Moran, E.; Dutra, L.; Batistella, M. A comparative analysis of ALOS PALSAR L-band and RADARSAT-2 C-band data for land-cover classification in a tropical moist region. ISPRS J. Photogramm. Remote Sens. 2012, 70, 26–38. [Google Scholar] [CrossRef] [Green Version]
  217. Jin, H.; Mountrakis, G.; Stehman, S.V. Assessing integration of intensity, polarimetric scattering, interferometric coherence and spatial texture metrics in PALSAR-derived land cover classification. ISPRS J. Photogramm. Remote Sens. 2014, 98, 70–84. [Google Scholar] [CrossRef]
  218. De Alban, J.; Connette, G.; Oswald, P.; Webb, E. Combined Landsat and L-Band SAR Data Improves Land Cover Classification and Change Detection in Dynamic Tropical Landscapes. Remote Sens. 2018, 10, 306. [Google Scholar] [CrossRef] [Green Version]
  219. Ali, M.Z.; Qazi, W.; Aslam, N. A comparative study of ALOS-2 PALSAR and landsat-8 imagery for land cover classification using maximum likelihood classifier. Egypt. J. Remote Sens. Space Sci. 2018, 21, S29–S35. [Google Scholar] [CrossRef]
  220. Symeonakis, E.; Higginbottom, T.; Petroulaki, K.; Rabe, A. Optimisation of Savannah Land Cover Characterisation with Optical and SAR Data. Remote Sens. 2018, 10, 499. [Google Scholar] [CrossRef] [Green Version]
  221. Van Trung, N.; Choi, J.-H.; Won, J.-S. A Land Cover Variation Model of Water Level for the Floodplain of Tonle Sap, Cambodia, Derived From ALOS PALSAR and MODIS Data. IEEE J. Sel. Top. Appl. Earth Obs. Remote Sens. 2013, 6, 2238–2253. [Google Scholar] [CrossRef]
  222. Trisasongko, B.H.; Panuju, D.R.; Paull, D.J.; Jia, X.; Griffin, A.L. Comparing six pixel-wise classifiers for tropical rural land cover mapping using four forms of fully polarimetric SAR data. Int. J. Remote Sens. 2017, 38, 3274–3293. [Google Scholar] [CrossRef]
  223. Zribi, M.; Muddu, S.; Bousbih, S.; Al Bitar, A.; Tomer, S.K.; Baghdadi, N.; Bandyopadhyay, S. Analysis of L-Band SAR Data for Soil Moisture Estimations over Agricultural Areas in the Tropics. Remote Sens. 2019, 11, 1122. [Google Scholar] [CrossRef] [Green Version]
  224. Miura, S.H.; Kankaku, Y.; Motohka, T.; Yamamoto, K.; Suzuki, S. ALOS-4 current status. In Proceedings of the Sensors, Systems, and Next-Generation Satellites XXIII, Strasbourg, France, 9–12 September 2019; International Society for Optics and Photonics: Bellingham, WA, USA, 2019; Vol. 11151, p. 1115105. [Google Scholar]
  225. Hoffman, J.P.; Shaffer, S.; Perkovic-Martin, D. NASA L-SAR instrument for the NISAR (NASA-ISRO) Synthetic Aperture Radar mission. In Proceedings of the Earth Observing Missions and Sensors: Development, Implementation, and Characterization IV, New Delhi, India, 4–7 April 2016; International Society for Optics and Photonics: Bellingham, WA, USA, 2016; Volume 9881, p. 988108. [Google Scholar]
  226. Ahmed, N.; Underwood, C.; Monostatic, C.W. SAR Concept for Microsatellites. In Proceedings of the 8th European Conference on Synthetic Aperture Radar, Aachen, Germany, 7–10 June 2010; pp. 1–4. [Google Scholar]
  227. Urata, K.N.; Sri Sumantyo, J.T.; Santosa, C.E.; Viscor, T. Development of an L-Band SAR Microsatellite Antenna for Earth Observation. Aerospace 2018, 5, 128. [Google Scholar] [CrossRef] [Green Version]
  228. Frey, O.; Meier, E. Analyzing Tomographic SAR Data of a Forest With Respect to Frequency, Polarization, and Focusing Technique. IEEE Trans. Geosci. Remote Sens. 2011, 49, 3648–3659. [Google Scholar] [CrossRef] [Green Version]
  229. Bunting, P.; Rosenqvist, A.; Lucas, R.M.; Rebelo, L.-M.; Hilarides, L.; Thomas, N.; Hardy, A.; Itoh, T.; Shimada, M.; Finlayson, C.M. The Global Mangrove Watch—A New 2010 Global Baseline of Mangrove Extent. Remote Sens. 2018, 10, 1669. [Google Scholar] [CrossRef] [Green Version]
  230. Lymburner, L.; Bunting, P.; Lucas, R.; Scarth, P.; Alam, I.; Phillips, C.; Ticehurst, C.; Held, A. Mapping the multi-decadal mangrove dynamics of the Australian coastline. Remote Sens. Environ. 2020, 238, 111185. [Google Scholar] [CrossRef]
  231. Shimada, M.; Ohtaki, T. Generating Large-Scale High-Quality SAR Mosaic Datasets: Application to PALSAR Data for Global Monitoring. IEEE J. Sel. Top. Appl. Earth Obs. Remote Sens. 2010, 3, 637–656. [Google Scholar] [CrossRef]
  232. Shimada, M.; Itoh, T.; Motooka, T. Regenerated ALOS-2/PALSAR-2 global mosaics 2016 and 2014/2015 for forest observations. In Proceedings of the 2017 IEEE International Geoscience and Remote Sensing Symposium (IGARSS), Fort Worth, TX, USA, 23–28 July 2017; pp. 2454–2457. [Google Scholar]
  233. Shimada, M.; Itoh, T.; Motooka, T.; Watanabe, M.; Thapa, R. Generation of the first PALSAR-2 global mosaic 2014/2015 and change detection between 2007 and 2015 using the PALSAR and PALSAR-2. In Proceedings of the 2016 IEEE International Geoscience and Remote Sensing Symposium (IGARSS), Beijing, China, 10–15 July 2016; pp. 3871–3872. [Google Scholar]
Figure 1. Activities and impacts in the coastal zone (individual symbols’ source: courtesy of the Integration and Application Network, University of Maryland Center for Environmental Science).
Remotesensing 12 02228 g001
Figure 2. Remote sensing of coastal environments for various land- and water-related applications. The boxes on the left side of the listings indicate the suitability of active microwave (for X-, C-, and L-band SAR, see asterisk symbol) and optical data for the different coastal applications. The categories in bold text in the listings are relevant to L-band.
Remotesensing 12 02228 g002
Figure 3. Radar backscattering mechanisms for different SAR wavelengths: X- and C-band (top) and L-band (bottom).
Remotesensing 12 02228 g003
Figure 4. Radar backscattering mechanisms for forest, wetland and soil surfaces. (a,b,g,h): Non-flooded condition; signal scattering in the crown and on the ground. (cf,i): submerged wetland/open water; strong double-bounce reflection between the tree trunks and the water surface. (gi): Ground surface in wet (g), dry (h) and flooded conditions (i). Partly modified according to Lu and Kwoun [34].
Remotesensing 12 02228 g004
Figure 5. Large image: appearance of mangroves for a coastal site in Borneo, Indonesia in an L-band Synthetic Aperture Radar (SAR) image. Image data: ALOS-2/PALSAR-2 Fine Beam Double polarization (FBD) mode. Zoom boxes on the right side: Top images: Dual-pol L-band SAR image in HH and HV polarization and its ratio (HH/HV) in comparison with bottom images: optical multispectral satellite data (Sentinel-2) in Visible (VIS) true color, VIS-Near-InfraRed (NIR) false color and Normalized Difference Vegetation Index (NDVI).
Remotesensing 12 02228 g005
Figure 6. Timeline of inactive and active spaceborne SAR instruments with different wavelengths (X-, C-, L- and S-band).
Remotesensing 12 02228 g006
Figure 7. Number of reviewed studies for the relevant spaceborne L-band SAR systems.
Remotesensing 12 02228 g007
Figure 8. Number of reviewed studies with synergetic L-band SAR and optical remote sensing data.
Remotesensing 12 02228 g008
Figure 9. Number of reviewed studies with synergetic use of L-band SAR and shorter wavelength (C-band and X-band) SAR systems.
Remotesensing 12 02228 g009
Figure 10. Number of reviewed research articles per research focus.
Remotesensing 12 02228 g010
Table 1. Typical frequency bands of spaceborne SAR systems and their potential for coastal land applications.
Frequency BandX-bandC-bandL-bandP-band
Wavelength 2.4–3.8 cm3.8–7.5 cm15–30 cm30–100 cm
Frequency 8–12 GHz4–8 GHz1–2 GHz0.3–1 GHz
Potential for coastal land applicationsHigh-resolution mapping,
urban,
agriculture
Agriculture,
forestry,
hydrology
Vegetation,
forestry,
soil moisture,
biomass
Vegetation, biomass
SensorsTerraSAR-X, Tandem-X,
CosmoSky-Med
Envisat-ASAR
Radarsat-2
Sentinel-1
JERS-1
ALOS/PALSAR
ALOS-2/PALSAR-2
Launch of BIOMASS (ESA) in 2021 *
* [66]. SAR: Synthetic Aperture Radar; ASAR: Advanced Synthetic Aperture Radar; JERS: Japanese Earth Resources Satellite; ALOS: Advanced Land Observing Satellites; PALSAR: Phased Array L-band Synthetic Aperture Radar; ESA: European Space Agency.
Table 2. Spaceborne L-band SAR imaging systems. Data sources: (1) Observing Systems Capability Analysis and Review Tool (OSCAR), developed by the World Meteorological Organization (WMO); (2) Earth Observation Data Portal (developed by ESA). H: horizontal and V: vertical polarizations.
InstrumentPlatformWavelengthPolarizationRange ResolutionSwath WidthRevisit TimeAgencyLaunch DateEnd of Mission
SARSeaSat23.5 cm *HH *25 m * 100 km *10 min burst per orbit *NASA19781978
SIR-AOSTA-1/STS-223.5 cm *HH *40 m * 50 km *n/aNASA19811981
SIR-BOSTA-3/STS-41G23.5 cm *HH *16–58 m * 20–40 km *n/aNASA19841984
SIR-C/XSTS-59, STS-6823.5 cm ***HH, HV,
VH, VV ***
13–26 m *15–90 km *1 day §§NASA19941994
SARJERS-123.5 cm *HH *18 m *75 km *44 days *JAXA19921998
PALSARALOS23.62 cm *HH, HV, VH, VV **7–100 m 20–350 km 46 days *JAXA20062011
PALSAR-2ALOS-222.9 cm *HH, HV, VH, VV **1–100 m25–350 km14 days *JAXA20142020 2
PALSAR-3ALOS-423.5 cm §HH, HV, VH, VV §1–25 m §35–700 km §14 days §JAXA2020 12027 2
SAR-LSAOCOM-1A/1B
SAOCOM-2A/2B
23.5 cmHH, HV, VH, VV ***10–100 m170–320 km*16 days/
8 days in constellation*
CONAE2018/2020 1
20201/2020 1
20252/2025 2
20252/2025 2
§- Source: https://www.eorc.jaxa.jp/research/ra/2nd_ra_eo/material/APPENDIX6_ALOS-4.pdf. §§-Source: Freeman et al. [94]. ****- Source: https://global.jaxa.jp/projects/sat/alos4/; ***- Source: Guo [95]; **- Source: JAXA (eorc.jaxa.jp); *- Source: https://directory.eoportal.org/; 1-planned; 2-expected.

