1. Introduction
In coastal physical modeling, the estimation of synthetic parameters of sea states, such as significant height, either peak or significant wave period, and propagation direction, is one of the main tasks (see, e.g., in [
1,
2,
3]). Their estimation is a preliminary action for all activities typically carried out within the frame of experimental investigations. Indeed, whatever the aims of the tests (either related to coastal risk assessment, see, e.g., in [
4,
5,
6], or coastal structures testing, see, e.g., in [
3]), the incident waves represent the main forcing to be reproduced.
Wave parameters are usually inferred from data collected employing either capacitive or resistive Eulerian probes (see, e.g., in [
7]) characterized by simple operating principles and easy-to-build supporting frames. They are mainly used because they allow a reliable measure of the free surface elevation in a Eulerian reference frame and also for their relative simplicity. Nevertheless, their intrusiveness is not negligible as they could perturb the investigated wave field, especially in large wave tanks due to the supporting frames for instruments positioning and sensors themselves.
To address these problems, the research is turning to remote sensing techniques also in laboratory environments. They are non-intrusive and allow wave field measurement in wide areas, by using well-established instruments experimented in the open sea in indoor laboratories. Allis et al. [
8] have measured waves generated in a wave flume (40 m long and 0.6 m wide) by using lasers, validating the data with a set of eight capacitive probes installed along the central axis of the wave flume. Water was seeded with kaolinite powder to improve the water turbidity and enhance the reflectance of laser in water. Blenkinsopp et al. [
9] found that the differences between the measurements performed by the laser and those by capacitive electrodes were of the order of 5 mm, in terms of root mean square error (RMSE), at least for wave height up to 0.3 m.
Generally speaking, past research works highlighted the needing for additives to adjust water turbidity. This is still a limit, especially when the technique is applied in large wave tanks that would require large quantities of such additives. Furthermore, kaolinite powder settles in a relatively short time by losing its usefulness as a turbidity intensifier and by reducing the time window for carrying out wave measurements. After sedimentation, the additive powder contaminates materials laying on the bottom of the wave tank and it could affect the model behavior in sediment transport. The use of some additives could damage some important elements of the hydraulic systems of the experimental facilities (i.e., pumps or seals).
Stereoscopy could be a good alternative: it has been used for sea state characterization since 1939 when Schumacher and Defant [
10] performed some acquisitions from moving boats. This technique was soon abandoned due to the high computational effort required to obtain significant results. Some decades later, the advent of digital photography has stimulated the development of this field of applied research. Shemdin et al. [
11] obtained wave direction from images captured by optical sensors installed on an oceanographic offshore tower, using image processing and spectral analysis techniques. Optical sensors had also been exploited to estimate sea current direction and speed [
12], shoreline position [
13,
14], run-up levels [
15], bathymetric data [
16], for bathymetry inversion [
17,
18], and beach resilience evaluation [
19].
A critical step was found to be the passage from the acquisition of static stereo-pairs to image pairs captured with a high frame rate. In this way, it is possible to add time information to the images, obtaining free surface elevation time series, similar to that provided by standard sensors. The advantage is that using a single system, measurements may be collected in a very large number of points reducing problems of intrusiveness and time-consuming calibration procedures. Indeed, standard sensors need a short calibration interval, at least once a day during experimental testing (see, e.g., in [
20]), because their operation principles strictly depend on the micro-climatic conditions, which can vary significantly from day to day. Especially in large wave tanks, the calibration procedures can be very expensive, both in terms of time and human resources because researchers have to enter and operate in an uncomfortable environment. It could be observed that in these cases repeated calibration is one of the bottlenecks of experimental investigations.
An important extension to the time domain analysis has been obtained by Santel et al. [
21] who reconstructed a digital surface model of the surf zone, and validated the results by a detailed comparison with a battery of probes. De Vries et al. [
22] also investigated the surf zone waves at both medium (~50 m
) and large (~
m
) scale, comparing results with a pressure sensor (in a laboratory) and a wave buoy (in the field) and obtaining satisfactory results. Furthermore, a trinocular system has been tested to reduce the error due to false matches between homologous points (i.e., the corresponding points on the two sensors, representative of the same object in the framed scene) by providing three independent stereo-pairs [
23]. Benetazzo [
24] developed an innovative algorithm for 3D sea surface reconstruction, based on the successive approximations method, validating the results through data collected during several oceanographic measurement campaigns. Bechle and Who [
25] have developed an algorithm able to return the water elevations at any point (virtual wave gauge) of a selected portion of sea surface through the analysis of a stereoscopic pair of movies. More recently, Benetazzo et al. [
26] successfully extended stereo video techniques to larger areas (approximately 1000 m
). Stereoscopy has been successfully used to study some particular types of waves such as extreme waves during storms [
27,
28]. An open data set of sea surface stereo images is now available for an ocean region of
m
[
29].
The proposed approach herein is based on the stereoscopic imaging technique. Even though it is a well-established method, this research work aims to apply it to a challenging environment. In open sea conditions, the light scene allows to easily distinguish the objects that belong to the surface of the sea from those that are reflected. Especially on cloudy days, when the daylight creates a very uniform lighting condition, the open seawater surface can be considered as a Lambertian surface, at least with some approximations (see, e.g., in [
26,
30]). In large wave tanks deployed in indoor laboratories, both the incident light, either natural or artificial, and the reflected light directions can always be definitely identified. In these conditions, it can be hard to discriminate the scene points belonging to the water surface and specular reflection of images from the water surface. This issue, known as radiometric distortion, greatly complicates the use of stereoscopic techniques for free surface elevation measurement. An attempt to provide a solution to this issue has been recently proposed by Aubourg et al. [
31], who performed a combination of stereoscopic surface mapping and stereoscopic three-component Particle Imaging Velocimetry (PIV), using a seeding of the free surface by small polystyrene particles in a confined cylindrical tank. In the field, Sutherland and Melville [
32] used a stereo infrared particle image velocimetry (PIV).
This paper aims to assess the feasibility of a noninvasive approach to get a reliable estimation of synthetic wave parameters when large wave tanks deployed in indoor laboratories are used. A new approach based on stereoscopic vision techniques, named Wave Lab Stereoscopic System (WLSS), is proposed herein. To solve the issues related to water reflectance, and then to remove radiometric distortion, some colored low inertia floating markers have been deployed in a wave tank within the field of view of two identical cameras. Irregular waves have been reproduced and stereo movie pairs recorded. The frame by frame analysis allows extracting the markers position and the local and instantaneous free surface elevation, at least if the markers dynamics is neglected. The free surface elevation is then characterized in both the time and space domains. As this paper aims to assess the reliability of the method, and the time series collected by means of a resistive probe is used to reach the goal, only the heave (i.e., the linear motion of the floaters along the vertical direction) time series is discussed hereafter.
The activities carried out in this research can be synthesized in the following steps. First, a hardware experimental setup consisting of preparing floating markers and assembling the entire acquisition system has been performed. Then, data processing algorithms have been implemented to perform camera calibration, marker recognition, stereo-matching, geometric triangulation, marker coordinates extraction, and transformation to a global reference frame. The validation of the method has been performed by comparing the results obtained from the proposed stereoscopic technique to data collected by means of standard probes.
The next section describes the method that was used, in terms of both hardware and software implemented for the work; the succeeding section describes the experimental step in the laboratory, and the main results are discussed. Concluding remarks close the paper.
2. Main Features of 3D Stereo Systems
A stereoscopic vision system is composed of two (or more) devices for the acquisition of images (photo- or video-cameras) suitably positioned, as well as a data processing system. This ancient technique, developed in the 19th century for images taken by analog cameras, rapidly improved in the last decades. Even though the method is well-established, this section aims to detail its main features.
The reconstruction of three-dimensional reality by means of computer vision techniques requires the knowledge of image formation on a camera sensor. For this purpose, analytic modeling is typically used due to its capability to effectively approximate the real-world phenomena. In this work a standard perspective model, i.e., pinhole camera model [
33], has been used. Under the assumption of infinitesimal thickness of lenses (i.e., within the frame of “thin lenses” approximation), the model allows the transformation from image coordinates (
u,
v) to the real-world reference coordinate system through a perspective projection matrix. The transformation takes into account the coordinates of the optical center and parameters for (i) the translation and rotation between the camera and world systems, (ii) the scale factors related to
u and
v axes, and (iii) the non-perfect orthogonality between the
u-
v axes. As the thin lenses approximation is a mathematical abstraction, the Brown–Conrady model has been used to take into account the radial and tangential lens distortions [
34,
35].
The parameters in the perspective projection matrix are generally empirically estimated, after appropriate calibration procedures, exploiting images of a structured grid with known mesh size [
36]. The calibration procedure proposed by Zhang has been applied herein [
37]. A chessboard has been used as calibration target: it has been photographed by the calibrating cameras for different positions, as the greater the number of acquisitions of the target, the greater the accuracy in the estimation of the parameters. Once this procedure has been applied to both cameras, a further process has been used to estimate calibration parameters of the whole stereoscopic acquisition system [
38].
Even if this type of calibration can be considered onerous, it is strictly needed only once if the baseline (i.e., the distance between the two cameras) is not modified. Furthermore, the calibration procedure is very easy to carry out because it is not performed in water. Nevertheless, it can be considered as a possible source of error: an imperfect calibration directly affects the system precision that depends on the reliable estimation of the baseline length and of the optical parameters. The calibration process is sensitive to the flatness and accuracy of the target pattern and to the care used to fix the cameras to the supporting frame. Indeed, any movement that may occur in the period between the calibration process and the experimental acquisitions should be avoided.
Another crucial point of stereoscopic techniques is the stereo-matching, i.e., the search of homologous points in a stereo-couple of images: this phase is preparatory to the extraction of the spatial coordinates of the homologous points.
To simplify the calculations, it is advisable to proceed with the rectification of the stereo-pair first. Substantial support for rectification can be provided by the application of the principles of epipolar geometry that reduces the search for homologous points to a one-dimensional problem [
39]. Given a point on one of the two images, the epipolar hypothesis restricts the search for its homologous point to a segment—the epipolar line—instead of an area. The rectification procedure requires that the cameras have been previously calibrated [
40]. It is aimed to obtain two new perspective projection matrices, which allow the transition from the real-world coordinates to those of two new ideal image planes. These new matrices are then rotated around their optical centers until focal planes are coplanar and contain the baseline. Then, to obtain horizontal epipolar lines, the abscissa of the new reference frame has to be chosen parallel to the baseline. It is required that the two intrinsic parameters (optical center coordinates and focal lengths) of the new projection matrices are equal to each other to impose the collinearity condition of the two cameras. This is equivalent to equalize the horizontal and vertical scale coefficients in the two projection matrices.
The digital camera sensors are made of a finite number of pixels: this implies a discrete determination of the target localization in metric coordinates in the real-world reference system. It is then useful to estimate the resolution of the three-dimensional coordinates of a point in the real-world for the proposed system. This resolution allows to estimate the smallest object that the system is able to identify.
The first step is the estimation of the resolution in the camera reference frame whose origin lies typically in the optical center of one of the cameras, as described in the pinhole camera model [
33]. In this reference frame, it is preferable to estimate separately the contribution to the resolution in the image plane (
x and
y components) and along the optical axis (
z component).
As the contribution of the x and y resolution components is independent of both the disparity (defined, for each space point “P”, as the difference between the abscissas of the point P projections on the two cameras sensors) and the stereographic system layout, it is possible to refer to a single camera geometry.
A generic real point
A, placed on the optical axis at distance D (hereinafter referred to as shooting distance) from the optical center (
Figure 1, left), generates an image in
C, usually the central pixel of the sensor. A possible miscalculation of the image point in
, say
n pixels away from
C either along
x or along
y, involves a displacement of the real point in the wrong position
(pinhole camera model). From the triangles
and
it reads
where
f is the focal length in pixel units as obtained from the calibration process. The differential equation reads as follows,
where
is a location error along either
x or
y, expressed in metric units. As expected,
is proportional to the shooting distance
D. When
, i.e., considering a positioning error of only one pixel, Equation (
2) gives the pixel spatial resolution. The estimation of this quantity can be useful in determining the size of the marker to be used, according to the camera resolution and the experimental layout: once experimentally established the minimum number
c of consecutive aligned pixels necessary for a marker to be easily visible and segmented, it is possible to obtain the minimum size that can be resolved by the system, by multiplying
c by the spatial resolution of the pixel.
The contribution along the
z axis is due to the assessment of the value of disparity and is the only component strictly inherent to the stereo system. In the right panel of
Figure 1, the real point
A placed on the optical axis of the left camera at a distance
D from the optical center
, has images in the left sensor center
and in the point
G on the right sensor (pinhole camera model). Point
G is
n pixels far from the right sensor center
, so that
n is just the disparity of the real point
A in pixels units. Exploiting the similarity criteria, a location error along
z (
) can be expressed in differential form as
where
is expressed in meters.
is proportional to the square of the shooting distance
D and to the reciprocal of the baseline length (
B, see
Figure 1) and focal length (
f).
The resolution of the proposed method can be projected to the real-world reference frame. In the following, only the projection along z axis is discussed, because it is useful to estimate the accuracy of the vertical water surface elevation, which can then be compared with measures taken with traditional instruments. This projection is the result of a geometric composition of , , and when is assumed to be equal to 1.
Figure 2 (upper panel) shows the reference frame linked to the cameras and the one linked to the laboratory (world reference frame), whose plane
is the still water surface. Without loss of generality, it can be assumed that the plane
contains the baseline in the
direction. Let
be the angle formed by
with
and
the angle formed by
with the
plane (
Figure 2, lower panel). The projection along
of the three components
,
, and
, with no regards to signs, gives
In the usually accepted hypothesis that
(horizontal baseline), and considering the expressions of
and
given in Equations (
2) and (
3) it can be reduced to
following that the vertical pixel resolution is directly proportional to the shooting distance (
D) and inversely proportional to the focal length (
f) and the baseline length (
B).
3. Methodology
In this paper, an innovative procedure called Wave Lab Stereo System (WLSS) has been tested for synthetic wave parameters estimation within the frame of experimental investigations. The feasibility and reliability of the proposed method have been assessed by comparing the estimated wave parameters to those estimated by using free surface elevation time series collected using a conventional wave probe. As part of the experimental investigation, a data processing chain has been implemented to perform free surface elevation time series extraction. The implemented procedure consists of (i) system implementation and positioning of low inertia floating markers, (ii) markers detection and tracking in the images extracted from the video (segmentation phase) and search for the correspondences in the stereo-pairs, (iii) stereoscopic reconstruction of markers positions, and (iv) extraction of time series of markers displacements. Following these steps, wave parameters estimation can be achieved. This section is aimed to outline the main processing steps.
3.1. System Implementation
To justify some choices made during experimental steps, it is useful to detail all the issues of the “stereo-matching” step. A necessary condition for getting geometrical coordinates of the points belonging to a scene is that the same points have to be filmed by at least two different sensors located in two different positions. Finding the homologous points on two different images could be difficult. First, not all the points of a scene may be seen by both cameras (i.e., “occlusion problem”). The issue could be minimized by using short baselines so that the scenes framed by the two different points of view are quite similar. Even if all the points are visible from both sensors there might be the problem of radiometric distortions typically related to indoor laboratories, i.e., the case tackled by this study. Finally, the uniformity of some surfaces (just like a water surface), which return images consisting of recurring patterns when focused, can create difficulties for any matching algorithm.
To overcome these critical issues, low inertia floating markers have been used so that their instantaneous location can be related to the elevation of the water surface: the dynamics of the floaters is considered as negligible and their motion can be easily used to infer the free surface elevation. On one end, the dynamics of floaters is shape and frequency-dependent, and, on the other hand, the markers must follow the free surface. In other words, their Response Amplitude Operator (RAO; see, e.g., in [
41]), related to the amplitude of the motion of the floater as a function of the forcing frequency, must be as similar as possible to the identity matrix. Therefore, the amplitude of the motion must be very similar to the amplitude of the wave forcing, at least within the frequency range of interest. This does not apply in the surf zone, where a significant mass transport occurs, and then the markers would be advected toward the shore.
Table tennis plastic balls (diameter equal to 40 mm; weight equal to 2.4 g) have been used as markers. The spheres have been previously treated with a red color paint to improve the performance of the segmentation phase: both the color and the size of the markers have been chosen based on the results of a sensitivity analysis performed ad hoc. The painted markers have been equipped with a mooring system, similar to the wave-buoys mooring layout, made of a stiff plastic cord, and an anchor weight, i.e., a lead fishing weight (
Figure 3).
This type of mooring system allowed to obtain markers able to follow water surface oscillations, just like a wave buoy. In the meantime, they remain in the neighborhood of their initial location. To define the mooring line length, the wave-driven Lagrangian trajectory has been estimated by using the small amplitude linear theory. The length of the wire used to moor the floaters has been then selected longer than the summation of the local water depth and the maximum axis of the estimated Lagrangian paths. For the case at hand, a wire length of 0.45 m has been selected (with a water depth equal to 0.32 m). An empirical check that the mooring system does not influence the motion of the markers was carried out by observing their movements for a while in the tank at the early stage of the tests before start shooting. The mooring system design has taken into account the need to make the whole system as non-intrusive as possible: the fishing line used has a thickness of 0.3 mm, and the lead fishing weight is 5 mm thick with a mass of 60 g. The line has been attached to the weight with a simple knot and has been glued to the marker. Therefore, the perturbation on the liquid surface induced by the floating markers and their mooring system have to be considered negligible when compared with those of conventional wave gauges. Indeed, the invasivity of standard wave gauges deployed into a large wave tank is related to both the gauge wire and the supporting frame that must rely on the tank bottom.
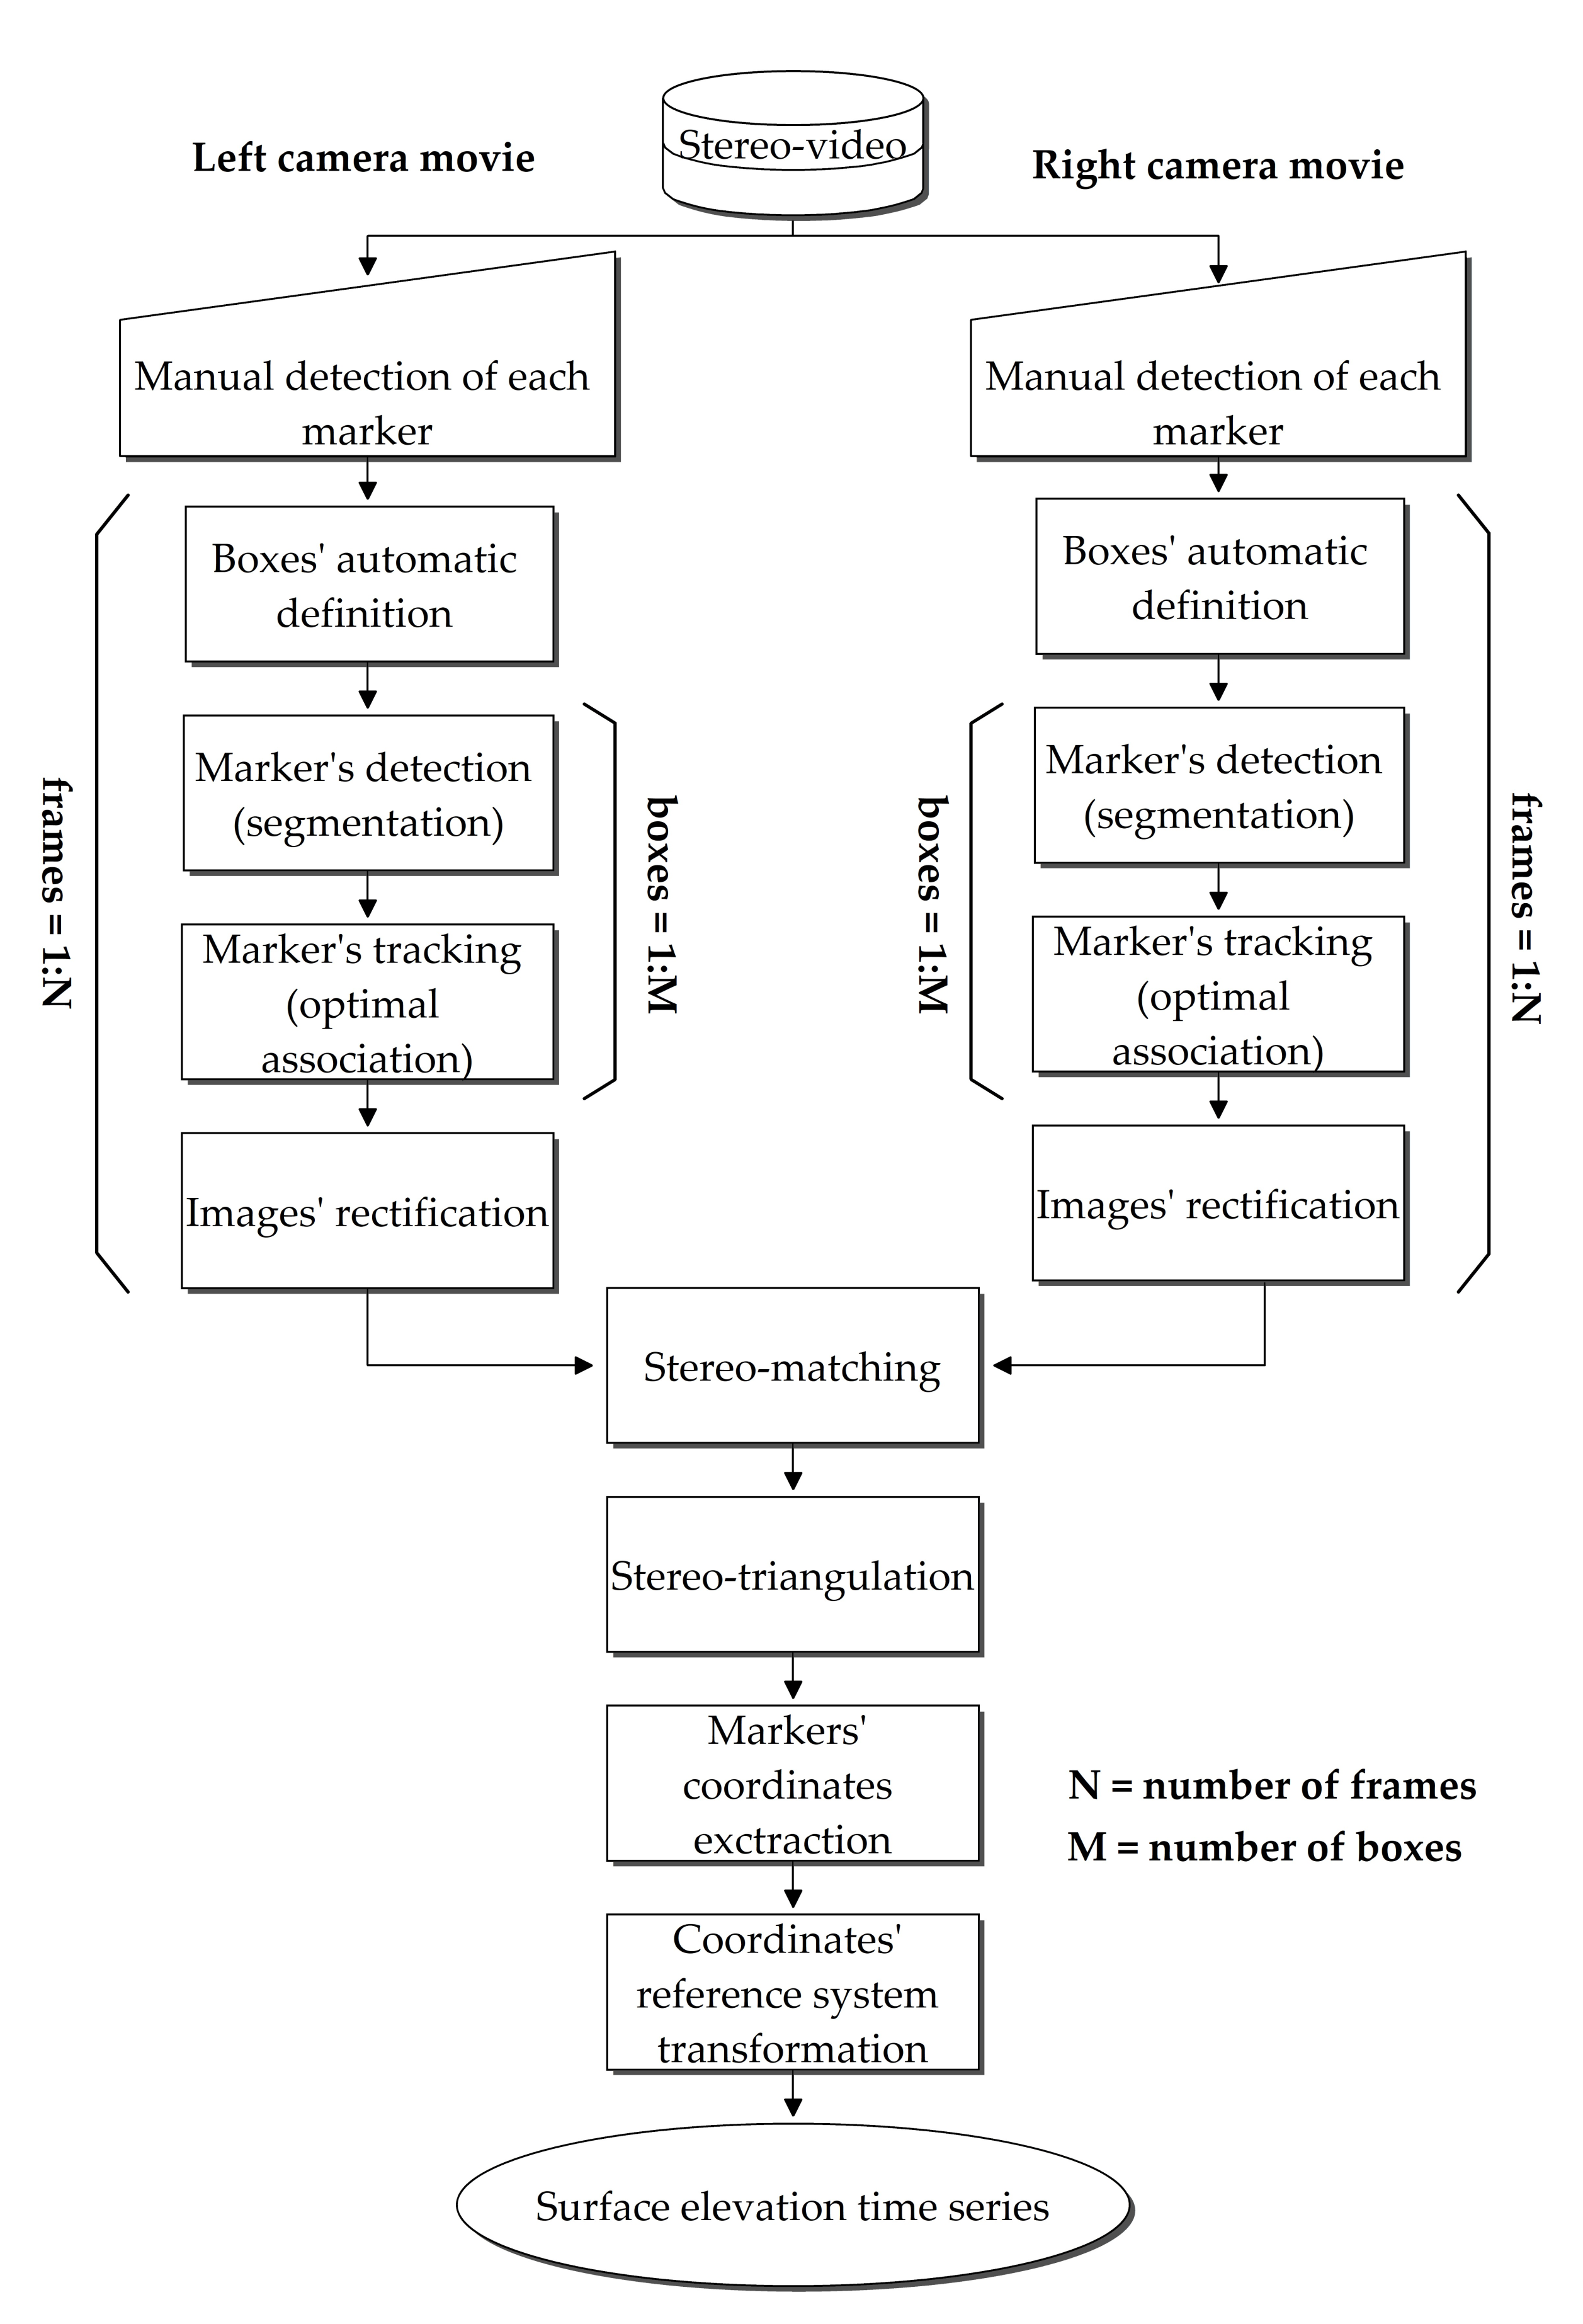
3.2. Markers Detection and Stereoscopic Procedures
In the experimental investigation, a processing algorithm able to detect markers in the images has been developed. It aims to find the correspondences in the stereo-pairs, and then to track the markers from frame to frame. The sequence of the procedures is outlined in the flow chart of
Figure 4.
To further facilitate the stereo matching problem solving, a method to simplify both these issues and the detection of the marker in the rectified images has been conceived.
The qualitative analysis of some of the collected movies revealed that the movements of every single marker are confined in a definite neighborhood. For this reason, a preliminary step of a “multi-search box” procedure has been implemented. The user is allowed to define a window for each marker in the image (by manually selecting each marker in the first frame of the movie) to limit within these areas the search for markers in the stereo-pair (
Figure 5). In the literature, there are several examples of using Regions Of Interest (ROI) [
42] or bounding boxes [
43] applied to computer vision. They aim to limit the operations to be carried out only to defined portions of the scene framed by the cameras. Issues arise when the frames of a movie have to be processed: it is possible that two or more boxes intersect each other as the time elapses, or that markers leave their windows. It is not so complex, however, to avoid these conditions in a laboratory-like environment: the image acquisition point can be properly moved. The “multi-search box” method greatly simplifies the problem of correspondence and allows reducing also the computational cost in the segmentation step. For these reasons, it has been applied before segmentation procedures in the processing chain (
Figure 4).
After the “multi-search box” procedure, the algorithm continues with the segmentation step. As a first attempt, a color-based segmentation procedure is applied. This type of segmentation is very useful if features are characterized by a uniform color. In general, it is very effective because colors typically do not significantly change with light conditions. To facilitate the operations of color segmentation, in accordance with Bora et al. [
44],
color space images are more useful (“
H” is Hue, “
S” is Saturation, and “
V” is Brightness Value) than standard color spaces as, e.g.,
(“
R” is Red, “
G” is Green, and “
B” is Blue) or
(“
L” is Lightness, “
a” is Red/Green Value parameter, and “
b” is Blue/Yellow Value parameter). It is possible to directly set the threshold value needed to perform the segmentation on
H and
S channels (see, e.g., in [
44]). At the end of this step, the result is a binary image: pixels of a given color (the color of the floating markers) are tagged as “0”, whereas the remaining pixels of the image are tagged as “1”.
If the color-based procedure identifies only one marker per box, segmentation can be considered as successfully completed. If not, the image processing continues with the application of the Hough transform [
45]. A useful evolution of Hough transform [
46] is normally employed for the segmentation of curvilinear forms with special properties (in particular circles and ellipses): the application of these algorithms should extract all the red spherical shapes visible in the images (i.e., the floating markers). Nevertheless, in very noisy images other features (due to reflections on the water surface with a high red color content and a circular shape) could be identified as a marker by the segmentation algorithm. To discard these small features (almost points), a morphological model based on the convolution with a raster operator (size of 3×3 pixels) has been used [
47].
If no marker is found after these attempts, the segmentation is considered failed for the specific marker in the analyzed frame.
Once the segmentation phase is completed, the implemented procedure calculates and stores the coordinates of the centroid of each identified marker. It is important to stress that this step is carried out with a sub-pixel accuracy: the evaluation of the centroid coordinates of the markers (i.e., the centroid of the red pixel clusters) is not performed by calculating the average of the bidimensional sensor coordinates of the edge points of the marker. Rather, it is carried out by a weighted algorithm that takes into account the gray level of the marker pixels, especially near their edges, as described in [
48]. The result is the detection of an intensity weighted marker centroid with sub-pixel accuracy.
Once all the markers have been identified in each frame, a procedure aimed to track the markers from frame to frame has been implemented using an “optimal association” method. The displacement of each marker between two successive frames is expected to be reasonably small (depending on the frame rate, equal to 30 Hz for the tested configuration), certainly smaller than the distances between the marker itself and adjacent ones (“hypothesis of locality”). Then, a check matrix (
) has been built to minimize the possibility of the wrong estimation of markers paths (for both cameras, see
Figure 4). For a given number (
N) of the markers, it reads as follows,
where the generic element
is the distance between the instantaneous location of marker
at the time
and the instantaneous location of marker
at the instant
(being
the time interval between two frames, related to the frame rate). The minimum value of the elements in the matrix detects the first “optimal association” between markers. Then, a second matrix can be extracted starting from the first one deleting the row and column corresponding to the first minimum value found and the second minimum can be calculated. The procedure has to be carried out until the last optimal association has been found. Before proceeding to the next step, the procedure foresees a further attempt to recover “lost” data due to segmentation failure by a bilinear interpolation. This attempt is performed only when there is a loss of data for only a small number of consecutive frames (less than a given threshold).
Some preliminary tests on segmentation and tracking procedures have been performed before wave tank testing in order to test the proposed system. A pendulum with a single red plastic sphere attached to the end of a wire has been built and the maker trajectory has been tracked checking that the radius of the circular sector was equal to the pendulum wire length during the oscillation.
After the image segmentation, a stereoscopic triangulation model described by Faugeras et al. [
49] has been applied to images obtained from the virtually rectified cameras to extract the 3D coordinates of all the detected markers. The stereoscopic triangulation model allows calculating, in particular, the Z coordinate of every single point along the optical axis:
where
B is the baseline,
f is the focal length (both obtained from calibration procedure),
is the abscissa of the projection of generic point “P” on the left camera sensor, and
is the abscissa of the projection of the same point on the right camera sensor (both obtained from marker detection procedure) in their reference systems.
The obtained points coordinates are transformed to the real-world reference frame through the application of the pinhole camera model. Once these elaborations have been carried out for each extracted movie frame, the markers’ vertical displacement time series has been achieved. As the marker dynamics have been considered negligible, the vertical displacement time series of each marker has been intended as the free surface elevation time series.
5. Concluding Remarks
This paper illustrates a new technique aimed to get the estimation of synthetic wave parameters when experimental investigations are performed in indoor large wave tanks. The paper is particularly devoted to assess the feasibility and reliability of the proposed method.
It is based on the processing of digital images collected through a stereoscopic system, consisting of a pair of optical sensors and several low inertia markers floating on the water surface.
Both technical steps (preparation of markers, mooring systems, special supports for cameras baseline, and pattern for cameras calibration) and computational steps (specific procedures for cameras calibration, images segmentation, matching of homologous points in the stereo couples, and triangulation of such homologous points and their world coordinates restitution) are detailed. The critical aspects of the system are related to the markers mooring system that cannot be used in the surf zones, where mass transport is significant.
The system has been tested by several experimental trials that highlighted both pros and cons of the proposed approach.
The technique offers the possibility of acquiring data simultaneously in a large number of points of large wave tanks, with no problem of intrusiveness and with fair reliability of measures. Although this reliability depends on some experimental conditions (such as the shooting distance, i.e., the distance between a real point and the cameras lens or the brightness) and quality of optical sensors, the laboratory experiments have shown that, even in the worst conditions, the difference of the results obtained by the standard measuring system and those derived from the new system, is at most 6% in terms of significant wave height, and 1% in terms of periods. In terms of maximum wave height, the error increases, with an underestimation of ~25%. This is likely due to the quasi-Lagrangian approach of the method for which it was demonstrated that the crests are flattened and the troughs sharpened.

 ,
, 


