Article

Landscape Dynamics in an Iconic Watershed of Northwestern Mexico: Vegetation Condition Insights Using Landsat and PlanetScope Data

by
Lara Cornejo-Denman
1,
Jose Raul Romo-Leon
1,*,
Kyle Hartfield
2,
Willem J. D. van Leeuwen
2,3,
Guillermo E. Ponce-Campos
4,5 and
Alejandro Castellanos-Villegas
1
1
Departamento de Investigaciones Científicas y Tecnológicas, Universidad de Sonora, Hermosillo 83000, Mexico
2
School of Natural Resources and the Environment, Arizona Remote Sensing Center, The University of Arizona, 1064 E. Lowell Street, Tucson, AZ 85721, USA
3
School of Geography and Development, University of Arizona, Tucson, AZ 85721, USA
4
School of Natural Resources and the Environment, The University of Arizona, Tucson, AZ 85719, USA
5
Southwest Watershed Research Center USDA-ARS 2000 E. Allen Rd., Tucson, AZ 85719, USA
*
Author to whom correspondence should be addressed.
Remote Sens. 2020, 12(16), 2519; https://doi.org/10.3390/rs12162519
Submission received: 7 May 2020 / Revised: 21 July 2020 / Accepted: 30 July 2020 / Published: 5 August 2020
(This article belongs to the Special Issue Spatial Characterization of Vegetation)

Abstract

:
Natural vegetation in arid and semi-arid environments of Northwestern Mexico has been subject to transformation due to extensive and intensive human occupation related mostly to primary activities. Keystone habitats such as riparian ecosystems are extremely sensitive to land use changes that occur in their surrounding landscape. In this study, we developed remote sensing-based land cover classifications and post-classification fragmentation analysis, by using data from Landsat’s moderate resolution sensors Thematic Mapper and Operational Land Imager (TM and OLI) to assess land use changes and the shift in landscape configuration in a riparian corridor of a dynamic watershed in central Sonora during the last 30 years. In addition, we derived a high spatial resolution classification (using PlanetScope-PS2 imagery) to assess the “recent state” of the riparian corridor. According to our results, riparian vegetation has increased by 40%, although only 9% of this coverage corresponds to obligate riparian species. Scrub area shows a declining trend, with a loss of more than 17,000 ha due to the expansion of mesquite and buffelgrass-dominated areas. The use of moderate resolution Landsat data was essential to register changes in vegetation cover through time, however, higher resolution PlanetScope data were fundamental for the detection of limited aerial extent classes such as obligate riparian vegetation. The unregulated development of anthropogenic activities is suggested to be the main driver of land cover change processes for arid ecosystems in this region. These results highlight the urgent need for alternative management and restoration projects in an area where there is almost a total lack of protection regulations or conservation efforts.

Graphical Abstract

1. Introduction

Global studies estimate that more than 50% of Earth’s ice-free terrestrial surface has been modified or transformed by human activities [1,2]. The main drivers for Land Use and Land Cover Change (LULCC) are agriculture, industry, recreation and commerce [3]. LULCC processes are responsible for the shaping and restructuring of large extents of territory, affecting landscape connectivity, promoting habitat and biodiversity loss and modifying ecological function trends [4,5,6,7]. Regardless of the prominent role of LULCC in ecological processes at landscape levels, comprehensive analyses of habitat connectivity and configuration are still sparse for many key environments within large landscapes. Such is the case of riparian ecosystems in arid and semi-arid regions of North America, which are hotspots of biodiversity and ecosystem services [8,9]. These ecosystems are subject to modification by surrounding land uses and other dynamics occurring at the landscape level, consequently altering habitat connectivity for many species that depend on them [10,11].
In Northwestern Mexico, agricultural activities, livestock production and mining [12,13,14,15] have historically altered riparian ecosystems through extensive land use modifications [16]. In arid and semi-arid regions of North America, these ecosystems have a very limited cover extent (0.5%) [17,18]. Nonetheless, they are crucial for regional biodiversity maintenance [19,20,21], water, nutrient and shelter provision [22,23] and carbon storage processes [24]. Therefore, modifications to these habitats often result in multiple changes to socioecological systems at the regional scale [16,25].
Due to human activities and natural processes, riparian ecosystems are highly dynamic in space and time [26], therefore, to address impacts on natural vegetation, constant monitoring is required [27,28,29]. The application of land use–land cover classifications using remote sensing tools has been useful to assess these changes [30,31]. However, the use of land use–land cover classifications to address landscape configuration in riparian environments has been scarce in Northwestern Mexico. Official land use and land cover maps do not identify riparian vegetation in arid and semi-arid regions as a primary cover class [32,33]. Currently, there are no detailed maps representing the state of riparian vegetation in this region.
Landscape metrics analysis is useful to assess ecosystem condition at the landscape level and evaluate the impacts of LULCC [34]. Some of these metrics measure fragmentation, which is the loss of connectivity or subdivision of a habitat into smaller areas, and is associated with habitat loss [26]. This is relevant in the assessment of sensitive landscapes such as riparian ecosystems in arid and semi-arid regions. In addition, landscape metrics correlate with biological indicators and show that natural condition improves in places where riparian vegetation is less fragmented [35]. Moreover, combining widespread available datasets with novel higher resolution products and traditional classification and landscape assessment methods provides a useful set of remote sensing tools to assess spatially restricted ecosystems.
The Río Sonora Subwatershed (RSSW) is a dynamic region where riparian ecosystems are subject to disturbances related to several types of LULCC dynamics. This region represents the general state of riparian ecosystems in Northwestern Mexico. References about landscape condition in riparian ecosystems in the state of Sonora are scarce and are limited to brief descriptions or mentions [13,36,37]. Previous land use change studies [30,38,39] have used coarse spatial resolutions, which are insufficient for a detailed detection of riparian vegetation changes. Considering the previous studies, we believe it is necessary to use datasets with different spatial resolutions to assess and explain landscape dynamics in the region, since these can potentially modify ecosystems service provision and biodiversity [23,40,41].
The present study aims to quantify changes in land cover and landscape configuration (from 1988 to 2018) of several classes (native vegetation and human land use) associated to the riparian corridor of the Río Sonora. We develop land use–land cover classifications using moderate (Landsat TM and OLI) [42] and high (PlanetScope-PS2) [43] spatial resolution satellite imagery. In addition, for 1988 and 2016, we assess three fragmentation variables: Number of Patches, Mean Patch Area and Class Aggregation Index. Finally, we discuss the advantages and challenges of using different spatial resolution datasets for the assessment of riparian vegetation dynamics.
The coupling of moderate and high spatial resolution datasets, to assess the extent and composition of priority ecosystems naturally occurring in short extensions of land, constitutes an ongoing scientific endeavor. The present study aims to develop replicable and novel approaches for the study of landscape changes in threatened ecosystems of arid and semi-arid regions, which can be useful in the development of applied research and/or evidence-based policy, particularly in regions where riparian ecosystems are under no specific management or protection regimes.

2. Materials and Methods

Supervised classifications of the riparian corridor were derived for 1988 and 2016 using satellite imagery from two different Landsat sensors (TM and OLI). An additional classification for 2018, based on higher spatial resolution imagery from PlanetScope-PS2 sensors, was also conducted to obtain a “recent state” description of LULC for the region. A post-classification change detection analysis was performed using the Landsat TM- and OLI-based classification products. Finally, a fragmentation analysis was executed for 1988 and 2016 to assess the number of patches and landscape connectivity percentages for each land cover class.
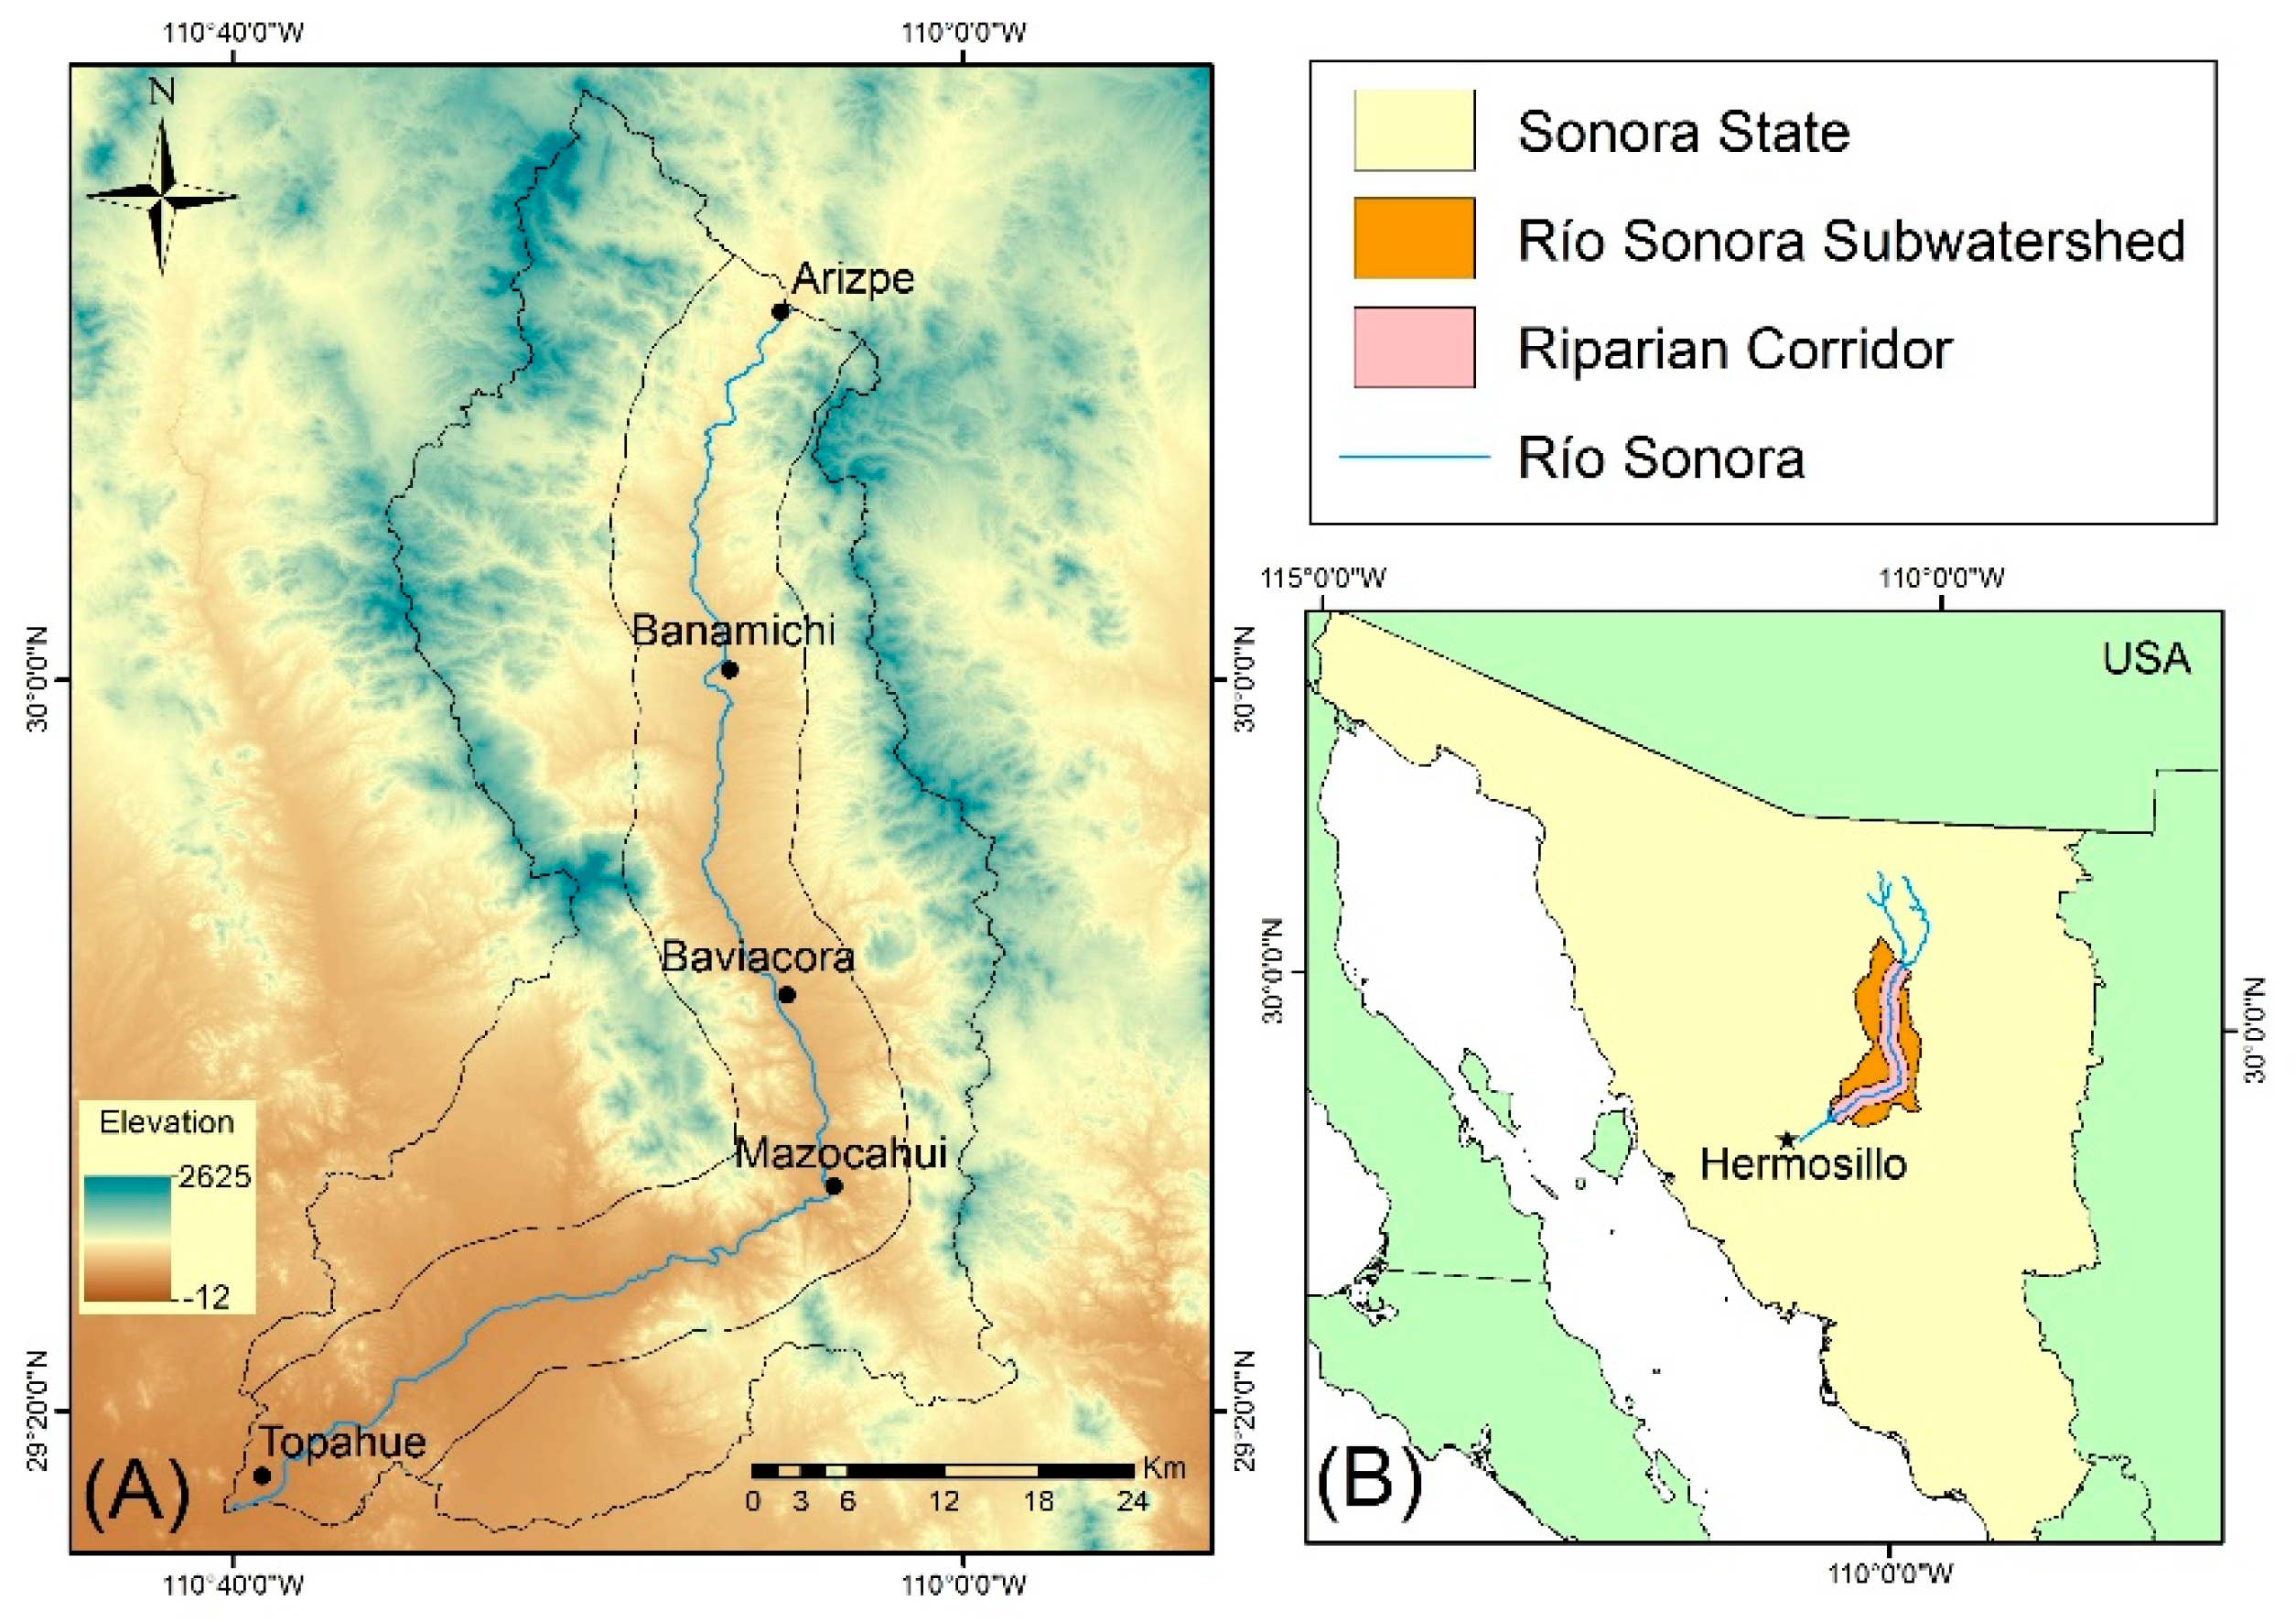
2.1. Study Area

The RSSW is located in the central part of the state of Sonora in Northwestern Mexico at latitude 29°50′19.889”N, longitude 110°13′37.412”W. The study area comprises a stretch of the Río Sonora that runs from the northern town of Arizpe to Topahue in the south. Agriculture and cattle ranching are the main economic activities in this region; other activities, such as mining, are also an important part of the livelihoods of some communities. The altitude ranges from 280 to 2180 m above sea level (Figure 1). Agricultural valleys and floodplains characterize the lowlands along the river where mesquite (Prosopis spp.), mule fat (Baccharis salicifolia) and other shrubs dominate the vegetation. Cottonwood (Populus fremontii) is present to a lesser extent, forming narrow stretches along the river edges and delineating agricultural plots. Willow (Salix gooddingii) is rare and restricted to glens and less disturbed areas. Desert scrub and subtropical scrub compose the vegetation matrix on adjacent hills and mountains, with oak forest (Quercus spp.) and grasslands occurring at higher altitudes. The temperature ranges from 17 to 31 °C and precipitation ranges from 268 to 542 mm, the highest precipitation events occur during the summer monsoon. Average precipitation for the selected years of analysis (1988, 2016 and 2018) was 476 mm, 441 mm and 438 mm, respectively; average temperature for all years was 21 °C [44,45].
The main interest of the present study is to describe land use change dynamics in the riparian corridor of the RSSW, and for this, we delineated a buffer of 7 km on each side of the river, considering the inclusion of most of the adjacent lowlands but excluding the higher parts of the subwatershed. This resulted in a narrow strip of 2280 km2 that included the full extent of the agricultural valleys, groundwater extraction wells and most of the activities that require land use modifications for their development.

2.2. Data Sets for Supervised Classification

For 1988 and 2016, cloud-free Level 1 Precision and Terrain corrected Landsat imagery (L1TP) from Collection 1 were downloaded from the United States Geological Survey (USGS) Earth Explorer website (Table 1). Data from this collection are radiometrically calibrated and orthorectified, ideal products for pixel-level time series analysis [42]. Since individual scenes cover only a portion of the subwatershed, after the classification procedure was completed, the two products were stitched into a larger mosaic to cover the full study area. To increase our classification accuracy, two dates were selected for each year to have information regarding the phenology of vegetation during both the dry and rainy seasons [38,46]. For 2018, 55 ortho-scenes from the Level 3B Products of Planet Constellation PlanetScope-PS2 (Education and Research Program) were selected (Table 1). These scenes are orthorectified and radiometrically, geometrically and atmospherically corrected [43,47].

2.3. Variables and Ancillary Data

A set of variables were selected based on a literature review [48,49,50,51,52,53] and derived from the satellite imagery datasets. Table 2 shows the metrics and variables, along with their associated description and the datasets from which they were derived. Ancillary data matching Landsat’s spatial resolution and sub-products were also obtained, including a digital elevation model [54], slope layer and aspect layer.
The final input datasets (per year classified) included 69 layers for Landsat TM, 63 for Landsat OLI and 15 for PlanetScope-PS2. These layers contain spectral reflectances, vegetation indices and spectral transformations for two dates for each year, along with ancillary data.

2.4. Classification Schemes

Considering riparian vegetation as the focus in this study, several cover types were selected to create a classification scheme. Given the differences in the spatial resolution of the sensors used, two classification schemes were developed, one for each dataset (Landsat TM and OLI and PlanetScope-PS2). Schemes were based on a review of several references from local and national studies [13,17,33,36,55].
The Landsat TM and OLI scheme (Table 3) included major vegetation types found in the region. It considered one class to represent riparian vegetation, including a mix of obligate riparian species (Populus sp., Salix spp.), facultative riparian species (Prosopis spp., Acacia spp.), shrubby riparian vegetation, as well as some exotic, naturalized and mesic species.
Due to the higher spatial resolution of PlanetSope-PS2 datasets, it was possible to establish a finer classification scheme by describing different subsets of classes [55]. The PlanetScope-PS2 scheme (Table 4) included two agricultural types (perennial and annual), two scrubland types (desert and subtropical) and two riparian classes (cottonwoods and mesquite). PlanetScope-PS2 datasets in this study were used mainly to assess the “recent state” condition of the riparian corridor, classes with a higher elevation distribution were dismissed from the scheme (oak forest and natural grassland), given the recent availability and reduced aerial extent of these scenes.

2.5. Reference Data

A reference dataset, consisting of an average of 200 points for each land cover class, were acquired, based on the general rule that n number of bands/variables require >10n pixels of training data [56]. From the total reference data, a random sample of 70% was used for training and the remainder (30%) for validation. Land cover training points were selected by: (1) collecting GPS ground data directly from field visits (2017 and 2018), (2) aerial imagery directly obtained in the field (2018) and (3) field data from previous studies in the region [28,57]. All points were verified and re-located using reference tools such as orthophotos from the Mexican Institute of Statistics and Geography (INEGI, for its acronym in Spanish) [58] and current and historical images from Google Earth.

2.6. Classification Model and Accuracy Assessment

Three supervised classifications were generated (1988, 2016 and 2018) by applying the classification and regression tree (CART) model. It creates a binary decision tree to assign a categorical value (a vegetation cover class) to each pixel [48], based on the spectral and other topographic variables and characteristics of pixels used in the analysis. This technique has been shown to result in high land cover classification accuracies in previous studies, when analyzing land use changes in arid and semi-arid regions [30,31,38,46]. Another advantage of regression tree models such as CART is that they provide transparency related to attribute usage, which is useful to determine which layers were most important for the classification process [48].
The accuracy of each classification was assessed using the validation data withheld from the reference dataset. A minimum of 75% accuracy was expected in order to validate the classification [59,60].
The CART algorithm was applied through an R script, using the image stacks and training data sets as input. The output of the model also included an accuracy assessment, in the form of a confusion matrix and user’s and producer’s accuracy for each class. Finally, we obtained a classified raster that was used for the subsequent creation of thematic maps, illustrating the distribution of all classes in the riparian corridor landscape.

2.7. Post-Classification Change Detection Analysis

To measure the main conversions between land uses and vegetation types through the studied time period between 1988 and 2016, a pixel-by-pixel change detection analysis was performed through a post-classification change detection approach [56]. For this analysis, we used 1988 and 2016, since both classifications share similar spatial resolution and class schemes. This produced a combined raster and attribute table with the pixel count for every class combination that occurred from one year to another and final cover change for each class was determined by converting the pixel count to hectares (pixel area of 900 m2 = 0.09 ha).

2.8. Fragmentation Analysis

To analyze the past and current conditions of natural vegetation cover in the corridor, three landscape metrics were derived (Table 5) from the land cover classification maps developed for 1988 and 2016. These landscape fragmentation metrics are sensitive to the spatial resolution of the land cover maps [61]. Therefore, these metrics are comparable between different classes and maps as long as the spatial resolution coincides.
The first metric is Number of Patches, which represents a measure of subdivision for a specific vegetation cover class and serves as a simple measure of the extent of fragmentation [62]. This metric uses the eight-neighbor rule to define a patch by considering the vegetation cover class for the eight nearest neighboring cells located horizontally, vertically or diagonally from another cell to consider it a patch [26]. The second metric is Mean Patch Area, which represents the average fragmentation condition of a particular class when interpreted in conjunction with total class area and Number of Patches [62]. The third landscape metric considered is the Class Aggregation Index, which equals the number of like adjacencies divided by the theoretical maximum possible number of like adjacencies for that class [62]. This index can be used to correlate spatial patterns with class-specific processes and compare classes from the same or different landscapes [61]. Landscape metrics were derived using the R package “landscapemetrics” [63].

3. Results

3.1. Vegetation Cover Classification Maps and Accuracy Assessment

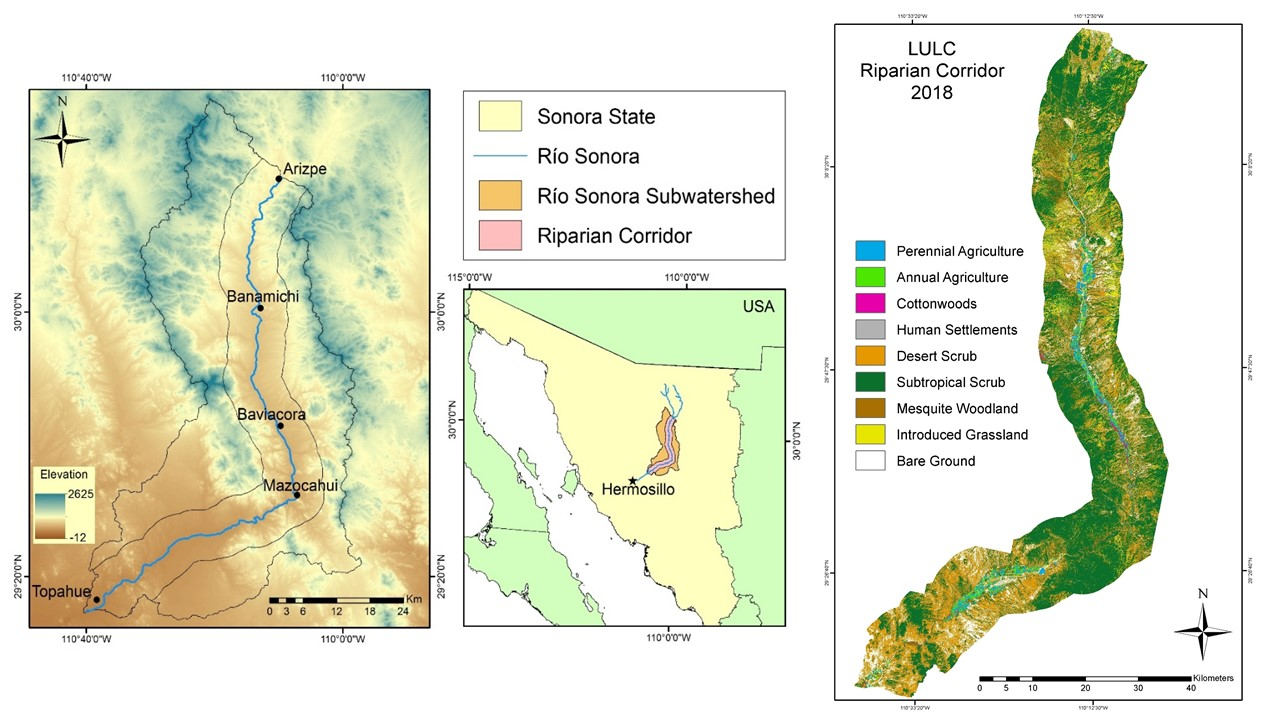
Thematic land use/land cover maps for the three classified years are presented in Figure 2 and Figure 3, overall accuracies for all years are greater than 88% [60]. Table 6 presents an aggregate of user’s and producer’s accuracies for all three classifications.
For all classifications (1988, 2016 and 2018), the main confusion occurred between Scrub and Mesquite classes. This was expected, since many plant species are shared between both vegetation types, as phenological and biophysical responses might be similar in time and magnitude. The mapping of grasslands proved to be challenging in both high and moderate spatial resolution classifications.
For TM- and OLI-based classifications (1988 and 2016, respectively), the Agriculture and Riparian Vegetation classes also presented some confusion due to their spatial distribution, similarities in reflectance and their relatively similar photosynthetic activity (mainly in perennial orchards). It is worth mentioning that grasslands (native or introduced) presented confusion with other vegetation types, probably because of plant structure heterogeneity and the amount of bare soil in these land cover types. Finally, we perceived some confusion between Riparian Vegetation and Mesquite Woodlands since mesquites are often near streams and can share distribution with other riparian species. This issue was expected, due to spatial and spectral resolution limitations posed by the sensors (TM and OLI), which restrict the discrimination between obligate riparian and facultative riparian species.
Our higher spatial resolution LULC classification (2018) presented some confusion between Cottonwoods and Perennial Agriculture. This was expected since some perennial cultivated species present in the area, such as pecan trees (Carya illinoinensis), share phenological characteristics with cottonwoods (presenting leaf senescence and dormancy during the winter and early spring). On the other hand, differentiation between agricultural classes (perennial and annual) was possible due to the dates (imagery from March and September) used in the classification process. Our results suggest that perennial agriculture presents significantly different values than those presented by annual/seasonal crops, likely due to the difference in the retention of foliage and, therefore, photosynthetic function in perennial crops and the sowing of the annual cultivars.

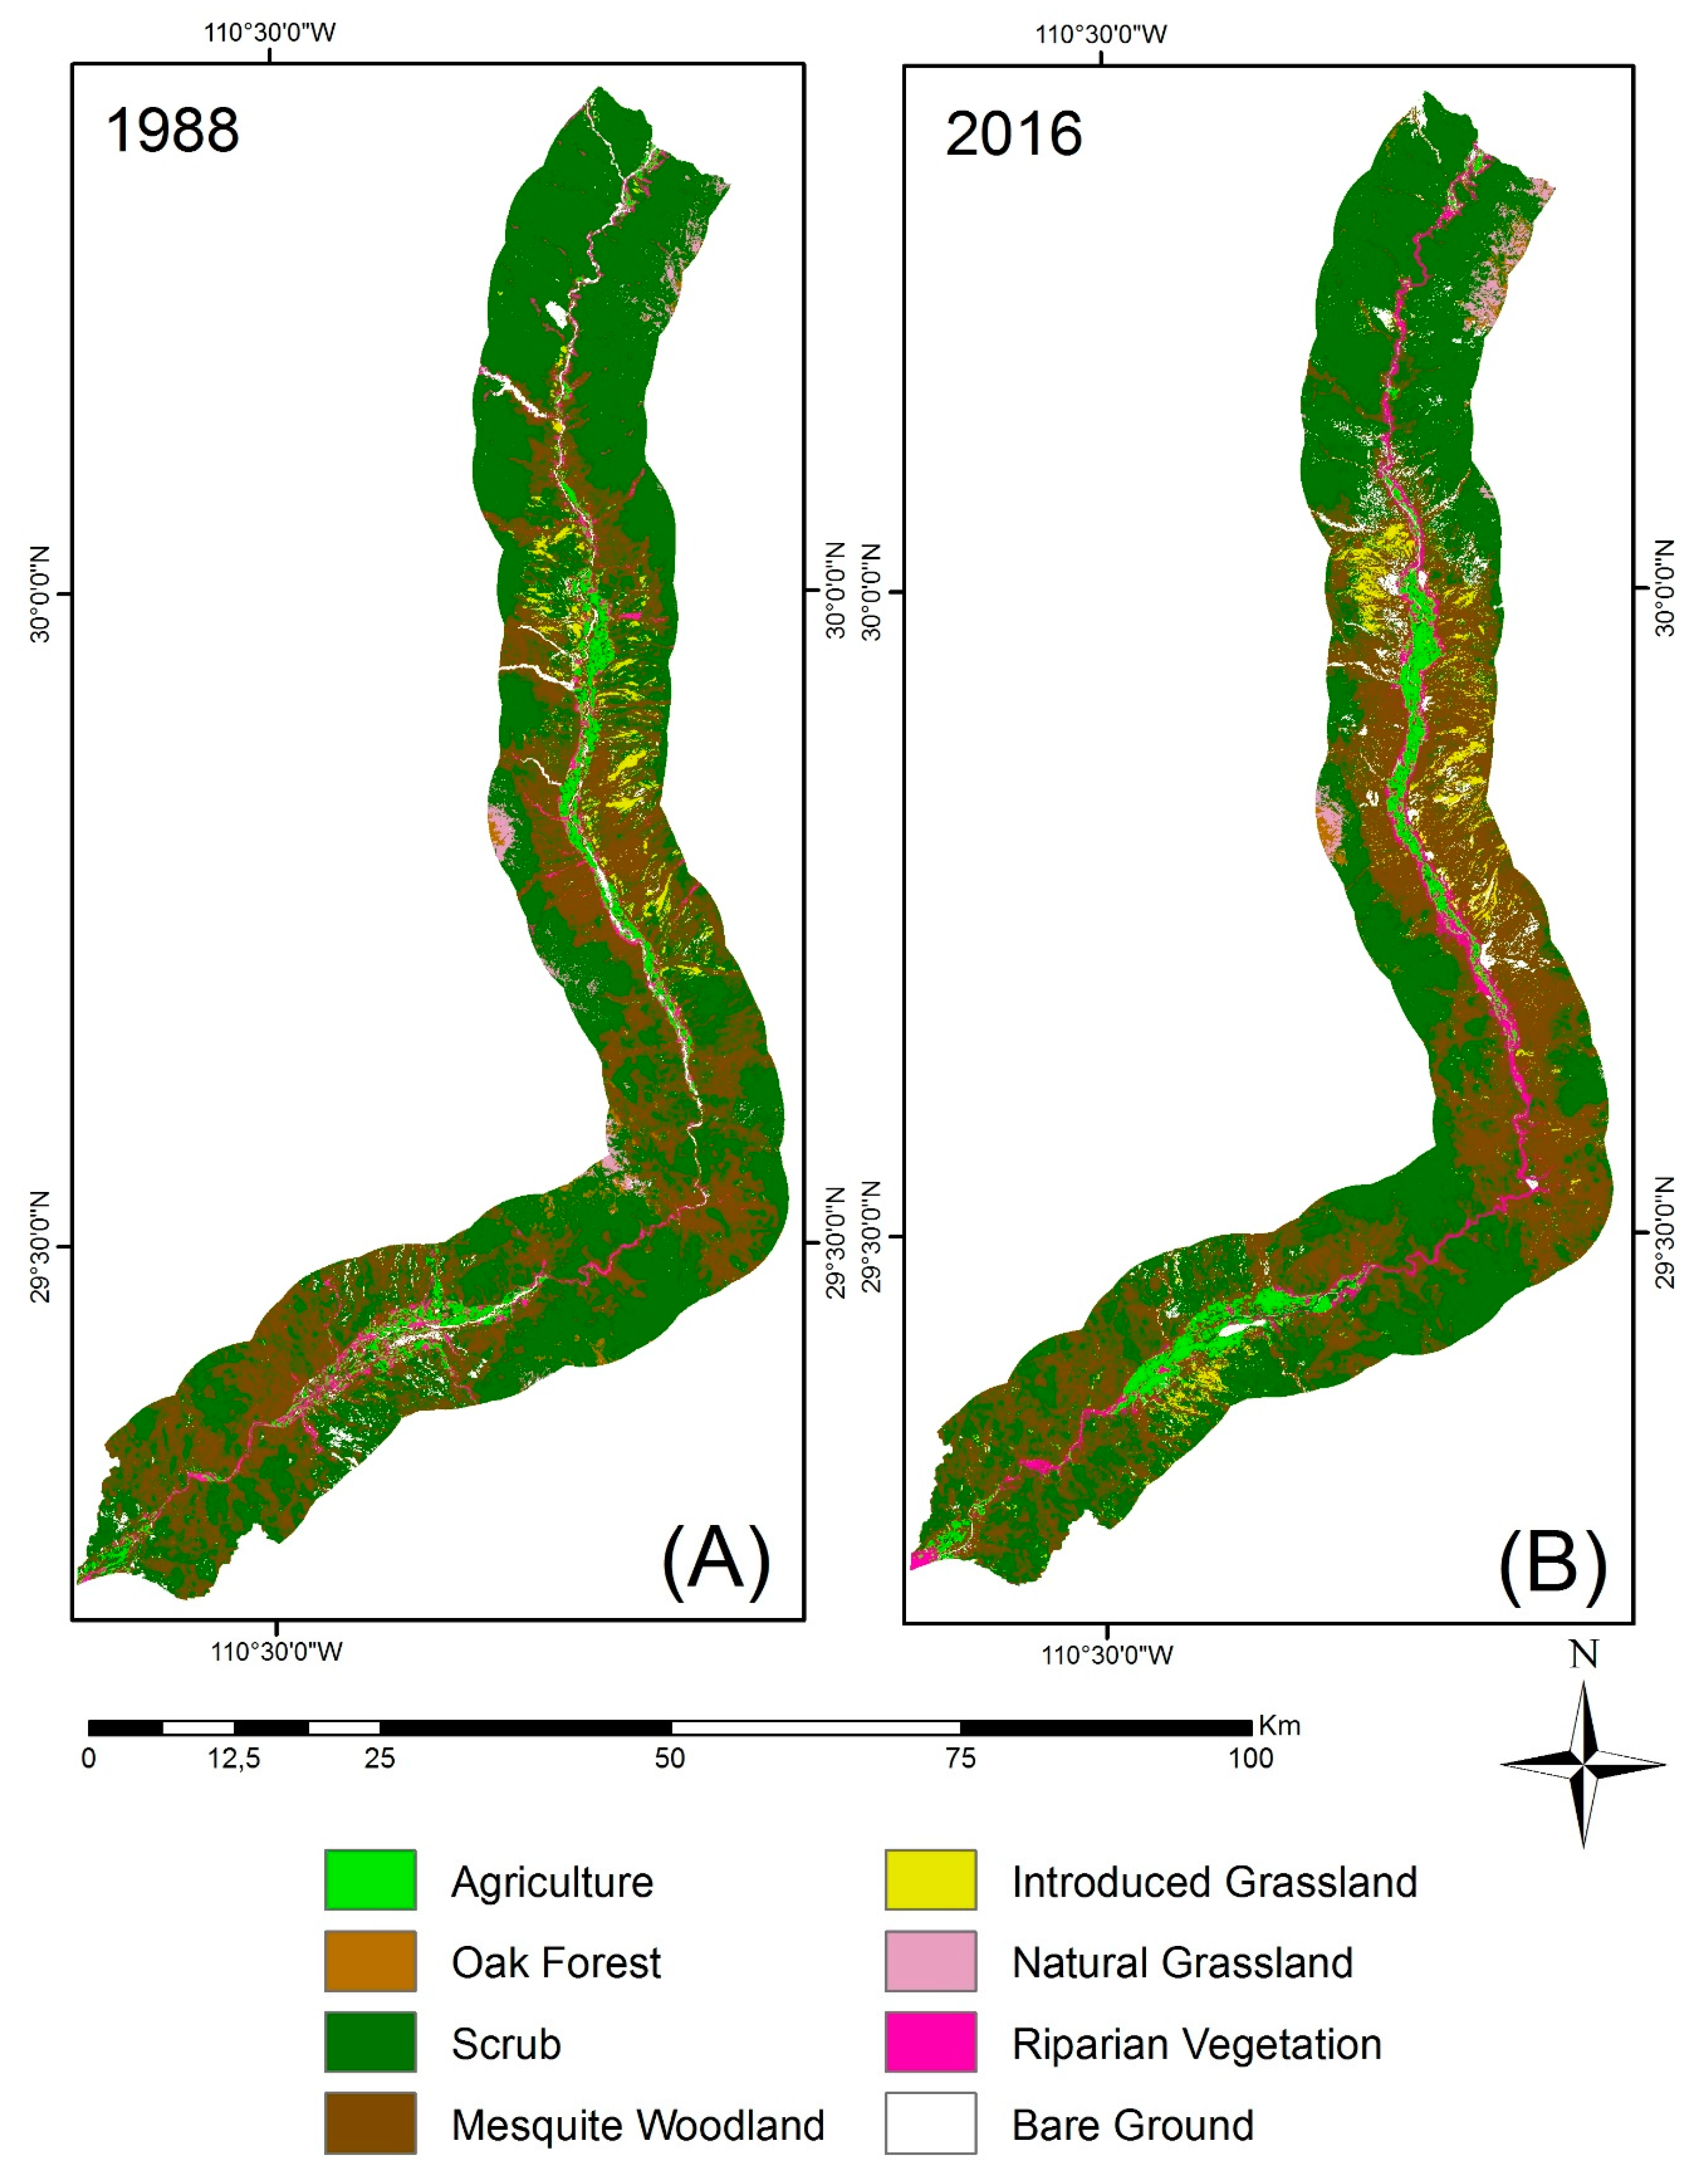
3.2. Land Cover Trends for 1988 and 2016 Based on Landsat

Total cover for each class, along with cover change in percentage, are presented in Table 7. Natural vegetation distributed closer to the river, such as Mesquite Woodland and Riparian Vegetation, show an increase, and those further away from it, such as Oak Forest, Scrub and Natural Grassland, show a decrease.
From 1988 to 2016, land cover classes associated with human activities, such as Agriculture and Introduced Grassland, show a significant increase of 30% and 60%, respectively. Bare Ground presents a 26% increase, which could be attributed to the expansion of the main rural communities (towns) along the river, as well as the opening of a silver–gold mine in the municipality of Banamichi in 2011. Riparian Vegetation also presents a considerable increase of 40%, with an important part of this occurring in the central section of the corridor, mostly within the municipality of Baviacora; this increase is also evident in the northern part within the municipality of Arizpe. Even when a significant increase represents the general cover trend for Riparian Vegetation, we could determine (from field experience and knowledge of the current riparian landscape) that most of it is composed of facultative riparian species and riparian shrubs. Thus, this percentage is not representative of obligate riparian species cover.
The most extensive land cover changes of natural vegetation occurred for Scrub and Mesquite Woodland, where the first one presented a 17,597 hectares decrease, and the second one, a 9639 hectares increase. The central part of the corridor is where mesquite shows most of its increment.

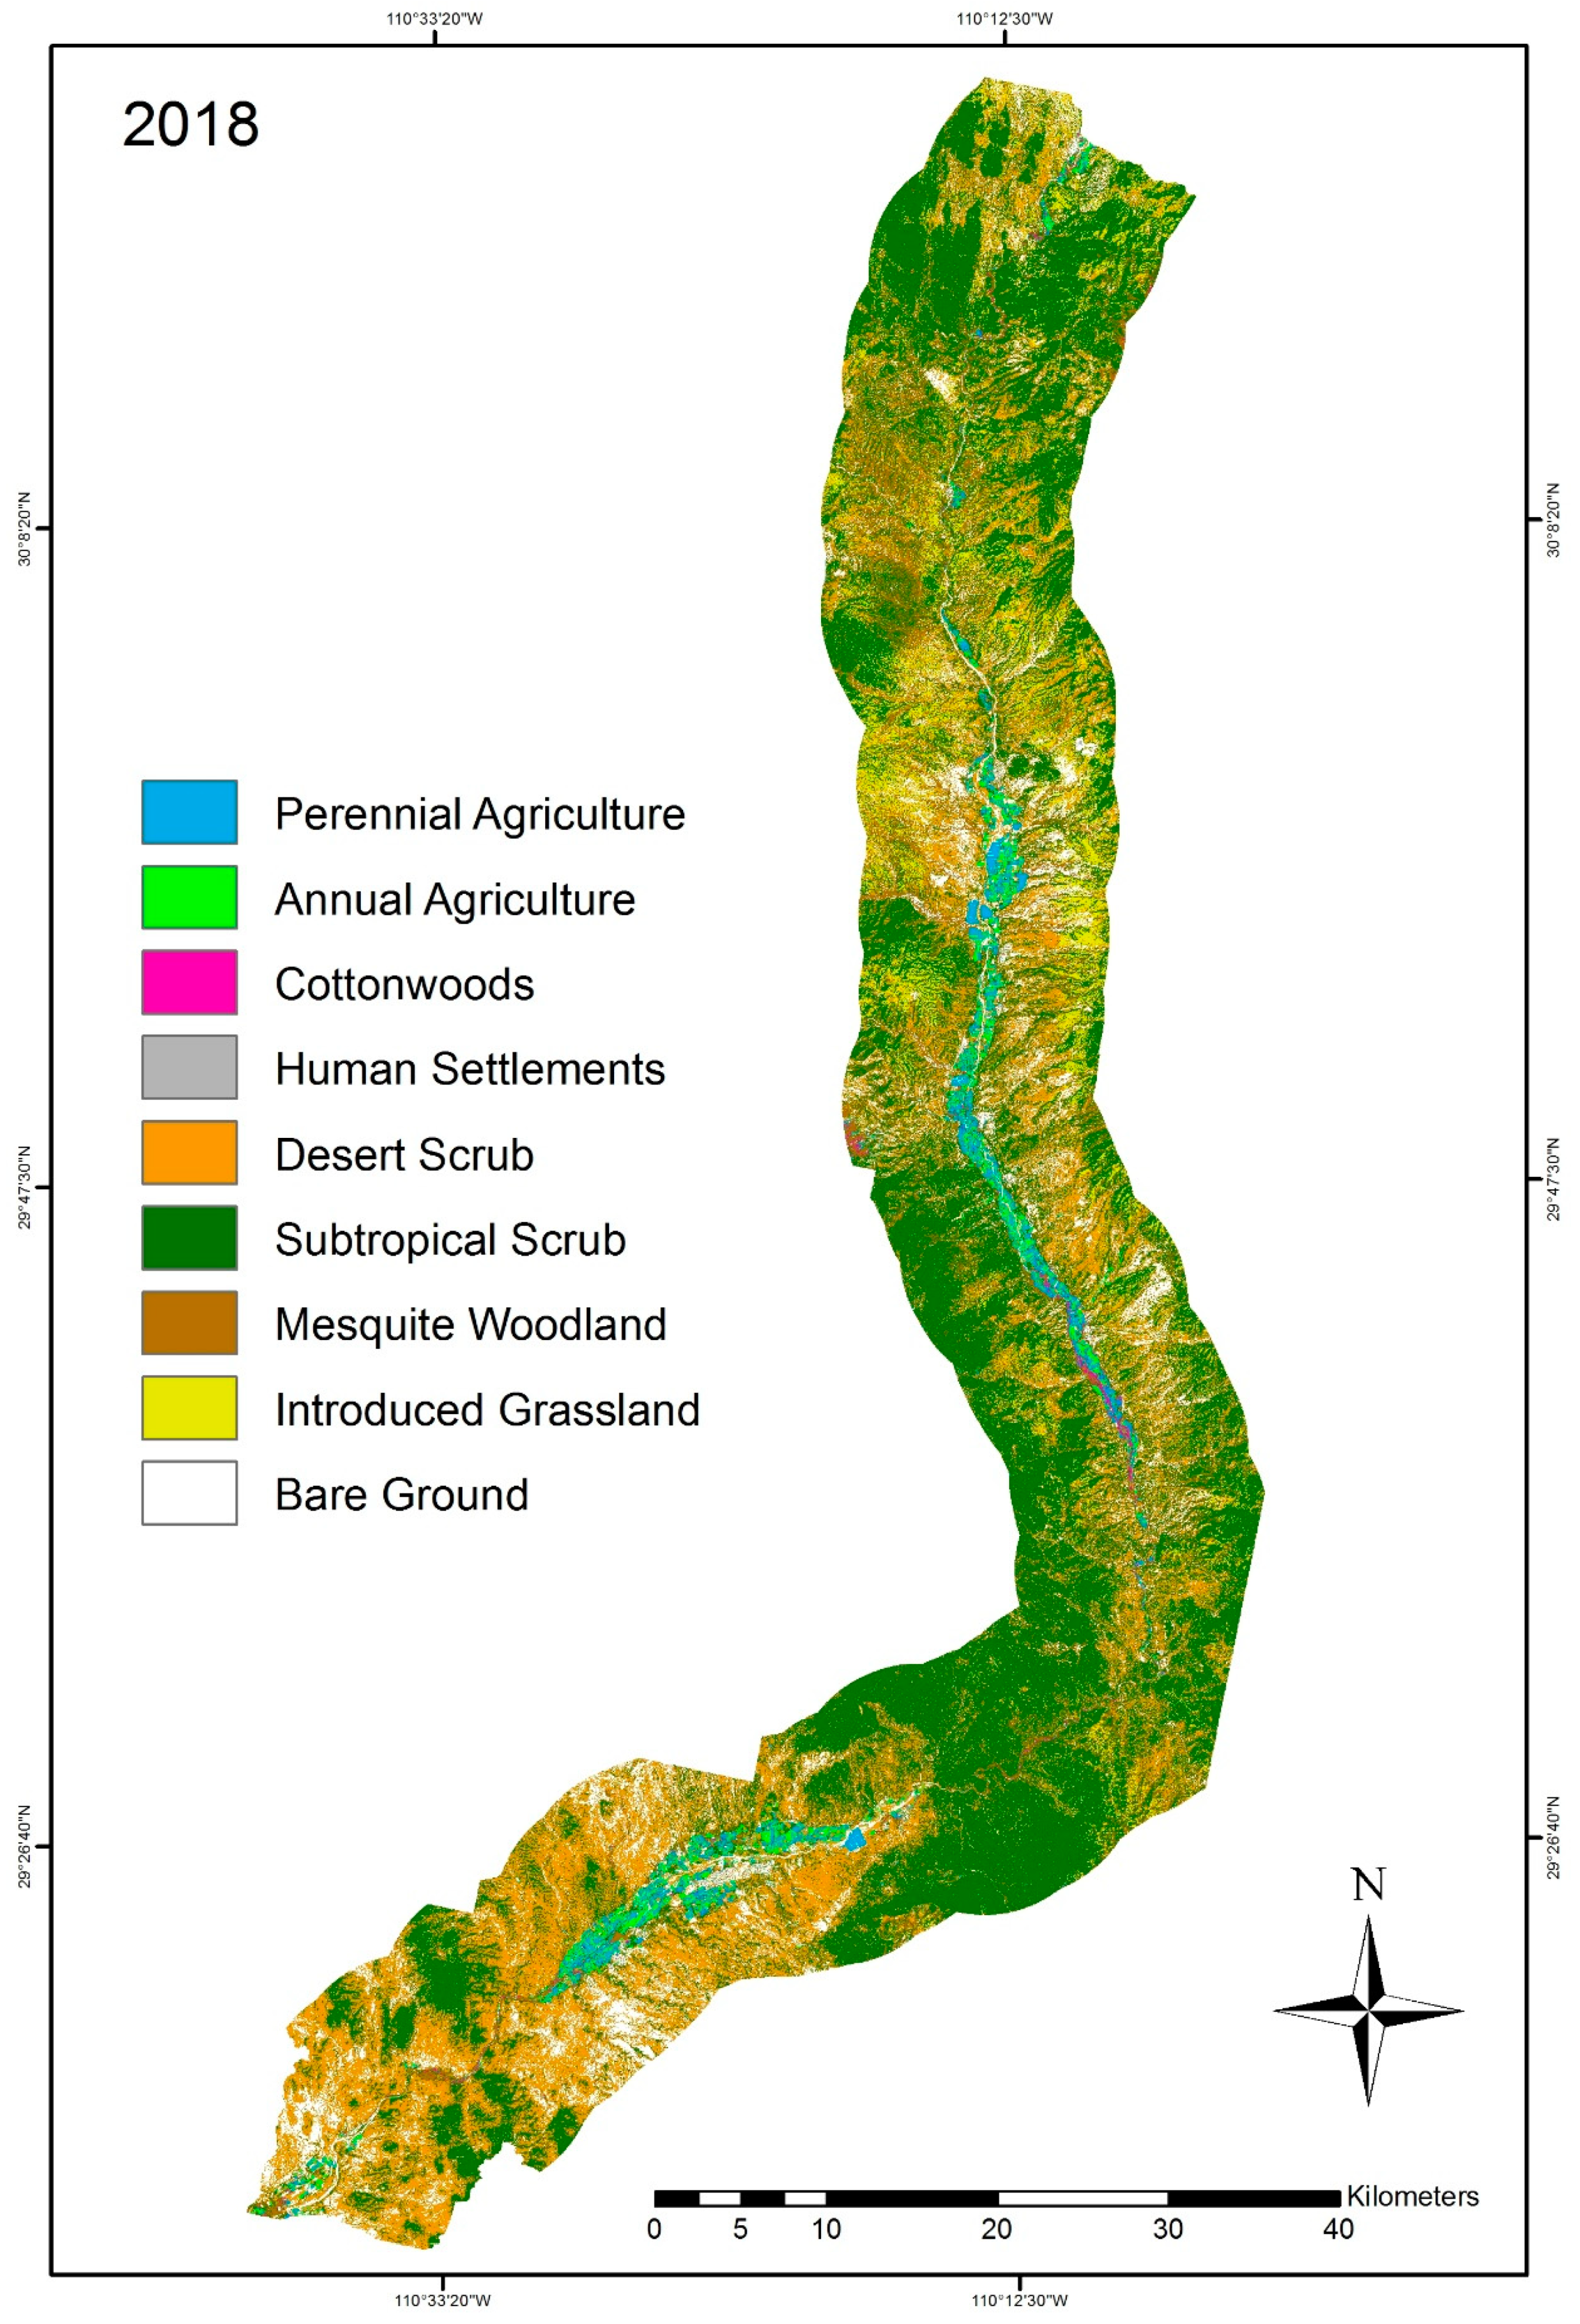
3.3. High Spatial Resolution Classification for 2018

This classification depicts a spatially detailed representation of the distribution of land uses and vegetation types in the region for 2018 (Figure 3). Total cover in hectares and percentage of the entire study area are presented in Table 8.
A higher spatial resolution allows for a further subdivision of cover classes and, therefore, for the observation of the landscape configuration in more detail. For the present study, four coarse classes were differentiated into subclasses, which are described in the Methods section (Table 4).
Agriculture. According to our findings, both agricultural types (perennial and annual) represent only a small fraction of the landscape (2% and 1.6%, respectively). However, their expansion and proximity to the river represents a constant threat to natural vegetation, given that agricultural cover greatly exceeds that of riparian vegetation.
Riparian. Cottonwoods register a total cover of 752 hectares, which corresponds to less than 1% of the total study area cover. Even when riparian corridors in these regions are naturally narrow, cottonwood cover is extremely reduced compared to the entire extent of agricultural cover (perennial and annual), which is ten times greater (922 ha). According to our results, a significant part of the vegetation adjacent to the river is represented by facultative riparian species (15,836 ha) especially in the northern and southern regions, as well as in the Mazocahui Sierra region.
Scrub. Subtropical Scrub is the most characteristic vegetation type in the region, and it covers practically half of the study area (98,099 ha), it is distributed along the whole corridor and it becomes denser as elevation increases. Desert Scrub covers almost 30% of the region, with 56,611 hectares, and it mostly occurs in flat areas; it dominates the landscape in the southern tip of the corridor.
Towns. Human Settlements are usually hard to classify given the complexity of their composition. Pixels classified as human settlements correspond to the roofs of houses, and the rest of the towns are classified as bare ground because of the roads. Therefore, the 198 hectares of human settlements are an underestimation, given that significant parts of the towns are roads.

3.4. Change Detection Analysis for 1988 and 2016

Land cover transitions for each class from 1988 to 2016, along with total change in hectares, are presented in Table 9. Subsequently, we explain some of the main cover trends for the classes of interest (Agriculture, Riparian Vegetation and Introduced Grassland).
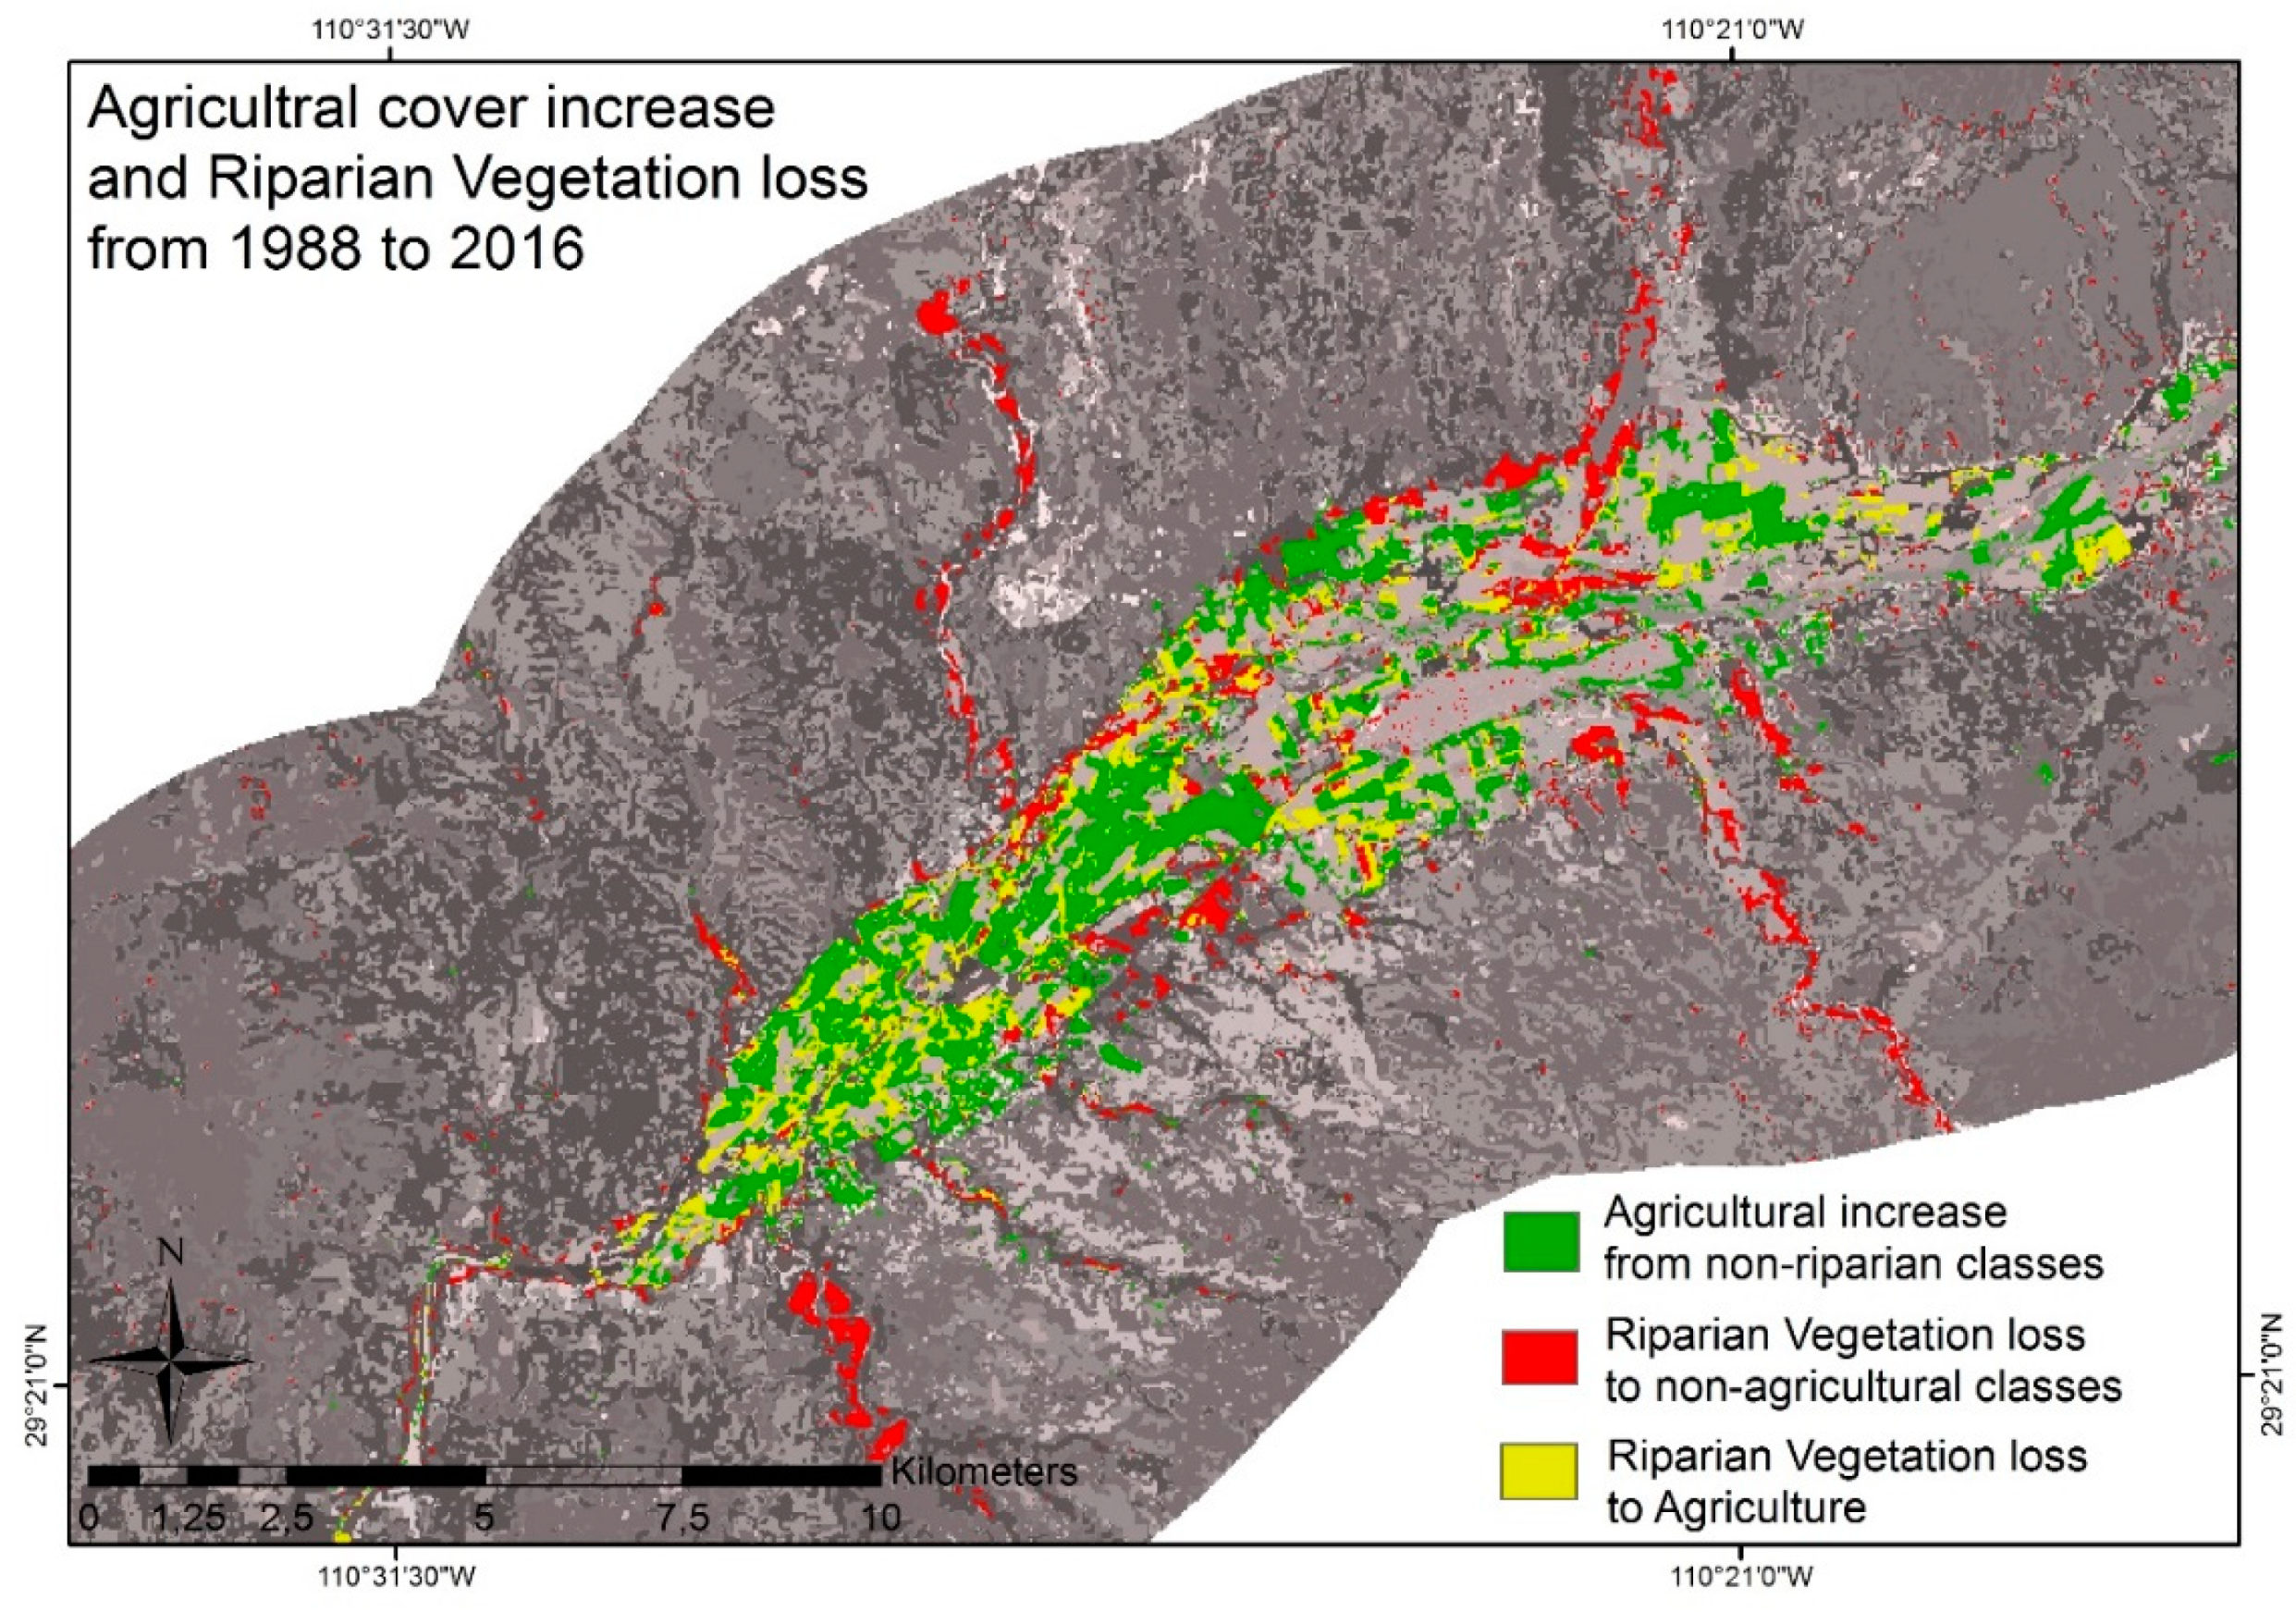
Agricultural trends. Land cover transitions for Agriculture (Table 9) include a total increase of 2222 hectares in the corridor. Mesquite Woodland shows the greatest transition to Agriculture, with a total conversion of 2079 hectares. There is a total of 1622 hectares of Agriculture that converted to Riparian Vegetation and an opposite trend of 1220 hectares (Riparian Vegetation loss), showing a regular exchange between these two classes.
Riparian Vegetation trends. Land cover transitions for Riparian Vegetation (Table 9) occur mainly with Mesquite Woodland and Agriculture. The general trend for Riparian Vegetation registers a total increase of 2318 hectares in the corridor (although this is not representative of obligate riparian species condition). Our results show a conversion of 2246 hectares of Mesquite Woodland to Riparian Vegetation and 1622 hectares of Agriculture to Riparian Vegetation. All of the previous classes share similar spatial distribution and, given the dynamic nature of Riparian Vegetation, these exchanges are common. There is also a registered loss of 1823 hectares of Riparian Vegetation that converted to Mesquite Woodland. Figure 4 shows areas with the greatest expansion of Agriculture.
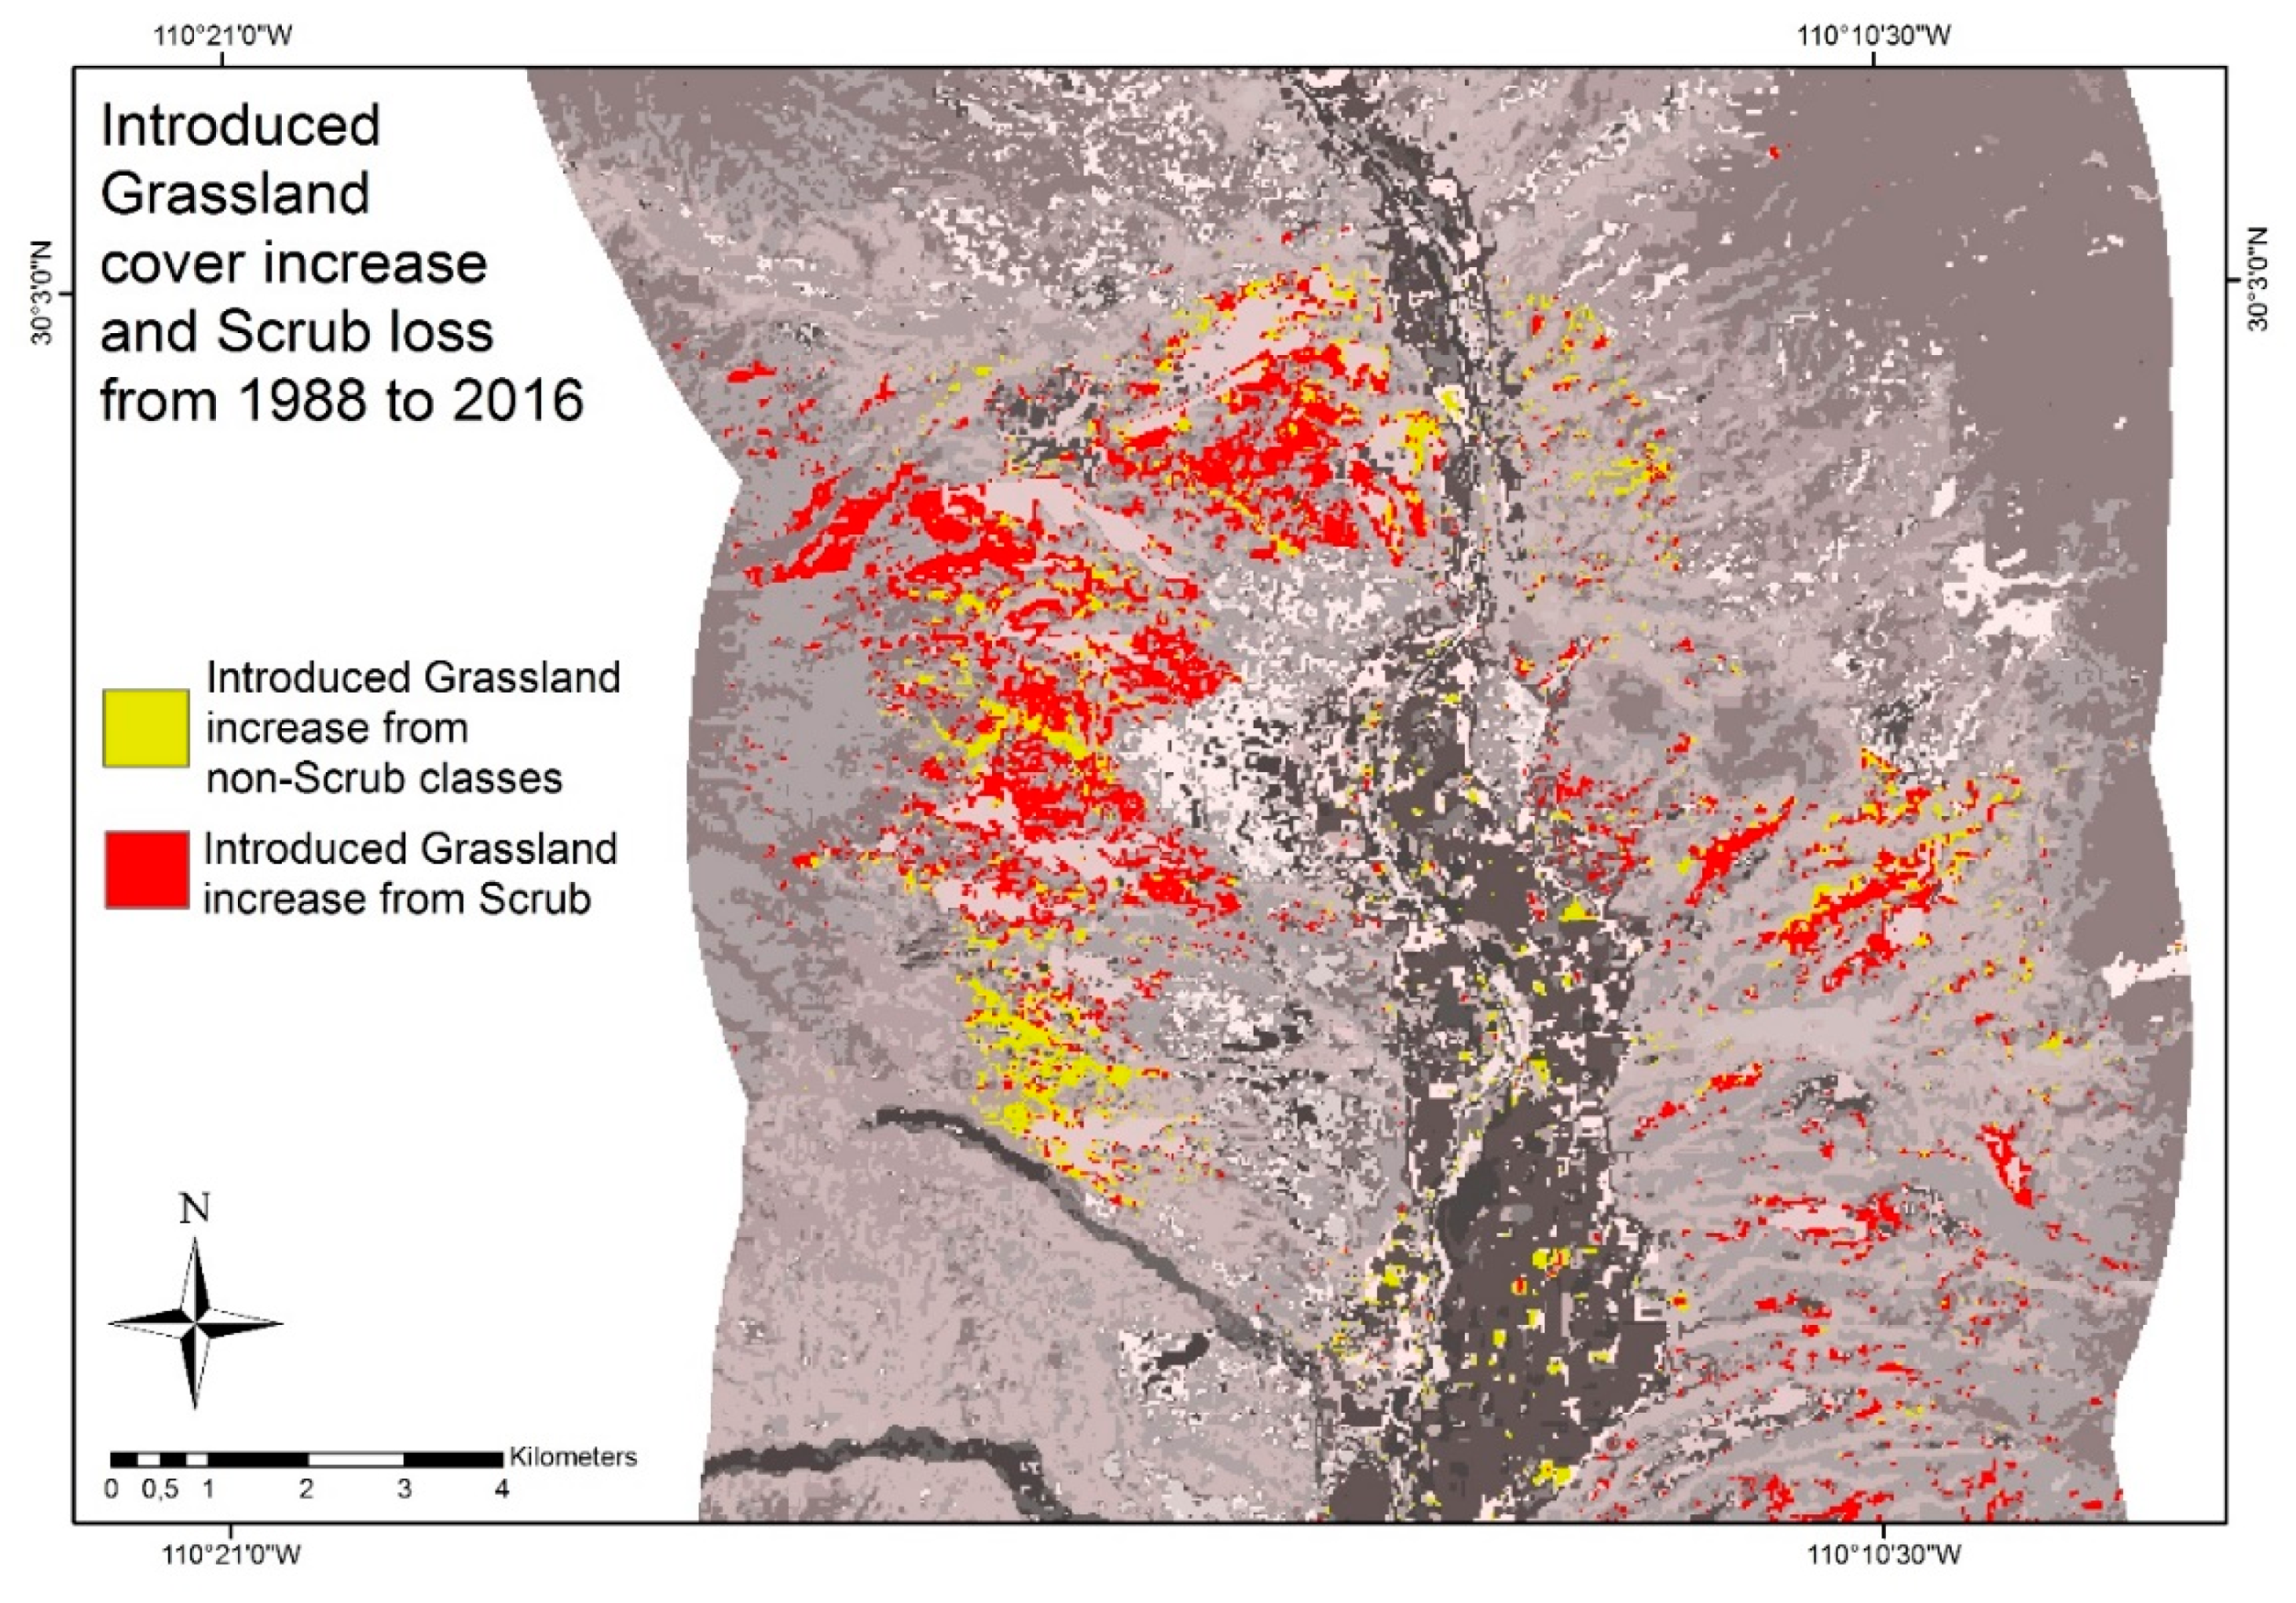
Introduced Grassland trends. Land cover transitions for Introduced Grassland (Table 9) show a total increase of 2226 hectares in the study area, which represents a 60% increase compared to the previously registered cover. According to our results, this class mostly affected areas of Scrub and Mesquite Woodland cover types, leading to the conversion of 2957 and 1185 hectares, respectively. Figure 5 shows areas with the greatest expansion of this class.

3.5. Fragmentation Assessment

This section presents the landscape configuration assessment for the LULC maps generated from Landsat data, to address changes between 1988 and 2016. This analysis registers key landscape modifications, represented by an increase in fragmentation for several natural vegetation classes, as well as an increase in connectivity for some anthropogenic-induced classes.
As mentioned in the previous section, classes adjacent to the river (Agriculture and Riparian Vegetation) follow a similar trend, with an increase in cover and regular exchange with Mesquite Woodland. These classes also present an increase in Mean Patch Area and Aggregation, along with a decrease in Number of Patches (Table 10).
Scrub follows a different trend, with an increase in Number of Patches, and a decrease in Mean Patch Area (from 9.8 to 6.6 hectares); however, given the broad distribution of this class, aggregation remains similar (0.9) between the two years. Mesquite follows a unique trend, with an increase in the number of patches, a slight decrease in patch area and stable aggregation values.
For most native vegetation classes (Oak Forest, Scrub and Mesquite Woodland), there is a sign of degradation indicated by an increase in the number of patches and a reduction in patch size. However, aggregation remains stable for Scrub and Mesquite, most likely because they cover most of the landscape.

4. Discussion

4.1. Land Cover Trends for Moderate and High Spatial Resolution Classifications

When using Landsat’s moderate spatial resolution to define land cover, some overarching classes are discerned. However, higher spatial resolution data allow for a better subdivision of classes, providing a better understanding of the processes taking place in highly dynamic landscapes associated to riparian ecosystems. In the following sections, we discuss the most relevant findings related to Riparian Vegetation and Agriculture composition and distribution, Mesquite Woodlands’ trends near the river and adjacent plains, and major exchanges for Introduced Grassland and Scrub.

4.1.1. Riparian Vegetation and Agriculture

By using Landsat TM and OLI satellite data collection coupled with high spatial resolution imagery from PlanetScope-P2 sensors, it was possible to reconstruct historic land use trends and derive information about the landscape configuration of the riparian corridor. Our observations suggest that land cover types distributed nearest to the river (Agriculture, Mesquite Woodland and Riparian Vegetation) show similar trends, with an increase in cover and high exchange rates among them. Our findings agree with previous studies, which suggest that, due to the highly dynamic flow of water and material, as well as rapid changes in land use, vegetation in riparian ecosystems undergoes constant changes in composition, structure and distribution [18,30,38,64].
Obligate riparian cover classes are difficult to detect and separate from other vegetation types based on moderate spatial resolution datasets, particularly due to their small aerial extents. Therefore, the changes in Riparian Vegetation distribution detected through Landsat’s TM and OLI sensors correspond to areas with a mixture of obligate riparian, facultative riparian, exotic, naturalized and mesic species. The analysis of high spatial resolution data helped us determine that obligate riparian species are present in a very low proportion and represent only 9% of the total riparian vegetation cover. Therefore, the increase in Riparian Vegetation detected by moderate spatial resolution sensors does not represent an increase in obligate riparian species exclusively. According to our results, Mesquite Woodlands were converted to Agriculture and Riparian Vegetation near the river and streams; while in other areas, they expanded at the expense of Scrub. Thus, there is less mesquite near the river and more on the adjacent plains. Based on these observations, the processes that account for most of the Riparian Vegetation increase relate to the expansion of species that have been replacing native vegetation in riparian ecosystems in Sonora, such as Arundo donax, Cynodon dactylon, Ricinus comunis, Nicotiana glauca and Parkinsonia aculeata [36], and, to a lesser extent, to obligate riparian and facultative riparian species expansion.
In previous reports, obligate riparian species, such as cottonwoods, show they are restricted to places with specific groundwater levels [30,65]. On the other hand, mesquite and other facultative riparian species are distributed near streams with varying levels, but are usually found where groundwater is at deeper levels than those required for the establishment or sustenance of obligate riparian species [66,67]. Thus, the spatial differentiation between obligate riparian and facultative riparian species is crucial, since the absence of obligate riparian species could serve as an indicator of a decline in water availability [68]. Additionally, the loss of riparian habitats composed by obligate riparian species constitutes a dramatic modification of potential ecosystem services tied to biodiversity, water quality and quantity and cultural heritage [69,70,71,72].
Although agricultural cover represents a small percentage of the total study area, its presence has a profound effect on the distribution and composition of the riparian habitat [24,29,73,74,75]. This is mostly because agricultural needs are easier to cover near the river, where fertile soils and access to water are guaranteed. This has resulted in the active replacement of native vegetation stands [13,17]. However, the opposite phenomenon is also common, where the abandonment of agricultural fields [76] allows for native vegetation regeneration. Therefore, exchanges between riparian vegetation and agricultural cover tend to occur regularly in the area [30]. Some transitions that were observed directly in the field included the re-establishment of riparian forests in places where the river flooded agricultural fields and left them unsuitable for crops. According to local knowledge and in situ observations, some of these areas are now composed of cottonwood forests.
The analysis of high spatial resolution data allowed for the differentiation between perennial and annual crops. This approach is relevant because most of the perennial cover is composed of pecan tree orchards, which have been introduced to the region in recent decades [77] and have different water requirements than annual crops. Based on our results, perennial agriculture currently covers a larger extent than annual agriculture; if perennial cover increases in the following years, this might further increase the pressure on native vegetation due to water use [29,73]. Additionally, this could have other implications in the agricultural sector, indicating a shift from a subsistence to a commercial type of activity [78,79].

4.1.2. Introduced Grassland and Scrub

In our study area, land cover classes representing human activities are progressively increasing and replacing natural vegetation (e.g., Agriculture replaces Riparian Vegetation and Introduced Grassland replaces Scrub). Similar dynamics are documented for this and other regions, where agricultural and ranching activities are identified as major drivers of change in natural vegetation communities [13,16,80,81,82].
In accordance with previous studies, our study area registered a significant increase of 60% in Introduced Grassland cover (mainly Cenchrus ciliaris) during the period studied. The management and maintenance of Introduced Grassland are beyond the scope of this study. Thus, we could not assess how much of this registered increase is due to the intentional opening of new rangelands or to the invasive processes that characterize buffelgrass [82,83,84,85]. Nonetheless, from our change detection analysis, we can observe the conversion of almost 3000 hectares of Scrub to Introduced Grassland. These results are consistent with previous LULCC studies in the region, which determined that Desert Scrub is one of the most threatened vegetation types in Sonora, progressively decreasing in extent due to buffelgrass invasion [30,86,87,88].
In addition to the effects of Introduced Grassland on Scrub, there is also an increase in Mesquite Woodland cover and a significant conversion of 32,496 hectares from Scrub to Mesquite Woodland. Similar woody encroachment processes have been reported for other regions, particularly in the Southwest USA [89,90]. This encroachment contributes to the structural change in scrubs and grasslands, affects biodiversity and ecological dynamics and can modify the provision of ecosystem services in these habitats [91,92,93,94]. Mesquite encroachment can also affect riparian corridors due to hydrological changes provoked by the woody invasion of adjacent ecosystems [95,96,97].

4.2. Fragmentation and Implications of Habitat Loss

Patch Area and Class Aggregation for Riparian Vegetation show an increase through the analyzed time series, nonetheless, the regular exchange of this class with Agricultural cover and the small extension of obligate riparian species cover in the corridor represent a significant modification of the riparian landscape and could be considered as signs of declining resilience in the system.
These changes in riparian vegetation are frequently associated with disturbance (the opening of agricultural fields, highways and roads and overgrazing), and when they co-occur with other processes, such as groundwater decline or soil salinization, the probability of invasion by exotic species (e.g., Tamarix spp.), or replacement by native facultative riparian species (e.g., Prosopis sp.) can increase [68,98,99,100]. Some studies have registered how fragmentation of the riparian landscape can negatively affect biodiversity by limiting aquatic species dispersion [101]. The loss of obligate species stands due to landscape fragmentation can also have adverse effects on wintering birds since many migrant species prefer cottonwood riparian woodlands due to their structural complexity and food abundance [20].
The present study supports and adds new evidence to previous observations, which suggest rapid modifications that could lead to the degradation of riparian ecosystems in the region [24,29]. Evidence suggests that the main drivers for land cover changes in these ecosystems in Sonora are derived from the unregulated development of primary activities, such as agriculture and cattle ranching [7,12,102]. Our results suggest that anthropogenic activities constitute key controls for the current state of riparian ecosystems in the region.

4.3. Multiple Resolution Datasets

As satellite data increase in their availability and temporal repertoire, future applications for higher resolution data are promising [103,104]. Our results show that high spatial resolution data are ideal to generate detailed maps of spatially restricted habitats, such as riparian ecosystems in arid and semi-arid regions. However, the historical availability of high spatial resolution sensors is still not enough to conduct a long-term change detection analysis. In this respect, moderate resolution data provided by Landsat continue to be ideal for the time series analysis of several land surface processes [105,106,107].
The difference in spatial resolution between Landsat TM and OLI and PlanetScope makes a direct comparison a very challenging endeavor, since the desegregation of land cover classes occurs at the schematic level (different classes), but also because of spatial resolution characteristics of the sensors. Therefore, pixels from a moderate resolution sensor might contain different classes only discernible at finer spatial scale (high spatial resolution sensors).
Our results made this apparent in a few of the classes present in our study area, where land cover differences, for similar classes under both schemes (and spatial resolutions), can be perceived (Table 7 and Table 8). To highlight this, we found that the PlanetScope (2018)-based Bare Ground class shows a significant difference from the same class under Landsat OLI (2016). Many areas of bare ground (like those present in the sandy sections of the river, or bare ground patches within other land cover classes) were classified as such under the high-resolution analysis, and as another class (the dominant one) under the coarse-resolution analysis.
Something similar happens when comparing the Introduced Grassland class cover using the two different sensors. Large extensions of Grassland were classified as other vegetation types (Scrub or Mesquite) under the moderate-resolution analysis, due to the dominance in reflectance by woody species. In contrast, Grassland patches were clearly differentiated from other land cover types under the high-resolution analysis. Confusion between Scrub and Mesquite Woodland classes, mostly due to similarities in vegetation structure and response, has been reported before for Landsat-based classifications [30]. However, when using PlanetScope data, it is likely that Mesquite Woodland and Scrub were easier to differentiate, generating a more detailed classification map due to pixel size.
These results provide evidence for how higher spatial resolution data can help in the detailed assessment and mapping of vegetation. However, it also highlights the usefulness of using coarser spatial resolution for management, when representing regional changes in overarching classes. The use of high spatial resolution datasets for classification can yield accurate representations of highly segregated and heterogeneous landscapes. The difference in spatial resolution, when comparing results from different sensors, is a subject that requires further research and discussion.
The landscape configuration analysis based on high spatial resolution data provided valuable information about riparian vegetation composition and distribution. The low cover values of obligate riparian species and their uneven distribution along the corridor are relevant findings that highlight the need for improvement in management and monitoring efforts in our region.

5. Conclusions

We report important trends in LULCC for a historically productive and ecologically understudied region in central Sonora. By using combined multi-sensor and multi-spectral data sets with different spatial and temporal resolutions, and a well-established and replicable set of methods, we were able to determine the general state of natural vegetation types and anthropogenic cover in the riparian corridor of the Río Sonora Subwatershed.
The greatest cover gains in percentage during the time series analysis corresponded to Introduced Grassland, Riparian Vegetation and Agriculture. The high spatial resolution analysis provided more information about LULCC and landscape configuration, determining that Riparian Vegetation expansion did not entirely represent obligate riparian species expansion. The small percentage of Cottonwoods cover indicates that the rest of the Riparian Vegetation expansion corresponded to other vegetation assemblages, including exotic, naturalized and mesic species.
Additionally, agricultural cover in the region, as seen through the high spatial resolution analysis, greatly exceeded obligate riparian species cover, thus representing a significant conversion of the natural riparian landscape into a predominantly anthropogenic landscape. Mesquite Woodland and Riparian Vegetation were the two classes affected most by agricultural conversion.
Our results also show a degradation of the Scrub class, presenting the greatest extension loss and a significant fragmentation increase. This is a consequence of large Scrub areas converting to Mesquite Woodland and Introduced Grassland, thus indicating the progression of invasion processes in the region driven by woody encroachment and exotic species expansion.
The general landscape state of the riparian corridor is represented by an increase in Agriculture and a regular exchange of this class with riparian classes. Further studies are needed to address how LULCC in the region affects ecosystem service provision and determine the socioecological implications of the loss of obligate riparian species. The implementation of appropriate management, as well as restoration and conservation projects, is highly recommended. Given that there are no protected areas or restoration projects in our study area, successful examples of these for other rivers and wetlands in the region [108,109,110,111] should be considered as opportunities to be replicated in the riparian corridor of RSSW.

Author Contributions

L.C.-D. was the primary author and all authors contributed to the final paper. J.R.R.-L. contributed to set and discuss the idea for this research, and helped in all steps of the analysis, and the development of the manuscript. K.H. and W.J.D.v.L., were involved in the process of the land cover classification and provided advise for the development of products. A.C.-V. and G.E.P.-C. provided advise and insight on the research development. All authors have read and agreed to the published version of the manuscript.

Funding

The authors would like to thank the National Council for Science and Technology of Mexico (CONACYT) for the support of LCD, through a postgraduate scholarship. Also, AEC and JRRL acknowledge and thank the support of grants from CONACYT (CB223525) and Universidad de Sonora (USO313006186).

Acknowledgments

LCD would like to thank the Posgrado en Biociencias at Universidad de Sonora, for the constant support of this work. Also, the Arizona Remote Sensing Center for their guidance and advice on data processing and management. JRRL and AEC thank Universidad de Sonora, for the general support of this project. Finally, the authors thank the Earth Explorer United States Geological Survey site for access to Landsat data, as well as the Education and Research Program from Planet Labs Inc for access to PlanetScope data.

Conflicts of Interest

The authors declare no conflict of interest.

References

  1. Shukla, P.R.; Skea, J.; Buendia, E.C.; Masson-Delmotte, V.; Pörtner, H.-O.; Roberts, D.C.; Zhai, P.; Slade, R.; Connors, S.; Diemen, R.V.; et al. (Eds.) Technical Summary. In Climate Change and Land: An IPCC Special Report on Climate Change, Desertification, Land Degradation, Sustainable Land Management, Food Security, and Greenhouse Gas Fluxes in Terrestrial Ecosystems; IPCC: Geneva, Switzerland, 2019; in press. [Google Scholar]
  2. Montanarella, L.; Scholes, R.; Brainich, A. The IPBES Assessment Report on Land Degradation and Restoration; The Intergovernmental Science-Policy Platform on Biodiversity and Ecosystem Services (IPBES): Bonn, Germany, 2018. [Google Scholar]
  3. Steffen, W.; Sanderson, A.; Tyson, P.; Jäger, J.; Matson, P.; Moore, B.M., III; Oldfield, F.; Richardson, K.; Schellnhuber, H.J.; Turner, B.L.I.; et al. Global Change and the Earth System. A Planet Under Pressure; Springer: Berlin/Heidelberg, Germany, 2005; p. 346. [Google Scholar]
  4. Turner, M.G.; Chapin, F.S. Causes and Consequences of Spatial Heterogeneity in Ecosystem Function. In Ecosystem Function in Heterogeneous Landscapes; Lovett, G.M., Turner, M.G., Jones, C.G., Weathers, K.C., Eds.; Springer Science+Business Media, Inc.: New York, NY, USA, 2005; p. 494. [Google Scholar]
  5. Chhabra, A.; Geist, H.; Houghton, R.A.; Habrel, H.; Braimoh, A.K.; Vlek, P.L.G.; Patz, J.; Xu, J.; Ramankutty, N.; Coomes, O.; et al. Multiple Impacts of Land-Use/Cover Change. In Land-Use and Land-Cover Change. Local Processes and Global Impacts; Lambin, E.F., Geist, H., Eds.; Springer: Berlin/Heidelberg, Germany, 2006; p. 236. [Google Scholar]
  6. Colón, S.S.; MArtínez, A.F.; Cruz-Leyva, I.A.; Velázquez, A. Estado y transformación de los ecosistemas terrestres por causas humanas. In Capital Natural de México: Estado de Conservación y Tendencias de Cambio; Dirzo, R., González, R., March, I.J., Eds.; CONABIO: Mexico City, Mexico, 2009; Volume II, pp. 75–129. [Google Scholar]
  7. Tinoco-Ojanguren, C.; Andrade, J.L.; Briones, O.; Castellanos, A.E. Functional diversity in plants: Implications for conservation issues of the Mexican biodiversity. In Mexican Natural Resources Management and Biodiversity Conservation. Recent Case Studies; Ortega-Rubio, A., Ed.; Springer International Publishing: Cham, Switzerland, 2018; p. 587. [Google Scholar]
  8. Rinke, K.; Keller, P.S.; Kong, X.; Borchardt, D.; Weitere, M. Ecosystem services from inland waters and their aquatic ecosystems. In Atlas of Ecosystem Services. Drivers, Risks, and Societal Responses; Schröter, M.B.A., Klotz, S., Seppelt, R., Baessler, C., Eds.; Springer International Publishing: Cham, Switzerland, 2019. [Google Scholar]
  9. Capon, S.J.; Chambers, L.E.; Nally, R.M.; Naiman, R.J.; Davies, P.; Marshall, N.; Pittock, J.; Reid, M.; Capon, T.; Douglas, M.; et al. Riparian ecosystems in the 21st century: Hotspots for climate change adaptation? Ecosystems 2013, 16, 359–381. [Google Scholar] [CrossRef]
  10. Chiu, M.-C.; Leigh, C.; Mazor, R.; Cid, N.; Resh, V. Anthropogenic Threats to Intermittent Rivers and Ephemeral Streams. In Intermittent Rivers and Ephemeral Streams. Ecology and Management; Datry, T., Bonanda, N., Boulton, A., Eds.; Elsevier Inc.: Amsterdam, The Netherlands, 2017; pp. 433–454. [Google Scholar]
  11. Sabater, S.; Timoner, X.; Bornette, G.; Wilde, M.D.; Stromberg, J.C.; Stella, J.C. The Biota of Intermittent Rivers and Ephemeral Streams: Algae and Vascular Plants. In Intermittent Rivers and Ephemeral Streams. Ecology and Management; Datry, T., Bonanda, N., Boulton, A., Eds.; Elsevier Inc.: Amsterdam, The Netherlands, 2017; pp. 189–216. [Google Scholar]
  12. Castellanos-Villegas, A.; Bravo, L.; Koch, G.; Llano, J.; López, D.; Méndez, R.; Rodríguez, J.; Romo, R.; Sisk, T.D.; Yanes-Arvayo, G. Impactos ecológicos por el uso del terreno en el funcionamiento de ecosistemas áridos y semiáridos. In Diversidad Biológica de Sonora; Freaner, F.M., Devender, T.V., Eds.; UNAM-CONABIO: Mexico City, Mexico, 2010; pp. 157–186. [Google Scholar]
  13. Martínez-Yrízar, A.; Felger, R.S.; Búrquez, A. Los ecosistemas terrestres: Un diverso capital natural. In Diversidad Biológica de Sonora; Freaner, F.M., Devender, T.V., Eds.; UNAM-CONABIO: Mexico City, Mexico, 2010; pp. 129–156. [Google Scholar]
  14. Gómez-Álvarez, A.; Villalba-Atondo, A.; Acosta-Ruíz, G.; Castañeda-Olivares, M.; Kamp, R. Metales pesados en el agua superficial del río San Pedro durante 1997 y 1999. Rev. Int. Contam. Ambient. 2004, 20, 5–12. [Google Scholar]
  15. Guzmán, H.M.; Gómez-Álvarez, A.; Valenzuela-García, J.L.; Encinas-Romero, M.A.; Villalba-Atondo, A.I.; Encinas-Soto, K.K. Assessment of the impact on sediment quality from abandoned artisanal mine runoffs in a semi-arid environment (the Sonora River basin—Northwestern Mexico). Environ. Earth Sci. 2019, 78, 145. [Google Scholar] [CrossRef]
  16. Ávalos, H.C. Las Cuencas Hidrográficas de México. Diagnóstico y Priorización; Pluralia Ediciones e Impresiones S.A. de C.V.: Del Carmen Coyoacán, Mexico, 2010. [Google Scholar]
  17. Scott, M.L.; Nagler, P.L.; Glenn, E.P.; Valdes-Casillas, C.; Erker, J.A.; Reynolds, E.W.; Shafroth, P.B.; Gomez-Limon, E.; Jones, C.L. Assessing the extent and diversity of riparian ecosystems in Sonora, Mexico. Biodivers. Conserv. 2009, 18, 247–269. [Google Scholar] [CrossRef]
  18. Webb, R.H.; Leake, S.A.; Turner, R.M. The Ribbon of Green. Change in Riparian Vegetation in the Southwestern United States, 1st ed.; The University of Arizona Press: Tucson, AZ, USA, 2007. [Google Scholar]
  19. Hunt, R.; Anderson, W. A Rapid Biological and Ecological Inventory and Assessment of the Cajon Bonito Watershed, Sonora, Mexico. Part 1: Natural History. Desert Plants 2002, 18, 3–20. [Google Scholar]
  20. Villaseñor-Gómez, J.F. Habitat use of wintering bird communities in Sonora, Mexico: The importance of riparian habitats. Stud. Avian Biol. 2008, 37, 53–68. [Google Scholar]
  21. Flesch, A.D.; Warshall, P.; Jacobs, S. Avian richness, status, and conservation in the Northwestern Neotropics in Sonora, Mexico. Nat. Areas J. 2015, 35, 288–296. [Google Scholar] [CrossRef]
  22. Hamilton, B.T.; Roeder, B.L.; Hatch, K.A.; Eggett, D.L.; Tingey, D. Why is small mammal diversity higher in riparian areas than in uplands? J. Arid Environ. 2015, 119, 41–50. [Google Scholar] [CrossRef] [Green Version]
  23. Ewel, K.C.; Cressa, C.; Kneib, R.T.; Lake, P.S.; Levin, L.A.; Palmer, M.A.; Snelgrove, P.; Wall, D.H. Managing critical transition zones. Ecosystems 2001, 4, 452–460. [Google Scholar] [CrossRef]
  24. Mendez-Estrella, R.; Romo-Leon, J.; Castellanos, A. Mapping changes in carbon storage and productivity services provided by riparian ecosystems of semi-arid anvironments in Northwestern Mexico. Int. J. Geo Inf. 2017, 6, 298. [Google Scholar] [CrossRef]
  25. Moreno Vázquez, J.L. Trasvase de agua y conflicto social en la cuenca del río Yaqui. In Dimensiones Sociales en el Manejo de Cuencas; Burgos, A.L., Bocco, G., Ramírez, J.S., Eds.; UNAM: Ciudad de México, Mexico, 2015. [Google Scholar]
  26. Turner, M.G.; Gardner, R.H. Landscape Ecology in Theory and Practice. Pattern and Process; Springer: New York, NY, USA, 2015. [Google Scholar] [CrossRef]
  27. Aizpuro, F.J.G. Evaluación de la Dinámica de Cambio de Cobertura de Suelo en las Subcuencas Río San Miguel y Río Zanjón, Sonora; Universidad de Sonora: Hermosillo, Mexico, 2015. [Google Scholar]
  28. Solis-Garza, G.; Robles-López, H.; Castellanos-Villegas, A.E. Estructura y composición de la vegetación ribereña en zonas áridas. El caso de los ríos Bacanuchi y Sonora en el Noroeste de México. Biotecnia 2017, 19, 10. [Google Scholar] [CrossRef]
  29. Cornejo-Denman, L.; Romo-Leon, J.; Castellanos-Villegas, A.; Diaz-Caravantes, R.; Moreno-Vázquez, J.; Méndez-Estrella, R. Assessing riparian vegetation condition and function in disturbed sites of the arid Northwestern Mexico. Land 2018, 7, 13. [Google Scholar] [CrossRef] [Green Version]
  30. Mendez-Estrella, R.; Romo-Leon, J.; Castellanos, A.; Gandarilla-Aizpuro, F.; Hartfield, K. Analyzing landscape trends on agriculture, introduced exotic grasslands and riparian ecosystems in arid regions of Mexico. Remote Sens. 2016, 8, 664. [Google Scholar] [CrossRef] [Green Version]
  31. Petrakis, R.E.; van Leeuwen, W.J.D.; Villarreal, M.L.; Tashjian, P.; Dello Russo, R.; Scott, C.A. Historical analysis of riparian vegetation change in response to shifting management objectives on the Middle Rio Grande. Land 2017, 6, 29. [Google Scholar] [CrossRef] [Green Version]
  32. INEGI. GUÍA Para la Interpretación de Cartografía: Uso de Suelo y Vegetación: Escala 1:250,000: Serie VI; Instituto Nacional de Estadística y Geografía: Aguascalientes, Mexico, 2017. [Google Scholar]
  33. INEGI. Uso de Suelo y Vegetación; Instituto Nacional de Estadística y Geografía: Aguascalientes, Mexico, 2018; Available online: https://www.inegi.org.mx/temas/usosuelo/ (accessed on 20 September 2017).
  34. Cardille, J.A.; Turner, M.G. Understanding landscape metrics. In Learning Landscape Ecology. A Practical Guide to Concepts and Techniques; Gergel, S.E., Turner, M.G., Eds.; Springer: Berlin/Heidelberg, Germany, 2017; p. 349. [Google Scholar]
  35. Yirigui, Y.; Lee, S.; Nejadhashemi, A. Multi-scale assessment of relationships between fragmentation of riparian forests and biological conditions in streams. Land 2019, 11, 60. [Google Scholar] [CrossRef] [Green Version]
  36. Van Devender, T.; Felger, R.; Fishbein, M.; Molina-Freaner, F.; Sánchez-Escalante, J.; Reina-Guerrero, A. Biodiversidad de las plantas vasculares. In Diversidad Biológica de Sonora; Molina-Freaner, F., Van Devender, T., Eds.; UNAM-CONABIO: Mexico City, Mexico, 2010; pp. 229–262. [Google Scholar]
  37. Búrquez, A.; Martínez-Yrízar, A. Conservation and landscape transformation in Sonora, México. J. Southwest 1997, 39, 371–398. [Google Scholar]
  38. Villarreal, M.; Leeuwen, W.V.; Romo, J.R. Mapping and monitoring riparian vegetation distribution, structure and composition with regression tree models and post-classification change metrics. Int. J. Remote Sens. 2012, 33, 4266–4290. [Google Scholar] [CrossRef]
  39. CONAGUA. Programa Detallado de Acciones de Gestión Integral Para la Restauración Hidrológica del Río Sonora; Comision Nacional del Agua: México City, Mexico, 2013.
  40. Chan, D. Using Ecosystem Services to Understand the Impact of Land Cover Change: A Case Study of the Upper San Pedro Watershed; University of Arizona: Tucson, AZ, USA, 2013. [Google Scholar]
  41. Martínez, A.A.H.; Rojo, H.M.A.; Bringas, I.C.T. El valor de los servicios ambientales en la cuenca baja del río Mayo. Región y Sociedad 2015, 27, 31–59. [Google Scholar] [CrossRef]
  42. USGS. Landsat Collection. Available online: https://earthexplorer.usgs.gov/ (accessed on 10 October 2017).
  43. Planet, T. Planet Application Program Interface: In Space for Life on Earth. Available online: https://www.planet.com/ (accessed on 10 November 2018).
  44. CESAVE-SIAFESON. Red de Estaciones Meteorológicas Automáticas de Sonora. Available online: http://www.siafeson.com/remas (accessed on 15 September 2019).
  45. CICESE-CONACYT. Programa Estatal de Acción ante el Cambio Climático-Baja California. Available online: http://peac-bc.cicese.mx/ (accessed on 15 September 2019).
  46. Romo-Leon, J.R.; van Leeuwen, W.J.D.; Castellanos-Villegas, A. Using remote sensing tools to assess land use transitions in unsustainable arid agro-ecosystems. J. Arid Environ. 2014, 106, 27–35. [Google Scholar] [CrossRef]
  47. Planet. Planet Imagery Product Specification: PlanetScope & RapidEye; Planet Team: San Francisco, CA, USA, 2016. [Google Scholar]
  48. Tso, B.; Mather, P.M. Classification Methods for Remotely Sensed Data, 2nd ed.; CRC Press-Taylor & Frances Group: Boca Raton, FL, USA, 2009; p. 357. [Google Scholar]
  49. Huete, A.; Didan, K.; Miura, T.; Rodriguez, E.P.; Gao, X.; Ferreira, L.G. Overview of the radiometric and biophysical performance of the MODIS vegetation indices. Remote Sens. Environ. 2002, 83, 195–213. [Google Scholar] [CrossRef]
  50. Huete, A. A Soil-Adjusted Vegetation Index (SAVI). Remote Sens. Environ. 1988, 25, 295–309. [Google Scholar] [CrossRef]
  51. Baig, M.H.A.; Zhang, L.; Shuai, T.; Tong, Q. Derivation of a tasselled cap transformation based on Landsat 8 at-satellite reflectance. Remote Sens. Lett. 2014, 5, 423–431. [Google Scholar] [CrossRef]
  52. Crist, E.P.; Cicone, R.C. A physically-based transformation of Thematic Mapper Data—The TM Tasseled Cap. IEEE Trans. Geosci. Remote Sens. 1984, GE-22, 256–263. [Google Scholar] [CrossRef]
  53. Woodcock, C.E.; Collins, J.B.; Gopal, S.; Jakabhazy, V.D.; Li, X.; Macomber, S.; Ryherd, S.; Judson Harward, V.; Levitan, J.; Wu, Y.; et al. Mapping forest vegetation using Landsat TM imagery and a canopy reflectance model. Remote Sens. Environ. 1994, 50, 240–254. [Google Scholar] [CrossRef]
  54. USGS. National Elevation Dataset. Available online: https://doi.org/10.3133/fs14899 (accessed on 15 November 2017).
  55. Anderson, J.R.; Hardy, E.E.; Roach, J.T.; Witmer, R.E. A Land Use Land Cover Classification System for Use with Remote Sensor Data; Survey, U.S.G., Ed.; United States Government Printing Office: Washington, DC, USA, 1976; p. 41.
  56. Jensen, J.R. Introductory Digital Image Processing. A remote Sensing Perspective; Pearson Prentice Hall: Upper Saddle River, NJ, USA, 2005. [Google Scholar]
  57. Bustamante, K.A. Efectos de Factores Ambientales y Uso de Suelo en la Fenología de Tres Áreas Prioritatias Para la Conservación en el Noroeste de México; Universidad de Sonora: Hermosillo, Sonora, Mexico, 2016. [Google Scholar]
  58. INEGI. Imágenes del Territorio-Ortoimágenes; Instituto Nacional de Estadística y Geografía: Aguascalientes, Mexico, 2018; Available online: https://www.inegi.org.mx/temas/imagenes/ortoimagenes/ (accessed on 15 October 2018).
  59. Congalton, R.G. A review of assessing the accuracy of classifications of remotely sensed data. Remote Sens. Environ. 1991, 37, 35–46. [Google Scholar] [CrossRef]
  60. Foody, G.M. Status of land cover classification accuracy assessment. Remote Sens. Environ. 2002, 80, 185–201. [Google Scholar] [CrossRef]
  61. He, H.S.; DeZonia, B.E.; Mladenoff, D.J. An aggregation index (AI) to quantify spatial patterns of landscapes. Landsc. Ecol. 2000, 15, 591–601. [Google Scholar] [CrossRef]
  62. McGarigal, K. Fragstats Help; University of Massachusetts: Amherst, MA, USA, 2015; p. 182. [Google Scholar]
  63. Hesselbarth, M.H.K.; Sciaini, M.; With, K.A.; Wiegand, K.; Nowosad, J. Landscapemetrics: An open-source R tool to calculate landscape metrics. Ecography 2019, 42, 1648–1657. [Google Scholar] [CrossRef] [Green Version]
  64. Stromberg, J. Riparian mesquite forests: A review of their ecology, threats, and recovery potential. J. Ariz. Nev. Acad. Sci. 1993, 27, 111–124. [Google Scholar]
  65. Lite, S.J.; Bagstad, K.J.; Stromberg, J.C. Riparian plant species richness along lateral and longitudinal gradients of water stress and flood disturbance, San Pedro River, Arizona, USA. J. Arid Environ. 2005, 63, 785–813. [Google Scholar] [CrossRef]
  66. Stromberg, J. Fremont cottonwood-goodding willow riparian forests: A review of their ecology, threats, and recovery potential. J. Ariz. Nev. Acad. Sci. 1993, 26, 97–110. [Google Scholar]
  67. Hultine, K.R.; Froend, R.; Blasini, D.; Bush, S.E.; Karlinski, M.; Koepke, D.F. Hydraulic traits that buffer deep-rooted plants from changes in hydrology and climate. Hydrol. Process. 2020, 34, 209–222. [Google Scholar] [CrossRef]
  68. Johnson, R.R.; Carothers, S.W.; Finch, D.M.; Kingsley, K.J.; Stanley, J.T. Riparian Research and Management: PAST, Present, Future: Volume 1.; Gen. Tech. Rep. RMRS-GTR-377; US Department of Agriculture, Forest Service, Rocky Mountain Research Station: Fort Collins, CO, USA, 2018; p. 240.
  69. Nabhan, G.; Sheridan, T. Living fencerows of the Rio San Miguel, Sonora, Mexico: Traditional technology for floodplain management. Hum. Ecol. 1977, 5, 97–111. [Google Scholar] [CrossRef]
  70. Richardson, D.; Holmes, P.; Esler, K.; Galatowitsch, S.; Stromberg, J.; Kirkamn, S.; Pysek, P.; Hobbs, R. Riparian vegetation: Degradation, alien plant invasions, and restoration prospects. Divers. Distrib. 2007, 13, 126–139. [Google Scholar] [CrossRef]
  71. Fernald, A.; Tidwell, V.; Rivera, J.; Rodríguez, S.; Guldan, S.; Steele, C.; Ochoa, C.; Hurd, B.; Ortiz, M.; Boykin, K.; et al. Modeling sustainability of water, environment, livelihood, and culture in traditional irrigation communities and their linked watersheds. Sustainability 2012, 4, 2998–3022. [Google Scholar] [CrossRef] [Green Version]
  72. Palmquist, E.C.; Ralston, B.E.; Merritt, D.M.; Shafroth, P.B. Landscape-scale processes influence riparian plant composition along a regulated river. J. Arid Environ. 2018, 148, 54–64. [Google Scholar] [CrossRef]
  73. Adams, A.S.; Vázquez, J.L.M.; Ley, A.N.L. Agricultura y manejo sustentable del acuífero de la Costa de Hermosillo. Región y Sociedad 2012, 3, 155–179. [Google Scholar]
  74. Grismer, M.E. Putah Creek hydrology affecting riparian cottonwood and willow tree survival. Environ. Monit. Assess. 2018, 190, 458. [Google Scholar] [CrossRef]
  75. Torre, H.C.; Moreno, J.L. Resiliencia del sistema socio-ecológico en la región subcuenca baja Río Sonora. Est. Soc. Rev. Aliment. Contemp. Desarro. Reg. 2019, 29, 3–36. [Google Scholar]
  76. Romo-Leon, J.R.; van Leeuwen, W.J.D.; Castellanos-Villegas, A. Land use and environmental variability impacts on the phenology of arid agro-ecosystems. Environ. Manag. 2016, 57, 283–297. [Google Scholar] [CrossRef]
  77. SAGARHPA. Situación Actual del Cultivo de Nogal Pecanero en Sonora; Secretaría de Agricultura, Ganadería, Desarrollo Rural, Pesca y Alimentación: Hermosillo, Mexico, 2017.
  78. Sierra, Á.B.; Dessens, N.V.; Barrón, R.M. La nueva agricultura sonorense: Historia reciente de un viejo negocio. Región y Sociedad 2007, 19, 51–70. [Google Scholar]
  79. Vásquez-León, M. One decade of drought and two of neoliberal reforms in the Sierra Sonorense: Responses by the rural poor. South. Rural Sociol. 2009, 24, 44–66. [Google Scholar]
  80. Castellanos, A.E.; Celaya-Michel, H.; Rodríguez, J.C.; Wilcox, B.P. Ecohydrological changes in semiarid ecosystems transformed from shrubland to buffelgrass savanna. Ecohydrology 2016, 9, 1663–1674. [Google Scholar] [CrossRef]
  81. Franklin, K.; Molina-Freaner, F. Consequences of buffelgrass pasture development for primary productivity, perennial plant richness, and vegetation structure in the drylands of Sonora, Mexico. Conserv. Biol. 2010, 24, 1664–1673. [Google Scholar] [CrossRef]
  82. Castellanos, A.; Celaya, H.; Hinojo Hinojo, C.; Ibarra, A.; Romo Leon, J. Biodiversity effects on ecosystem function due to land use: The case of buffel savannas in the Sky Islands seas in the central region of Sonora. In USDA Forest Service Proceedings RMRS-P-67; United States Department of Agriculture: Washington, DC, USA, 2012. [Google Scholar]
  83. Marshall, V.M.; Lewis, M.M.; Ostendorf, B. Buffel grass (Cenchrus ciliaris) as an invader and threat to biodiversity in arid environments: A review. J. Arid Environ. 2012, 78, 1–12. [Google Scholar] [CrossRef]
  84. Castellanos, A.; Yanes, G.; Valdez-Zamudio, D. Drought-tolerant exotic buffel-grass and desertification. In Proceedings of the Weeds Across Borders: Proceedings of a North American Conference, Tucson, AZ, USA, 1–3 May 2002; pp. 99–112. [Google Scholar]
  85. Franklin, K.A.; Lyons, K.; Nagler, P.L.; Lampkin, D.; Glenn, E.P.; Molina-Freaner, F.; Markow, T.; Huete, A.R. Buffelgrass (Pennisetum ciliare) land conversion and productivity in the plains of Sonora, Mexico. Biol. Conserv. 2006, 127, 62–71. [Google Scholar] [CrossRef]
  86. Kepner, W.G.; Watts, C.J.; Edmonds, C.M.; Maingi, J.K.; Marsh, S.E.; Luna, G. A landscape approach for detecting and evaluating change in a semi-arid environment. Environ. Monit. Assess. 2000, 64, 179–195. [Google Scholar] [CrossRef]
  87. Valdez-Zamudio, D.; Castellanos, A.; Mash, S. Land cover changes in central Sonora, Mexico. In Proceedings of the Land Stewardship in the 21st Century: The Contributions of Watershed Management, Tucson, AZ, USA, 13–16 March 2000. [Google Scholar]
  88. Arriaga, L.; Castellanos, A.; Moreno, E.; Alarcón, J. Potential ecological distribution of alien invasive species and risk assessment: A case study of buffel grass in arid regions of Mexico. Conserv. Biol. 2004, 18, 1504–1514. [Google Scholar] [CrossRef]
  89. Wilcox, B.P. Does rangeland degradation have implications for global streamflow? Hydrol. Process. 2007, 21, 2961–2964. [Google Scholar] [CrossRef]
  90. Wilcox, B.P.; Sorice, M.G.; Young, M.H. Dryland ecohydrology in the Anthropocene: Taking stock of human–ecological interactions. Geogr. Compass 2011, 5, 112–127. [Google Scholar] [CrossRef]
  91. Hagen, C.A.; Taylor, K.A.; Bartuszevige, A.M.; Daniels, A.B.; De Leon, M.T.; Bogaerts, M. Slowing the tide of mesquite invasion: Using a bioindicator species to deliver conservation triage. J. Arid Environ. 2019, 168, 46–55. [Google Scholar] [CrossRef]
  92. Turpin-Jelfs, T.; Michaelides, K.; Biederman, J.A.; Anesio, A.M. Soil nitrogen response to shrub encroachment in a degrading semi-arid grassland. Biogeosciences 2019, 16, 369–381. [Google Scholar] [CrossRef] [Green Version]
  93. Hruska, T.; Toledo, D.; Sierra-Corona, R.; Solis-Gracia, V. Social–ecological dynamics of change and restoration attempts in the Chihuahuan Desert grasslands of Janos Biosphere Reserve, Mexico. Plant Ecol. 2017, 218, 67–80. [Google Scholar] [CrossRef]
  94. Andersen, E.M.; Steidl, R.J. Woody plant encroachment restructures bird communities in semiarid grasslands. Biol. Conserv. 2019, 240, 108276. [Google Scholar] [CrossRef]
  95. Nie, W.; Yuan, Y.; Kepner, W.; Erickson, C.; Jackson, M. Hydrological impacts of mesquite encroachment in the upper San Pedro watershed. J. Arid Environ. 2012, 82, 147–155. [Google Scholar] [CrossRef]
  96. Scott, R.L.; Huxman, T.E.; Williams, D.G.; Goodrich, D.C. Ecohydrological impacts of woody-plant encroachment: Seasonal patterns of water and carbon dioxide exchange within a semiarid riparian environment. Glob. Chang. Biol. 2006, 12, 311–324. [Google Scholar] [CrossRef]
  97. Huxman, T.E.; Wilcox, B.P.; Breshears, D.D.; Scott, R.L.; Snyder, K.A.; Small, E.E.; Hultine, K.; Pockman, W.T.; Jackson, R.B. Ecohydrological implications of woody plant encroachment. Ecology 2005, 86, 308–319. [Google Scholar] [CrossRef]
  98. Rood, S.B.; Braatne, J.H.; Goater, L.A. Responses of obligate versus facultative riparian shrubs following river damming. River Res. Appl. 2010, 26, 102–117. [Google Scholar] [CrossRef]
  99. Perry, L.G.; Reynolds, L.V.; Shafroth, P.B. Divergent effects of land-use, propagule pressure, and climate on woody riparian invasion. Biol. Invasions 2018, 20, 3271–3295. [Google Scholar] [CrossRef]
  100. Lake, P.S.; Bond, N.; Reich, P. Restoration ecology of intermittent rivers and ephemeral streams. In Intermittent Rivers and Ephemeral Streams; Datry, T., Bonada, N., Boulton, A., Eds.; Academic Press: Cambridge, MA, USA, 2017; pp. 509–533. [Google Scholar] [CrossRef]
  101. Stubbington, R.; Bogan, M.T.; Bonada, N.; Boulton, A.J.; Datry, T.; Leigh, C.; Vorste, R.V. The biota of intermittent rivers and ephemeral streams: Aquatic invertebrates. In Intermittent Rivers and Ephemeral Streams. Ecology and Management; Datry, T., Bonanda, N., Boulton, A., Eds.; Elsevier Inc.: Amsterdam, The Netherlands, 2017; pp. 217–243. [Google Scholar]
  102. Romo-León, J.R.; Leeuwen, W.J.D.V.; Villegas, A.C. Percepción remota para el análisis de la distribución y cambios de uso de suelo en zonas áridas y semiáridas. In Dinámicas Locales del Cambio Ambiental Global; Flores, E.S., Caravantes, R.E.D., Eds.; Universidad Autónoma de Ciudad Juárez: Ciudad Juárez, Mexico, 2013; p. 547. [Google Scholar]
  103. Kussul, N.; Lavreniuk, M.; Kolotii, A.; Skakun, S.; Rakoid, O.; Shumilo, L. A workflow for Sustainable Development Goals indicators assessment based on high-resolution satellite data. Int. J. Dig. Earth 2020, 13, 309–321. [Google Scholar] [CrossRef]
  104. Hojas Gascón, L.; Ceccherini, G.; García Haro, F.J.; Avitabile, V.; Eva, H. The potential of high resolution (5 m) RapidEye optical data to estimate above ground biomass at the national level over Tanzania. Forests 2019, 10, 107. [Google Scholar] [CrossRef] [Green Version]
  105. Bullock, E.L.; Woodcock, C.E.; Olofsson, P. Monitoring tropical forest degradation using spectral unmixing and Landsat time series analysis. Remote Sens. Environ. 2020, 238, 110968. [Google Scholar] [CrossRef]
  106. Hermosilla, T.; Wulder, M.A.; White, J.C.; Coops, N.C.; Hobart, G.W. Regional detection, characterization, and attribution of annual forest change from 1984 to 2012 using Landsat-derived time-series metrics. Remote Sens. Environ. 2015, 170, 121–132. [Google Scholar] [CrossRef]
  107. Powell, S.L.; Cohen, W.B.; Healey, S.P.; Kennedy, R.E.; Moisen, G.G.; Pierce, K.B.; Ohmann, J.L. Quantification of live aboveground forest biomass dynamics with Landsat time-series and field inventory data: A comparison of empirical modeling approaches. Remote Sens. Environ. 2010, 114, 1053–1068. [Google Scholar] [CrossRef]
  108. Cuenca Los Ojos. Habitat Restoration. Available online: https://cuencalosojos.org/pages/restoration (accessed on 10 November 2019).
  109. Schaffer, K. Friends of rancho el aribabi: Protecting a wildlife corridor. Wildlands Network. Available online: https://wildlandsnetwork.org/blog/friends-of-rancho-el-aribabi-protecting-a-corridor/ (accessed on 10 November 2019).
  110. Norman, L.; Villarreal, M.; Pulliam, H.R.; Minckley, R.; Gass, L.; Tolle, C.; Coe, M. Remote sensing analysis of riparian vegetation response to desert marsh restoration in the Mexican Highlands. Ecol. Eng. 2014, 70, 241–254. [Google Scholar] [CrossRef] [Green Version]
  111. Wilson, N.R.; Norman, L.M. Analysis of vegetation recovery surrounding a restored wetland using the Normalized Difference Infrared Index (NDII) and Normalized Difference Vegetation Index (NDVI). Int. J. Remote Sens. 2018, 39, 3243–3274. [Google Scholar] [CrossRef] [Green Version]
Figure 1. Location of study area. (A) Zoom in of the Riparian Corridor within the RSSW, elevation data shows large gradients along this stretch of the river. (B) Location of the Río Sonora Subwatershed (RSSW) within the state of Sonora.
Remotesensing 12 02519 g001
Figure 2. Thematic maps of Land Use Land Cover (LULC) in the Riparian corridor of the Río Sonora Subwatershed (derived from Landsat TM and OLI datasets). (A) Thematic map for year 1988. (B) Thematic map for year 2016.
Remotesensing 12 02519 g002
Figure 3. Thematic map of LULC in the Riparian corridor of the Río Sonora Subwatershed for year 2018 (derived from PlanetScope-PS2 datasets).
Remotesensing 12 02519 g003
Figure 4. Areas of Agriculture cover increase and Riparian Vegetation loss between 1988 and 2016. The southern section of the riparian corridor, located between Mazocahui and Topahue.
Remotesensing 12 02519 g004
Figure 5. Areas of Introduced Grassland cover increase and Scrub loss between 1988 and 2016. The central section of the riparian corridor, located near Banamichi.
Remotesensing 12 02519 g005
Table 1. Dates and scenes of Landsat (30m spatial resolution) and PlanetScope (~3m spatial resolution) multispectral imagery used for the land cover classification process.
Satellite/SensorYearSceneDate
Landsat 4 and 5 TM198835/39May 14/September 19
35/40June 23/August 26
Landsat 8 OLI201635/39May 27/September 16
35/40May 11/September 16
Satellite/SensorYearNumber of scenesDate
PlanetScope-PS2201829March 30
26September 11
Table 2. Variables derived from multispectral satellite datasets and topographic variables used in the classification process.
VariableDescriptionData sets
Normalized Difference Vegetation Index (NDVI)Spectral transformation that serves as a vegetation measure; it reduces several forms of noise present in multiple bands. Sensitive to soil darkening and vegetation development [49,50].Landsat TM and OLI, PlanetScope-PS2
Enhanced Vegetation Index (EVI)Spectral transformation that optimizes vegetation signal through a de-coupling of the canopy background signal and a reduction in atmosphere influences [49].Landsat TM and OLI, PlanetScope-PS2
Soil Adjusted Vegetation Index (SAVI)Transformation technique that minimizes soil brightness influences from spectral vegetation indices involving red and near-infrared wavelengths [50].Landsat TM and OLI, PlanetScope-PS2
Tasseled CapTransforms bands in an image into a new set of axes to relate them to physical properties (brightness, greenness and soil moisture) [48,51,52].Landsat TM and OLI
Principal ComponentsCoordinate transformation based on a correlation matrix (variance–covariance) of multiband images [48].Landsat TM and OLI
Multitemporal Kauth–ThomasLinear technique that orthogonalizes spectral vectors taken from a bitemporal image [53].Landsat TM
Elevation, Aspect and SlopeTopographic conditions derived from the digital elevation model [54].United States Geological Survey
Table 3. Landsat Thematic Mapper and Operational Land Imager (TM and OLI) classification scheme (1988 and 2016) based on and modified from [33].
ClassDescription
AgricultureIrrigated crops (forage, wheat, peanuts, garlic, corn, sugar cane) and perennial crops (pecan, citrus, grapes).
Oak forestForest composed of several species of the genus Quercus. Dense understory of herbaceous species such as graminoids.
Scrub (includes desert scrub and subtropical scrub)Communities dominated by thorny small-leaf shrubs. Representative tree species include Olneya tesota, Prosopis velutina and Parkinsonia microphylla and shrubs such as Larrea tridentata and Encelia farinosa, as well as other species from the genera Cercidium, Condalia, Lycium, Cylindropuntia, Fouquieria and Ferocactus.
Communities composed by thorny or non-thorny trees and shrubs. Common species include Bursera laxiflora, Cassia biflora, Jatropha cordata, Guaiacum coulteri, Stenocereus thurberi, Mimosa laxiflora, Ipomoea arborescens, as well as some elements of tropical deciduous forest such as Ceiba acuminata.
Mesquite woodland (includes riparian mesquite)Communities dominated by species of the genus Prosopis, established in plain deep soils and along the edges of rivers and streams coexisting with some species of Acacia and desert hackberry (Celtis pallida), species of the genus Parkinsonia are common.
Introduced grasslandAreas with a dominant cover of introduced grasses such as buffelgrass (Cenchrus ciliaris) or Johnson grass (Sorghum halepense), commonly located on plains where the original scrub communities have been modified. Native tree species, such as Olneya tesota and Parkinsonia microphylla, are also common in these grasslands.
Natural grasslandGraminoid-dominated communities growing with other herbaceous and legume species. Species from the genera Aristidia, Bouteloua, Eragrostis and Muhlenbergia are common.
Riparian vegetationCommunities located along the edges of rivers and streams, under moist conditions. Tree species include Populus fremontii and Salix gooddingii, and the presence of Prosopis and Acacia species is common. Other tree species, such as Fraxinus velutina and Juglans major, can be present occasionally. Shrubs such as mule fat (Baccharis salicifolia) and garambullo (Celtis pallida) often dominate the riparian landscape.
Bare groundAreas with no apparent vegetation cover.
Table 4. PlanetScope-PS2 classification scheme (2018) based on and modified from [33].
ClassDescription
Perennial agriculturePerennial crops such as pecan, citrus and grapes.
Annual agricultureIrrigated crops such as forage, wheat, peanuts, garlic, corn, sugar cane.
CottonwoodsCommunities located along the edges of rivers and streams, under moist conditions. Composition is dominated by obligate riparian species such as Populus fremontii and Salix gooddingii, while Prosopis and Acacia species are common but not dominant.
Human settlementsRural towns.
Desert scrubCommunities dominated by thorny small-leaf shrubs. Representative tree species include Olneya tesota, Prosopis velutina, Parkinsonia microphylla and shrubs such as Larrea tridentata and Encelia farinosa, as well as other species from the genera Cercidium, Condalia, Lycium, Cylindropuntia, Fouquieria and Ferocactus.
Subtropical scrubCommunities composed by thorny or non-thorny trees and shrubs. Common species include Bursera laxiflora, Cassia biflora, Jatropha cordata, Guaiacum coulteri, Stenocereus thurberi, Mimosa laxiflora, Ipomoea arborescens, as well as some elements of tropical deciduous forest such as Ceiba acuminata.
Mesquite woodlands (includes riparian mesquite)Communities dominated by species of the genus Prosopis, established in plain deep soils and along the edges of rivers and streams coexisting with some species of Acacia and desert hackberry (Celtis pallida), species of the genus Parkinsonia are common.
Introduced grasslandAreas with a dominant cover of introduced grasses such as buffelgrass (Cenchrus ciliaris) or Johnson grass (Sorghum halepense), commonly located on plains where the original scrub communities have been modified. Native tree species such as Olneya tesota and Parkinsonia microphylla are also common in these grasslands.
Bare groundAreas with no apparent vegetation cover.
Table 5. Equations for landscape metrics derived for each classification raster, where ni is the number of patches of a particular class, AREA[patchij] is the area of each patch in hectares, gii is the number of like adjacencies between pixels of class i and max-gii is the maximum number of like adjacencies between pixels of class i.
Landscape MetricEquation
Number of Patches     n i    
Mean Patch Area     A R E A M N = m e a n ( A R E A [ p a t c h i j ] )    
Class Aggregation Index     A I = [ g i i max g i i ] ( 100 )    
Table 6. Vegetation cover classification values for the two Landsat-based maps created for 1988 and 2016 and the PlanetScope map for 2018.
Class198820162018
Producer’s AccuracyUser’s AccuracyProducer’s AccuracyUser’s AccuracyClassProducer’s AccuracyUser’s Accuracy
Agriculture97%96%97%94%Perennial Agriculture91%91%
Oak Forest80%83%89%94%Annual Agriculture92%94%
Scrub81%82%80%84%Cottonwoods84%82%
Mesquite Woodland82%83%83%72%Human Settlements94%91%
Introduced Grassland60%100%95%93%Desert Scrub90%88%
Natural Grassland95%92%65%70%Subtropical Scrub98%94%
Riparian Vegetation94%98%84%94%Mesquite Woodland84%94%
Bare Ground92%88%92%96%Introduced Grassland65%70%
Bare Ground95%95%
Overall Accuracy89%88% 91%
Table 7. Total LULC extents and changes between 1988 and 2016.
ClassTotal CoverChange in %
19882016
Agriculture7341956230
Oak Forest13891378−1
Scrub129,114111,518−14
Mesquite Woodland70,14379,78114
Introduced Grassland3683590860
Natural Grassland26112507−4
Riparian Vegetation5807812540
Bare Ground5125643326
Table 8. Total LULC extents for 2018, based on PlanetScope data.
ClassTotal Cover (ha) 2018Total Cover (%) 2018
Perennial Agriculture43592
Annual Agriculture35631.6
Cottonwoods7520.3
Human Settlements1980.09
Desert Scrub56,61126.4
Subtropical Scrub98,09945.8
Mesquite Woodland15,8367.4
Introduced Grassland15,4747.2
Bare Ground19,0468.9
Table 9. Transition matrix for all cover change trends between 1988 and 2016, along with total change for each class. Units are hectares (ha). A = Agriculture, OF = Oak Forest, S = Scrub, MW = Mesquite Woodland, RV = Riparian Vegetation, BG = Bare Ground, TC = Total Cover.
1988–2016AOFSMWIGNGRVBGChange
A42522472722102116221682222
OF024291920610831−11
S110961186,53532,5462957171311892455−17,596
MW2079019,94443,0901183022466009639
IG87055565014630558722226
NG146812291157775214−104
RV12205227318232622312992318
BG81421592630161869612231308
Table 10. Landscape metrics for 1988 and 2016.
Number of PatchesMean Patch Area (ha)Class Aggregation Index (%)
198820161988201619882016
Agriculture223621963.284.3583.786.5
Oak Forest109313991.270.9872.369.4
Scrub13,12916,7249.836.6791.289.9
Mesquite Woodland972111,5207.226.9384.986.1
Introduced Grassland299677011.230.7674.866.7
Natural Grassland204811131.272.2574.280
Riparian Vegetation533731001.092.6267.578.3
Bare Ground291855311.761.1675.970.4

