Abstract
3D reconstruction of culture artifacts has great potential in digital heritage documentation and protection. Choosing the proper images for texture mapping from multi-view images is a major challenge for high precision and high quality 3D reconstruction of culture artifacts. In this study, a texture selection approach, considering both the geometry and radiation quality for 3D reconstruction of cultural artifacts while using multi-view dense matching is proposed. First, a Markov random field (MRF) method is presented to select images from the best angle of view among texture image sets. Then, an image radiation quality evaluation model is proposed in the virtue of a multiscale Tenengrad definition and brightness detection to eliminate fuzzy and overexposed textures. Finally, the selected textures are mapped to the 3D model under the mapping parameters of the multi-view dense matching and a semi-automatic texture mapping is executed on the 3DMax MudBox platform. Experimental results with two typical cultural artifacts data sets (bronze wares and porcelain) show that the proposed method can reduce abnormal exposure or fuzzy images to yield high quality 3D model of cultural artifacts.
1. Introduction
Cultural artifacts are a kind of non-renewable resource of historical, artistic and scientific value. These materials face inevitable preservation risks due to natural and human factors [1,2]. The digitalization of these cultural artifacts reduces the threat of damage and aids restoration, protection and preservation of these artifacts [3,4,5,6,7,8]. In some cases, cultural artifact digitalization can protect cultural artifacts from being self-damaged and conduce to repairing. Meanwhile, 3D reconstruction technologies have demonstrated huge application potential and advantages in the medical, aviation, industrial and military fields and thus are widely used with a wealth of breakthroughs after years of exploration, receiving widespread attention [9]. Three-dimensional digitizing for cultural artifacts and archaeological site protection has also become a research and application hotspot [10,11,12,13].
To date, the main approaches for digital 3D reconstruction of cultural artifacts include multi-view dense matching and 3D laser scanning technologies [14,15,16,17]. Three-dimensional laser scanning technology has the advantages of noncontact, high precision and high resolution. It uses a high precision 3D laser scanner to collect geometry information of cultural artifacts and construct the 3D geometric model through preprocessing and network construction. Meanwhile, texture images are shot by a high-resolution digital camera and mapped to a 3D blank model which is a model with basic white material through texture mapping. Such a 3D model with high fidelity is generated and the precise 3D digitization of cultural artifacts is realized. Another approach for digital 3D reconstruction of cultural artifacts is multi-view dense matching. Before introducing multi-view image dense matching, it is necessary to mention the binocular photogrammetry. It simulates human binocular observation, viewing the same scene from two different angles. Each camera gets an image. By comparing the matching relationship between images from two angles, the depth information is obtained and the 3D information such as the geometric shape and position of the scene is recovered [18]. However, compared with binocular photogrammetry, the multi-view dense matching method is more comprehensive in reconstructing the 3D information of the scene or object, which can better meet the application requirements. Moreover, images dense matching can get accurate depth information of pixels to accomplish 3D reconstruction. Three-dimensional reconstruction using multi-view dense matching can restore accurate geometric structure and lifelike texture mapping by use of relatively simple devices, at low cost and at high automation [19]. Three-dimensional reconstruction based on multi-view dense matching has been successfully applied to the reconstruction of all kinds and sizes objects, regardless of their kinds and sizes.
In recent years, new progress towards optimality, robustness and efficiency has been made in the area of 3D reconstruction using dense matching of multi-view images in quality improvement [20]. Multi-view images dense matching only needs images collected with a high definition camera. Precise cultural artifact 3D modeling can be realized automatically through multi-view 3D reconstruction software, such as Agisoft PhotoScan processing. Therefore, the technology for realizing the automation of cultural artifacts modeling undoubtedly has a great potential. Cultural artifact 3D reconstruction using multi-view images dense matching has advantages of low hardware cost, high automation and simple operation; but the quality of the image input is relatively low [21,22,23]. Because of the influence of camera errors and environmental factors such as environment illumination, the collected texture images always have variation in illumination and exposure values as well as problems of defocus and blur between them, restricting this approach for 3D digital reconstruction in the protection of cultural artifacts.
In the process of 3D laser scanning, texture mapping is mainly realized by manual interaction through MudBox and other mapping software, which involves much manual intervention [24]. The tedious process and heavy workload have a lot to do with the experience and skills of operators, which undoubtedly reduces the efficiency of cultural artifact modeling and increases the cost. Automatic texture mapping is matched with texture images established by 3D laser scanning and white model. It has the same texture selection problem as dense multi-view images matching in 3D reconstruction [25,26].
3D reconstruction of cultural artifacts requires both the geometry precision and the texture realism of models. Compared with general scenes, it is more challenging to automate realize the fine process of 3D reconstruction. Especially for the complex structure of fine cultural artifacts, both multi-view images dense matching and 3D laser scanning, the effect of the texture reconstruction is often difficult to meet the demand of meticulous cultural artifacts. Current 3D reconstruction approaches affect the quality of texture reconstruction mainly on two aspects. On one hand, the precision of the reconstructed geometry model is not high, and the camera calibration error can affect the effect of texture mapping. On the other hand, the same model surface patch often corresponds to multiple optional texture images. Making a reasonable choice in texture mapping process is affected by the radiation quality of the image itself and the orientation of the shooting angle. Therefore, how to evaluate and select texture images from numerous texture images directly determines the quality of texture reconstruction and affects the 3D fine reconstruction effect of cultural artifacts [23,27,28].
Markov random field (MRF) theory provides a convenient and consistent way of modeling context-dependent entities such as image pixels, colors and related features. Classical multi-view dense matching methods for 3D modeling use MRF for the texture optimization [29,30]. Although Markov random field (MRF) texture selection model can minimize color discontinuities at the global scale maximally, the following problems exist in the selection of texture images of cultural artifacts: (i) generally speaking, images with the better angle of view have better image qualities, but this is not always the case, which is necessary to consider about for the fine modeling of cultural artifacts. Images with better perspectives are not necessarily better in qualities; (ii) the evaluation model considers maintaining the maximum consistency of texture color illumination on the vision. It can only minimize the occurrence of seams globally, but it is still difficult to avoid the occurrence of local seams for the local color inconsistency. Even after the subsequent global optimization and local adjustment, it is difficult to reconstruct highly realistic texture. In fact, the process of artificial texture mapping is essentially similar to the MRF selection model. The main difference is that artificial texture mapping will eliminate images of poor radiation quality which are fuzzy and have abnormal exposure from visual image sets. Compared with the MRF method, which only judges the image quality from the geometric perspective, the artificial texture selection also considers the image radiation quality, including the image definition and brightness, so as to reconstruct the high-fidelity texture. This suggests that when texture is selected for mapping, better mapping effect will be obtained by introducing the evaluation of radiation quality [31,32,33].
In order to obtain high-fidelity digital 3D models of culture artifacts, a texture selection approach considering geometry and radiation quality for cultural artifact 3D reconstruction from multi-view dense matching is proposed. A best perspective calculation based on MRF is presented for texture selection to determine alternative texture image sets at first. Then, the radiation quality assessment model based on multiscale Tenengrad definition and brightness detection to eliminate fuzzy and overexposed textures from the multi-view images are used to realize automatic mapping of multi-view images texture selection and fine 3D reconstruction.
2. Methods
Choosing images for mapping textures from multi-view images is a major challenge for high precision and high quality automatic 3D reconstruction of culture artifacts. Cultural artifact images are influenced by the shooting location, the shooting angle, light in the environment, camera photosensitivity and reflective anisotropy of objects [34]. Multi-view images exhibit differences in highlights, color and illumination and may be out-of-focus or blurred. Therefore, multi-view texture images are selected based on the combination of geometric visual angle and radiation quality to realize high-quality 3D reconstruction and texture mapping. The technical framework of the proposed approach is shown in Figure 1.
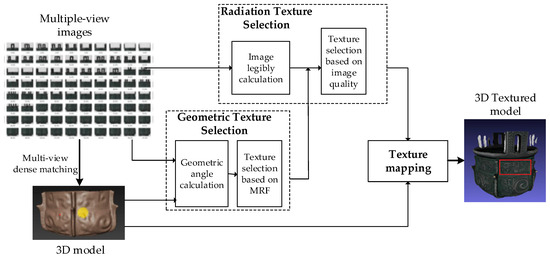
Figure 1.
Technical flowchart of the proposed approach.
As Figure 1 shows, the texture selection approach proposed in this paper includes three steps. A texture selection approach based on MRF model is adopted to select the texture image sets that meet the geometric visual angle conditions for multi-view images, which are introduced in Section 2.1. The multiscale Tenengrad gradient change quality evaluation model and the cast/da brightness detection method based on local grayscale mean are used to screen the radiation quality of texture image from the aspects of texture image definition and exposure quality. This will be introduced in Section 2.2. Semi-automatic texture mapping is performed for images that meet geometric and radiative requirements, which will be introduced in Section 2.3.
2.1. Texture Selection Using a Markov Model Based on Geometric Perspective
The mainstream method of texture quality evaluation and selection for multi-view images reconstruction is the MRF texture selection model, which evaluates the quality of a selected texture from geometric visual angle. This model measures the adjacency relationships between triangular surface patches and calculates the optimal texture solution using a graph cutting method [35,36] to minimize variation by reducing the overall number of seams between different textures. Texture selection is defined as labeling the triangular surface. Labels for each triangular surface are selected from the visual texture images available, which is equivalent to a label list for each surface. If different labels are selected for adjacent triangular surfaces, it creates a break or seam in the surface texture. Therefore, the optimum solution is equivalent to finding a set of labels that ensures that the selected texture meets a threshold standard with the fewest number of seams appearing in the surface at the same time. The energy function for the random field model is shown in the Formula (1)
where the first term in the MRF energy function is the perspective constraint on the model, the second term is smoothing constraint of the model, which minimizes the number of seams. K represents the total number of model surface patches, represents the label value of the slice i and represents the weight for the texture quality of the i–th surface.
The higher the texture quality, the lower the weight. is the weight that measures the color difference at junctures. The smaller the color difference, the smaller the weight. The texture mapping process based on the MRF model is shown in Figure 2.
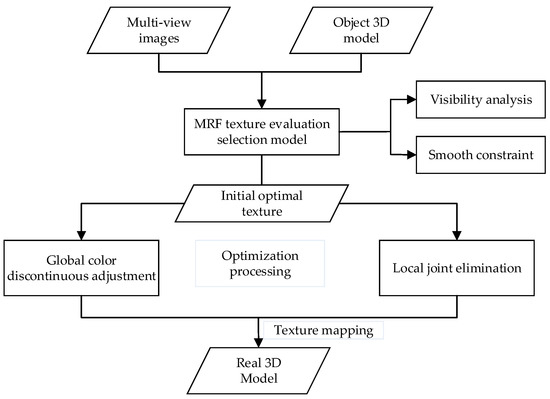
Figure 2.
Texture-mapping based on Markov random field (MRF) model.
Combined optimization is needed for texture selection based on MRF (Figure 2) as the goal is to select quality textures with the fewest seams. Therefore, the initial optimal texture selected by the MRF model needs to be further processed globally and locally to smooth the transition between adjacent texture blocks. Artificial interaction is an approach that human subjectively evaluate and select texture on the computer. Unlike MRF model texture evaluation and selection, a texture reconstructed by artificial interaction, which refers to an approach that human subjectively evaluate and select texture on the computer, has a high sense of reality, few needs to adjust seams and no need for subsequent optimization is needed. However, the initial optimal texture selected by MRF model needs to be further processed globally and locally. The qualities of the initial texture obtained by the two texture evaluation and selection methods are quite different. The reason for this difference is that MRF model only constrains the quality of the selected texture from the geometric perspective, without considering the texture quality [30]. This indicates the texture selection with good definition and proper exposure value can fundamentally reduce the generation of seams. Hence, the image radiation quality should be fully considered during texture selection.
2.2. Texture Selection Given the Radiant Quality
High fidelity 3D digital reconstruction of cultural artifacts usually adopts high definition digital camera to shoot multiple high resolution images, which also has strict requirements for shooting technology and shooting scheme. Even so, sometimes an image will still be out of focus and influenced by color and illumination. There will inevitably be quality problems of definition and abnormal exposure. These images with abnormal quality often have an appropriate geometric visual angle, which makes it difficult for texture selection methods based on geometric visual angle to eliminate such images when selecting textures. Therefore, this paper evaluates the radiation quality from the aspects of definition and exposure to guide the selection of the appropriate texture from the image sets.
2.2.1. Multiscale Tenengrad Definition Evaluation Model
The classical methods of image quality evaluation include mean variance, average gradient, peak signal-to-noise ratio, information entropy [37,38,39], etc. Literature [40] points out that although these methods are robust, some evaluation results are inconsistent with the visual judgment of human eyes due to inadequate consideration of observers’ visual psychological factors. Human eye observation is sensitive to abrupt changes in texture. The change of image quality parameters directly affects the subjective evaluation of image quality by human eyes. In this paper, based on the evaluation model of Tenengrad gradient change definition, multiscale image expression is introduced to simulate human vision [41]. The original principle of the Tenengrad function is to extract the gradient values in horizontal and vertical directions by Sobel operator. Sobel operator is a discrete differentiation operator. It combines Gaussian smoothing and differential derivation to calculate the approximate gradient of image gray function. The larger the average gray value of the image processed by Sobel operator, the clearer the image will be. The image definition conforms to human vision characteristics is realized by calculating the change rate of Tenengrad definition under multiple scales [42]. The specific process is shown in Figure 3.
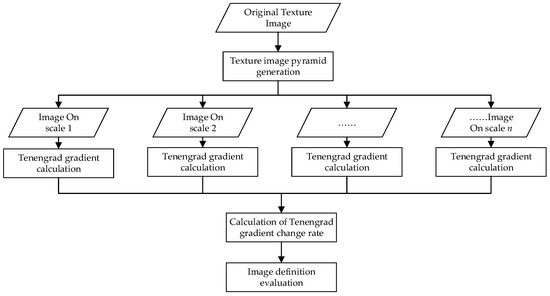
Figure 3.
Definition evaluation model based on Tenengrad gradient change.
In this paper, the Tenengrad gradient is taken as the assessment parameter of the image definition quality, using the Gaussian pyramid to build the multiresolution expression under the same image (Figure 3). By calculating the Tenengrad gradient at all levels of resolution of images and making the least square fitting, the Tenengrad gradient variation of the image can be obtained and then the definition of cultural artifact texture image is evaluated. Specific steps are as follows:
Step1: Texture image pyramid generation
In this paper, Gaussian pyramid downsampling was used to construct multiscale texture image pyramid. Gaussian pyramid are created using a downsampling calculation of each layer, marking each layer from the lowest to highest sizes. The layer i+1 is marked as , which size is smaller than the layer .First make Gaussian convolution computation with and Gaussian kernel.
Gaussian convolution computation is given as Formula (2)
where is the image pixel value in the center of the window and is each pixel value covered by the window. Gaussian Kernel is shown in the Formula (3):
Then delete rows and columns of all even numbers in the convolution results and get the upper layer of the image . Obviously, the upper images are only a quarter of the size of the lower images of Gaussian pyramid. The original image constantly repeat computation according to the above method, which can obtain all the image pyramids. When the image is sampled down to a smaller size, there will be loss of information. When the image sampled down is stretched to the size of the original image, the image will blur. The lower the sampling level is, that is, the higher the layers of the pyramid are and the greater the degree of blur will be (Algorithm 1).
| Algorithm 1: Gaussian pyramid |
| Input: initial Image;Gaussian kernal |
| Output: pyramid image constructed |
| (i):,; (ii):Read the initial image and get the pixel data (iii):,calculate , If or or or ,; Else:; (iv):If ,,go to (3); Stop at ; (v):If ,,delete , is calculated as When and , |
Step 2: Tenengrad gradient definition calculation
Calculate the Tenengrad gradient of each image pyramid at each level of texture image, as shown in Formula (4):
where is:
In Formula (5), T is the given threshold for edge detection. and are, respectively the convolution of pixel coordinates (x, y) and the horizontal and vertical direction Sobel operator. According to the above formula, calculate the Tenengrad gradient of each image pyramid at all levels of the image separately, i = 0,1,2,3.... i = 0 represents the original image and i = j represents the downsampled image of level j. It should be noted that due to the different sizes of images with different resolutions, the pyramid sequence image should first be stretched to the size of the original level 0 image.
Step 3: Calculation based on the gradient change rate of Tenengrad
Descending sampling level i of the texture pyramid image and the corresponding Tenengrad gradient value constitute a series of pairs of observations , i=0,1,2,3.... Linear regression is carried out for a series of observation pairs of each image by using the least squares fitting and the absolute slope of the fitted linear model was taken as the Tenengrad gradient change rate of the image, as shown in Formula (6):
where N is the number of observation pairs and is the gradient change rate of texture images. The higher the value is, the higher definition the image has.
2.2.2. Exposure Quality Evaluation Based on cast/da Brightness Detection of Local Grayscale Mean
Abnormal exposure of a texture image is another important quality parameter. When taking a texture image, the anisotropy of light reflection from different positions of the subject leads to uneven brightness in the image. Especially for cultural artifacts for complex metal material, this kind of uneven brightness difference is more obvious [43]. When texture mapping, the texture used for mapping is only part of the image. Therefore, it is necessary to extract the local sub-image of texture image to be evaluated, that is, to project the local image of the region to be mapped on the visual image on the geometric model. Moreover, take the local sub-image as the object of brightness anomaly detection. In this paper, brightness detection based on cast/da of grayscale mean is used to evaluate the exposure quality. The technical process is shown in Figure 4.
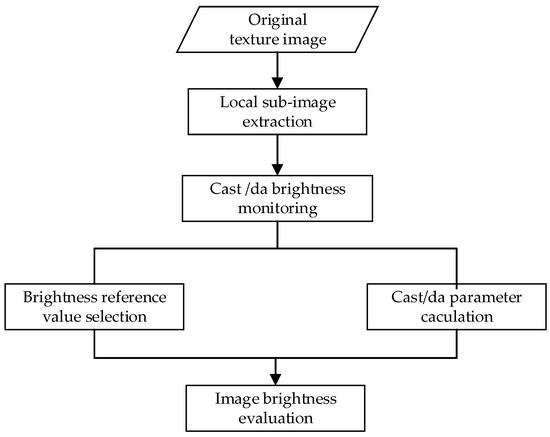
Figure 4.
Brightness detection model based on cast /da of local sub-image.
Exposure is related to the distribution of image brightness within a certain range around (Figure 4). In this paper, the exposure quality evaluation is performed by using local sub-image units to calculate cast and da parameters, detecting brightness abnormality such as underexposure and overexposure of texture images. Specific steps are as follows:
Step 1: Brightness reference value selection based on local gray mean value
The local sub-image is divided, and the gray mean of the sub-image is used as the reference brightness value. The refValue is the reference value of brightness. Its definition is as follows: Where N is the number of image pixels. M is the number of images
Step 2: Cast/da parameter calculation and brightness evaluation
When brightness is abnormal, it will deviate from the reference image brightness. Formula (8) calculates the average of deviation from reference .
where N is the product of the width and height of the grayscale image, namely the total number of image pixels. is the grayscale value of each pixel in the grayscale image.
The definition of deviation from the reference value is as follows
where is the grayscale histogram of the texture image.
Step 3: Brightness evaluation
When measuring the image brightness, the parameter is used to indicate whether there are brightness anomalies such as overexposure or underexposure.
where reflects the degree of deviation rate/deviation between the abnormal image exposure and the brightness reference value. da reflects the deviation between gray mean value of the image and the brightness reference value. The absolute value of da reflects the degree of imaging anomaly. The plus or minus of the da correspond overexposure and underexposure means there is an abnormal brightness in the image. The higher the degree of exposure, the greater the cast value and the absolute value of da.
2.3. Semi-Automatic Texture Selection Mapping
Multi-view dense matching uses EPnP algorithm [44,45,46] to establish the mapping relationship between multi-view images pose which describes images position on models and model surface patches. Generally, texture mapping is carried out automatically after multi-view images matching based on the optimal geometric visual angle [30]. In this paper, before the automatic texture mapping, the quality evaluation of texture radiation is introduced to rank the radiation quality of the visual texture images of the model surface patches mapping automatically based on the optimal texture sorted from geometric visual angle and radiation quality. Considering the requirement of cultural artifact reconstruction fidelity, the 3DMax MudBox platform was used to expand and develop the texture selection plugin gap, sorting and listing the visual texture image quality. Users can further adjust according to the fidelity requirement of cultural artifact texture, updating the cultural artifact model locally. The specific steps are as follows:
Step 1: traverse the model surface and select the visual texture image set that conforms to the optimal geometric visual angle according to the MRF model based on the mapping relationship between the triangular surface of the model and the texture image set;
Step 2: calculate radiation quality parameters of the visual texture image set according to the approach in this paper, and sort the radiation quality of the visual texture image set;
Step 3: automatically select the texture image with the best radiation quality and automatically register the image with the model surface according to its pose to conduct automatic texture mapping. Repeat Step 1–3 and complete all texture images of the model surface;
Step 4: the model mapping texture is interactively checked under the 3DMax MudBox texture selection plug-in. If necessary, import the visual texture image list sorted by radiation quality. After users makes interactive selection, the local model texture is updated (Figure 5).
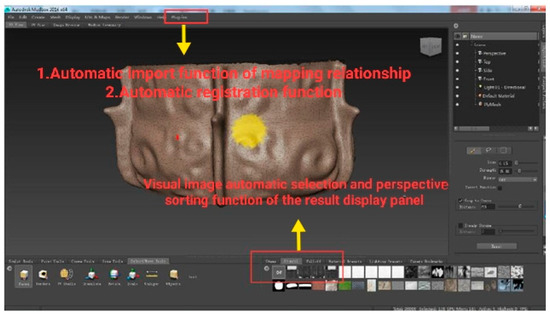
Figure 5.
Interface of semi-automatic texture mapping under MudBox.
3. Experimental Results
3.1. Experimental Dataset
A Canon EOS 5DS camera was used to obtain the multi-view images. The lens used was EF 100 mm f/2.8 L IS macro USM. The shooting distance was about 0.7 m with ISO 100–160. The experimental data were 108 images taken around the upper, middle and lower part in three circles of the cultural bronze tripod. The size of each image was 5760 × 3840 pixels and GSD was about 0.03 mm. The image overlap was greater than 66%. When the camera was hand-held to capture images, weak shaking and imaging distance deviation may have caused image blur. Furthermore, the change of external light source may cause other image quality problems. A multi-view images processing approach was used to restore the shooting scene and reconstruct the 3D model (Figure 6).
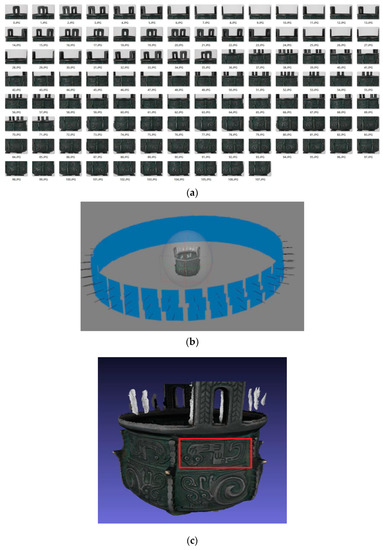
Figure 6.
Multi-view image set and reconstructed 3D model. (a) Multi-view image set; (b) shooting angle of images; (c) reconstructed 3D model
The red box in Figure 6c was taken as the experimental target area and three groups of images were taken according to the spatial distribution. The first group—numbered 14–24—was shot around the upper part of the bronze tripod, with a worse geometric visual angle than the area to be mapped. The second group—numbered 49–59—was shot around the middle of bronze tripod, with a better geometric visual angle than the area to be mapped. The third group—numbered 85–95—was shot around the lower part of the bronze tripod, with a general geometric perspective relative to the area to be mapped. In order to simulate the possible radiation quality problems in the acquisition of cultural artifact images, part of the images from three groups were artificially blurred, light supplemented and subtracted (Table 1 and Figure 7).

Table 1.
Image dataset.
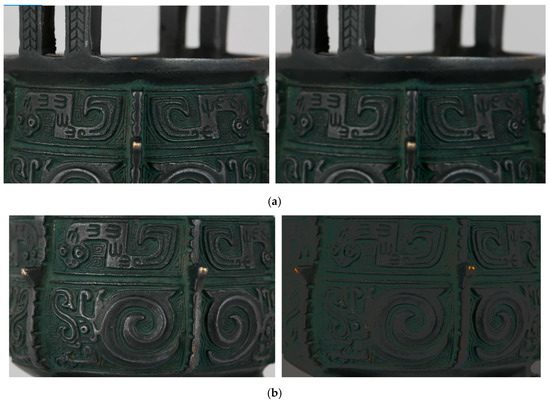
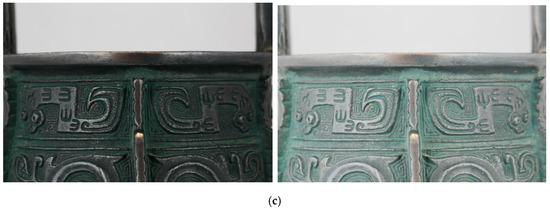
Figure 7.
Image samples. (a) Highly fuzzy; (b) general light supplement; (c) general light subtraction.
3.2. Experimental Results of the Texture Selection
3.2.1. Texture Selection Considering Image Definition Quality
According to the approach in this paper, the definition index of each image based on the Tenengrad gradient change rate was calculated, respectively for the three experimental datasets. Meanwhile, the ranking results were given according to the expert subjective visual evaluation (Table 2). Higher Evaluation Ranking number refers to higher definition quality.
Table 2.
The image definition results with Tenengrad gradient changes.
As Table 2 shows, we can find: (i) the higher the gradient changing rate of Tenengrad, the higher the image definition. The evaluation result of this evaluation factor on the image definition is very consistent with the visual result of human eyes; (ii) the higher the blur degree, the more significant the difference in the gradient rate of Tenengrad between it and adjacent multi-view images; (iii) the Tenengrad change rate between clear image and fuzzy image is obviously different. Even slightly fuzzy images can be well separated from the adjacent multi-view clear image.
Figure 8 shows a 3D model of Dataset 2 before and after texture selection based on the definition of the gradient change rate of Tenengrad at multiple scales.
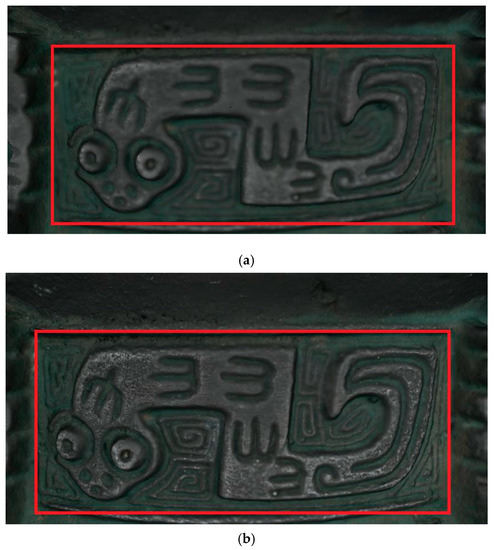
Figure 8.
Three-dimensional model before and after texture selection with definition quality. (a) Texture definition index evaluation before selection; (b) texture definition index evaluation after selection.
As Figure 8 shows, the multiscale Tenengrad gradient change rate can be used as the evaluation factor for the definition of texture images, which can well distinguish the fuzzy image and the clear image and accord with the subjective judgment of human eyes. The reconstruction of 3D model texture mapping can achieve better results.
3.2.2. Texture Selection Mapping considered the Image Exposure Quality
The three experimental datasets in this study were used to conduct cast and da brightness detection for each image according to the approach mentioned above. The detection results were divided into three groups according to the processing degree and the image number. Among them, ‘–’ indicates that there was no abnormality in detection results, that is, the exposure was reasonable. Those marked with ‘*’ indicated that the image brightness processing degree was inconsistent with detection results.
Images processed with strong, weak and general light processing include two cases of light supplement and light subtraction (Table 3). The corresponding exceptions for overexposure and underexposure, were accurately detected. It can be seen that the exposure evaluation approach based on cast/da light detection is effective and feasible. Figure 9 shows the 3D model of Dataset 2 before and after texture selection considering image exposure quality based on cast/da method of local gray mean.
Table 3.
Cast/da brightness detection results based on local grayscale mean values.
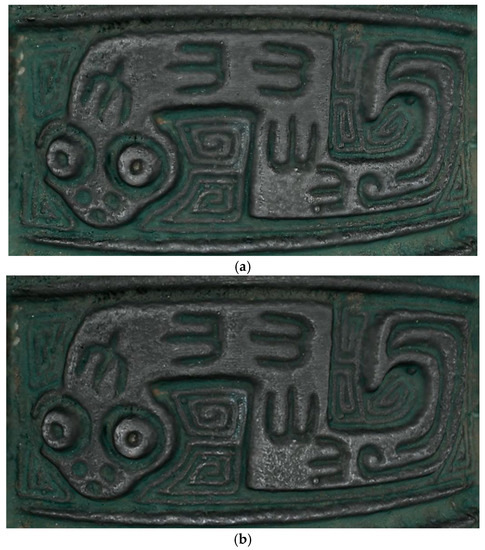
Figure 9.
Three-dimensional model before and after texture selection of exposure quality selection. (a) Texture-exposure index evaluation before selection; (b) texture-exposure index evaluation after selection.
As Figure 9 shows, the reconstructed 3D model with exposed images had obvious inconsistency in texture patch color (Figure 9). After the brightness abnormality was detected by cast/da method and images with abnormal exposure were removed, the texture of the reconstructed 3D model significantly improved.
From the above experimental results—for definition and exposure quality assessment of choosing images texture of 3D model reconstruction—the experiment results show that even in the Dataset 1 of head-up visual angle, textures with radiation quality were selected for texture mapping to the model. The quality and the authentic sense of texture reconstruction were affected even after the subsequent color adjustment and seam elimination. Under the existing multi-view dense matching texture mapping, taking the texture definition and exposure quality into account could obtain better results of reconstructed 3D model texture mapping than merely considering texture definition.
3.2.3. Deconstruction Result with Texture Selection for Porcelain
The image features and image differences of bronze and porcelain artifacts were also different due to their different materials [47,48]. In order to further verify the robustness of the texture selection approach proposed in this study, three groups of porcelain artifacts were further selected for the 3D texture selection reconstruction experiment, as Table 4 shows.
Table 4.
Porcelain artifacts dataset.
As Table 4 shows, 35, 68 and 53 images with radiation quality problems were selected according to the approach in this study. However, due to the large number of multi-view images obtained by the three groups of porcelain cultural artifacts, the 3D model could be well reconstructed even if the degraded images of about 10% were eliminated, as Figure 10 shows.
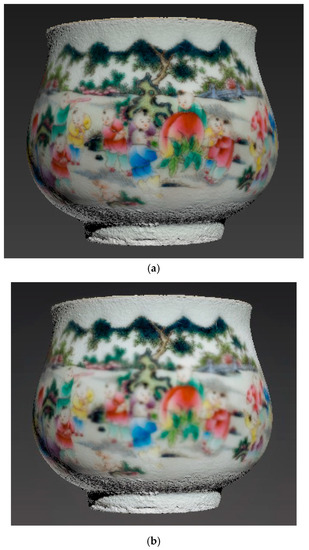
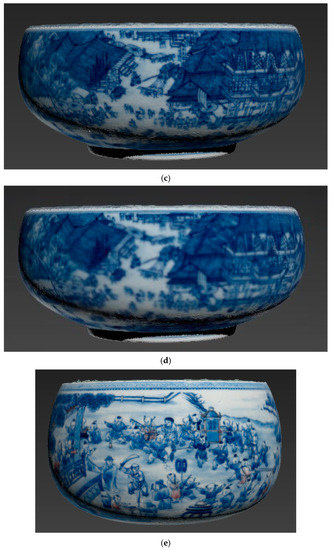
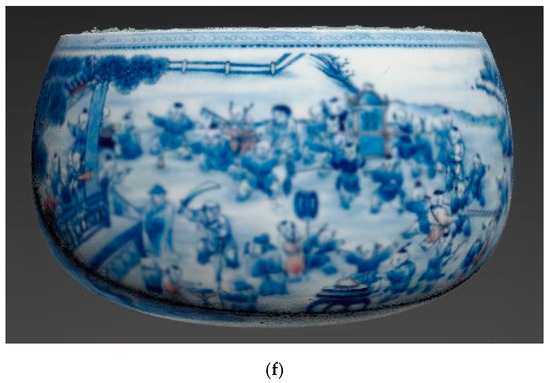
Figure 10.
Models before and after evaluation. (a) Porcelain cup model after radiation quality selection; (b) porcelain cup model with radiation quality problems; (c) porcelain bowl ① model after radiation quality selection; (d) porcelain bowl ① model with radiation quality problems; (e) porcelain bowl ② model after radiation quality selection; (f) porcelain bowl ② model with radiation quality problems.
As Figure 10 shows, all multi-view images were directly used for 3D reconstruction. Images with poor geometric visual angle were processed as degraded quality, thus were not selected for texture mapping. However, some degraded images may have had a better geometric perspective than those with better radiation quality in this visual angle. These images were mapped to the 3D model based on existing culture artifact 3D reconstruction from multi-view dense matching. This caused local texture blurry or exposure quality problems on the 3D model of cultural artifacts.
The selection should be done both from the radiation quality and the geometric visual angle. Some texture images which had appropriate geometric visual angle, but had quality problems, were eliminated. The approach proposed in this paper effectively solves the quality problems of local texture mapping in 3D reconstruction of cultural artifacts. It indicated that the approach could also be well adapted to porcelain artifacts.
3.3. Discussion
All of the cultural artifact 3D modeling approaches have high requirements for geometric accuracy of models and authentic sense of textures. It is always a challenging task to realize 3D reconstruction of cultural artifacts and the automation of high-fidelity texture mapping. Although this paper presents a texture selection mapping approach that takes into account the texture radiation quality from appropriate geometric visual angles, it still needs further research and discussion on how to balance the geometric precision and texture radiation quality to achieve a better 3D fine modeling effect for cultural artifacts.
By evaluating and detecting the definition and exposure values of the cultural artifact texture images, the resistance to the focus blurs, abnormal exposure and other problems in multi-view images can be strengthened, and the texture with better quality can be reconstructed. However, the establishment of the image radiation quality evaluation index system is a complex problem. Considering the possibility of practical application, the radiation quality evaluation index selected in this paper is relatively simple. The definition and exposure anomaly elimination thresholds are determined by subjective visual evaluation. Thus, how to determine and evaluate the threshold automatically needs further study. In order to improve the automation and robustness of radiation quality evaluation, the introduction of machine learning training under the participation of expert visual evaluation will further improve the intelligence of texture selection of radiation quality along with an increasing number of digital 3D reconstruction projects of cultural artifacts [49,50].
In addition, the more refined the cultural artifact 3D reconstruction is, the more images are involved in calculation and even a single cultural artifact needs thousands of images for 3D reconstruction, bringing tens of thousands of geometry model surface patches data.
Therefore, the improvement of the objectivity and calculation efficiency of image radiation quality index calculation requires more GPU parallel computing, so as to speed up the repeated texture selection computing performance.
4. Conclusions
The cultural artifact texture reconstruction with high quality is an important guarantee and basic requirement of the generation of cultural artifact models with high authentic sense, which is also why the automatic texture mapping of the cultural artifact 3D reconstruction is more challenging than the texture mapping of general scenes. The quality of acquired cultural artifact images is influenced by the shooting location, the shooting angle, the environmental light, camera photosensitivity, reflecting anisotropy of cultural artifacts, etc. However, the differences between multi-view images in highlight, color and illumination are inevitable, so the phenomenon of out-of-focus blur often occurs. In addition, strict requirements on the overlap degree of cultural artifact images during the shooting leads to the excessive amount of image data, resulting in the fuzziness, brightness difference and other problems mentioned above, which are almost inevitable in the image sets of cultural artifacts. In view of the existing multi-view image automatic texture mapping technology, which evaluates the texture quality from the geometric perspective without considering the radiation quality of the texture, this paper proposes a texture selection approach to the cultural artifact 3D reconstruction based on multi-view images dense matching that takes into account both geometry and radiation quality. This approach introduces the image radiation quality evaluation model based on the multiscale Tenengrad definition and the cast/da brightness detection of local gray mean and further eliminates the texture with fuzziness and overexposure from multi-view images, so as to realize the high-quality texture mapping in the 3D reconstruction of culture artifacts, which has a broad application prospect.
Author Contributions
Conceptualization, Q.H. and Z.L.; methodology, Q.H., S.W., Z.L. and S.H.; software, M.A. and Z.L.; validation, Q.H., S.W. and M.A.; formal analysis, Z.L.; investigation, Z.L. and S.H.; resources, S.W.; data curation, M.A.; writing—original draft preparation, S.H.; writing—review and editing, Q.H.; visualization, S.H. and Z.L.; supervision, Q.H. and S.W.; project administration, Q.H.; funding acquisition, Q.H. All authors have read and agreed to the published version of the manuscript.
Funding
The authors would like to express their gratitude to the editors and the reviewers for their constructive and helpful comments for substantial improvement of this paper. This research is funded by National Natural Science Foundation of China (No. 41701528).
Conflicts of Interest
The authors declare no conflict of interest.
References
- Ning, W.; Jiazhou, C.; Kaile, W. Research on automatic 3D reconstruction method for cultural relic digital protection. Shanxi Archit. 2008, 44, 257–258. [Google Scholar] [CrossRef]
- Yuhua, W.; Yumin, Z. Study on the Standard of the Application of the 3D Laser Scanning Technique on the Cultural Heritage’s Conservation. Res. Herit. Preserv. 2016, 1, 1–5. [Google Scholar] [CrossRef]
- Zhiping, W. Digital information processing of cultural relics of museum collection. China Folk. 2010, 927, 4–6. [Google Scholar]
- Chen, S.; Wang, S.; Li, C.; Hu, Q.; Yang, H. A Seismic Capacity Evaluation Approach for Architectural Heritage Using Finite Element Analysis of Three-Dimensional Model: A Case Study of the Limestone Hall in the Ming Dynasty. Remote. Sens. 2018, 10, 963. [Google Scholar] [CrossRef]
- Yastikli, N. Documentation of cultural heritage using digital photogrammetry and laser scanning. J. Cult. Heritage 2007, 8, 423–427. [Google Scholar] [CrossRef]
- Abid, A. Preserving Our Digital Heritage: A UNESCO Perspective. J. Korean Soc. Arch. Rec. Manag. 2005, 5, 183–193. [Google Scholar]
- Marinos, I.; Eleanor, F.; Antonia, M.; Monika, H.-S.; Antonella, F.; Gunnar, L.; Vlatka, R.; Pierre, G. Digital Heritage. In Progress in Cultural Heritage: Documentation, Preservation, and Protection; Springer Science and Business Media LLC: Berlin/Heidelberg, Germany, 2016; Volume 10059. [Google Scholar]
- Douglass, M.J.; Kuhnel, D.; Magnani, M.; Hittner, L.; Chodoronek, M.; Porter, S. Community outreach, digital heritage and private collections: A case study from the North American Great Plains. World Archaeol. 2017, 49, 623–638. [Google Scholar] [CrossRef]
- Chao, X.; Qiao, L. Overview of 3d reconstruction technology based on computer vision. Digit. Technol. Appl. 2017, 28, 54–56. [Google Scholar] [CrossRef]
- Remondino, F.; El-Hakim, S. Image-based 3D Modelling: A Review. Photogramm. Rec. 2006, 21, 269–291. [Google Scholar] [CrossRef]
- Wang, R. 3D building modeling using images and LiDAR: A review. Int. J. Image Data Fusion 2013, 4, 273–292. [Google Scholar] [CrossRef]
- Aharchi, M.; Kbir, M.A. A Review on 3D Reconstruction Techniques from 2D Images. Innovations in Smart Cities Applications Edition 3. In Proceedings of the Third International Conference on Smart City Applications, Casablanca, Morocco, 2–4 October 2019; pp. 510–522. [Google Scholar]
- Ham, H.; Wesley, J.; Hendra, H. Computer Vision Based 3D Reconstruction: A Review. Int. J. Electr. Comput. Eng. (IJECE) 2019, 9, 2394–2402. [Google Scholar] [CrossRef]
- Zhaowen, Q.; Tianwen, Z. Key Techniques on Cultural Relic 3D Reconstruction. Acta Electron. Sin. 2008, 36, 2423–2427. [Google Scholar]
- Liu, J.; Zhang, J.; Xu, J. Cultural Relic––3D Reconstruction from Digital Images and Laser Point Clouds. In Proceedings of the 2008 Congress on Image and Signal Processing, Sanya, China, 27–30 May 2008; Volume 2, pp. 349–353. [Google Scholar] [CrossRef]
- Xu, Z.; Wu, L.; Shen, Y.; Li, F.; Wang, Q.; Wang, R. Tridimensional Reconstruction Applied to Cultural Heritage with the Use of Camera-Equipped UAV and Terrestrial Laser Scanner. Remote. Sens. 2014, 6, 10413–10434. [Google Scholar] [CrossRef]
- Bayram, B.; Nemli, G.; Ozkan, T.; Oflaz, O.E.; Kankotan, B.; Cetin, I. Comparison Of Laser Scanning And Photogrammetry And Their Use For Digital Recording of Cultural Monument Case Study: Byzantine Land Walls-Istanbul. ISPRS Ann. Photogramm. Remote. Sens. Spat. Inf. Sci. 2015, 17–24. [Google Scholar] [CrossRef]
- Romero, J.; Kragić, D.; Kyrki, V.; Argyros, A. Dynamic time warping for binocular hand tracking and reconstruction. In Proceedings of the 2008 IEEE International Conference on Robotics and Automation, Pasadena, CA, USA, 19–23 May 2008; pp. 2289–2294. [Google Scholar]
- Lai, K. Multi-View 3d Reconstruction Based on Image Point Features; Science Press: Beijing, China, 2015. [Google Scholar]
- Wang, S.; Wang, Y.; Hu, Q.; Li, J.; Ai, M. Unmanned aerial vehicle and structure-from-motion photogrammetry for three-dimensional documentation and digital rubbing of the Zuo River Valley rock paintings. Archaeol. Prospect. 2019, 26, 265–279. [Google Scholar] [CrossRef]
- Zhang, L. Exploration of the shooting method of three-dimensional reconstruction of movable cultural relics from multiple perspectives. Hua Xia Archaeol. 2018. [Google Scholar] [CrossRef]
- Ducke, B.; Score, D.; Reeves, J. Multiview 3D reconstruction of the archaeological site at Weymouth from image series. Comput. Graph. 2011, 35, 375–382. [Google Scholar] [CrossRef]
- Münster, S.; Kuroczyński, P.; Pfarr-Harfst, M.; Grellert, M.; Lengyel, D. Future Research Challenges for a Computer-Based Interpretative 3D Reconstruction of Cultural Heritage—A German Community’s View. ISPRS Ann. Photogramm. Remote. Sens. Spat. Inf. Sci. 2015, II-5/W3, 207–213. [Google Scholar] [CrossRef][Green Version]
- Chunlai, Z.; Qi, G.; Ziyan, L.; Zhiguo, H. Study on development of Mudbox plug-in. Comp. Eng. Appl. 2016, 52, 89–92. [Google Scholar]
- Macdonald, L.W. Representation of Cultural Objects by Image Sets with Directional Illumination. Intell. Tutoring Syst. 2015, 9016, 43–56. [Google Scholar] [CrossRef]
- Dias, P.; Vítor, S.; João, G.M.G.; Francisco, V. Automatic Registration of Laser Reflectance and Colour Intensity Images for 3D Reconstruction. Rob. Auton. Syst. 2002, 39, 157–168. [Google Scholar] [CrossRef]
- Hu, Q.; Wang, S.; Fu, C.; Ai, M.; Yu, D.; Wang, W. Fine Surveying and 3D Modeling Approach for Wooden Ancient Architecture via Multiple Laser Scanner Integration. Remote. Sens. 2016, 8, 270. [Google Scholar] [CrossRef]
- Zheng, J.; Haiyan, G.; Yi, W.; Mingwei, S. 3D Reconstruction of Small-sized Cultural Relics Based on Laser Scanning and Close-range Photogrammetry. Int. J. Digit. Content Technol. Appl. 2012, 6, 196–205. [Google Scholar] [CrossRef]
- Li, S.Z. Markov Random Field Modeling in Image Analysis; Springer Science and Business Media LLC: Berlin/Heidelberg, Germany, 2001. [Google Scholar]
- Crandall, D.J.; Owens, A.; Snavely, N.; Huttenlocher, D.P. SfM with MRFs: Discrete-Continuous Optimization for Large-Scale Structure from Motion. IEEE Trans. Pattern Anal. Mach. Intell. 2012, 35, 2841–2853. [Google Scholar] [CrossRef] [PubMed]
- Xiao, J.; Furukawa, Y. Reconstructing the World’s Museums. Int. J. Comput. Vis. 2014, 110, 243–258. [Google Scholar] [CrossRef]
- Ye, X.; Wang, L.; Li, N.; Zhang, M. 3D Reconstruction with Multi-view Texture Mapping. In Proceedings of the International Conference on Neural Information Processing, Guangzhou, China, 14–18 November 2017; Volume 10636, pp. 198–207. [Google Scholar]
- Chen, Z.; Zhou, J.; Chen, Y.; Wang, G. 3D Texture Mapping in Multi-view Reconstruction. In Proceedings of the 8th International Symposium, ISVC 2012, Crete, Greece, 16–18 July 2012; Volume 7431, pp. 359–371. [Google Scholar]
- Wu, X.; Fang, Z. Image Splicing Detection Using Illuminant Color Inconsistency. In Proceedings of the 2011 Third International Conference on Multimedia Information Networking and Security, Shanghai, China, 4–6 November 2011; pp. 600–603. [Google Scholar]
- Boykov, Y.; Veksler, O.; Zabih, R. Fast approximate energy minimization via graph cuts. In Proceedings of the Seventh IEEE International Conference on Computer Vision, Crete, Greece, 20–27 September 1999; Volume 1, pp. 377–384. [Google Scholar]
- Kolmogorov, V.; Zabih, R. Multi-camera Scene Reconstruction via Graph Cuts. In Proceedings of the Lecture Notes in Computer Science, Copenhagen, Denmark, 28–31 May 2002; Volume 2352, pp. 82–96. [Google Scholar]
- Rosenfeld, A.; Kak, A.C. Digital Picture Processing; Elsevier: Amsterdam, The Netherlands, 1982. [Google Scholar]
- Kongqiao, W.; Kang. Quality Assessment of Digital Images. Measur. Contr. Technol. 2000, 5, 14–16. [Google Scholar]
- Xinghua, X. Review of digital image quality evaluation methods. Sci. Surv. Mapp. 2004, 1, 68–71. [Google Scholar] [CrossRef]
- Qingwu, H.; Qingquan, L. An image quality assessment approach based on quality parameter variances on multiple resolution representation. Chi. J. Image Graph. 2008, 16, 474–479. [Google Scholar]
- Haibo, M.; Pengcheng, Z.; Quan, Z.; Yu, L.; Zhiguo, G. Research on Microscopic Auto Focus Algorithm Based on HOG Feature. J. Image Graph. 2018, 32, 481–486. [Google Scholar]
- Yu-Hua, C.; Kai, L. Application of sub-surface imaging system for detecting defects of metal material. In Proceedings of the 2009 IEEE International Conference on Automation and Logistics, Shenyang, China, 5–7 August 2009; pp. 925–928. [Google Scholar]
- Sonnerup, B.U.Ö.; Hasegawa, H.; Teh, W.-L.; Hau, L.-N. Grad-Shafranov reconstruction: An overview. J. Geophys. Res. Space Phys. 2006, 111. [Google Scholar] [CrossRef]
- Hong, Y.; Sun, X.; Wang, D.; Liu, S.; Wang, H. Fast Pose Estimation Method for Unmanned Aerial Vehicle Based on Rectangular Geometry Feature. Chin. J. Lasers 2016, 43, 508006. [Google Scholar] [CrossRef]
- Zhang, C.; Han, C.; Yang, H.; Yang, F. Large Field and Binocular Vision Calibration Algorithm Based on Position and Orientation Constraints. Acta Opt. Sin. 2016, 36, 115003. [Google Scholar] [CrossRef]
- Chen, P.; Wang, C. IEPnP: An Iterative Camera Pose Estimation Algorithm Based on EPnP. Acta Opt. Sin. 2018, 38, 0411001. [Google Scholar] [CrossRef]
- Choi, Y.; Lee, Y. Gray Color Image and Preference for Fashion Material. J. Korea Soc. Color Stud. 2017, 31, 93–102. [Google Scholar] [CrossRef]
- Maloney, L.T.; Brainard, D.H. Color and material perception: Achievements and challenges. J. Vis. 2010, 10, 19. [Google Scholar] [CrossRef]
- Nakanishi, R.; Sankaran, S.; Grady, L.; Malpeso, J.; Yousfi, R.; Osawa, K.; Ceponiene, I.; Nazarat, N.; Rahmani, S.; Kissel, K.; et al. Automated estimation of image quality for coronary computed tomographic angiography using machine learning. Eur. Radiol. 2018, 28, 4018–4026. [Google Scholar] [CrossRef] [PubMed]
- Kose, K.; Bozkurt, A.; Fox, C.A.; Brooks, D.H.; Dy, J.G.; Rajadhyaksha, M.; Gill, M. Utilizing Machine Learning for Image Quality Assessment for Reflectance Confocal Microscopy. J. Investig. Dermatol. 2020, 140, 1214–1222. [Google Scholar] [CrossRef] [PubMed]


© 2020 by the authors. Licensee MDPI, Basel, Switzerland. This article is an open access article distributed under the terms and conditions of the Creative Commons Attribution (CC BY) license (http://creativecommons.org/licenses/by/4.0/).