Article

Suitability Evaluation of Typical Drought Index in Soil Moisture Retrieval and Monitoring Based on Optical Images

1
Hubei Provincial Key Laboratory for Geographical Process Analysis and Simulation, Central China Normal University, Wuhan 430062, China
2
Hubei Key Laboratory of Regional Development and Environmental Response, Hubei University, Wuhan 430062, China
*
Author to whom correspondence should be addressed.
Remote Sens. 2020, 12(16), 2587; https://doi.org/10.3390/rs12162587
Submission received: 22 July 2020 / Revised: 9 August 2020 / Accepted: 10 August 2020 / Published: 11 August 2020

Abstract

:
As a basic agricultural parameter in the formation, transformation, and consumption of surface water resources, soil moisture has a very important influence on the vegetation growth, agricultural production, and healthy operation of regional ecosystems. The Aksu river basin is a typical semi-arid agricultural area which seasonally suffers from water shortage. Due to the lack of knowledge on soil moisture change, the water management and decision-making processes have been a difficult issue for local government. Therefore, soil moisture monitoring by remote sensing became a reasonable way to schedule crop irrigation and evaluate the irrigation efficiency. Compared to in situ measurements, the use of remote sensing for the monitoring of soil water content is convenient and can be repetitively applied over a large area. To verify the applicability of the typical drought index to the rapid acquisition of soil moisture in arid and semi-arid regions, this study simulated, compared, and validated the effectiveness of soil moisture inversion. GF-1 WFV images, Landsat 8 OLI images, and the measured soil moisture data were used to determine the Perpendicular Drought Index (PDI), the Modified Perpendicular Drought Index (MPDI), and the Vegetation Adjusted Perpendicular Drought Index (VAPDI). First, the determination coefficients of the correlation analyses on the PDI, MPDI, VAPDI, and measured soil moisture in the 0–10, 10–20, and 20–30 cm depth layers based on the GF-1 WFV and Landsat 8 OLI images were good. Notably, in the 0–10 cm depth layers, the average determination coefficient was 0.68; all models met the accuracy requirements of soil moisture inversion. Both indicated that the drought indices based on the Near Infrared (NIR)-Red spectral space derived from the optical remote sensing images are more sensitive to soil moisture near the surface layer; however, the accuracy of retrieving the soil moisture in deep layers was slightly lower in the study area. Second, in areas of vegetation coverage, MPDI and VAPDI had a higher inversion accuracy than PDI. To a certain extent, they overcame the influence of mixed pixels on the soil moisture spectral information. VAPDI modified by Perpendicular Vegetation Index (PVI) was not susceptible to vegetation saturation and, thus, had a higher inversion accuracy, which makes it performs better than MPDI’s in vegetated areas. Third, the spatial heterogeneity of the soil moisture retrieved by the GF-1 WFV and Landsat 8 OLI image were similar. However, the GF-1 WFV images were more sensitive to changes in the soil moisture, which reflected the actual soil moisture level covered by different vegetation. These results provide a practical reference for the dynamic monitoring of surface soil moisture, obtaining agricultural information and agricultural condition parameters in arid and semi-arid regions.

Graphical Abstract

1. Introduction

Soil moisture, or soil water content, is a key factor that describes the land/atmosphere energy transfer and the water cycle, as it plays a vital role in near-surface water circulation and ecosystem functions [1]. The temporal–spatial distribution and evolution of soil moisture significantly influence the surface heat balance, water evapotranspiration, and soil moisture in agricultural production [2,3,4]. The Aksu river basin is a typical semi-arid region; it is also an important agriculture area in Xinjiang Uygur Autonomous Region, China. The Aksu river basin suffers from water shortages seasonally, especially in crop growth season [5,6]. Due the lack of information on soil moisture, it is hard for the local water managers to understand which area is the most water-deficient and how much water is needed for each region. If we can acquire the soil moisture information of the entire basin, it will be convenient for us to learn which areas are the most water-deficient and give priority to the water supply in these areas. Soil moisture is important in calculating irrigation quotas; accurate and reliable irrigation quotas can help to improve the water use efficiency. Thus, finding a rapid and repeated approach of soil moisture retrieval becomes an urgent issue. Traditional in situ measurement is not applicable in a research area as broad as the Aksu river basin, and so using remote sensing has become our alternative option.
With the development of remote sensing technologies, especially the various types of sensors, as well as the multi-temporal, multi-band, and hyperspectral technologies that have emerged in recent years, wide-ranging, timely, and accurate soil moisture monitoring based on remote sensing is now possible [7]. Since the 1980s, many researchers have proposed soil moisture inversion models and methods based on different sources of remotely sensed data and band information; currently, the remote sensing of soil moisture relies on two main approaches: microwave and optical. The thermal inertia approach [8,9] is also used in retrieving soil moisture, but the reliability of the thermal inertia approach depends on additional measurements from other sources, such as microwave or optical [10]. The microwave approach typically involves measurements of either radiometric brightness temperature (passive) or radar backscattering (active). Passive microwave sensors, such as the Advanced Microwave Scanning Radiometer for the Earth Observing System (AMSR-E), as well as Soil Moisture and Ocean Salinity (SMOS), possess high temporal resolution and large scanning width advantages, but they are limited by their coarse spatial resolution, ranging from 5 km for AMSR-E [11] to 50 km for SMOS [12], much greater than a typical agricultural field, which makes the passive microwave approach the one usually used in large-scale soil moisture retrieving [13,14]. While active microwave sensors, such as the Synthetic Aperture Radar (SAR), can deliver a fine spatial resolution in the 10 to 100 m range [15,16], they often have a low temporal resolution, which makes them inconvenient in regular agricultural applications (except for sentinel-1, as sentinel-1 obtains a good temporal resolution by combining two satellites together to detect the Earth’s surface). The optical approach usually detects the differences in absorption characteristics between soil and water in the visible and near-infrared bands, and uses this difference to monitor soil moisture. Based on this theoretical basis, many soil moisture-retrieving methods were developed, such as the temperature-vegetation index method [17,18] and the spectral feature space method [19].
In 1977, Richardson and Wiegand constructed the NIR-Red spectral space-based method and first introduced the perpendicular vegetation index (PVI) based on soil background lines [20]. In further studies, researchers have focused on the development of soil moisture inversion models based on remote sensing through the extraction of information on soil moisture from the remote sensing spectral feature space. As a result, several indices, including the normalized difference vegetation index (NDVI), the enhanced vegetation index (EVI), the temperature-vegetation dryness index (TVDI), the modified perpendicular drought index (MPDI), and the vegetation-adjusted perpendicular drought index (VAPDI), have been proposed to monitor soil moisture variations during crop growth periods [21,22,23,24,25]. MPDI and VAPDI were developed based on the perpendicular drought index (PDI) to overcome the reduced accuracy of PDI in regions with vegetation cover.
However, the signal received by remote sensors only responds to soil moisture near the surface, and solar radiation can barely penetrate soil. Previous research shows that the penetration depth is roughly four to five times the soil particle mean radius, which makes it only millimeters into the soil [26], while water management and other practical applications normally require information on soil moisture in the root zone, especially for a semi-arid region like the Aksu river basin. However, studies have shown that there are some relations between different depths of soil moisture [10,27]; this allowed us to build an empirical algorithm to estimate the soil moisture at depths of 0–10 cm,10–20 cm, and 20–30 cm. In the meantime, we chose June, July, and August as our research time, as this is the crop growth season in the Aksu river basin, which allows us to explore the soil moisture-retrieving ability of PDI, MODI, and VAPDI in vegetated areas at the Aksu river basin.
Although significant results had been achieved in previous studies, most remotely sensed data were derived from Thematic Mapper(TM), Enhanced Thematic Mapper Plus (ETM+), or Moderate Resolution Imaging Spectroradiometer (MODIS) images [7]. Research based on high spatial-temporal resolution remotely sensed data is lacking, and no studies have compared the inversion results as well as the applicability of different indices and sensors in arid and semi-arid agricultural regions [28,29]. Therefore, in the present study, high spatial-temporal resolution remotely sensed data, for example GF-1 WFV(Wide Field of View) which provide a high spatial-temporal resolution and wide swath width were used to investigate the feasibility and applicability of remotely sensed data sources with different resolutions. By contrast, Landsat 8 OLI (Operational Land Imager) images were used to verify the effectiveness of different indices in soil moisture inversion on a basin scale within the Aksu River Basin in the Xinjiang Uygur Autonomous Region, China [30,31,32]. The quantitative monitoring of spatial and temporal variations in soil moisture in the Aksu River Basin is essential for: 1) the coordination of irrigation quotas at the respective gates in the irrigation area, 2) the enhancement of reasonable allocation and the efficient utilization of water resources in the basin, 3) the expanded application of high-resolution remotely sensed data acquired from domestic satellites in precision agriculture.

2. Materials and Methods

2.1. Study Area

The Aksu River Basin lies in the alluvial plain of the upper Tarim River reaches in the northwestern region of the Tarim Basin, located in the western part of the Xinjiang Uygur Autonomous Region, at the following coordinates: 40–41°35′ N, 78°47′–82°43′ E (Figure 1). The region is characterized by an arid climate and has an average annual precipitation of 45 mm, an evaporation of 1500 mm (20 m2 water surface), and an annual total solar radiation of 6000 MJ/m2 [6]. Agriculture is entirely dependent on surface water canal systems and groundwater drawn from wells for irrigation. The Aksu Oasis is the main irrigated oasis agricultural region, and a key production base for grain and melon crops in Xinjiang; it is also one of China’s major cotton production areas [5]. In recent years, economic development in the Aksu region has led to a continuous decrease in groundwater levels within the basin, which has affected agricultural production and caused the gradual degradation of vital ecosystems, such as desert poplar forests. Therefore, the use of accurate real-time soil moisture monitoring over large areas, based on high-resolution remotely sensed data, has great practical significance for the utilization of water resources and the evaluation of ecological security in the basin.

2.2. Data Acquisition and Processing

Three experimental sites were selected in Awat County, Aral City, and Wensu County, which are located within the Aksu River Basin (Figure 1). Irrigated agriculture is mainly practiced in the first two regions, while forestry and fruit-growing take place in the third region. The depth of 10–30 cm is the main area for the surface root growth of crops in the study area. At the same time, due to the deep groundwater level in the study area, agriculture is mainly dependent on surface water canal systems. Thus, the surface soil moisture can dynamically display crop growth condition. Soil volumetric moisture content (relative) was measured in three depth layers: 0–10, 10–20, and 20–30 cm. Measurements were made using a TZS-2X-G soil moisture/temperature rapid measuring instrument, which determines the volumetric water content by measuring the dielectric constant of the soil using capacitance/frequency domain technology (Zhejiang Top Cloud-Agri Technology Co., Ltd.), with a theoretical relative error of <3%. Measurements were taken from 14 to 20 July 2016, with the weather at the experimental sites being stable in the week before and the week after the measurement period. Based on the different land-cover types, regular plots with a size of at least 30 × 30 m were selected for measurement, and a 2 × 2 m quadrat was selected at the center of each plot. Within each quadrat, three random measurements were made and averaged, and information such as the GPS coordinates of the measurement point, the land-cover type, and the vegetation density was concurrently recorded. In total, 102 measurement points were established (306 measured soil moisture data points), with 45, 30, and 27 measurement points located in Awat County, Aral City, and Wensu County, respectively. The land-cover types of the measurement points included wheat, cotton, rice, orchard, woodland, and bare land, with farmland vegetation being the main land-cover type (Figure 1). Surface soil samples were collected from the selected measurement points using a cutting ring, and the moisture content of the samples was measured in the laboratory using the aluminum tin drying method to validate the accuracy of the rapid onsite measurements of soil moisture.
Two types of high-resolution remotely sensed data were used: (1) GF-1 WFV multi-spectral images with a spatial resolution of 16 m captured on 13 June, 6 July, 22 July, and 12 August 2016; specifically, data from the red band (Red; Band 3) and the near-infrared band (NIR; Band 4) were mainly used. (2) Landsat8 OLI remotely sensed images with a spatial resolution of 30 m captured on 18 July 2016; specifically, data from the Red band (Band 4) and NIR band (Band 5) were mainly used [30,31]. Before analysis, the remotely sensed images were preprocessed, which included cropping, radiometric calibration, atmospheric correction, and precise geometric correction. Subsequently, the measured data and preprocessed images were georeferenced using ArcGIS 10.1.

2.3. Data Analysis Methods

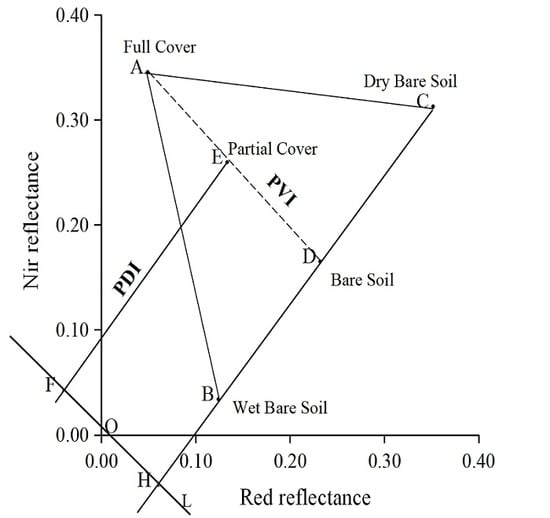
2.3.1. Perpendicular Drought Index (PDI)

The perpendicular drought index (PDI) was developed based on the spatial characteristics of moisture distribution in NIR-Red space; it can provide correct information on surface drought conditions, and is robust over different surface types. Further studies have recommend the use of the PDI for bare soil applications, since it may contain some uncertainties caused by vegetation cover. [33,34,35]. The PDI values were calculated using the following equation:
P D I = ( R r e d + M × R n i r ) / M 2 + 1 ,
where Rred and Rnir represent the soil reflectance values in the Red and NIR bands respectively, which correspond to the reflectance values in Bands 3 and 4 of the GF-1 WFV images and Bands 4 and 5 of the Landsat 8 OLI images used in the present study. M refers to the slope of the vertical axis of the soil line, which can be calculated by linear regression [36].
Using ENVI 5.1, the reflectances in the Red and NIR bands of the non-vegetated pixels were extracted from the preprocessed GF-1 WFV images of the study area, and the reflectance values of the non-vegetated pixels were discretized within the two-dimensional NIR-Red spectral feature space. Through trendline fitting, the equation for the soil line of the study area was obtained (Equation (2)):
y = 1.2381x + 0.0367, R2 = 0.938.
Based on the definition of the soil line, the slope (M) and interception (I) of the soil line were determined as 1.2381 and 0.0367, respectively. As the differences among the soil lines of the same plot were small, the same soil line was adopted during the construction of the soil moisture inversion model based on the Landsat8 OLI images.

2.3.2. Modified Perpendicular Drought Index (MPDI)

As the PDI does not take into account the strong scattering effects of vegetation cover in the Red and NIR bands, it is mainly applicable to remote sensing-based soil moisture inversion in areas with low vegetation cover or bare soil. Therefore, the vegetation fraction fv was introduced for the decomposition of mixed pixels in the NIR-Red spectral feature space to account for the scattering effects of vegetation cover in the Red and NIR bands and to obtain the pure soil pixel reflectance [19,33,37]. This is used to calculate the MPDI according to the following equation:
M P D I = R r e d + M · R n i r f v ( R r e d , v + M · R n i r , v ) ( 1 f v ) M 2 + 1 ,
where Rred,v and Rnir,v represent the vegetation reflectance in the Red and NIR bands, respectively. fv refers to the vegetation fraction.
The vegetation fraction fv is defined as the percentage occupation by vegetation (including leaves, stems, and branches) in a given ground area in vertical projection. The Aksu Oasis is the main irrigated oasis agricultural region; cotton, red dates, and walnuts are the main artificial vegetation types, with a high degree of vegetation cover, especially in the vegetation season. In the present study, fv was used to account for the influence of mixed pixels in the remotely sensed images on the spectral information related to soil moisture to enhance the application of the inversion models and the accuracy of the inversion results. fv was calculated using the following equation:
f v = ( N D V I N D V I S N D V I V N D V I S ) 2 ,
where NDVIv and NDVIs represent the normalized difference vegetation index of pure vegetation and bare soil, respectively. Using the Band Math tool in ENVI 5.1 and the reflectance values in the Red and NIR bands, the NDVI values of GF-1 WFV and Landsat8 OLI images during the various periods were calculated. Due to the complexity of land cover in the study area, errors may exist in the calculated minimum and maximum NDVI values; therefore, the NDVI values with cumulative probabilities of 5% and 95% were set as the minimum and maximum values, respectively [38].

2.3.3. Vegetation-Adjusted Perpendicular Drought Index (VAPDI)

To further enhance the inversion accuracy of soil moisture in areas with vegetation cover, the perpendicular vegetation index (PVI) was introduced to replace fv in the characterization of vegetation cover. Richardson and Wiegand (1977) discovered that the scatter plot of the NIR-Red reflectance space conformed to a typical triangle distribution (also called the feature triangle), and developed the PVI, which was used to estimate the crop water balance in arid regions. The PVI and PDI are derived from the distribution features of surface targets in the NIR-Red spectral space, and both have clear physical connotations. The PVI, which is the vertical distance from a random point to the soil line, describes the vegetation status, while the PDI, which is the perpendicular distance from the point to the normal line of soil line that goes through the coordinate origin, is an indicator of drought status in the NIR-Red spectral space. PVI and PDI represent vegetation coverage and soil wet and dry conditions, respectively. Using PVI and PDI as components to create a two-dimensional feature space and convert pixels to a PVI-PDI two-dimensional feature space, approximate distribution features can be seen in Figure 2.
As shown in Figure 2, where A is the point with the maximum value of PVI and BC is the soil line, all the soil moisture isoclines within the ABC triangle are approximate straight lines that intersect at point A. In the bare soil zone, where PVI = 0, the PDI of any point (E) within the ABC triangle can be approximated by the PDI of the x-intercept (F) of the soil moisture isocline AE. The distance between O and F is the modified PDI of point E. Based on the principle of similar triangles, the following formula exists:
OF = OD − FD = OD − AD × EG/AG.
Within the PVI-PDI two-dimensional feature space, modifications were made to the PDI model, and the vegetation-adjusted perpendicular drought index (VAPDI) was built [19,35]. When PVI is close to zero (bare soil and lower vegetated surfaces), VAPDI is close to PDI. When PVI is close to maximum (densely vegetated surfaces), VAPDI is mainly affected by PVI.
Based on the principle of similar triangles, the VAPDI of any point X can be calculated using the following equation:
V A P D I ( X ) = P D I ( A ) | P D I ( A ) P D I ( X ) | P V I ( A ) P V I ( A ) P V I ( X ) .
PVI is calculated using the following equation:
P V I = | R n i r M · R r e d I | / M 2 + 1 ,
where I is the intercept of the soil line expression, and M is the slope of the soil line expression. Using the Band Math tool in ENVI 5.1, the PVI values of the GF-1 WFV and Landsat8 OLI remotely sensed images were calculated.

3. Results and Analysis

3.1. Construction of Soil Moisture Inversion Models

3.1.1. Descriptive Statistics of Measured Soil Moisture Data

Descriptive statistics were used to analyze the soil moisture measured at 102 surfaces (depth of 0–10 cm) in the study area, and the results are shown in Table 1. The values of the mean surface soil moisture and median surface soil moisture for various land-use types were close, which indicates a relatively uniform overall distribution of soil moisture in the study area. There was a significant difference the median and mean soil moisture values for bare soil, with a coefficient of variation of 43.8%, which indicates differences in the degree of dryness or wetness of bare soil in the study area. The maximum and minimum values of soil moisture, which correspond to the land-cover types of rice and bare soil, were 0.485 and 0.088, respectively. Across the 102 measurement points, the mean and standard deviation of soil moisture were 0.225 and 0.081, respectively.

3.1.2. Construction of Soil Moisture Inversion Models

Based on indicators such as land-use type, vegetation cover, landform, slope angle, and slope orientation, 68 out of 102 measurement points were selected to form the model construction dataset, while the remaining 34 measurement points formed the validation dataset to validate the accuracy and evaluate the inversion models. Using the Band Math tool in ENVI 5.1, the values of the two parameters fv and PVI and the indices PDI, MPDI, and VAPDI were calculated for the GF-1 WFV images (captured on 22 July 2016) and the Landsat8 OLI images (captured on 18 July 2016). Subsequently, using SPSS 19.0, the soil moisture in the three depth layers at the 68 measurement points of the model construction dataset was respectively fitted with the corresponding PDI, MPDI, and VAPDI values; the best fit was achieved with the linear models. The regression results and a summary of the regression models are shown in Figure 3 (take the fitted models of the 0–10 cm depth layer based on GF-1 WFV as an example) and Table 2, respectively.

3.2. Discussion of the Inversion Model Results

3.2.1. Analysis of the Inversion Models

Figure 3 and Table 2 show that the PDI, MPDI, and VAPDI values based on the GF-1 WFV and Landsat8 OLI remotely sensed images were negatively correlated with the measured soil moisture in the different depth layers. Besides the fitted PDI and MPDI models for the 20–30 cm depth layer based on the GF-1 WFV images and the fitted PDI model for the 20–30 cm depth layer based on the Landsat8 OLI images, which achieved P values of <0.05, the other models achieved P values of <0.01, indicating that the results were statistically significant. All the indices presented the strongest correlation with soil moisture in the 0–10 cm depth layer, with a mean R2 value of 0.68. However, the accuracy of the soil moisture inversion models was lower for deeper soil layers because of the weak penetrating ability of the optical images, which can only produce an obvious response to surface soil.
When the coefficients of determination (R2) and standard deviations (S.D.) of the various regression models were compared, a better fit was achieved in the MPDI and VAPDI models than in the PDI model. This was because the various pixel reflectances in the two-dimensional NIR-Red spectral feature space are jointly determined by soil, vegetation, and other ground object information. As PDI does not account for the effects of vegetation cover on the soil spectral information, it cannot fully reflect the actual soil moisture level on the surface, whereas modifications to the spectral information of mixed pixels are made in MPDI and VAPDI through different factors that characterize the vegetation cover. Therefore, the soil moisture information expressed by MPDI and VAPDI is more accurate, and the measured soil moisture data are more strongly correlated with these indices than with PDI.
Although the number of measured data is limited, it is confirmed that these typical drought indices show similar trends in soil moisture retrieval, and VAPDI provides correct and sufficient information in surface soil moisture detection. These results indicate that the inversion models constructed based on optical remotely sensed images in the Red and NIR bands had a higher sensitivity towards soil moisture information and could be used to simulate and monitor spatial variations in soil moisture over larger areas. These results are also consistent with the notion that an effective soil depth for soil moisture estimation with visible and near infrared remote sensing data is approximately 10 cm [33,34,35].

3.2.2. Accuracy of the Inversion Models

The soil moisture inversion values of the different depth layers obtained from the PDI, MPDI, and VAPDI regression models constructed based on the two types of sensors were validated and analyzed with the corresponding soil moisture values of the 34 validation measurement points. The coefficient of determination (R2), mean absolute error (MAE), mean relative error (MRE), and root mean square error (RMSE) between the inversion and measured values of soil moisture were calculated for the validation and quantitative evaluation of the accuracy of the inversion models (Table 3).
R2 represents the degree of correlation between the inversion and measured values, which can reflect the ratio of the measured value of soil moisture that can be explained by the inversion value fitted by models. When the inversion results for the three indices were compared, the R2 between the inversion values of MDPI and VAPID and the measured values is basically greater than 0.7 at the depth layer of 0–10 cm, showing a great interpretation ratio and a great fitting effect. However, the R2 between the inversion values and the measured values at the depth layer of 20–30cm is around 0.5, with a small interpretation ratio and relatively poor fitting effect. Both MAE and MRE actually reflect the degree of deviation between the inversion value and the measured value, and are used to measure the reliability and accuracy of the model. The lower the value of MAE and MRE is, the more reliable and accurate the model is. RMSE reflects the degree of dispersion of the different values between the inversion value and the measured value, showing the stability of the model fitting effect. The lower the value of RMSE is, the more stable the model fitting effect is. The fitting effect at different depth layers shows that the fitting effect decreases as the depth increases according to the values of MAE, MRE, and RMSE. The index values reflected in MAE, MRE, and RMSE are lowest by the VAPDI model fitting, and the values for the 0–10 cm depth layer were 2.23, 5.67, and 3.41, respectively. For the same depth layer, the use of the GF-1 WFV or Landsat8 OLI images as data sources did not yield consistent effects on the different indices. The values of the R2, MAE, MRE, and RMSE of the inversion results from the WFV image-based PDI and VAPDI models were better than those of the OLI image-based models. However, for MPDI, the inversion results of the WFV and OLI image-based models were similar, with no significant difference in the inversion accuracy.
The results indicated that the VAPDI soil moisture inversion models constructed based on the WFV and OLI sensors were significantly more accurate than the PDI and MPDI models regarding the inversion results of the 0–10 cm depth layer. Although the differences in the accuracy of the evaluation indicators of the three indices were small for the depth layers of 10–20 and 20–30 cm, the inversion results of the VAPDI and MPDI models were slightly better than those of the PDI model. This happened because the reflectances of the various pixels in the remotely sensed images were regarded as bare soil reflectance; therefore, the influence of the mixed pixels was neglected. As the model has a lower discriminatory power for soil moisture information, from a remote sensing standpoint greater errors existed in the inversion results obtained from the model. Therefore, the PDI model is more suitable for areas with bare soil or sparse vegetation. In the MPDI and VAPDI soil moisture inversion models, which were modified by fv and PVI, respectively, there were different degrees of mixed pixel decomposition in remotely sensed images, and the combined reflectance of the vegetation and bare soil pixels were used for the model fitting. Therefore, the moisture information of the soil layers could be more accurately inverted, and the inversion results were closer to the measured values. As such, the MPDI and VAPDI are more suitable for areas with a higher vegetation cover. The characterization of the vegetation cover showed that PVI can eliminate the influence of the soil background more effectively and is less susceptible to vegetation saturation compared with fv. Therefore, VAPDI and MPDI are suitable for applications in vegetated regions, and based on our modeling results, VAPDI is more suitable in applications in vegetated regions.
In summary, the various accuracy evaluation indicators included in Table 3 show that the PDI, MPDI, and VAPDI soil moisture inversion models constructed based on the WFV and OLI sensors had the highest inversion accuracy for the soil depth of 0–10 cm, which indicates that optical remotely sensed images are more suitable for the inversion of surface soil moisture and are less sensitive to the soil moisture information at deeper layers. This is caused by the weaker penetration of NIR and Red light, which resulted in the near-surface spectral information being mainly reflected.

3.3. Inversion and Time Dependent Monitoring of Surface Soil Moisture

Based on the aforementioned analysis, the VAPDI soil moisture inversion models based on both types of remotely sensed images were selected for the inversion of soil moisture in the 0–10 cm depth layer in the Aksu River Basin. Subsequently, the actual inversion results were analyzed to determine the recommended source of remotely sensed data for the large-scale dynamic monitoring of soil moisture.

3.3.1. Analysis of Surface Soil Moisture Inversion Results

Based on the preprocessed GF-1 WFV (22 July 2016) and Landsat8 OLI (18 July 2016) images, the VAPDI values of the pixels were calculated, and the soil moisture value of each pixel was determined using the constructed soil moisture inversion models to obtain the distribution of the spatial patterns of surface soil moisture in the study area (Figure 4 and Figure 5). White regions correspond to water bodies and urban areas, red regions correspond to areas with low soil moisture, while dark blue regions correspond to areas with high soil moisture.
Figure 4 and Figure 5 show that the spatial patterns of surface soil moisture in the Aksu River Basin obtained through inversion using the two types of remotely sensed images were consistent—i.e., areas near water resources possessed a high soil moisture, while areas far from water resources possessed a lower soil moisture. This is because the agricultural water in the study area is mainly derived from the melting water of mountain ice and snow, and the total amount of agriculture water resources in the oasis is all allocated by the management department through different levels of gates in the surface water canal systems. Therefore, the places close to the Aksu River have more groundwater supply, and the denser the distribution of canals is, the more water resources are allocated. In addition, areas near natural water resources, such as rivers, reservoirs, and lakes, are usually agricultural production areas, and include areas along both upstream banks of the Tuoshigan River in Wushi County, areas along both banks of the Kumala River in southern Wensu County, the Awati irrigation area along the middle reaches of the Aksu River in central Aksu City, and the Aral irrigation area at the junction of the middle-lower reaches of the Aksu River and the Tarim River. Dense irrigation canal systems ensure the long-term satisfaction of crop-water use requirements; therefore, the surface soil moisture in these areas was relatively high, with all values exceeding 0.3. At the three major reservoirs of the basin, namely the Shengli, Shangyou, and Duolang Reservoirs, as well as Qianniao Lake in the southwest region of the basin, the soil moisture values were also relatively high. Areas that were far from water resources mostly possessed natural vegetation or were arid desert regions, where water distribution networks are sparse and lack artificial irrigation and maintenance. As these areas are greatly influenced by the arid climate of the basin, the soil moisture values were generally less than 0.2, with the soil moisture in some areas being close to 0.
When the soil moisture inversion results based on the two remotely sensed data sources were compared, the soil moisture values of the different areas were more stratified, as shown in Figure 4, which indicates a significantly higher spatial heterogeneity. This is mainly attributed to the different spatial resolutions of the two types of images. The GF-1 WFV images had a spatial resolution of 16 m, which was slightly higher than the 30 m resolution of the Landsat8 OLI images. With the accuracy of the soil moisture inversion models being comparable, a higher spatial resolution enables the expression of surface information and spatial heterogeneity in greater detail, thus providing a reference for the attainment of precise crop irrigation in plots and the evaluation of regional ecological security.

3.3.2. Monitoring Surface Soil Moisture through Time

To further investigate the temporal and spatial variation patterns of soil moisture in the basin, GF-1 WFV images captured on 13 June, 6 July, 22 July, and 12 August 2016 were selected for the inversion monitoring and analysis of temporal and spatial variations in soil moisture in the 0–10 cm depth layer in the basin. Based on the aforementioned methods, the spatial distribution of soil moisture in the 0–10 cm depth layer at the four time points was determined (Figure 6).
Figure 6 shows that the regions with a higher soil moisture within the study area were mainly distributed in the upper-middle reaches of the basin, including areas along the river banks in Wushi County, southern Wensu County, northern Awat County, eastern Aksu City, and central Aral City. These regions are the main agricultural production areas of the Aksu River Basin, which are characterized by dense irrigation canal systems, a high agricultural vegetation cover, a high soil moisture retention capacity, and a relatively high and stable soil moisture content. In regions along the borders and in the lower reaches of the basin, including northern Wushi County, eastern Wensu County, eastern Aksu City, western and southern Awat County, Kalpin County, and Xayar County, the soil moisture values were somewhat low. As the main land-use types in these regions are shrub land, unused grassland, and bare land with a low vegetation cover, soil moisture is greatly influenced by land-surface evapotranspiration; therefore, the observed temporal and spatial variations in the soil moisture were considerably larger.
Further analysis revealed that the characteristics of temporal variation in the spatial patterns of the surface soil moisture in the Aksu River Basin were more complex due to the influence of factors such as artificial irrigation, land-use type, and vegetation cover. In agricultural vegetation areas located in the middle-upper reaches of the basin, where the soil moisture is relatively stable, drip irrigation can be used to provide agricultural water to crops to enhance the efficiency of water-resource utilization. For non-agricultural production areas along the borders or lower reaches of the basin, where the surface soil moisture varies significantly both temporally and spatially, greater efforts should be made in the planting and maintenance of artificial shelter forests and ecological forests to prevent the further desertification and degradation of natural forest lands and grasslands. This would ensure sustainable agricultural development and the healthy functioning of oasis ecosystems in the Aksu River Basin.

4. Discussion

(1) In this paper, the typical drought indices are built based on the Nir-Red spectral feature space theory. Using this Nir-Red spectral feature space, we could identify bare soil, wet soil, dry soil, full cover, etc. The PDI model is a line segment that is parallel with soil line and perpendicular to the normal line and the normal line is across the coordinate origin, which is suitable for bare soil or densely vegetated surfaces. The principle of MPDI and VAPDI is to exclude the vegetation interference from the mixed pixels in the soil–plant continuum. PVI can eliminate the influence of the soil background more effectively and is less susceptible to vegetation saturation compared with fv. From the aspect of calculation efficiency, VAPDI is almost the same as PDI, while it is much faster than MPDI. However, the construction of the typical drought indices is based on an ideal hypothesis of the fixed soil line; the distribution of the soil line is highly dependent on the soil type, soil structure, and soil organic matter concentration, which may lead to systematic errors. At the same time, the hydrological models would be applied in order to constrain the relationship between the soil moisture values at various levels. These remain to be further explored.
(2) The study area is an agriculture region covered by different crop types, and crops have different growth stages and different densities of vegetation. The drought index–soil moisture inversion model would be influenced by the above factors. Thus, there arises the question of how to build different models from the soil moisture and vegetation growth in the soil–plant continuum? In this paper, we chose summer as our research time; if our models perform well in this period, we may speculate that they will do better in other seasons. In other seasons, there will be less vegetation cover, and the changes in the spectral characteristics caused by changes in the soil moisture will be more obvious. Of course, if it is a non-farm season, there is no need to irrigate. Future work will focus on trying to build different models based on different conditions and different crops to improve our monitoring accuracy.
(3) Optical remote sensing is susceptible to the external environment, such as atmosphere, clouds, fog, etc. It is susceptible to leaves and stems under vegetation-covered areas. On the other hand, with its strong penetrating ability, microwave remote sensing can realize all-day observation under various meteorological conditions. Most importantly, it is sensitive to soil moisture changes too, but SAR radar’s ability to detect vegetation is limited. Therefore, combining two kinds of remote sensing data to jointly retrieve soil moisture has become a new research direction. This is a reasonable way to improve the model accuracy and reliability [39,40]. Now, we are studying the soil moisture retrieval model considering the synergy between the radar and optical data.
(4) Another problem is that the soil gets saturated when the water content goes beyond 0.45 cm3/cm3 and becomes dry at around 0.15 cm3/cm3, and optical sensors cannot detect the spectral difference when the water content is beyond these two limits, which brings an application range for our models that we need to take into consideration. It is a compromise for us to use an empirical model to retrieve soil moisture by optical remote sensing data, but until we can fully understand how the chemical and physical properties of soil affect the response of the spectral reflectance to the changing soil moisture, this is the most suitable algorithm we can use. The soil moisture information obtained by such methods can promote the rational distribution and efficient utilization of water resources in the basin.

5. Conclusions

(1) Negative linear relationships exist between the PDI, MPDI, and VAPDI calculated based on GF-1 WFV and Landsat 8 OLI remotely sensed images and the measured soil moisture values in the 0–10, 10–20, and 20–30 cm depth layers in the study area. All the indices presented the strongest correlation with soil moisture in the 0–10 cm depth layer, with a mean R2 value of 0.68. These results indicate that the soil moisture inversion models constructed based on optical remotely sensed images in the Red and NIR bands had a higher sensitivity towards soil moisture information. However, compared with the inversion accuracy for 0–10cm, the inversion accuracy was somewhat lower for soil moisture in deeper layers. Comparison with the accuracy of various drought indices—i.e., PDI, MPDI, and VAPDI—can help us choose the best index for the early warning and monitoring of drought and crop growth and development.
(2) Compared with the PDI model, the inversion accuracy of the MPDI and VAPDI models was higher; therefore, the latter models could express the internal spatial heterogeneity of the surface soil moisture in greater detail and produce more reliable inversion results in a rapid and efficient manner. Based on our modeling results, VAPDI is almost the same as PDI, while it is much faster than MPDI. Thus, it is recommended to use VAPDI in an agricultural area since it demonstrated a better calculation efficiency and accuracy, which can be used for the monitoring of drought and crop growth.
(3) The overall patterns of the surface soil moisture spatial distribution obtained from inversion based on the two types of remotely sensed images were consistent. To implement a large-scale region soil moisture inversion and implement it in practical agricultural applications, the remote sensing data should have a high revisit cycle and large scanning width. The GF-1 WFV images has such conditions. In addition, the inversion results based on the higher-resolution GF-1 WFV images were more detailed, with the soil moisture values being more stratified, thus reflecting the heterogeneity of the soil moisture in similar plots to a greater extent. Therefore, the overall inversion results obtained using the GF-1 WFV images were superior to those obtained using the Landsat8 OLI images.

Author Contributions

Conceptualization, Y.N. and J.Y.; methodology and formal analysis, Y.N.; investigation, Y.D., Y.T., and Y.N.; resources, Y.D. and Y.T.; visualization, Y.N.; writing—original draft preparation, Y.N.; writing—review and editing, J.Y. All authors have read and agreed to the published version of the manuscript.

Funding

This research was supported by the National Nature Science Foundation Program of China (41401232) and the Opening Foundation of Key Laboratory of Agricultural Remote Sensing, the Ministry of Agriculture and Rural Affairs, P.R.China (2016002), and financially supported by the self-determined research funds of CCNU from the colleges’ basic research and operation of MOE (CCNU18TS002).

Conflicts of Interest

The authors declare no conflict of interest.

References

  1. Koster, R.D.; Yamada, T. Regions of Strong Coupling between Soil Moisture and Precipitation. Science 2004, 305, 1138–1140. [Google Scholar] [CrossRef] [Green Version]
  2. Jin, H.; Zhu, Q.; Zhao, X.; Zhang, Y. Simulation and Prediction of Climate Variability and Assessment of the Response of Water Resources in a Typical Watershed in China. Water 2016, 8, 490. [Google Scholar] [CrossRef] [Green Version]
  3. Zhang, L.; Lu, H.Q.; Wang, L.Y.; Yang, B.Y. Spatial-temporal Characteristics of Soil Moisture in China. Acta Geo. Sinica 2016, 71, 1494–1508. (In Chinese) [Google Scholar]
  4. Meyer, T.; Weihermüller, L.; Vereecken, H.; Jonard, F. Vegetation Optical Depth and Soil Moisture Retrieved from L-Band Radiometry over the Growth Cycle of a Winter Wheat. Remote Sens. 2018, 10, 1637. [Google Scholar] [CrossRef] [Green Version]
  5. Thevs, N.; Peng, H.Y.; Rozi, A.; Zerbe, S.; Abdusalih, N. Water Allocation and Water Consumption of Irrigated Agriculture and Natural Vegetation in the Aksu-Tarim River Basin, Xinjiang, China. J. Arid Environ. 2015, 112, 87–97. [Google Scholar] [CrossRef]
  6. Yang, P.; Xia, J.; Zhan, C.S.; Mo, X.G.; Chen, X.J.; Hu, S.; Chen, J. Estimation of Water Consumption for Ecosystems based on Vegetation Interfaces Processes Model: A case study of the Aksu River Basin, Northwest China. Sci. Total Environ. 2018, 613, 186–195. [Google Scholar] [CrossRef]
  7. George, P.P.; Gareth, I.; Brian, B. Surface Soil Moisture Retrievals from Remote Sensing: Current Status, Products and Future Trends. Phys. Chem. Earth 2015, 83, 36–56. [Google Scholar]
  8. Verstraeten, W.W.; Veroustraete, F.; Sande, C.J.; Grootaers, L.; Feyen, J. Soil Moisture Retrieval using Thermal Inertia, Determined with Visible and Thermal Spaceborne Data, Validated for European Forests. Remote Sens. Environ. 2006, 101, 299–314. [Google Scholar] [CrossRef]
  9. Karthikeyan, L.; Pan, M.; Wanders, N.; Kumar, D.N.; Wood, E.F. Four Decades of Microwave Satellite Soil Moisture Observations: Part 1. A Review of Retrieval Algorithms. Adv. Water Resour. 2017, 109, 106–120. [Google Scholar] [CrossRef]
  10. Rijal, S.; Zhang, X.; Jia, X. Estimating Surface Soil Water Content in the Red River Valley of the North using Landsat 5 TM Data. Soil Sci. Soc. Am. J. 2013, 77, 1133–1143. [Google Scholar] [CrossRef] [Green Version]
  11. Njoku, E.G.; Jackson, T.J.; Lakshmi, V.; Chan, T.K.; Nghiem, S.V. Soil Water Content Retrieval from AMSR-E. IEEE Trans. Geosci. Remote Sens. 2003, 41, 215–229. [Google Scholar] [CrossRef]
  12. Kerr, Y.H.; Waldteufel, P.; Wigneron, J.P.; Martinuzzi, J.M.; Font, J.; Berger, M. Soil Water Content Retrieval from Space: The Soil Water Content and Ocean Salinity (SMOS) Mission. IEEE Trans. Geosci. Rem. Sens. 2001, 39, 1729–1735. [Google Scholar] [CrossRef]
  13. Jaward, A.B.; Ayman, S.; Aaron, B. A Comparison of Two Models to Predict Soil Moisture from Remote Sensing Data of RADARSAT II. Arab. J. Geosci. 2014, 7, 4851–4860. [Google Scholar]
  14. Chai, X.; Zhang, T.; Shao, Y.; Gong, H.; Liu, L.; Xie, K. Modeling and Mapping Soil Moisture of Plateau Pasture Using RADARSAT-2 Imagery. Remote Sens. 2015, 7, 1279. [Google Scholar] [CrossRef] [Green Version]
  15. Moran, M.S.; Peters-Lidard, C.D.; Watts, J.M.; McElroy, S. Estimating Soil Water Content at the Watershed Scale with Satellite-based Radar and Land Surface Models. Can. J. Rem. Sens. 2004, 30, 805–826. [Google Scholar] [CrossRef] [Green Version]
  16. Pratola, C.; Barrett, B.; Gruber, A.; Dwyer, E. Quality Assessment of the CCI ECV Soil Moisture Product Using ENVISAT ASARWide Swath Data over Spain, Ireland and Finland. Remote Sens. 2015, 7, 5388. [Google Scholar] [CrossRef] [Green Version]
  17. Parinaz, R.B.; Kenji, O.; Yo, S. Comparative Evaluation of the Vegetation Dryness Index(VDI), the Temperature Vegetation Dryness Index(TVDI) and the Improved TVDI (iTVDI) for Water Stress Detection in Semi-arid Regions of Iran. ISPRS J. Photogramm. Remote Sens. 2012, 68, 1–12. [Google Scholar]
  18. Liu, L.Y.; Liao, J.S.; Chen, X.Z. The Microwave Temperature Vegetation Drought Index(MTVDI) based on AMSR-E Brightness Temperatures for Long-term Drought Assessment Across China (2003–2010). Remote Sens. Environ. 2017, 199, 302–320. [Google Scholar] [CrossRef]
  19. Wu, C.L.; Qin, Q.M.; Li, M.; Zhang, N. Soil Moisture Monitoring of Vegetative Area in Farmland by Remote Sensing based on Spectral Feature Space. Trans. Chin. Soc. Agr. Eng. 2014, 30, 106–112. (In Chinese) [Google Scholar]
  20. Richardson, A.J.; Wiegand, C.L. Distinguishing Vegetation from Soil Background Information. Photogramm. Eng. Remote Sens. 1977, 43, 1541–1552. [Google Scholar]
  21. Ghulam, A.; Qin, Q.M.; Zhan, Z.M. Designing of the Perpendicular Drought Index. Environ. Geol. 2007, 52, 1045–1052. [Google Scholar] [CrossRef]
  22. Brosinsky, A.; Lausch, A.; Doktor, D.; Salbach, C.; Merbach, I. Analysis of Spectral Vegetation Signal Characteristics as a Function of Soil Moisture Conditions using Hyperspectral Remote Sensing. J. Indian Soc. Remote Sens. 2014, 42, 311–324. [Google Scholar] [CrossRef]
  23. Gao, Z.L.; Zheng, X.P.; Scun, Y.J.; Wang, J.H. A Novel Method of Soil Moisture Content Monitoring by Land Surface Temperature and LAI. Spectrosc. Spect. Anal. 2015, 35, 3129–3133. [Google Scholar]
  24. Wang, H.Q.; Magagi, R.; Goita, K. Comparison of Different Polarimetric Decompositions for Soil Moisture Retrieval over Vegetation Covered Agricultural Area. Remote Sens. Environ. 2017, 199, 120–136. [Google Scholar] [CrossRef]
  25. Rahman, M.S.; Di, L.; Yu, E.; Lin, L.; Zhang, C.; Tang, J. Rapid Flood Progress Monitoring in Cropland with NASA SMAP. Remote Sens. 2019, 11, 191. [Google Scholar] [CrossRef] [Green Version]
  26. Liang, S. An Investigation of Remotely-sensed Soil Depth on the Optical Region. Int. J. Remote Sens. 1997, 18, 3395–3408. [Google Scholar] [CrossRef] [Green Version]
  27. Calvet, J.C.; Noilhan, J. From Near-surface to Root-zone Soil Moisture using Year-round Data. J. Hydrometeorol. 2000, 1, 393–411. [Google Scholar] [CrossRef]
  28. Sergio, S.R.; María, P.; Nilda, S.; José, M.F. Combining SMOS with Visible and Near/shortwave/thermal Infrared Satellite Data for High Resolution Soil Moisture Estimates. J. Hydrol. 2014, 516, 273–283. [Google Scholar]
  29. Sujay, V.K.; Paul, A.D.; Christa, D.P.; Rajat, B.; John, B. Information Theoretic Evaluation of Satellite Soil Moisture Retrievals. Remote Sens. Environ. 2018, 204, 392–400. [Google Scholar]
  30. Zhou, Q.B.; Yu, Q.Y.; Liu, J.; Wu, W.B.; Tang, H.J. Perspective of Chinese GF-1 High-resolution Satellite Data in Agricultural Remote Sensing Monitoring. J. Integr. Agr. 2017, 16, 242–251. [Google Scholar] [CrossRef]
  31. Li, H.; Chen, Z.X.; Jiang, Z.W.; Wu, W.B.; Ren, J.Q.; Liu, B.; Tuya, H.S. Comparative Analysis of GF-1, HJ-1, and Landsat-8 data for Estimating the Leaf Area Index of Winter Wheat. J. Integr. Agr. 2017, 16, 266–285. [Google Scholar] [CrossRef]
  32. Machiwal, D.; Gupta, A.; Jha, M.K.; Kamble, T. Analysis of trend in temperature and rainfall time series of an Indian arid region: Comparative evaluation of salient techniques. Theor. Appl. Climatol. 2019, 136, 301–320. [Google Scholar] [CrossRef]
  33. Zhan, Z.; Qin, Q.; Ghulam, A.; Wang, D.D. Nir-Red Spectral Space based New Method for Soil Moisture Monitoring. Sci. China Series D Earth Sci. 2007, 50, 283–289. [Google Scholar] [CrossRef]
  34. Ghulam, A.; Qin, Q.; Teyip, T.; Li, Z.L. Modified Perpendicular Drought Index (MPDI): A real-time Drought Monitoring Method. ISPRS J. Photogramm. Remote Sens. 2007, 62, 150–164. [Google Scholar] [CrossRef]
  35. Li, Z.; Tan, D. The Second Modified Perpendicular Drought Index (MPDI1): A Combined Drought Monitoring Method with Soil Moisture and Vegetation Index. J. Indian Soc. Remote Sens. 2013, 41, 873–881. [Google Scholar] [CrossRef]
  36. Baret, F.; Jacquemoud, S.; Hanocq, J.F. The Soil Line Concept in Remote Sensing. Remote Sens. Rev. 1993, 7, 65–82. [Google Scholar] [CrossRef]
  37. Yang, X.B.; Qin, Q.M.; Yao, Y.J.; Zhao, S.H. Comparison and Application of PDI and MPDI for Drought Monitoring in Inner Mongolia. Geo. Inf. Sci. Wuhan Univ. 2011, 36, 195–198. (In Chinese) [Google Scholar]
  38. Xiao, J.F.; Moody, A. A Comparison of Methods for Estimating Fractional Green Vegetation Cover within a Desert-to-upland Transition Zone in Central New Mexico, USA. Remote Sens. Environ. 2005, 98, 237–250. [Google Scholar] [CrossRef]
  39. Huang, S.H.; Ding, J.L.; Liu, B.H.; Ge, X.Y.; Wang, J.J.; Zou, J.; Zhang, J.Y. The Capability of Integrating Optical and Microwave Data for Detecting Soil Moisture in an Oasis Region. Remote Sens. 2020, 12, 1358. [Google Scholar] [CrossRef]
  40. Lei, F.; Crow, W.T.; Kustas, W.P.; Dong, J.; Yang, Y.; Knipper, K.R.; Anderson, M.C.; Gao, F.; Notarnicola, C.; Greifeneder, F.; et al. Data assimilation of high-resolution thermal and radar remote sensing retrievals for soil moisture monitoring in a drip-irrigated vineyard. Remote Sens. Environ. 2020, 239, 111622. [Google Scholar] [CrossRef]
Figure 1. Distribution of the measured samples of soil moisture in the study area.
Remotesensing 12 02587 g001
Figure 2. Distribution schematic of pixels in the PVI-PDI spectral feature space.
Remotesensing 12 02587 g002
Figure 3. Correlation between PDI/MPDI/VAPDI and the measured soil moisture data (0–10 cm) based on GF-1 WFV.
Remotesensing 12 02587 g003
Figure 4. Distribution of soil moisture retrieval based on a GF-1 WFV image.
Remotesensing 12 02587 g004
Figure 5. Distribution of soil moisture retrieval based on a Landsat8 OLI image.
Remotesensing 12 02587 g005
Figure 6. Distribution of soil moisture retrieval from June to August in the Akesu River Basin.
Remotesensing 12 02587 g006
Table 1. Statistics of measured soil moisture samples in different land cover types.
TypesPointsMaximumMinimumMedianAverageStandard DeviationVariation Coefficient
Rice120.4850.2020.3240.3180.090.283
Wheat170.3520.1780.2450.2370.0910.384
Cotton290.3050.1430.2240.2130.0760.357
Orchard240.3150.1190.2070.2140.0810.379
Woodland110.3050.1230.2190.2070.0750.362
Bare land90.2230.0880.1490.1620.0710.438
Soil moisture content unit: (cm3/cm3).
Table 2. The fitted models of two remotely sensed images and the soil moisture in different depth layers.
ImagesDepth LayersIndicesFitted ModelsR2S.D.P
GF-1 WFV0–10 cmPDIy = −1.6135x + 0.60470.6154 **0.0940.000
MPDIy = −1.1925x + 0.60580.7042 **0.0730.000
VAPDIy = −1.2808x + 0.70450.7863 **0.0710.000
10–20 cmPDIy = −1.2262x + 0.53910.5036 **1.2180.007
MPDIy = −0.9329x + 0.5470.5623 **1.0060.005
VAPDIy = −1.0496x + 0.6030.584 **0.0940.000
20–30 cmPDIy = −1.3042x + 0.56960.4712 *1.5330.032
MPDIy = −1.0042x + 0.58290.5047 *1.6040.013
VAPDIy = −0.9817x + 0.62530.5106 **1.4100.008
Landsat8 OLI0–10 cmPDIy = −3.4284x + 0.70390.5265 **0.8710.000
MPDIy = −2.1545x + 0.7180.7191 **0.0690.000
VAPDIy = −2.7037x + 0.58910.7469 **0.0750.000
10–20 cmPDIy = −4.2156x + 0.78430.5642 **1.0840.000
MPDIy = −1.9632x + 0.60840.5287 **1.4350.000
VAPDIy = −1.9246x + 0.50780.5439 **1.1330.000
20–30 cmPDIy = −3.7108x + 0.74690.505 *1.5950.011
MPDIy = −1.8677x + 0.64210.5061 **1.6180.006
VAPDIy = −2.0945x + 0.54230.5213 **1.4580.008
*: pass 0.05 significant test; **: pass 0.01 significant test.
Table 3. Accuracy evaluation index value of each soil moisture retrieval model.
ImagesIndexDepth LayersR2MAE (%)MRE (%)RMSE%
GF-1 WFVPDI0–10 cm0.60374.168.444.96
10–20 cm0.52187.239.337.28
20–30 cm0.48069.6712.608.05
MPDI0–10 cm0.69453.297.374.11
10–20 cm0.55716.968.934.47
20–30 cm0.49949.5611.087.94
VAPDI0–10 cm0.79322.235.673.41
10–20 cm0.57246.788.354.73
20–30 cm0.50168.8610.727.68
Landsat8 OLIPDI0–10 cm0.53387.079.146.90
10–20 cm0.55906.889.024.51
20–30 cm0.50418.9211.137.59
MPDI0–10 cm0.70753.147.253.98
10–20 cm0.52637.379.407.42
20–30 cm0.48199.8312.158.17
VAPDI0–10 cm0.73862.866.183.85
10–20 cm0.55146.799.244.60
20–30 cm0.51468.7110.567.25

