Article

Validation of Sentinel-3 OLCI Integrated Water Vapor Products Using Regional GNSS Measurements in Crete, Greece

by
Stelios Mertikas
1,
Panagiotis Partsinevelos
2,*,
Achilleas Tripolitsiotis
3,
Costas Kokolakis
3,
George Petrakis
2 and
Xenophon Frantzis
1
1
Geodesy and Geomatics Engineering Laboratory, Technical University of Crete, GR-73100 Chania, Greece
2
SenseLab Research, Technical University of Crete, GR-73100 Chania, Greece
3
Space Geomatica P.C., Xanthoudidou 10A, GR-73132 Chania, Greece
*
Author to whom correspondence should be addressed.
Remote Sens. 2020, 12(16), 2606; https://doi.org/10.3390/rs12162606
Submission received: 7 July 2020 / Revised: 6 August 2020 / Accepted: 11 August 2020 / Published: 12 August 2020

Abstract

:
Water vapor is one of the essential variables in monitoring the Earth’s climate. The Ocean and Land Color Instrument (OLCI) on-board the Copernicus Sentinel-3 missions measures the Integrated Water Vapor (IWV) column over land and ocean surfaces. Post-launch calibration and validation of satellite measurements constitutes a key process in the operational phase of Earth observation satellites. This work presents the external and independent validation of OLCI-A IWV product using the regional network of continuously operating Global Navigation Satellite System (GNSS) comprised 10 stations distributed over the island of Crete in the eastern Mediterranean. The Sentinel-3A/-3B OLCI imagery that captures in a single scene the entire area of Crete has been examined. For each OLCI image, the IWV value of cloud-free pixels containing the GNSS stations have been derived and compared against simultaneous GNSS-derived measurements. The absolute as well as the relative bias between OLCI-A and OLCI-B IWV measurements have been determined. There is a good agreement between OLCI and GNSS with a bias of −0.57 mm ± 2.90 mm for OLCI(A) and +2.42 ± 3.41 mm for OLCI(B). The results of this regional validation activity are compared against other studies and the regular validation carried out at the Sentinel-3 Mission Performance Center. This work concludes that the accuracy of the OLCI IWV products is within its design requirements. The potential synergy between Sentinel-2 and Sentinel-3 IWV products is also discussed.

1. Introduction

Water vapor is one of the essential climate variables [1] which seems to have a strong impact on the Earth’s hydrological cycle (evaporation, condensation and precipitation) and correlates to the planet’s energy balance. The rise of the Earth’s temperature increases evaporation from ocean and inland waters and subsequently builds up water vapor in the atmosphere. Although water vapor does not cause by itself global warming, it contributes to higher concentrations of water vapor in the atmosphere which in turn amplify the effect of temperature rise and eventually produce instability in the climate system.
The importance of water vapor has led to the development of a plethora of techniques for its monitoring by engaging sensors with passive microwave [2], Lidar (Light Detection and Ranging) [3], infrared [4], ultraviolet [5], near-infrared [6], limb sounding [7], radiosondes [8], but also ground-based microwave radiometers [9], global navigation satellite systems [10] and ground/aerial/satellite devices.
In addition to its role as a climate variable, water vapor influences measurements carried out by earth observation satellites. For example, active microwave sensors, such as satellite altimeters, require corrections to be applied to their range observations to compensate the signal propagation delay in the atmosphere and especially their wet troposphere component. In that respect, each Copernicus Sentinel-3 mission carries a dual-frequency microwave radiometer (MWR) to determine those wet-tropospheric corrections for the operating synthetic aperture radar altimeter (SRAL); a primary payload of the Sentinel-3A/-3B [11]. Although these satellite radiometers operate well over the ocean, they do not function properly over land masses. Thus, their proper operation is restricted to sea and water regions farther than about 20–25 km from the coasts [12].
Measurements obtained by instruments on-board earth observation satellites need to be calibrated and validated before and after their launch. Pre-launch calibration is commonly performed at specialized facilities on the ground and the results are traceable to international standards. Post-launch calibration is carried out at dedicated permanent facilities that provide the in-situ measurements against which the satellite measurements are compared with.
A permanent facility for satellite altimetry calibration operates in western Crete, Greece employing diverse calibration techniques and complying with the European Space Agency strategy for fiducial reference measurements (FRM) [13]. This FRM strategy requires redundancy in the way measurement uncertainties are determined and contribute errors to the calibration process. In this connection, wet troposphere delays have to be determined by at least two independent techniques at each satellite altimetry Cal/Val site [14]. This is especially true for sites operating on land such as that of the transponder [15]. Here the “CDN1” transponder Cal/Val site is located on the mainland of Crete and it is not possible to retrieve valid measurements from the satellite radiometer. Currently, GNSS processing is the technique employed to determine the wet troposphere delay at the CDN1 transponder calibration site.
Exploitation of GNSS observations for mapping zenith wet delays and precipitable water has been proposed three decades ago [16]. It has been used since then to validate water vapor measurements made by either ground [17] or satellite [18] sensors as well as to support real-time precise point positioning [19].
The FRM requirement for redundancy originally motivated us to investigate the application of the OLCI IWV measurements as an alternative and independent technique for the estimation of wet troposphere delay during satellite altimetry transponder calibrations [20]. The results obtained by this investigation led to the idea to exploit the continuously operating GNSS network in Crete not only to support satellite altimetry but also to validate the OLCI IWV observations of Sentinel-3.
GNSS observations have been already applied in the past to assess the performance of SRAL and MWR of Sentinel-3, and specifically to evaluate the wet tropospheric corrections as derived by the MWR over open ocean and coastal regions but not over land surfaces [12,15]. Thus, this work for the first time validates the integrated water vapor products of Sentinel-3 OLCI instruments by an external network of continuously operating GNSS reference stations. This work also introduces the practical application of the FRM strategy for the optical observations of Sentinel-3. The following section provides a concise description of the principles of operation for OLCI and GNSS instruments and shows how to derive integrated water vapor relying on the available datasets. Section 3 presents the statistical distribution of the OLCI and GNSS IWV measurements, determines the absolute OLCI IWV bias and correlates the two independent methods. This analysis has been carried out per GNSS station followed by an overall assessment of the performance of Sentinel-3A/-3B OLCI IWV measurements over the study area. Section 4 interprets the outcome of the implemented methodology for OLCI IWV calibration and compares results against those presented by the Sentinel-3 Mission Performance Center. Section 5 summarizes the key findings and discusses the future steps towards the promotion of synergy between intra- and multi-mission instruments and the upgrading of the existing satellite altimetry calibration facility to the calibration of other satellite instruments as well.

2. Methodology and Dataset

The aim of this work is to compare the OLCI products for the IWV of Sentinel-3 against values derived from permanent GNSS stations on the ground. This external validation of OLCI products for IWV data is in agreement with the requirements for FRM redundancy. This section presents the methodology followed to determine the IWV values from OLCI and GNSS observations, the regional GNSS network, and the OLCI dataset implemented to perform this work.

2.1. Estimation of the IWV from OLCI

The OLCI multi-spectral imaging spectrometer on board the Copernicus Sentinel-3 family (Sentinels-3A and -3B are already operational whereas Sentinels-3C/-3D are to replace them in the near future) is based on the heritage of the ENVISAT’s medium resolution imaging spectrometer (MERIS). Its main difference with its predecessor is that OLCI has 21 spectral bands, unlike the 15 bands on MERIS, the design of OLCI’s five cameras mitigate sun-glint contamination, and it provides a resolution of 300 m over all target surfaces [21]. Each OLCI camera has its own charge couple device (CCD) composed of 384,800 imaging pixels (740 columns × 520 lines), resulting in 3700 ground pixels (740 pixels × 5 cameras) and covering a swath of 1270 km on the Earth’s surface over a spectral range from 390 nm to 1040 nm [22].
Retrieval of water vapor from OLCI measurements relies upon the differential absorption technique [23] which allots measured radiance at a non-absorbing spectral band (O19 spectral band at 900 nm) and the reference water vapor absorption band (O18 spectral band at 885 nm). Although the measured radiance per spectral band is a function of solar irradiance, atmospheric transmittance and surface albedo (ignoring diffusion effects), following the differential absorption technique, it can be shown that IWV [kg/m2 or mm] is given as [24]:
I W V = ( 1 k 19 ) ln [ L 19 L 18 ]
where L 18 , L 19 is the measured spectral radiance at the O18 and O19 spectral bands, respectively, and k 19 is the mass extinction coefficient of water vapor at the O19 spectral band corresponding to the presumed vertical profile of temperature, pressure and water vapor over that wavelength. The algorithm used by Sentinel-3 to retrieve water vapor from OLCI measurements is described in [25].

2.2. Estimation of the IWV from GNSS Measurements

The signals transmitted by the GNSS satellites are refracted by the neutral atmosphere (troposphere) before reaching a ground GNSS receiver. This refraction introduces a signal propagation delay in the troposphere, called zenith total delay (ZTD), and estimated through processing (relative positioning, precise point positioning, etc.) of GNSS observations [26]. This ZTD value corresponds to the integrated signal delay caused by the zenith hydrostatic delay (ZHD) and the zenith wet delay (ZWD). The temporal and spatial variations of ZHD are small, contrary to the ZWD which change rapidly both in space and time [27].
The IWV may be calculated using GNSS-derived ZWD measurements using Equation (2) [28]:
I W V = Π · Ζ W D = 10 6 ρ · R V · ( C 1 T m + C 2 ) · Z W D
where I W V is the water vapor content in kg m−2, ρ is the mass density of water (=1 gr cm−3), R V is the gas constant for water vapor (=0.4615 N∙m∙K−1∙gr−1), C 1 (=3.776 × 10⁵ K2∙hPa−1) and C 2 (=22.10 K hPa−1) are refractivity coefficients, T m is the weighted temperature of the atmosphere in °K, and ZWD is the delay caused by the wet troposphere in mm. The weighted temperature of the atmosphere is approximated with a 2% uncertainty for all weather condition by Equation (3) [16]:
T m = 70.20 + 0.72 · T s
where T s is the surface temperature in °K.

2.3. The Regional GNSS Monitoring Network

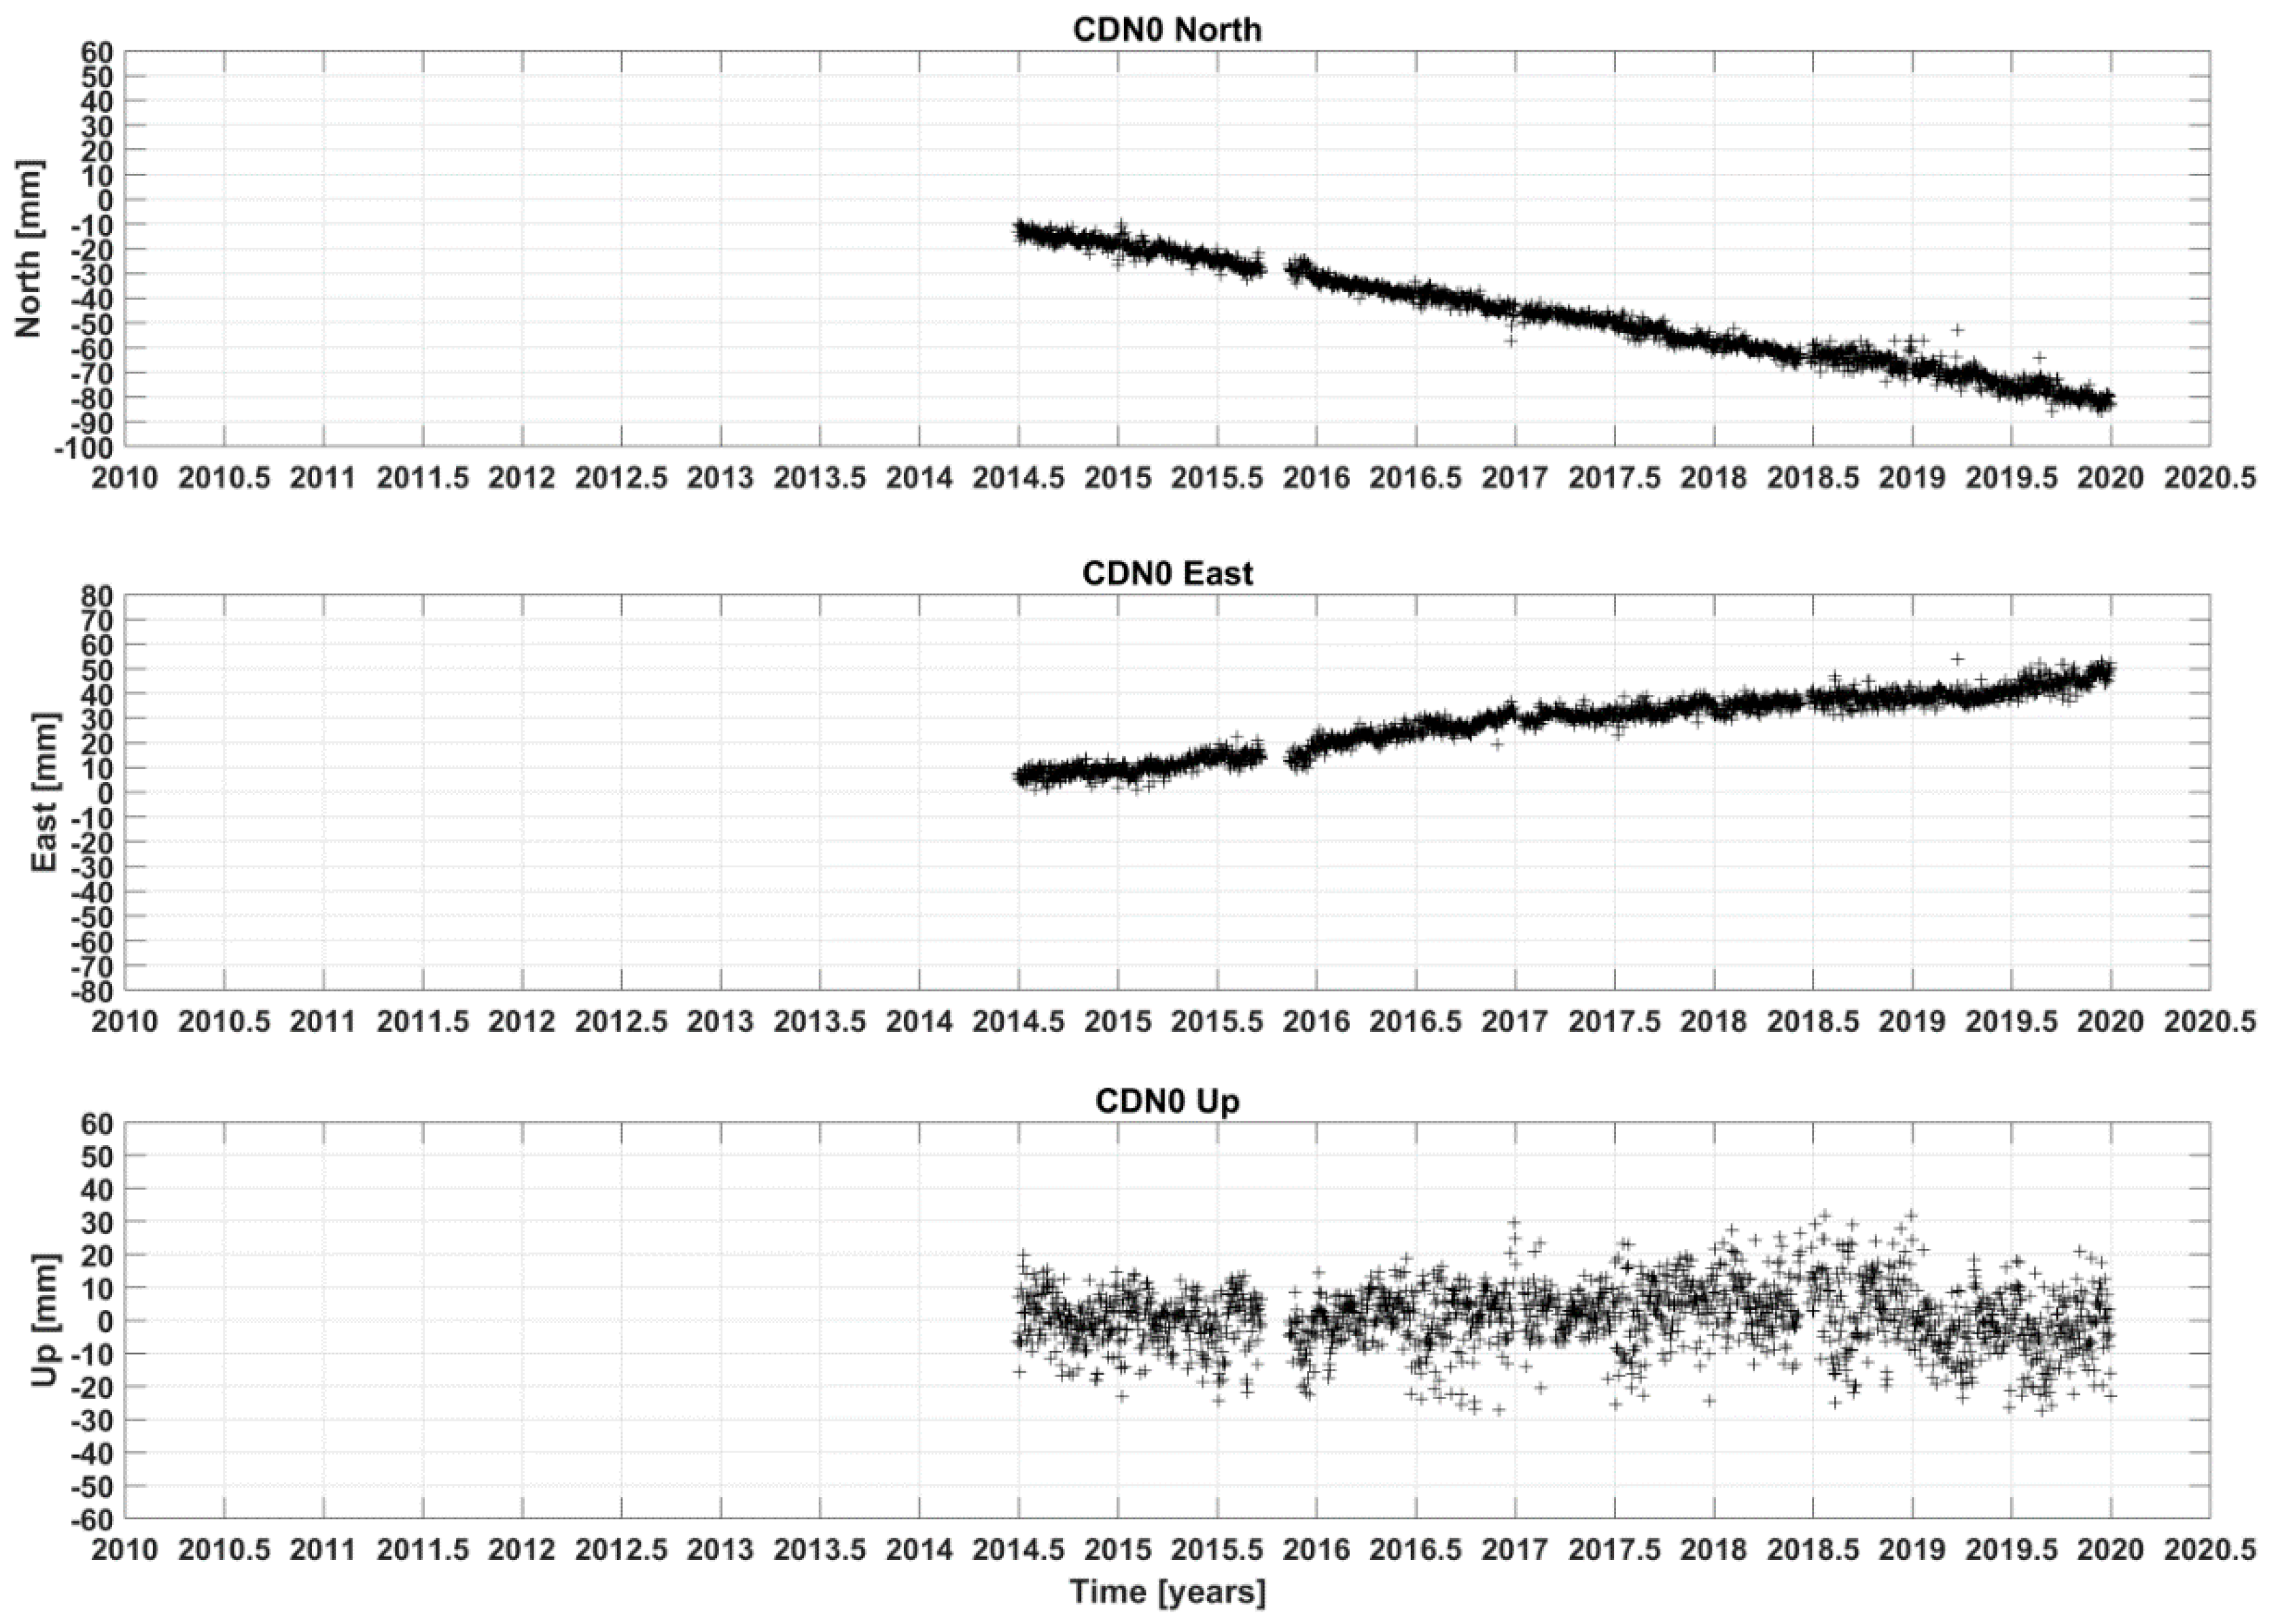
A network of 15 permanent, continuously operating GNSS reference stations has been established and maintained by the Technical University of Crete, in western Crete for monitoring tectonic deformation and for supporting the operations of the ESA’s Permanent Facility for Altimetry Calibration in Crete [29]. In this work, GNSS data from 10 reference stations have been processed (Figure 1) using relative positioning implemented via the GAMIT scientific software (version 10.71) developed by MIT, USA [30]. Table A1 in Appendix A presents the positioning results (coordinates and velocities) for each GNSS station as computed using the latest (2014) realization of the International Terrestrial Reference Frame [31]. The time series of the daily coordinates of the CDN0 GNSS station, operating on a mountain in West Crete, is given in Figure 2.
The International Terrestrial Reference Frame 2014 (ITRF 2014) [31] has been here implemented and the GAMIT time series have been analyzed using the Quasi-Observation Combination Analysis software [32]. In addition to this regional GNSS network, extra observations from reference stations which are part of the International GNSS Service as well as the European Reference Frame networks, have been included in the database for processing. The GNSS observations have been carried out using precise satellite orbits, a 10° elevation cut-off angle at a rate of 30 s. Solid-earth, polar motion and oceanic loading tides have been also applied [33,34].
In GNSS processing, the zenith wet delay is given as the difference between the zenith tropospheric delay and the zenith hydrostatic delay. The Saastamoinen model [35] has been used to provide an accurate estimate for the zenith hydrostatic delay as a function of the station atmospheric pressure (P) and latitude (φ) and orthometric height (H):
Z H D   ( P ,   φ ,   H ) = 0.0022768 · P 1 0.00266 cos ( 2 φ ) 0.00028 · H
Measurements of the atmospheric pressure have been made by collocated barometers and/or provided by meteorological models. The CDN0, CRS1 and TUC2 stations are equipped with meteorological sensors, while for the remaining GNSS stations the atmospheric pressure is estimated using atmospheric pressure loading models [36] and the Vienna Mapping Function 1 (VMF1) model [37]. The VMF1 model is applied in case of malfunction of an in-situ operating barometer.
Different input (i.e., VMF1 model and in-situ sensors in our case) impact the produced water vapor product. In order to quantify this contribution, the zenith wet delay (1-min rate records) using both the VMF1 model and the collocated meteorological sensors at the CDN0, CRS1 and TUC2 GNSS stations has been determined (Figure 3). Apparently, this comparison has been carried out when the meteorological sensors at the respective sites have been operating. The Pearson correlation coefficient has been calculated to be 0.96, 0.98 and 0.98 for CDN0, CRS1 and TUC2 respectively, and the mean bias is at the sub-millimeter level. These correlation results along with the values of the R2 coefficient (>0.92, statistically significant) justify the integration of the two atmospheric pressure data sources.

2.4. The OLCI Dataset

The Sentinel-3A mission was launched on 16 February 2016 and Sentinel-3B was launched on 25 April 2018. Initially, Sentinel-3B was operating in tandem with Sentinel-3A and eventually reached its nominal orbit in December 2018. This work applies the full range of Sentinel-3A products, covering a period of about four years of operations (February 2016 to February 2020). For Sentinel-3B, only OLCI products covering the full year of 2019 (1 January to 31 December) have been evaluated at this stage.
The repeat cycle of Sentinel-3A/-3B satellites is 27 days. Nonetheless, OLCI permits global coverage in 2–3 days because of its large swath of 1270 km. This revisit time of OLCI is further reduced to about daily coverage with the two satellites in orbit.
Only OLCI images containing the entire island of Crete in a single scene have been taken into consideration for the present work. Specifically, twelve Sentinel-3A and Sentinel-3B Passes (No. 7, 21, 64, 78, 121, 135, 178, 235, 278, 292, 335, and 349 of each mission) fulfill this coverage requirement (Figure 4).
The Sentinel-3 OLCI Level-2 Land Full Resolution (OL_2_LFR) product contains the IWV band. Full resolution stands for a 300-m pixel size on OLCI IWV imagery. The Copernicus Open Access Application Programing Interface Hub (API) and a custom-built script written in Python have been used to download the OLCI imagery, and in the end, to determine the IWV values.
Initially, the Sentinelsat module (https://pypi.org/project/sentinelsat/) has been used to execute a spatial query through the Copernicus API per relative pass and to identify the Sentinel products that fulfill the following criteria: (1) Mission: Sentinel-3, (2) Product: OL_2_LFR, and (3) Region: Crete as defined in the script with a polygon in GeoJson (https://geojson.org/) format. The identified Sentinel-3 products are automatically downloaded and archived as separate folders. Then, the IWV value, its error, geographical coordinates, date & time stamps, contained within each Sentinel-3 product folder, are examined.
In the sequel, for each GNSS station, the script estimates the nearest to it pixel in the OLCI image. Two approaches are followed for the determination of the OLCI-derived IWV values: (1) single pixel and (2) average of pixels within an area of influence.
In the first approach, the IWV derived from GNSS is directly compared against the OLCI pixel value nearest to the location of the GNSS station. This approach has been recently followed to match the GNSS IWV observations with those derived from the IASI, MIRS, MODIS and MODIS-FUB satellites [38].
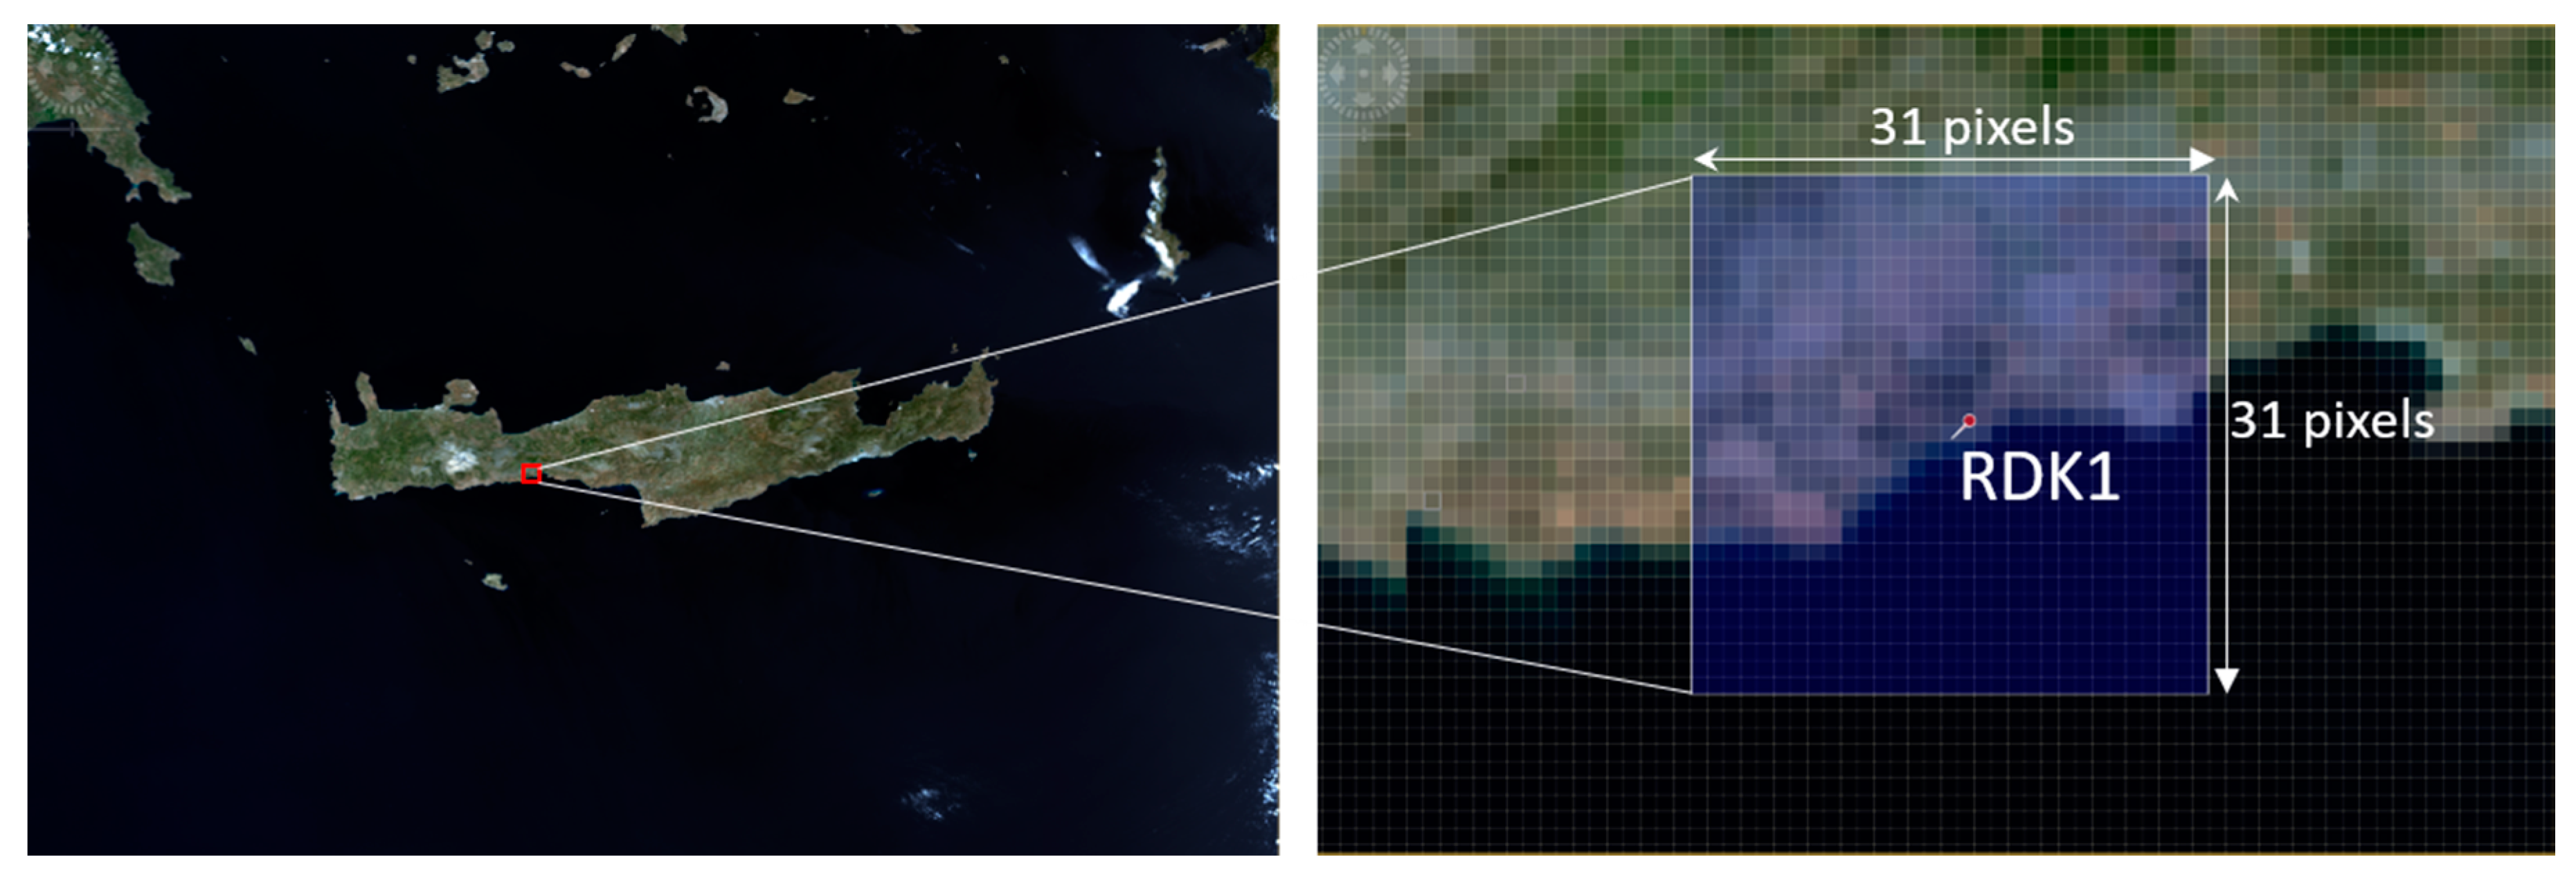
The second approach takes into account a GNSS area of influence, as the zenith total delay represents the average of all slant signal paths for the visible satellites at the troposphere layer height [39]. The size of this area of influence varies and depends on local conditions (i.e., visibility to GNSS satellites, variation in GNSS constellation geometry, etc.). In this work, a rectangular area of 31 × 31 pixels of OLCI (about 9.3 km2) has been selected to represent the effective area of influence for the GNSS-derived IWV values. The center of this rectangle is located near in space or on the GNSS station (Figure 5). This influence area is similar in size to that applied in [40]. The OLCI IWV value to be compared against the GNSS-derived IWV is the average of 961 pixels in the vicinity of the central pixel (GNSS station location). Only OLCI IWV values that are flagged as “LAND” (land surface and clear sky) have been taken into consideration for this averaging.
For the OLCI pixel nearest to GNSS station as well as for those pixels within the area of influence, the value and error of the IWV, the sensing date and time are from the related OLCI band records. All those are archived for further analysis. Finally, a file is created per Sentinel-3 orbit (Table 1), containing values and parameters, along with the satellite cycle and relative orbit number.
For each Sentinel-3 OLCI IWV image, the IWV values and associated errors are obtained for that pixel (300-m size) which contains a GNSS station along with the 30 × 30 pixels in its vicinity. Table 2 presents the dataset (cycles) used per satellite orbit and mission. The cycles that contained no IWV values at the GNSS stations (pixel covered by clouds for example) are also identified. It can be seen that at least one comparison point (GNSS station) exists in all Sentinel-3A and Sentinel-3B cycles.
This section briefly presented the way the integrated water vapor using OLCI and GNSS measurements are determined. The satellite and GNSS dataset used to perform the external validation of the OLCI-derived IWV values have been also described.

3. Results

This section compares the IWV values measured by the OLCI instrument with the respective values derived from the GNSS reference stations on the ground using both the “single point” and the “area-of-influence” approaches. Absolute calibration as well as relative validation of Sentinel-3A/-3B OLCI IWV products has been carried out. Absolute calibration is performed using the GNSS-derived IWV as reference, whereas relative validation refers to comparison of simultaneously captured Sentinel-3A and Sentinel-3B OLCI IWV products.

3.1. Absolute Bias of Sentinel-3 OLCI IWV Products

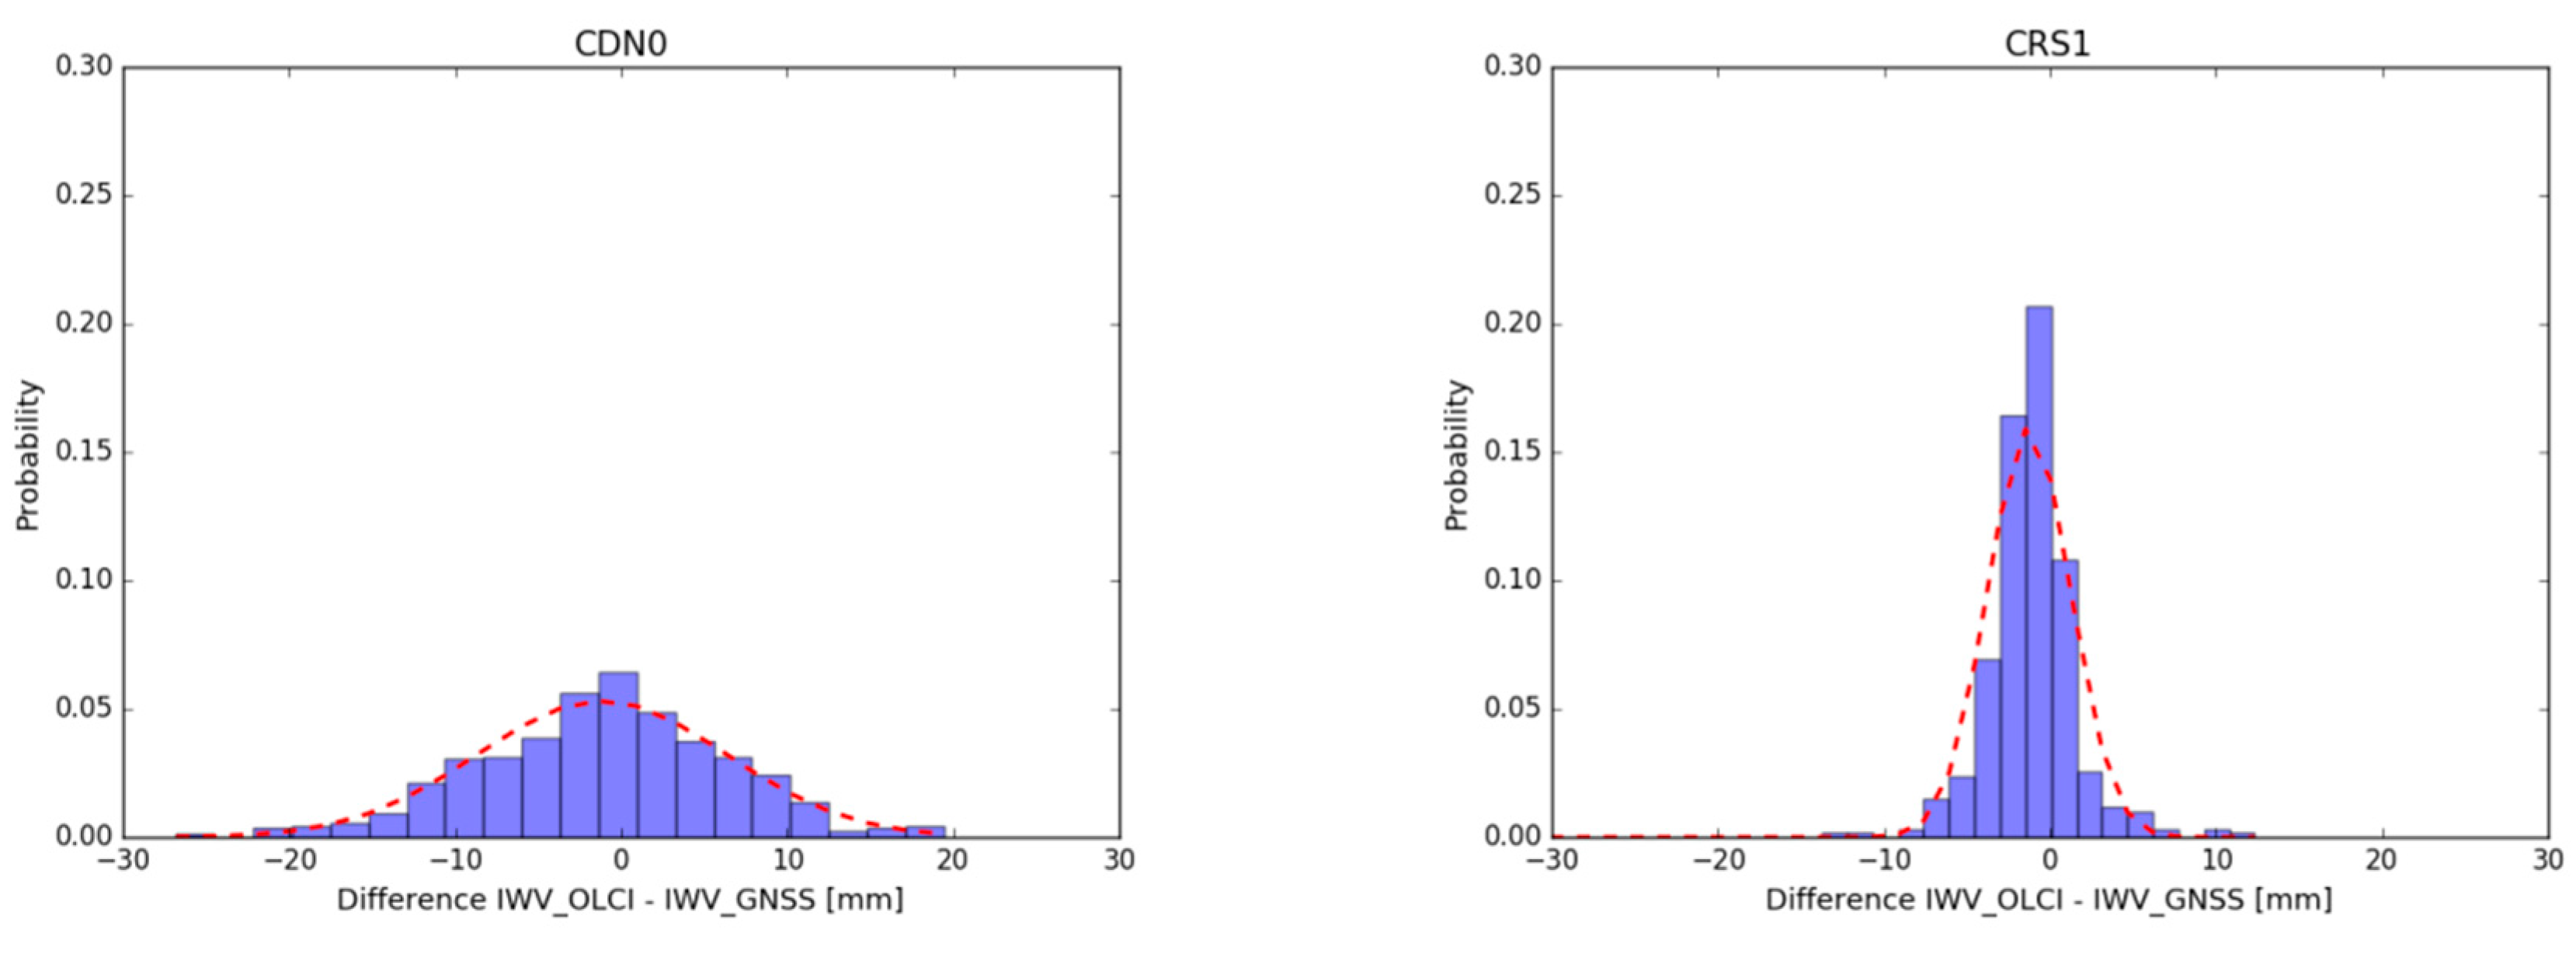
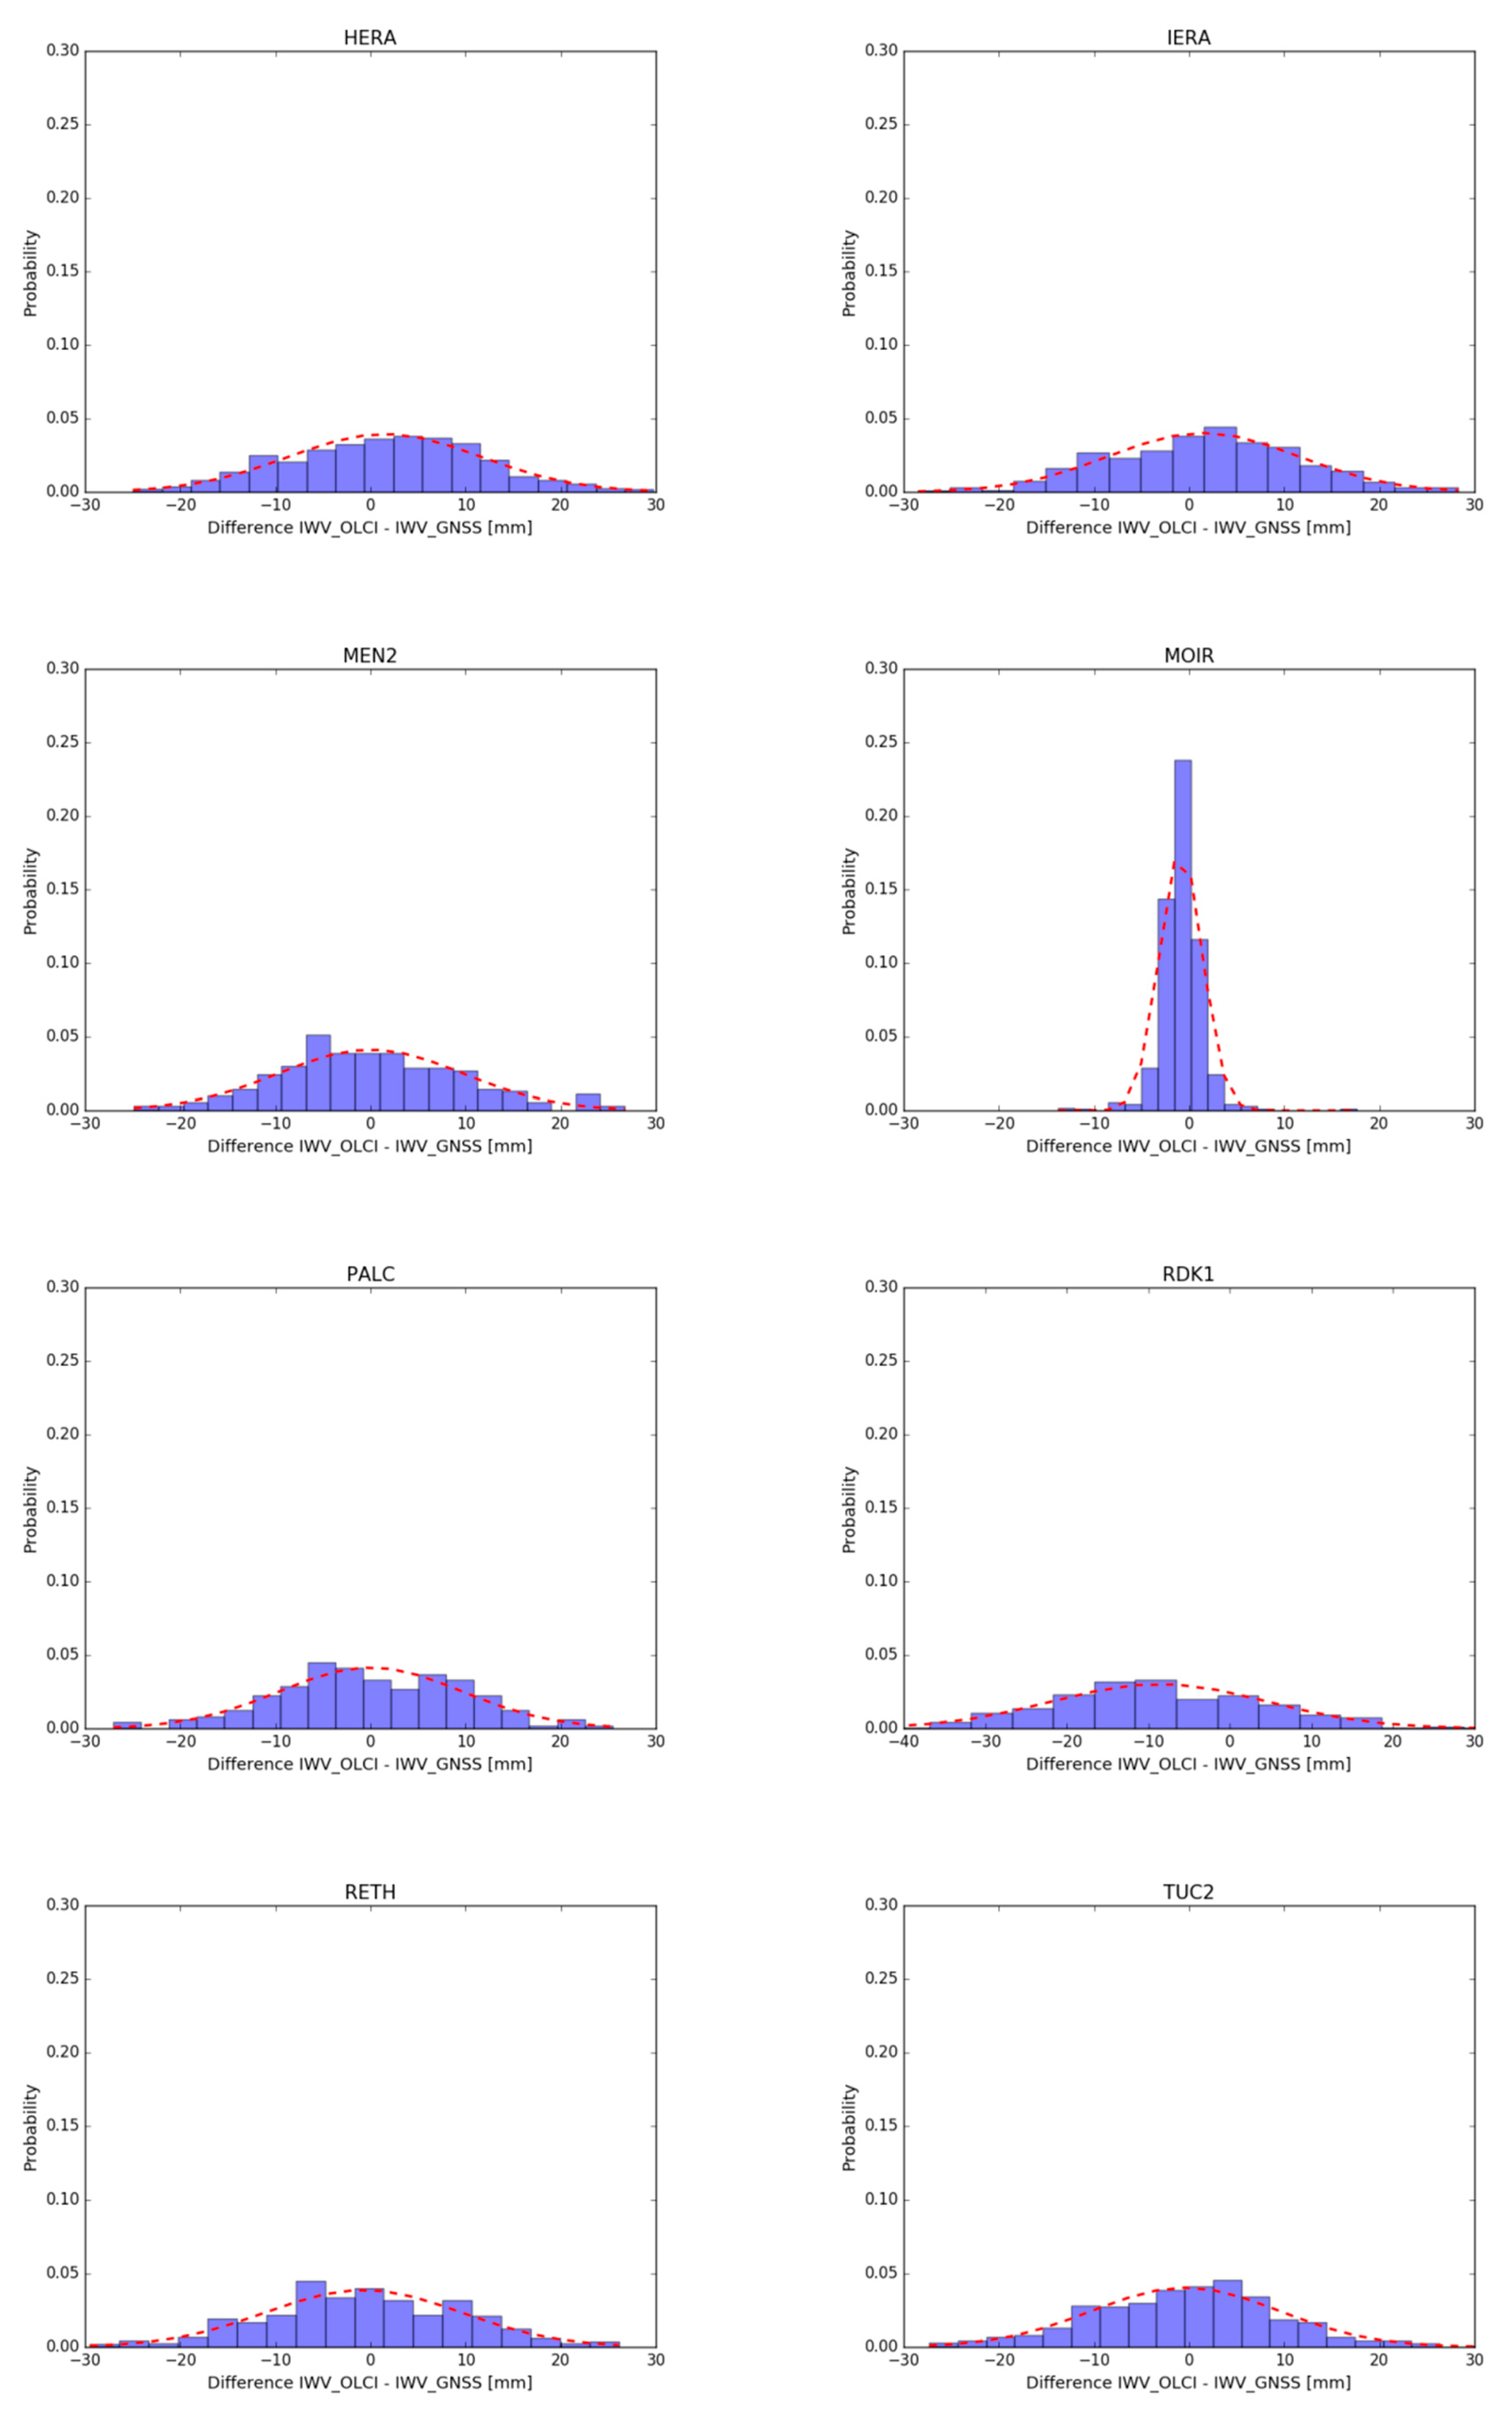
The differences of IWV values per GNSS station, as measured by OLCI and derived by GNSS stations using the “single point” approach have been calculated and used for the OLCI validation. Figure 6 presents the histograms of these differences for Sentinel-3A. Differences of IWV values have also been obtained using the “area-of-influence” approach.
At this preliminary stage of analysis, histograms have been created to help us examine the shape of the statistical distribution of these differences. The shape of the histograms seems to follow approximately normal distribution, although measurements of physical variables, such as IWV, are not expected to give an ideal “bell-like” shape.
The “single point” approach could not be implemented at the RDK1 site, as the corresponding IWV error in the OLCI image pixel was high (>25 mm, whereas the expected IWV error is about 1–2 mm). This occurred because the pixel is flagged as “WATER”, implying that the OLCI IWV retrieval algorithm considers that over a water surface. The RDK1 proximity to the sea seems to be irrelevant for this outcome as other coastal stations (i.e., CRS1, PALC) are properly flagged as land surfaces, thus allowing the OLCI algorithms to operate well over these stations (Figure 7).
Table 3 shows some statistical results for the determined differences of IWV in Sentinel-3A using both the “single point” and the “area-of-influence” approaches. The mean of the differences for the OLCI minus GNSS values for all validation sites lie within the range of −1.09 to +1.94 mm for the “single point” and −1.59 to +2.31 mm for the “area of influence” approach. The mean bias of Sentinel-3A OLCI IWV is calculated to be +0.57 mm ± 4.02 mm and −0.23 mm ± 3.16 mm under the “single point” and “area of influence” approaches, respectively. It can be seen that these different approaches have generated similar results for Sentinel-3 bias determination. The magnitude of this bias lies within the specification of the OLCI instrument, as well as within the accuracy of the IWV determination using GNSS processing.
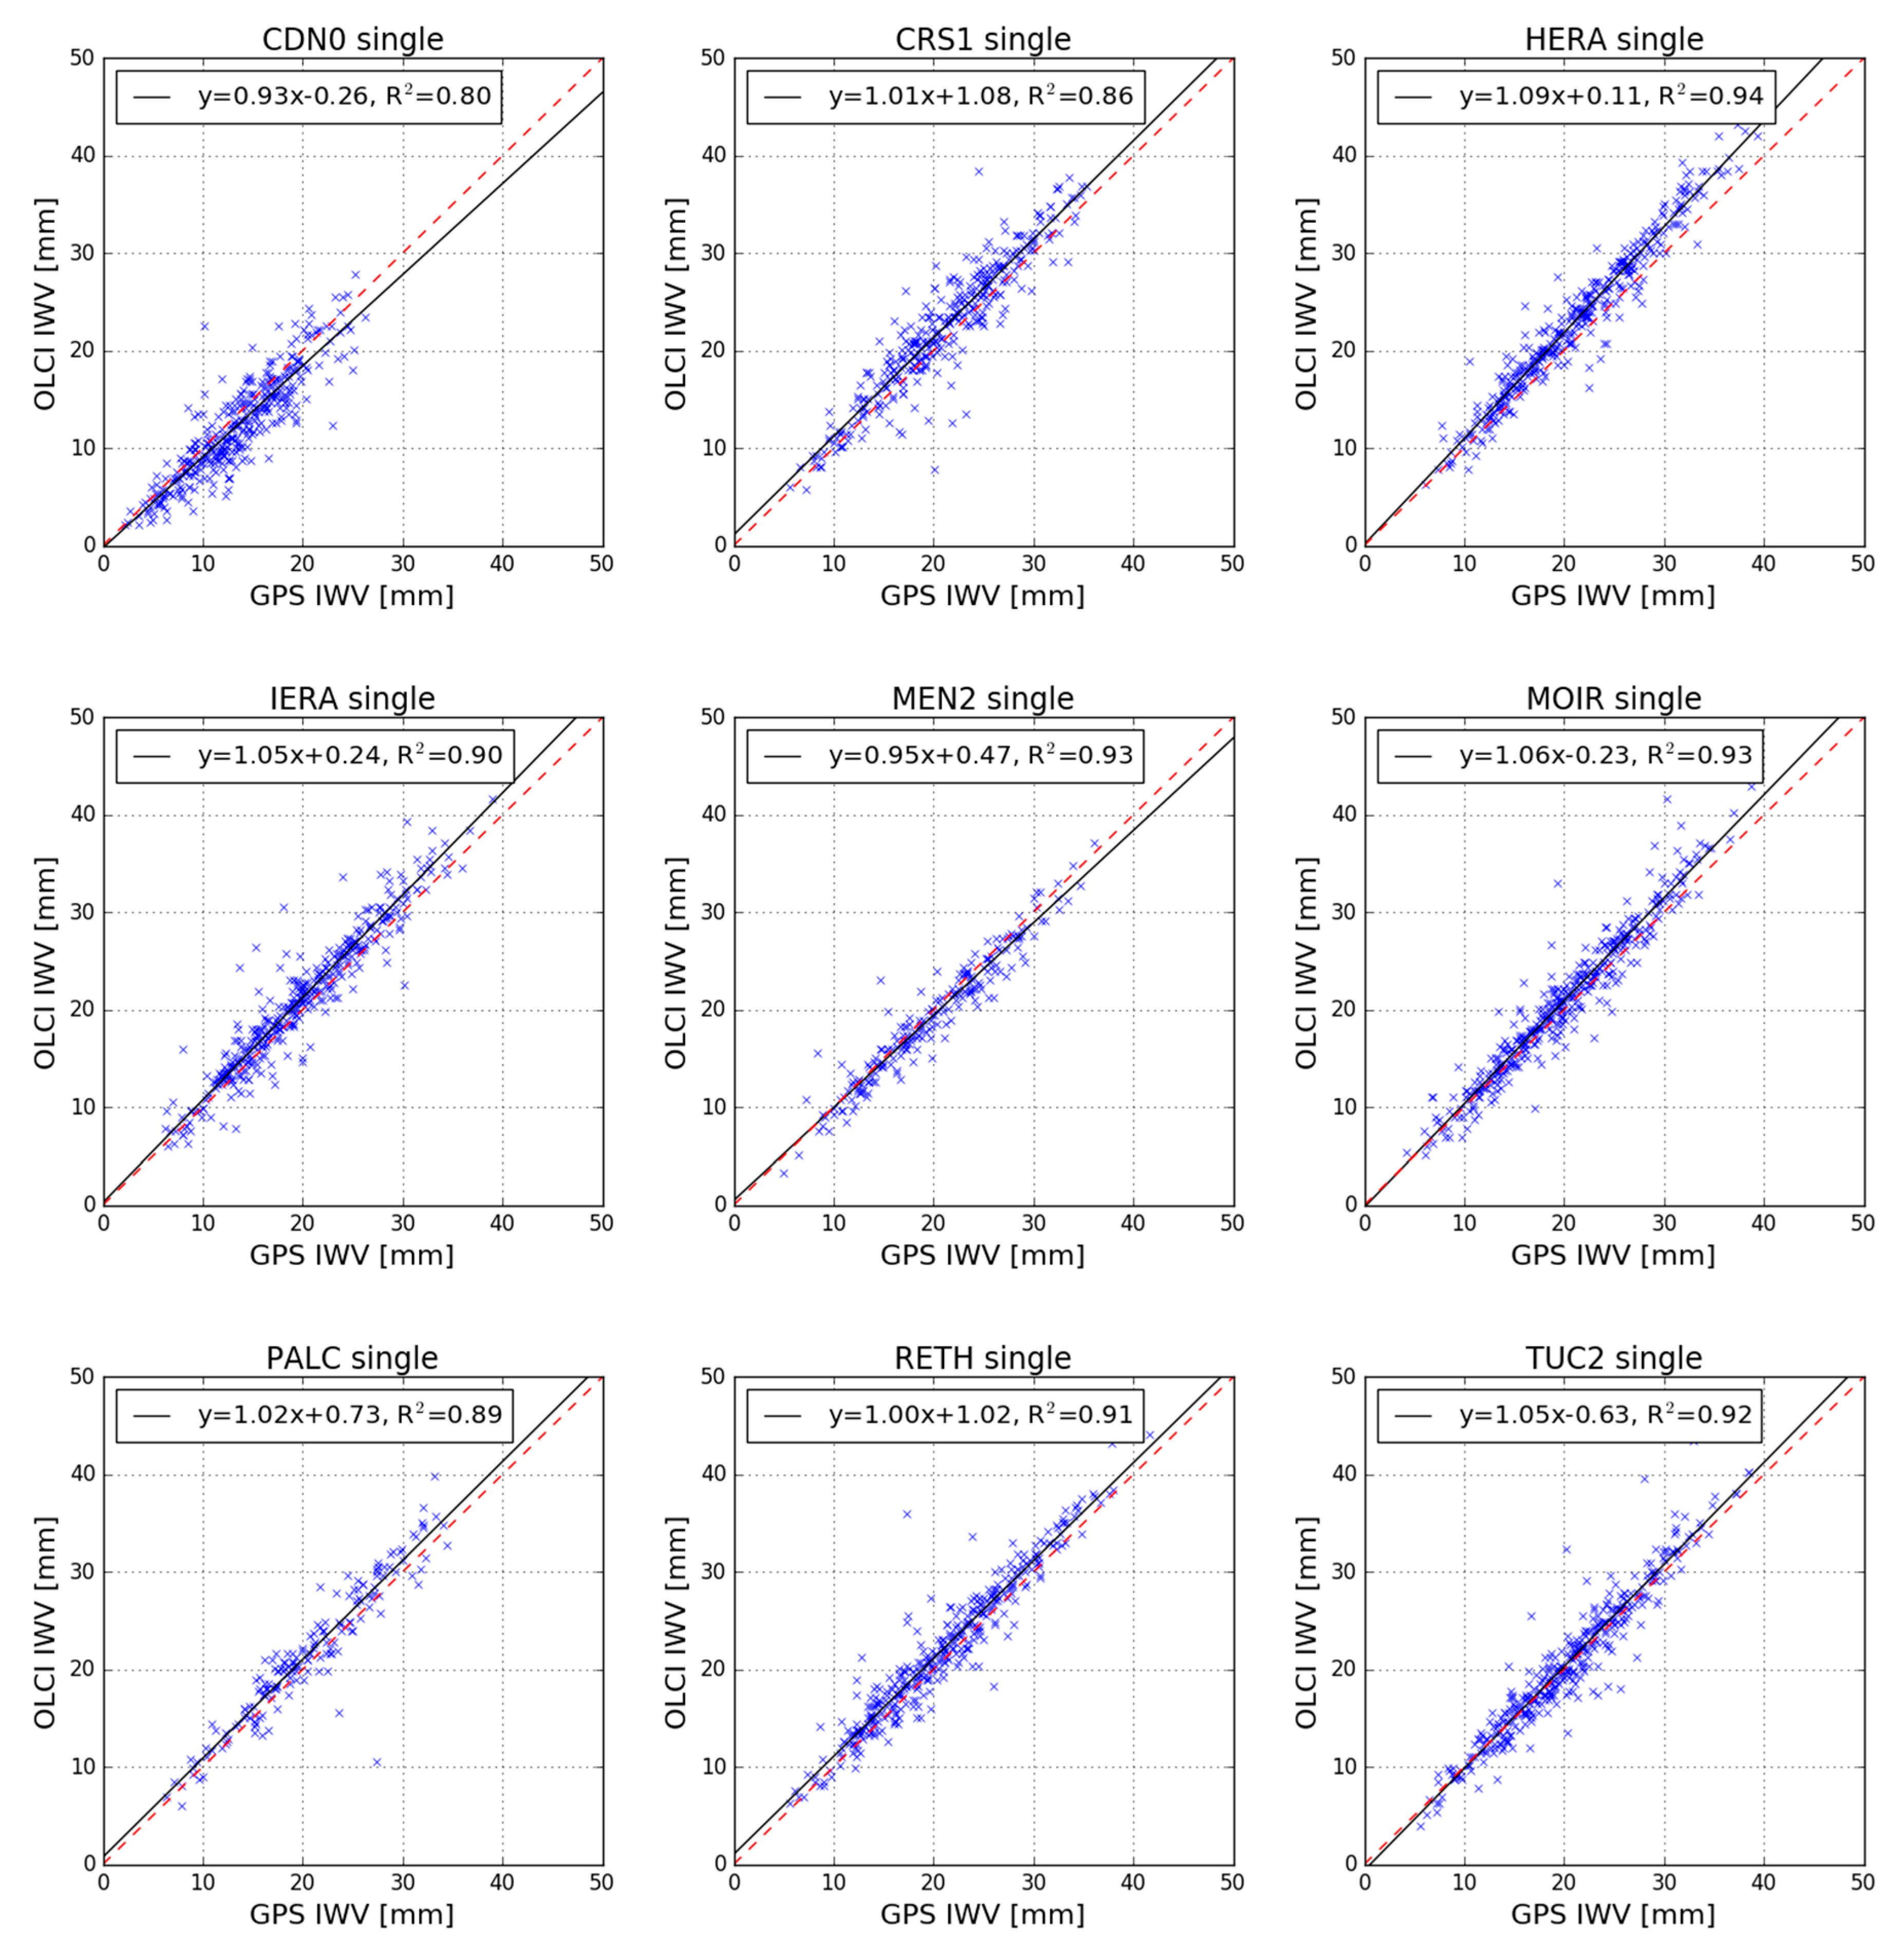
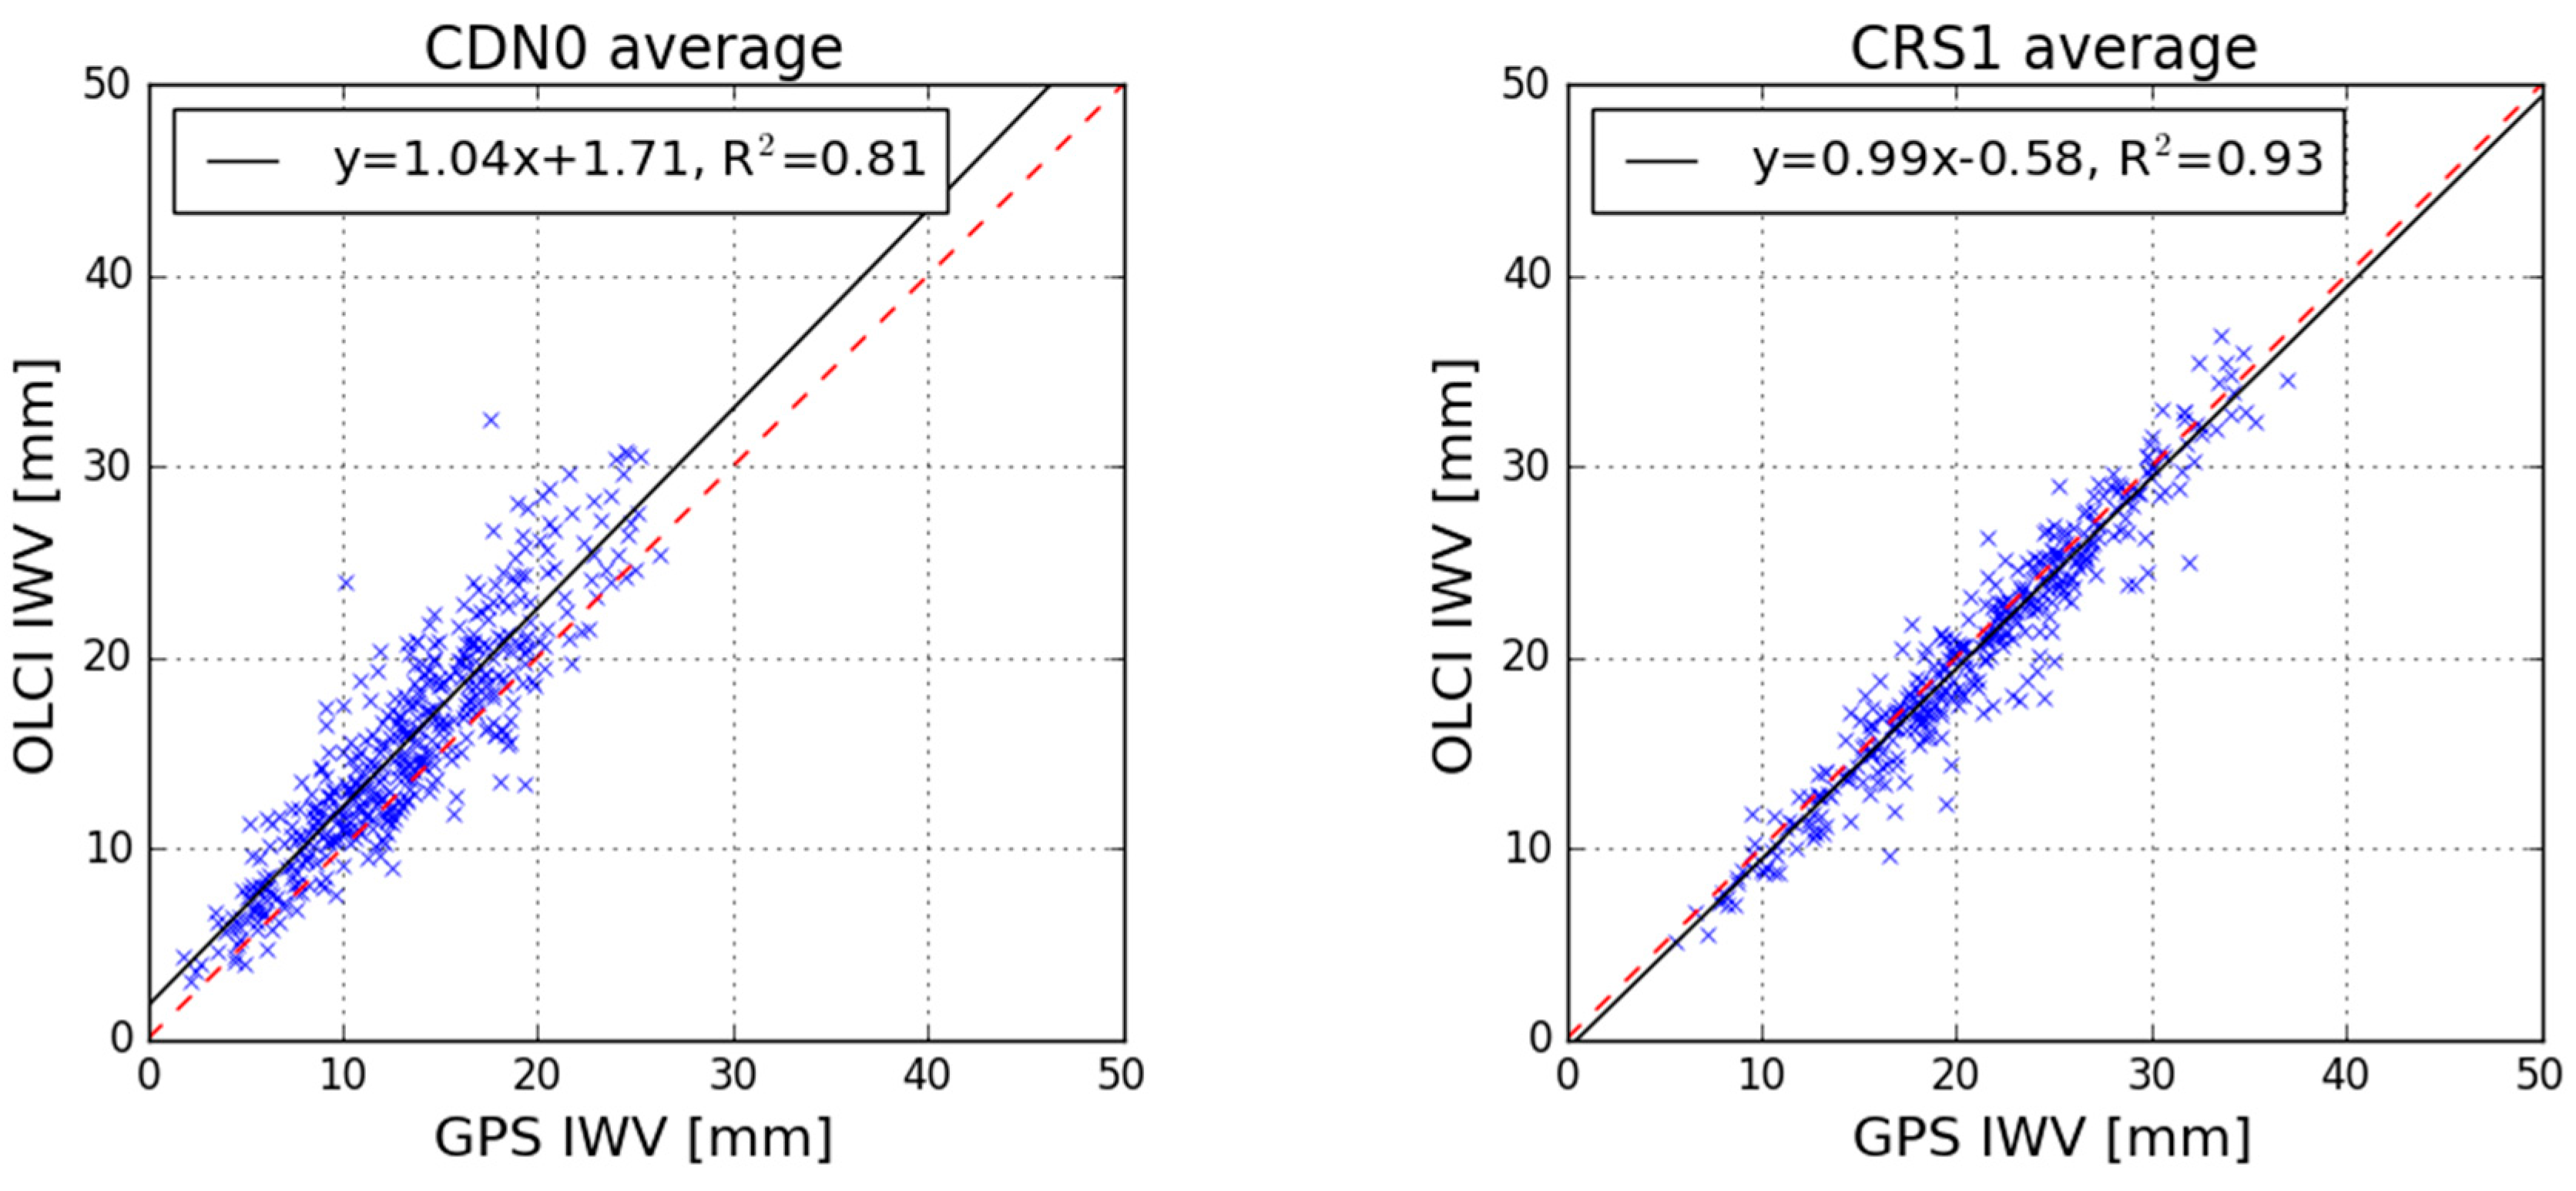
In order to investigate the existence of a correlation between the two independent techniques for the IWV estimation (OLCI and GNSS), scatterplots of Sentinel-3A OLCI and the GNSS-derived IWV values have been created for both the “single point” and “area of influence” approaches. For illustration purposes only, the “area of influence” scatterplots are shown in Figure 8. The “single point” scatterplots are given in Figure A1 in Appendix A. These figures also present a line fitted with regression on the results for each station.
Only OLCI pixels flagged as “LAND “are used to calculate the average IWV value per OLCI image. Furthermore, it has been observed that the vast majority of IWV error of valid OLCI pixels range between 0.3–2.0 mm. Pixels with IWV error larger than 2.0 mm have been excluded for the remaining analysis. The offset and trend of the linear regression lines for both OLCI retrieval approaches are presented in Table 4. The Pearson linear correlation coefficient and its significance value (p value) is also given. It seems that significant (p-value less than the strict arbitrary significance level of 0.003) strong (Pearson coefficient >0.80) correlation between the two datasets exists.
A similar validation analysis has been carried out for the Sentinel-3B OLCI IWV values. The Sentinel-3B dataset is smaller compared to Sentinel-3A, as only one year of Sentinel-3B have been available for this work because the satellite reached its nominal orbit in late 2018.
Table 5 presents the statistical analysis of the differences between the Sentinel-3B OLCI IWV measurements and the IWV values derived from GNSS observations. The mean bias for Sentinel-3B OLCI is +1.07 mm ± 4.80 mm using the “single point” approach and +0.24 mm ± 3.93 mm under the “area of influence” approach.
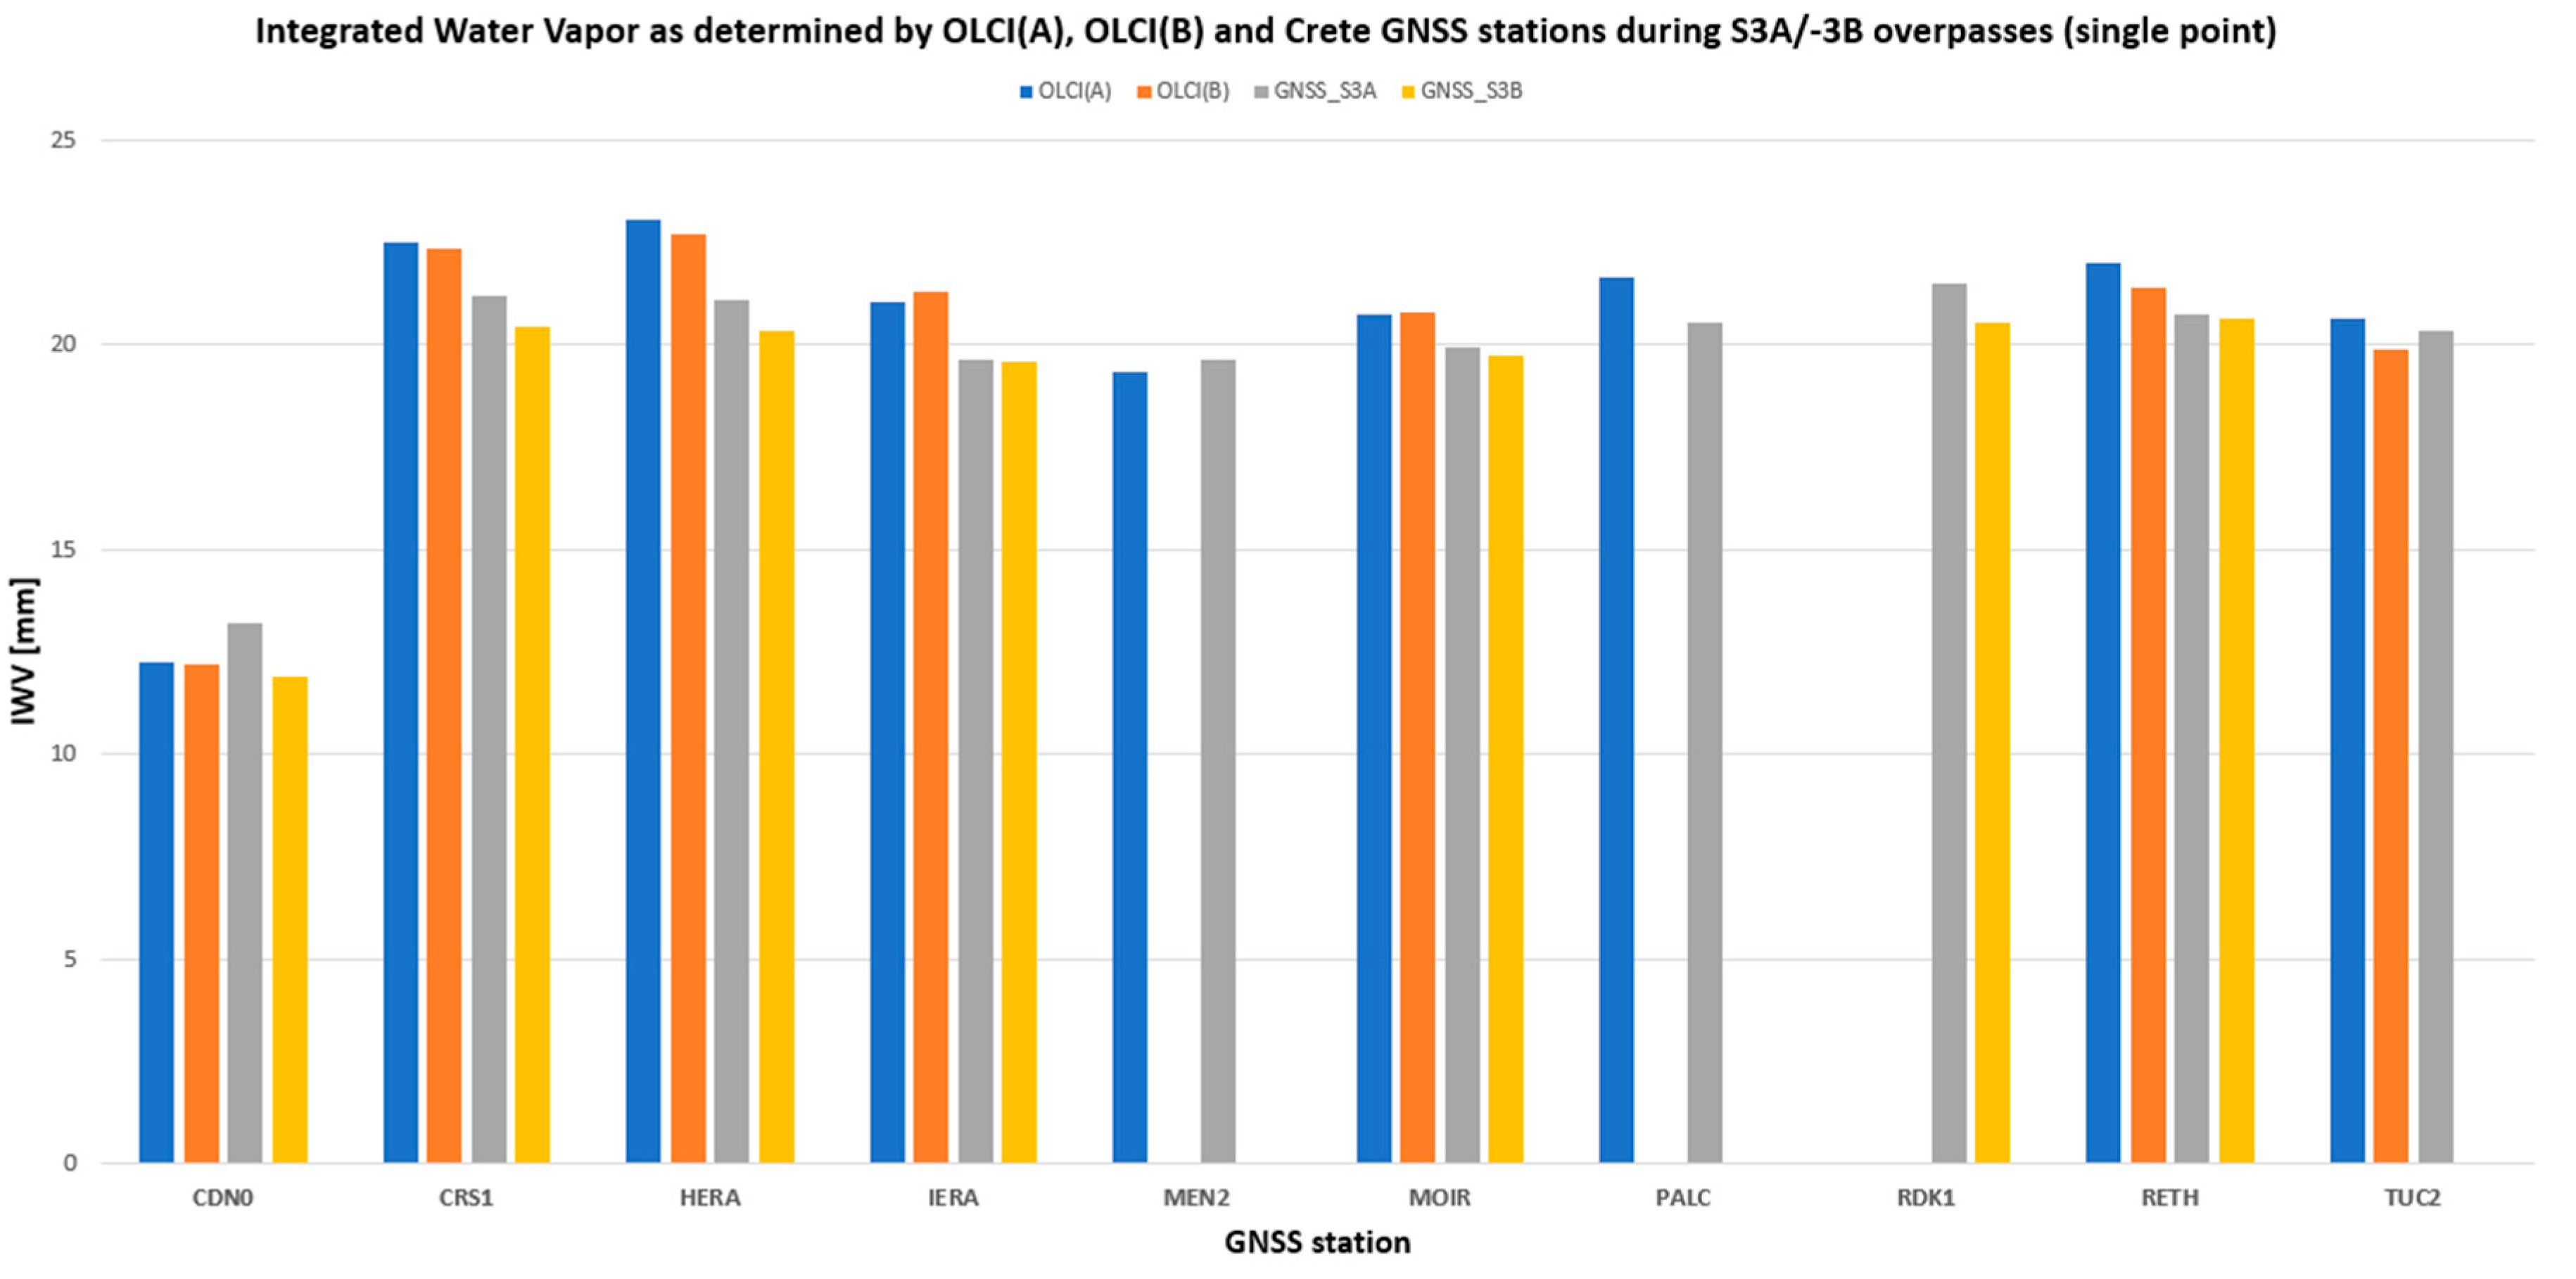
Figure 9 provides a graphical representation of the mean IWV values of OLCI(A) and OLCI(B) instruments per validation site and per OLCI retrieval approach along with the corresponding GNSS-derived IWV measurements. It can be clearly concluded that each independent technique (OLCI and GSNS processing) produces consistent results per validation site. Their difference is also, in most of the cases, similar although differentiation of the magnitude of the OLCI(A/B) absolute bias (−0.57 mm for OLCI(A) versus +2.42 mm for OLCI(B)) may be attributed to the different lengths of the available datasets.
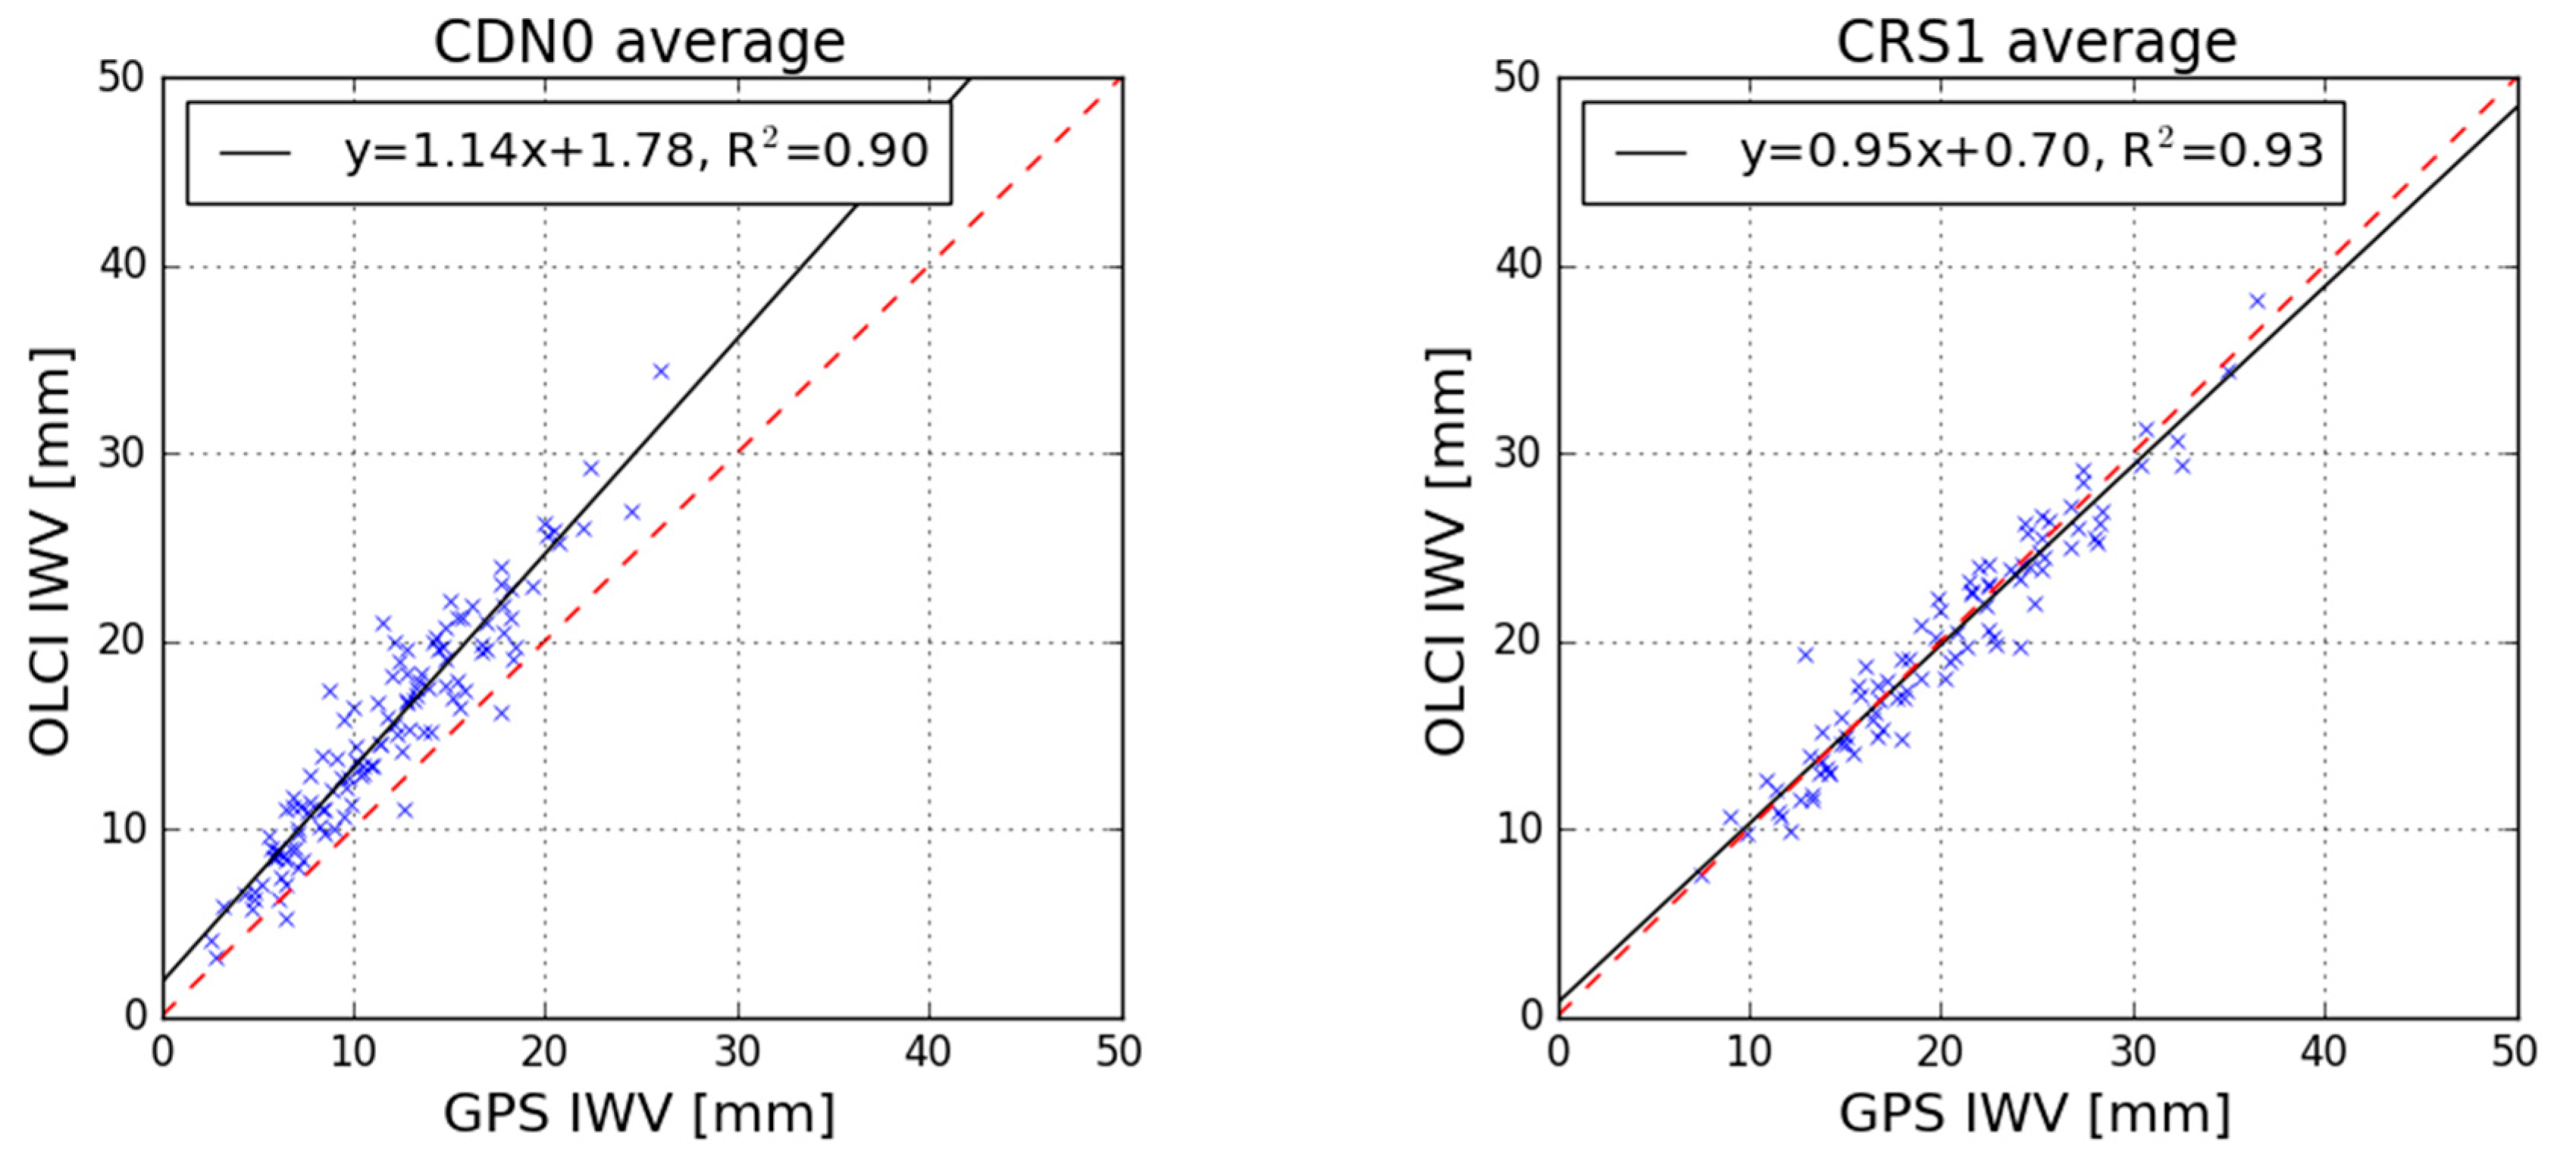
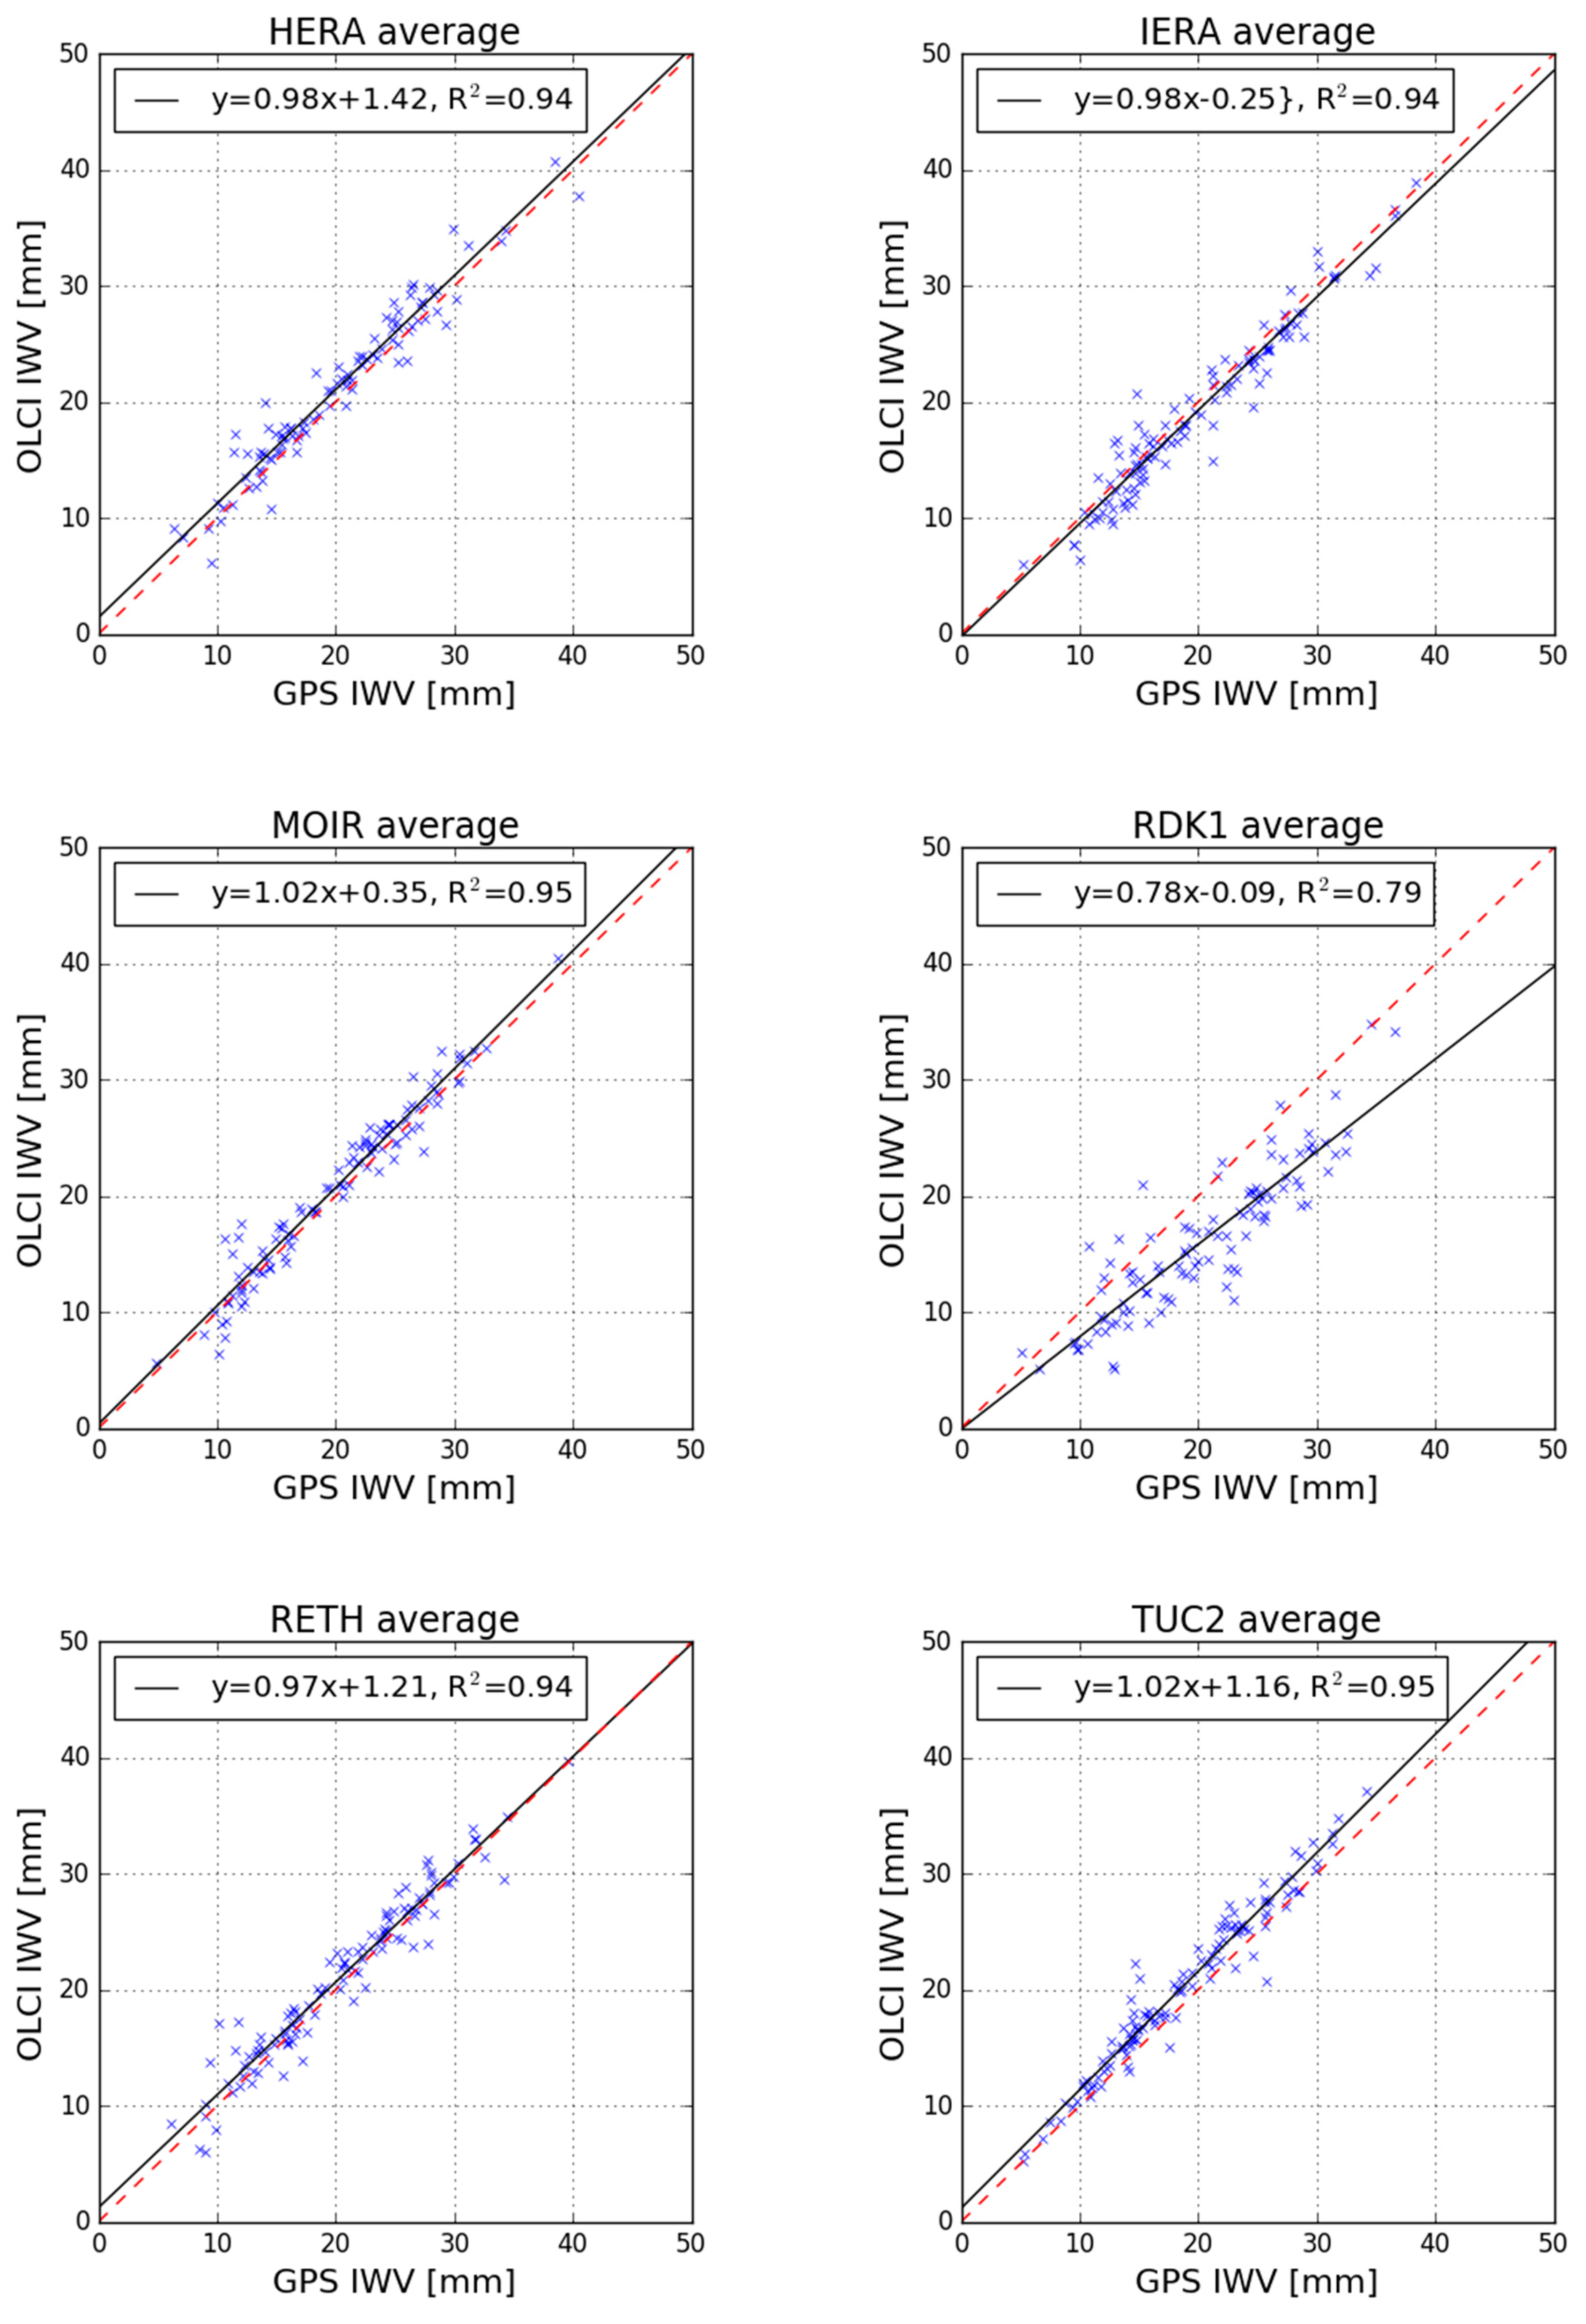
Figure 10 presents the scatterplots of Sentinel-3B OLCI IWV values against the GNSS observations per validation site. A near-perfect linear correlation between OLCI-B and GNSS IWV values is clearly visible from these scatterplots. Only the “area of influence” OLCI IWV values are presented as similar results exist for the “single point” approach. Table 6 provides the correlation between Sentinel-3B and GNSS IWV values.
The main conclusions of this first assessment for the integrated water values of the OLCI instrument in Sentinel-3A/-3B and with respect to GNSS-derived values from a Crete network, are:
  • The mean bias of OLCI(A) is determined as +0.57 mm and −0.23 mm implementing the “single point” and the “area of influence” approach respectively and using data covering a 4-year operational period;
  • The mean bias of OLCI(B) is determined as +1.07 mm and +0.24 mm implementing the “single point” and the “area of influence” approach respectively, over a one-year period of validation data;
  • The magnitude of OLCI(A) and OLCI(B) bias is within the operational capabilities of the satellite instrument but also the accuracy of GNSS-derived IWV values that have been used as reference in this study;
  • The OLCI and GNSS IWV values are significantly correlated irrespectively of validation sites and approach used.

3.2. Relative Bias of Sentinel-3 OLCI IWV Products

The relative bias between Sentinel-3A and Sentinel-3B can be estimated over simultaneous measurements made by both satellites and over the same target area on the ground. More specifically, the available dataset for Sentinel-3A, Sentinel-3B has been investigated to identify specific times at which the two OLCI instruments observe Crete GNSS sites together. Besides the simultaneity date, other criteria have been taken into consideration: (1) both OLCI(A) and OLCI(B) should produce valid IWV measurements, and (2) GNSS observations are available for both satellite overpasses. These criteria for concurrent OLCI(A) and OLCI(B) measurements have been met thirty-two times over the Crete GNSS reference stations.
In these cases, Sentinel-3A OLCI imagery has been captured at 08:12 UTC, while Sentinel-3B at 08:51 UTC. To compensate for any variation taken place in between these 39 min in the wet troposphere, the GNSS delays have been examined at the two specific times of satellite passes. The difference between the two GNSS-derived delays has been used to adjust the IWV value of OLCI(B) at 08:51 UTC, as if it had been measured at the same time of Sentinel-3A (08:12 UTC) (pseudo-simultaneity). Then, the value of OLCI(B) minus OLCI(A) has been reported as the relative bias in the integrated water vapor.
Following the analysis of this rather small sample of IWV values, the relative bias is estimated to be of the order of +3 mm. In other words, when compared to OLCI(A), the OLCI(B) overestimates integrated water vapor by +3 mm. Nonetheless, the derived results are based on a small sample and cannot be completely statistically significant.

4. Discussion

This work attempts to validate the integrated water vapor observed by OLCI in Sentinel-3 against GNSS measurements conducted through a permanent network. This is the first time that a regional GNSS network is implemented to provide an independent IWV source for assessing the OLCI performance. In order to cross examine the validation results previously presented, the official OLCI performance report as published by the Sentinel-3 Mission Performance Center (S3MPC) [41] has been considered.
The OLCI versus GNSS comparison at the S3MPC is carried out using the SUOMI-NET GNSS network operating mainly in North and Central America [41]. In the latest S3MPC report, the bias for OLCI(A) and OLCI(B) is reported as +1.24 and +1.02 mm, respectively. This S3MPC corresponds to Cycles 56 and 37 of Sentinel-3A and Sentinel-3B covering approximately the same period as the one implemented in the present investigation. Thus, it is possible to directly compare these S3MPC values for the OLCI(A) and OLCI(B) against those provided here, using the regional GNSS network in Crete (Table 7). The difference of the two processing and analysis strategies is 0.78 to 1.47 mm, and is within the reported uncertainties.
The S3MPC also reports an overestimation of the OLCI-derived IWV by about 11–12% with respect to the SUOMI-NET GNSS network. The present Table 3 and Table 5 result in an overestimation of less than 10% over the specific geographical area. Finally, the S3MPC conclusion that both instruments of OLCI(A) and OLCI(B) present an equal behavior [41], is in agreement with the qualitative interpretation of Figure 7.
Further to the comparison of this study results with the S3MPC quality assessment, there are also some key findings that need to be described:
  • The OLCI pixel that contains the RDK1 station is flagged as “WATER”. Thus, it is expected that the OLCI IWV retrieval algorithm will not perform well at this location. Even though implementation of the “area of influence” approach resolved this problem and made it possible to obtain valid OLCI IWV values in the vicinity of the RDK1 station, the RDK1 site presents the largest deviation among all examined GNSS stations. A few explanations for this deviation are possible: The geometry of the GPS satellites is worse (weak) compared to other GNSS sites, as high mountains in the North (see Figure 7) block the signal reception from satellites in that direction. This may be resolved if a multi-constellation (i.e., GPS, GLONASS and Galileo) receiver is operated at this location. Another possible explanation is the absence of in-situ meteorological sensor. That entails that the applied VMF1 model does not perform well in the RDK1 area and cannot sense the particularities that the specific geomorphology causes to the water vapor.
  • Two alternative techniques have been employed to determine the OLCI IWV value at a GNSS station location. Through the “area of influence” approach, it was possible to derive valid OLCI IWV values, even when the single OLCI pixel nearest to the GNSS station produced invalid IWV values. This is a valuable outcome when monitoring the OLCI IWV performance in coastal regions. The results presented in Table 3 and Table 5 cannot help us arrive at a definite conclusion on the performance of each approach. In the cases of CDN0 and TUC2 (land only stations), the “area of influence” approach produces largest IWV values than the “single point” approach. The opposite stands true for the rest of the GNSS stations. The difference between the IWV values is within ±3 mm by these two approaches.
  • At present, there is no “golden rule” for defining a representative size for the area of influence in the IWV value. The actual size of the “area of influence” varies both spatially and temporally and depends on local conditions. In this work, we have chosen to use an area of 9.3 km2, which is close to the size of 10 km2 applied in [41]. This size of 9.3 km2 has been selected in our case to compare both results directly from the two studies. Nevertheless, a more detailed and independent investigation on the effective area of influence of GNSS water vapor products is needed to be carried out in the future.
  • The number of validation points to be used for the comparison analysis affects the reliability and the conclusions drawn out of a statistical analysis. Even though the results presented in this study are statistically significant (good p-value, adequate number of sampling points), a compromise to the quality of the IWV values may have been made. For example, when the “area of influence” approach was employed, the percentage of valid pixels within each window of the OLCI image has not been taken into consideration. This was made intentionally to enlarge the number of valid OLCI-GNSS sampling points for validation. Using stricter criteria (i.e., exclude an OLCI image window if it has less than 50% of its pixels flagged as “LAND”, within the area of influence) would significantly reduce the number of validation points. Note that the global analysis carried out in [41] used only 5% of the total available products for their validation.
  • The continuous operation of the GNSS stations is a vital requirement for carrying out an effective validation. Because it has to be ensured that whenever a valid OLCI image is captured, there will be always ground measurements available to compare. In some cases, improper operation of GNSS stations limited comparison affecting the total number of validation points. Also, collocation of the GNSS stations with meteorological stations reduces the possibility of reverting to global models for the estimation of the atmospheric pressure.

5. Conclusions

This work presented for the first time an external validation of the integrated water vapor products of the OLCI instrument in Sentinel-3 against GNSS-derived results obtained by a regional GNSS network in Crete, Greece. The selection of the island of Crete has been made for three main reasons: It hosts a network of permanent facilities that support calibration and validation of satellite altimeters, such as, and not only, the SRAL instrument of Sentinel-3A and Sentinel-3B. Thus, this work promotes the synergy between instruments operating at the same satellite platform, as for the first time the same ground infrastructure is used for the calibration and validation of the microwave (altimeter) as well as the optical observations of Sentinel-3. The second reason is that Crete is covered by a relatively dense network of GNSS stations, continuously operating and for a long time (some more than 20 years) making it possible to calibrate the same OLCI image with several GNSS stations. The third reason is that several of these GNSS stations operate next to the sea, making them ideal for evaluating the performance of OLCI IWV retrieval algorithm in the sea-land boundary. This is a first attempt to estimate the absolute and relative bias of the Sentinel-3 OLCI instrument integrated water vapor measurements. It seems that the uncertainty of the produced IWV values is within OLCI specifications.
In summary, the absolute bias of OLCI(A) in integrated water vapor is closer to zero than that of the OLCI(B) [−0.57 mm for OLCI(A) versus +2.42 for OLCI(B)], but both are highly correlated with GNSS. This may be attributed to the relatively small dataset particularly for Sentinel-3B.
Furthermore, there is a need for accurate determination of the hydrostatic delays at the GNSS stations and the execution of an uncertainty budget analysis for GNSS-derived IWV values. This is a requirement posed by the FRM strategy for ground measurements involved in the calibration and validation of Copernicus satellite missions’ products. The work presented in [27] constitutes a good starting point for such an uncertainty analysis. Also, the GNSS processing may be carried out using precise point positioning, which provides better temporal resolution of the wet tropospheric delays.
Future plans include continuation of OLCI-sensed IWV validation against the regional GNSS network including also images which capture part of Crete island, utilization of alternative water vapor estimation sources such as measurements obtained by the microwave radiometer that is collocated with the CDN0 GNSS station at the permanent facility for altimetry calibration and/or numerical weather models, and the comparison against Sentinel-2 water vapor products [41].

Author Contributions

Conceptualization, A.T.; Data curation, G.P.; Formal analysis, A.T.; Funding acquisition, S.M. and P.P.; Methodology, S.M., P.P. and A.T.; Resources, G.P. and X.F.; Software, C.K., G.P. and X.F.; Supervision, S.M. and P.P.; Validation, A.T. and C.K.; Visualization, C.K.; Writing—original draft, A.T.; Writing—review & editing, S.M. and P.P. All authors have read and agreed to the published version of the manuscript.

Funding

This research was partially funded by European Union and the European Space Agency grant number [4000129892/20/NL/FF/ab], and the APC was funded by the Region of Crete grant with title Crete-GIS: Design, Development, Operation and Maintenance of a Geographical Information System for Region of Crete.

Acknowledgments

The authors thank the METRICA S.A. for the provision of the Full GNSS data from HxGN SmartNet stations operating in Crete, Greece.

Conflicts of Interest

The authors declare no conflict of interest.

Appendix A

Table A1. The regional Crete GNSS site coordinates and velocities (ITRF 2014) at epoch 2013.5.
SiteLat (Deg)Long (Deg)Ell.Height
(m)
VN
(m/yr)
VE
(m/yr)
VU
(m/yr)
Time Span (Years)
CDN0N 35°20′16.02”E 23°46′46.85”1049.518−0.01260.0075+0.00042014.49–2019.99
CRS1N 35°18′12.64”E 23°31′17.26”21.207−0.01220.0067−0.00072008.18–2019.99
HERAN 35°19′26.85”E 25°08′29.41”90.783−0.01380.0072−0.00122010.36–2019.99
IERAN 35°03′11.04”E 25°47′50.03”132.843−0.01430.0073−0.00082010.49–2019.99
MEN2N 35°40′12.89”E 23°44′26.30”265.707−0.01410.0060−0.00052013.25–2019.25
MOIRN 35°03′14.21”E 24°52′39.90”135.505−0.01380.0072−0.00232012.78–2019.93
PALCN 35°14′21.77”E 23°38′26.51”73.022−0.01200.0070+0.00132012.78–2019.14
RDK1N 35°11′15.37”E 24°19′06.53”25.533−0.01270.0079+0.00082009.17–2019.99
RETHN 35°23′15.92”E 24°36′47.08”85.569−0.01340.0074−0.00052010.26–2019.22
TUC2N 35°31′59.48”E 24°04′14.01”160.889−0.01240.0071−0.00062004.47–2019.99
Figure A1. Scatterplots of simultaneous IWV measurements obtained by the Sentinel-3A OLCI instrument as derived by the “single point” approach and the GNSS station at the respective station location.
Remotesensing 12 02606 g0a1

References

  1. Bojinski, S.; Verstraete, M.; Peterson, T.C.; Richter, C.; Simmons, A.; Zemp, M. The concept of essential climate variables in support of climate research, applications, and policy. Bull. Am. Meteorol. Soc. 2014, 95, 1431–1443. [Google Scholar] [CrossRef]
  2. Bernardo, F.; Aires, F.; Prigent, C. Atmospheric water-vapour profiling from passive microwave sounders over ocean and land Part II: Validation using existing instruments. Q. J. R. Meteorol. Soc. 2013, 139, 865–878. [Google Scholar] [CrossRef] [Green Version]
  3. De Rosa, B.; Di Girolamo, P.; Summa, D. Temperature and water vapour measurements in the framework of the Network for the Detection of Atmospheric Composition Change (NDACC). Atmos. Meas. Tech. 2020, 13, 405–427. [Google Scholar] [CrossRef] [Green Version]
  4. Devasthale, A.; Sedlar, J.; Tjerström, M. Characteristics of water-vapour inversions observed over the Arctic by Atmospheric Infrared Sounder (AIRS) and radiosondes. Atmos. Chem. Phys. 2011, 11, 9813–9823. [Google Scholar] [CrossRef] [Green Version]
  5. Beaton, S.P.; Spowart, M. UV absortion hygrometer for fast-response airborne water vapor measurements. J. Atmos. Ocean. Technol. 2012, 29, 1295–1303. [Google Scholar] [CrossRef]
  6. He, J.; Liu, Z. Comparison of satellite-derived precipitable water vapor through near-infrared remote sensing channels. IEEE Trans. Geosci. Remote Sens. 2019, 57, 10252–10262. [Google Scholar] [CrossRef]
  7. Hoffmann, A.; Clifford, D.; Aulinas, J.; Carton, J.C.; Deconinck, F.; Esen, B.; Hüsing, J.; Kern, K.; Kox, S.; Krejci, D.; et al. A novel satellite mission concept for upper air water vapour, aerosol and cloud observations using integrated path differential absiortion LiDAR limb sounding. Remote Sens. 2012, 4, 867–910. [Google Scholar] [CrossRef] [Green Version]
  8. Elliot, W.P.; Smith, M.E.; Angell, J.K. Monitoring tropospheric water vapor changes using radiosonde data. Dev. Atmos. Sci. 1991, 19, 311–327. [Google Scholar] [CrossRef]
  9. Han, Y.; Snider, J.B.; Westwater, E.R.; Melfi, S.H.; Ferrare, R.A. Observations of water vapor by ground-based microwave radiometers and Raman lidar. J. Geophys. Res. 1994, 99, 18695–18702. [Google Scholar] [CrossRef]
  10. Zhang, H.; Yuan, Y.; Li, W.; Zhang, B. A real-time precipitable water vapor monitoring system using the national GNSS network of China: Method and preliminary results. IEEE J. Sel. Top. Appl. Earth Obs. Remote Sens. 2019, 12, 1587–1598. [Google Scholar] [CrossRef]
  11. Donlon, C.; Berruti, B.; Buongiorno, A.; Ferreira, M.H.; Féménias, P.; Frerick, J.; Goryl, P.; Klein, U.; Laur, H.; Mavrocordatos, C.; et al. The Global Monitoring for Environment and Security (GMES) Sentinel-3 mission. Remote Sens. Environ. 2012, 120, 37–57. [Google Scholar] [CrossRef]
  12. Fernandes, M.J.; Lázaro, C. Independent assessment of Sentinel-3A wet tropospheric correction over the open and coastal ocean. Remote Sens. 2018, 10, 484. [Google Scholar] [CrossRef] [Green Version]
  13. Mertikas, S.P.; Donlon, C.; Féménias, P.; Mavrocordatos, C.; Galanakis, D.; Tripolitsiotis, A.; Frantzis, X.; Tziavos, I.N.; Vergos, G.; Guinle, T. Fifteen Years of Cal/Val Service to Reference Altimetry Missions: Calibration of Satellite Altimetry at the Permanent Facilities in Gavdos and Crete, Greece. Remote Sens. 2018, 10, 1557. [Google Scholar] [CrossRef] [Green Version]
  14. Mertikas, S.P.; Donlon, C.; Vuilleumier, P.; Cullen, R.; Féménias, P.; Tripolitsiotis, A. An action plan towards fiducial reference measurements for altimetry. Remote Sens. 2019, 11, 1993. [Google Scholar] [CrossRef] [Green Version]
  15. Mertikas, S.P.; Donlon, C.; Féménias, P.; Mavrocordatos, C.; Galanakis, D.; Tripolitsiotis, A.; Frantzis, X.; Kokolakis, C.; Tziavos, I.N.; Vergos, G.; et al. Absolute calibration of the European Sentinel-3A surface topography mission over the permanent facility for altimetry calibration in west Crete, Greece. Remote Sens. 2018, 10, 1808. [Google Scholar] [CrossRef] [Green Version]
  16. Bevis, M.; Businger, S.; Chiswell, S.; Herring, T.A.; Anthes, R.A.; Rocken, C.; Ware, R.H. GPS Meteorology: Mapping zenith wet delays and precipitable water. J. Appl. Meteorol. 1994, 33. [Google Scholar] [CrossRef]
  17. Kacmarik, M.; Dousa, J.; Dick, G.; Zus, F.; Brenot, H.; Möller, G.; Pottiaux, E.; Kaplon, J.; Hordyniec, P.; Václavovic, P.; et al. Inter-technique validation of tropospheric slant total delays. Atmos. Meas. Tech. 2017, 10, 2183–2208. [Google Scholar] [CrossRef] [Green Version]
  18. Vaquero-Martinez, J.; Anton, M.; de Galisteo, J.P.O.; Cachorro, V.E.; Costa, M.J.; Roman, R.; Bennouna, Y.S. Validation of MODIS integrated water vapor product against reference GPS data at the Iberian Peninsula. Int. J. Appl. Earth Obs. Geoinf. 2017, 63, 214–221. [Google Scholar] [CrossRef] [Green Version]
  19. Pan, L.; Guo, F. Real-time tropospheric delay retrieval with GPS, GLONASS, Galileo and BDS data. Nat. Sci. Rep. 2018, 8, 17067. [Google Scholar] [CrossRef] [Green Version]
  20. Mertikas, S.; Tripolitsiotis, A.; Donlon, C.; Mavrocordatos, C.; Féménias, P.; Frantzis, X.; Kokolakis, C.; Guinle, T.; Vergos, G.; Tziavos, I.N.; et al. The ESA Permanent Facility for Altimetry Calibration: Monitoring performance of Radar Altimeters for Sentinel-3A, Sentinel-3B and Jason-3 using transponder and sea-surface calibration with FRM standards. Remote Sens. 2020. under review. [Google Scholar]
  21. Lamquin, N.; Clerc, S.; Bourg, L.; Donlon, C. OLCI A/B Tandem Phase Analysis, Part 1: Level 1 Homogenisation and Harmonisation. Remote Sens. 2020, 12, 1804. [Google Scholar] [CrossRef]
  22. Sentinel-3 CalVal Team. Technical Note: Sentinel-3 OLCI-B Spectral Response Functions from Pre-Flight Characterization; S3-TN-ESA-OL-660; European Space Research and Technology Centre, European Space Agency: Noordwijk, The Netherlands, 2016. [Google Scholar]
  23. Schläpfer, D.; Borel, C.C.; Keller, J.; Itten, K.I. Atmospheric pre-corrected differential absorption technique to retrieve columnar water vapor. Remote Sens. Environ. 1998, 65, 353–366. [Google Scholar] [CrossRef]
  24. Leinweber, R. Remote Sensing of Atmospheric Water Vapor over Land Areas Using MERIS Measurements and Application to Numerical Weather Prediction Model Validation. Ph.D. Thesis, Freien Universität Berlin, Berlin, Germany, 22 June 2010. [Google Scholar]
  25. Fischer, J. Retrieval of Total Water Vapour Content from OLCI Measurements. ATBD Water Vapour. Available online: https://earth.esa.int/documents/247904/349589/OLCI_L2_ATBD_Water_Vapour.pdf (accessed on 20 May 2020).
  26. Ning, T.; Wang, J.; Elgered, G.; Dick, G.; Wickert, J.; Bradke, M.; Sommer, M.; Querel, R.; Smale, D. The uncertainty of the atmospheric integrated water vapour estimated from GNSS observations. Atm. Meas. Tech. 2016, 9, 79–92. [Google Scholar] [CrossRef] [Green Version]
  27. Baldysz, Z.; Nykiel, G.; Figurski, M.; Araszkiewicz, A. Assessment of the impact of GNSS processing strategies on the long-term parameters of 20 years of IWV time series. Remote Sens. 2018, 10, 496. [Google Scholar] [CrossRef] [Green Version]
  28. Shangguan, M.; Heise, S.; Bender, M.; Dick, G.; Ramarschi, M.; Wickert, J. Validation of GPS atmospheric water vapor with WVR data in satellite tracking mode. Ann. Geophys. 2015, 33, 55–61. [Google Scholar] [CrossRef] [Green Version]
  29. Tserolas, V.; Mertikas, S.P.; Frantzis, X. The western Crete geodetic infrastructure: Long-range power-law correlations in GPS time series using Detrended Fluctuation Analysis. Adv. Space Res. 2013, 51, 1448–1467. [Google Scholar] [CrossRef]
  30. Herring, T.A.; King, R.W.; McClusky, S.C. GAMIT Reference Manual: GPS Analysis at MIT, Release 10.7; Massachusetts Institute of Technology: Cambridge, MA, USA, 2018; Available online: http://geoweb.mit.edu/gg/GAMIT_Ref,pdf (accessed on 10 September 2018).
  31. Altamimi, Z.; Rebischung, P.; Métivier, L.; Collilieux, X. ITRF2014: A new release of the International Terrestrial Reference Frame modeling nonlinear station motions. J. Geophys. Res. Solid Earth 2016, 121, 6109–6131. [Google Scholar] [CrossRef] [Green Version]
  32. Dong, D.; Fang, P.; Bock, Y.; Cheng, M.K.; Miyazaki, S. Anatomy of apparent seasonal variations from GPS-derived site position time series. J. Geophys. Res. Sold Earth 2002, 37. [Google Scholar] [CrossRef] [Green Version]
  33. IERS Conventions. 36 Frankfurt am Main: Verlag des Bundesamts für Kartographie und Geodäsie; Petit, G., Luzum, B., Eds.; IERS Technical Note; IERS: Frankfurt am Main, Germany, 2010; p. 179. ISBN 3-89888-989-6. Available online: https://www.iers.org/IERS/EN/Publications/TechnicalNotes/tn36.html (accessed on 11 September 2018).
  34. Lyard, F.; Lefevre, F.; Letellier, T.; Francis, O. Modelling the global ocean tides: Modern insights from FES2004. Ocean Dyn. 2006, 56, 394–415. [Google Scholar] [CrossRef]
  35. Saastamoinen, J. Contribution to the theory of atmospheric refraction. Bull. Geod. 1975, 105, 279–298. [Google Scholar] [CrossRef]
  36. Tregoning, P.; van Dam, T. Atmospheric pressure loading corrections applied to GPS data at the observation level. Geophys. Res. Lett. 2005, 32, L22310. [Google Scholar] [CrossRef] [Green Version]
  37. Boehm, J.; Werl, B.; Schuh, H. Troposphere mapping functions for GPS and very long baseline interferometry from European Centre for Medium-Range Weather Forecasts operational analysis data. J. Geophys. Res. 2006, 111, B02406. [Google Scholar] [CrossRef]
  38. Henken, C.C.; Dirks, L.; Steinke, S.; Diedrich, H.; August, T.; Crewell, S. Assessment of sampling effects on various satellite-derived integrated water vapor datasets using GPS measurements in Germany as reference. Remote Sens. 2020, 12, 1170. [Google Scholar] [CrossRef] [Green Version]
  39. Lindenbergh, R.; Keshin, M.; van der Marel, H.; Hansen, R. High resolution spatiotemporal water vapour mapping using GPS and MERIS observations. Int. J. Remote Sens. 2008, 29, 2393–2409. [Google Scholar] [CrossRef]
  40. Sentinel-3 Data Product Quality Reports. Available online: https://sentinels.copernicus.eu/documents/247904/4069162/Sentinel-3-MPC-ACR-OLCI-Cyclic-Report-056-037.pdf (accessed on 19 May 2020).
  41. Makarau, A.; Richter, R.; Schläpfer, D.; Reinartz, P. APDA Water Vapor Retrieval Validation for Sentinel-2 Imagery. IEEE Geosci. Remote Sens. Lett. 2017, 14, 227–231. [Google Scholar] [CrossRef] [Green Version]
Figure 1. The permanent network of continuously operating GNSS reference stations on the island of Crete, Greece in the centre of eastern Mediterranean (left). The CDN0, CRS1, MEN2, RDK1, and TUC2 GNSS sites are operated by the Technical University of Crete. The remaining GNSS reference stations are part of a private HxGN SmartNet RTK network of METRICA S.A. The Sentinel-3A OLC_2_LFR image captured on 7 May 2016 has been used as background in the right image of the network.
Remotesensing 12 02606 g001
Figure 2. The time series of the North, East, and Up components of the CDN0 GNSS coordinates. The reference frame implemented is ITRF2014.
Remotesensing 12 02606 g002
Figure 3. Scatterplots of the IWV (Precipitable Water) at the CDN0, CRS1 and TUC2 GNSS stations as determined using the VFM1 model (IWV_model) and in-situ measurements from meteorological sensors (IWV_meteo). It can be seen that the slope of the linear fit to the data is close to unity while its intercept is at the sub-mm level, with R2 > 0.92 at the worst case.
Remotesensing 12 02606 g003
Figure 4. The footprint of Sentinel-3B OLCI Pass No. 278 (upper) and No. 135 (lower image) contains the entire island of Crete and thus these have been chosen to be used in the present investigation.
Remotesensing 12 02606 g004
Figure 5. Graphical illustration of the two approaches implemented to derive the OLCI IWV value per image per GNSS station. The image above shows such an example for the Sentinel-3B OLCI image acquired on 21 June 2020 and the RDK1 GNSS station used for validation. In the “single-point” approach, the IWV value of the pixel which contains the GNSS station (RDK1 in image) is used. In the “area-of-influence” approach, the average IWV value of an OLCI window of 30 × 30 pixels is calculated to be compared against the GNSS-derived IWV.
Remotesensing 12 02606 g005
Figure 6. Histograms of the IWV value differences, represented by the Sentinel-3A OLCI minus the IWV as determined by GNSS in ten GNSS stations over Crete. The red dashed line refers to the theoretical normal distribution for the data set of differences in IWV.
Remotesensing 12 02606 g006aRemotesensing 12 02606 g006b
Figure 7. The OLCI image pixel corresponding to the coastal GNSS stations of RDK1 (left) and CRS1 (right) is flagged as “WATER” and “LAND” respectively. This introduces large errors in IWV determination at the RDK1 station thus they were excluded from further analysis when the “single point” approach was followed.
Remotesensing 12 02606 g007
Figure 8. Scatterplots of simultaneous IWV measurements obtained by the Sentinel-3A OLCI instrument as derived by the “area of influence” approach and the GNSS station at the respective station location.
Remotesensing 12 02606 g008aRemotesensing 12 02606 g008bRemotesensing 12 02606 g008c
Figure 9. The mean IWV values as determined by OLCI-A, OLCI-B and simultaneous GNSS measurements during Sentinel-3A and Sentinel-3B overpasses at the GNSS stations in Crete using the single point (up) and the area of influence (down) approaches.
Remotesensing 12 02606 g009aRemotesensing 12 02606 g009b
Figure 10. Scatterplots of simultaneous IWV measurements obtained by the Sentinel-3B OLCI instrument as derived by the “area of influence” approach and the GNSS station at the respective station location.
Remotesensing 12 02606 g010aRemotesensing 12 02606 g010b
Table 1. A typical example of the output of the custom script developed to determine the IWV values from OLCI imagery. Each row corresponds to the image pixel that contains each GNSS station. If the OLCI image is not-cloud free then the respective cell will be left empty. For each image, the IWV value and its error has been obtained for all twelve GNSS stations. Furthermore, the average of the IWV values of the nearest plus its neighboring pixels (30 × 30 pixels) are also determined and archived.
FileCycleRelative OrbitSensing Date, TimeImage XImage YIWV
[kg/m2]
IWV_Average
[kg/m2]
IWV Error
Name 1476/5/2016, 8:442030315715.75
Name476/5/2016, 8:442060307720.7019.550.90
1 S3A_OL_2_LFR_20160506T084220_20160506T084520_20180207T201740_0180_004_007_2340_ LR2_R_NT_002.SEN3.
Table 2. The OLCI imagery used in the present investigation. The “left-out” cycles refer to cycles where none of the ten pixels contains IWV valid measurements (Cloudy) for the GNSS stations.
Orbit No.Sentinel-3ASentinel-3B
Cycle No.Defective Cycle [Left out]Cycle No.Defective Cycle [Left out]
74-551721-3425, 26, 27, 28
214-552121-3424
644-55-21-3323, 24, 25
784-5512, 14, 16, 2324-3327
1214-5530, 38, 4121-3324, 31
1354-554, 12, 3722-3324
1784-5510, 4322-3323, 24
2354-553823-33-
2784-55-21-3324, 25
2923-551220-3325
3353-552721-33-
3493-551421-3324, 25, 26, 27
Table 3. The mean and standard deviation (SD) for the IWV values derived from Sentinel-3A OLCI using the “single point” (IWVsgl) and the “area-of-influence” (IWVavg) approaches, and from the GNSS, as well as for their differences at each GNSS station. All values are in [mm]. The overall mean and SD per IWV determination are given in bold.
SiteIWVsglIWVavg.IWVGNSSDiff. OLCI(sgl)-GNSSDiff. OLCI(avg)-GNSS
MeanSDMeanSDMeanSDMeanSDMeanSD
CDN0+12.27±5.25+15.47±5.93+13.22±5.10−1.09±2.43+2.31±2.63
CRS1+22.50±6.86+20.58±6.51+21.20±6.29+1.38 ±2.70−0.56±1.96
HERA+23.06±7.66+21.96±7.42+21.07±6.87+1.94+1.98+0.89±1.55
IERA+21.02±7.33+18.80±6.85+19.62±6.62+1.23±2.33 −0.82±1.79
MEN2+19.33±6.30+18.52±6.34+19.63±6.34−0.56±1.69−1.11±1.60
MOIR+20.72±7.38+20.46±7.14+19.92±6.72+0.91±2.01 +0.55±1.62
PALC+21.65±6.92+19.13±6.39+20.54±6.39+1.03+2.31−1.40±1.63
RDK1--+17.46±6.53+21.50±6.55--−4.05±2.69
RETH+21.98±7.20+21.77±7.17+20.75±6.81+1.09±2.14+1.02±1.59
TUC2+20.65±7.16+21.30±7.19+20.36±6.49+0.31±2.10 +0.94±1.85
Mean+20.35 mm+19.55 mm+19.78 mm
SD±3.23 mm±2.07 mm±2.39 mm
Table 4. Statistical analysis of the correlation between the Sentinel-3A OLCI and GNSS IWV values at the GNSS stations over the study area. The confidence level for regression analysis is 95% and in all cases the Pearson p-value (probability) is <0.003.
SiteOffset [mm]SlopeR2Pearson Coefficient
SingleAverageSingleAverageSingleAverageSingleAverage
CDN0−0.26+1.710.931.040.800.810.890.89
CRS11.08−0.581.010.990.860.930.930.96
HERA0.11−0.311.091.060.940.960.970.98
IERA0.24−0.791.050.990.900.930.950.96
MEN20.47−0.330.950.960.930.940.960.97
MOIR−0.23−0.141.061.030.930.950.960.97
PALC0.73−0.741.020.970.890.940.940.98
RDK1-−2.16-0.91-0.84-0.92
RETH1.020.481.001.030.910.950.960.98
TUC2−0.63−0.541.051.070.920.940.960.97
Table 5. The mean and standard deviation (SD) for the IWI derived from Sentinel-3B OLCI, and GNSS as well as for their differences at the GNSS stations. All values are in [mm]. The overall mean and SD per IWV determination approach are also given in bold.
SiteIWVsglIWVavg.IWVGNSSDiff. OLCI(sgl)-GNSSDiff. OLCI(avg)-GNSS
MeanSDMeanSDMeanSDMeanSDMeanSD
CDN0+12.20±5.44+15.18±5.95+11.90±4.91−0.30±1.64−3.46±2.05
CRS1+22.34±7.06+20.01±6.06+20.43±6.04−1.90 ±2.56+0.23±1.63
HERA+22.71±7.51+21.31±6.93+20.34±6.73−2.37±2.20−1.07±1.69
IERA+21.28±7.77+19.05±7.03+19.60±6.80+1.68±3.13+0.71±1.76
MEN2not estimated due to insufficient sample
MOIR+20.79±7.43+20.72±7.16+19.72±6.85−1.07±1.89 −0.74±1.60
PALCnot estimated due to insufficient sample
RDK1--+16.26±6.13+20.52±6.85--+4.27±3.13
RETH+21.40±6.84+21.26±6.89+20.65±6.74−0.75±1.83−0.65±1.72
TUC2+19.89±6.72+20.29±6.81+18,92±6.52−0.97±1.77 −1.57±1.53
Mean+20.09 mm+19.26 mm+19.02 mm
SD±3.60 mm±2.32 mm±3.17 mm
Table 6. Statistical analysis of the correlation between the Sentinel-3B OLCI and GNSS IWV values at the GNSS stations over the study area. The confidence level for regression analysis is 95% while in all cases the Pearson p-value is <0.003.
SiteOffset [mm]SlopeR2Pearson Coefficient
SingleAverageSingleAverageSingleAverageSingleAverage
CDN0−0.411.781.061.140.910.900.960.95
CRS10.020.701.090.950.870.930.940.96
HERA0.961.421.070.980.920.940.960.97
IERA0.75−0.251.050.980.840.940.910.97
MEN2not estimated due to insufficient sample
MOIR0.070.351.051.020.940.950.970.97
PALCnot estimated due to insufficient sample
RDK1-−0.09-0.78-0.79-0.89
RETH1.191.210.980.970.930.940.960.97
TUC21.091.160.991.020.930.950.960.97
Table 7. Bias of the OLCI(A) and OLCI(B) integrated water vapor measurements as determined in this investigation, using the regional Crete GNSS network and the S3MPC analysis based on the SUOMI-NET GNSS network.
SiteSentinel-3A
OLCI(A)
Sentinel-3B
OLCI(B)
Crete−0.23 mm+0.24 mm
S3MPC+1.24 mm+1.02 mm
Δ[Crete-S3MPC]1.47 mm0.78 mm