Article

A Comparison of Low-Cost Sensor Systems in Automatic Cloud-Based Indoor 3D Modeling

1
Department of Built Environment, School of Engineering, Aalto University, P. O. Box 14100, FI-00076 Aalto, Finland
2
Department of Remote Sensing and Photogrammetry, Finnish Geospatial Research Institute, Geodeetinrinne 2, FI-02430 Masala, Finland
*
Author to whom correspondence should be addressed.
Remote Sens. 2020, 12(16), 2624; https://doi.org/10.3390/rs12162624
Submission received: 1 July 2020 / Revised: 7 August 2020 / Accepted: 12 August 2020 / Published: 14 August 2020

Abstract

:
The automated 3D modeling of indoor spaces is a rapidly advancing field, in which recent developments have made the modeling process more accessible to consumers by lowering the cost of instruments and offering a highly automated service for 3D model creation. We compared the performance of three low-cost sensor systems; one RGB-D camera, one low-end terrestrial laser scanner (TLS), and one panoramic camera, using a cloud-based processing service to automatically create mesh models and point clouds, evaluating the accuracy of the results against a reference point cloud from a higher-end TLS. While adequately accurate results could be obtained with all three sensor systems, the TLS performed the best both in terms of reconstructing the overall room geometry and smaller details, with the panoramic camera clearly trailing the other systems and the RGB-D offering a middle ground in terms of both cost and quality. The results demonstrate the attractiveness of fully automatic cloud-based indoor 3D modeling for low-cost sensor systems, with the latter providing better model accuracy and completeness, and with all systems offering a rapid rate of data acquisition through an easy-to-use interface.

Graphical Abstract

1. Introduction

Indoor 3D modeling has a large number of uses, including the planning of construction [1], the preservation of cultural heritage [2,3], and providing a basis for a virtual reality applications [4]. While a model can of course be constructed manually, efficient measurement can be utilized for reality-based modeling [5]. Terrestrial laser scanners (TLSs) provide dense and accurate geometric information, though they are expensive [6], require the careful planning of scan locations, and can be time-consuming to use [7]. In recent years, an increasing number of low-cost sensor systems for 3D modeling using different operating systems have entered the market [8,9]. Easy-to-use laser scanners for projects with moderate requirements for accuracy are available, including the Leica BLK360 [3].
Panoramic multi-camera systems are widely available as a lightweight, low-cost option [10]. A number of low-cost consumer-grade panoramic cameras have entered the market, allowing the user to capture a 360-degree view at once, thus reducing the number of images required to cover a scene [11]. Panoramic cameras have also been used for the photogrammetric modeling of indoor spaces, with 3D models being possible to obtain through automatic processing, with camera calibration and the use of an optimized projection improving the model quality [12].
RGB-D cameras provide a more affordable and lightweight type of range sensor compared to a TLS, and provide reasonably accurate results in comparison to them, though their range is shorter [13]. Depth information can be collected using active stereo, projecting an infrared pattern on the scene to calculate depth [14], or, less commonly, using a time-of-flight approach [8], which can further be divided into phase-shift [14] and pulse-based sensing [15]. RGB-D cameras, combining images with depth information, add textures to the geometry without a need for key points as in photogrammetry [16]. While active stereo and time-of-flight are commonly used for the collection of depth information, pulse-based sensing has only recently seen use in RGB-D cameras [15]. RGB-D cameras see indoor use for positioning [17], as well as for mapping and modeling [9,18]. The integration of TLS data with RGB-D camera data can improve the results of the modeling process, with the RGB-D camera offering access to places the TLS does not [13].
While the ease of data collection and diminishing cost grow the potential user base of 3D modeling equipment, additional processing is required to obtain a finished model. Traditionally, manual modeling techniques have been necessary to produce models with sufficient accuracy and completeness [19]. Manual modeling requires significant time and labor resources, particularly if using data from multiple sources [20], and the automatic modeling of the built environment has been widely explored as an alternative approach [9,12,21,22]. Approaches for the automatic generation of indoor models include surface-based methods [23], primarily for visualization purposes, fitting volumetric primitives to the measurement data, or constructing the room based on a shape grammar [24].
The extraction of geometric information from images has been conducted with a multitude of methods, including a combination of spatial layout estimation and pose tracking [25] and the use of textural-based features [26]. A recent increase in studies concerning 3D depth estimation from a single image has been noted [27], where neural networks are used for determining the presence and position of planes based on known ground truth, both for rectangular [28] and panoramic images [29]. The automation of image-based reconstruction has advanced in recent years, with automated modeling providing an efficient, low-cost alternative and results of good accuracy [22]. With personal cameras being ubiquitous, image-based modeling is a widely accessible method for indoor modeling [30], though the geometric information obtainable with TLSs or RGB-D cameras aids reconstruction, and areas with sparse features remain an issue [31].
In automated reconstruction from laser-scanned point clouds, key issues are the presence of objects within the space, causing occlusions [32], a lack of semantic information [33], and varying point density, as well as artefacts from sensor errors [34]. Occlusions in the point cloud pose a challenge for automatic modeling, though the reduction of their negative impact on the model quality through detecting regularities in point clouds with significant occlusions has been explored [35]. The segmentation of floors and walls can be done under the assumption that floors are horizontal planes and walls vertical planes [30,33], though in more complex architectures, the division of a building into floors based solely on height is unfeasible due to slanted roofs and walls, and spaces that span multiple levels of the building [32]. A combination of region growing and planar segmentation has been explored as an alternative for reconstructing spaces with no a priori assumptions about their geometry [36].
RGB-D cameras offer both geometric information and RGB images, though the low geometric quality of the data can make the semantic segmentation of floors and walls challenging, and the extraction of a point cloud from RGB-D data can be computationally expensive [37]. Alternatively, a collection of range and color maps in a reference frame can be used as input for the reconstruction, with the sensor’s positioning information aiding reconstruction [30]. For modeling RGB-D data, deep learning approaches are common, with methods including the integration of the 2D semantic segmentation of images with a 3D reconstruction [36], the 2D reconstruction of walls as polygonal loops [37], and 3D volumetric segmentation [38].
The aim of this manuscript is to evaluate the quality of 3D point clouds and mesh models produced with an automated, cloud-based modeling service, utilizing different low-cost sensor systems (namely, an RGB-D camera-based system, a panoramic camera, and a TLS). With the emergence of cloud-based software services facilitating 3D mesh modeling from a variety of source data sets/sensor systems, the question of how these differing sensor systems perform in the task of indoor modeling, in combination with such automated processing systems, is raised. As these processing systems do not allow user interaction in the processing phase, the final performance of the system consists of the actual performance of the sensor system and the ability of the processing pipeline to operate with the sensors [19].

2. Materials and Methods

2.1. Matterport Cloud

In this manuscript, the commercial indoor mapping system, Matterport, is utilized as an example of automated indoor modeling. Matterport is an integrated system, offering an instrument for data collection and cloud-based processing for model and point cloud creation. With the release of the Matterport Cloud 3.0 update in January 2019, data from Matterport’s proprietary RGB-D cameras, the Leica BLK360 laser scanner, and the Ricoh Theta V and Insta360 ONE X panoramic cameras can be integrated into one project from which a model and point cloud can be produced automatically [39]. This expands the applicability of the automated modeling service beyond the proprietary instrument. The system either uses depth information from a range-based sensor to obtain geometry to combine with 2D panoramic images or derives depth data from 2D panoramic images using a neural network to construct a model of the space [40]. If depth information is used, a panoramic image is also created for each location, after which the pose of the camera is determined through bundle adjustment, aiding the construction of a textured mesh [41]. In order to determine the space geometry, a library of 3D space models with sensor and alignment data, as well as 2D image data, are used as the basis for the neural network computations. For images, the relative positions and orientations of the images are used to determine depth [40].
The ease of use and speed of model creation makes Matterport’s processing system a potentially viable low-cost system for indoor modeling [9]. However, as a fully integrated system, no parameters in the automatic processing can be altered to modify the result. Individual scans taken by the sensor cannot be edited [42]. The resulting model can be viewed online in a web browser or in VR (virtual reality) [7], with the user being able to transition from a view of the 3D model to a view of the panoramic images taken from a single scan location [43]. The point cloud and mesh model of the space can be downloaded for an additional fee [44].

2.2. Matterport Pro2 3D

The Matterport Pro2 3D RGB-D camera uses three RGB photo cameras and three active stereo depth cameras, divided into three rows with one of each sensor. Two rows are inclined, one at an upward and one at a downward angle, with the third row is set in a horizontal position. During a scan, the system completes one full horizontal rotation, capturing images at six angles [9]. While the manufacturer reports a range of 4.5 m [45], the recommended distances between scan locations are 1 m for outdoor projects and 2.5 m for indoor projects [9]. While the Matterport camera has successfully been used in an outdoor setting [46,47], the interference of sunlight at the wavelengths used by the infrared camera may affect the 3D data acquisition and alignment of the scans [48,49]. In previous studies, the Matterport camera has been shown to have low accuracy in comparison to laser scanners in indoor modeling [7]. Furthermore, its use is limited by the low range, though the rapid data acquisition and automatic processing offset these drawbacks to some extent [9].

2.3. Ricoh Theta V

The Ricoh Theta V is a dual lens 360-degree camera with a maximum still image resolution of 5376 × 2688 px. The 360-degree image is obtained with two fisheye lenses facing in opposite directions. This results in a small zone of occlusion at the side of the device. Objects further than 10 cm from the lens are visible independent of their position with respect to the lenses [50]. The camera can be controlled either by an on-camera user interface or through a mobile application [51], with the latter being used for Matterport processing [38].

2.4. Leica BLK360

The Leica BLK360 terrestrial laser scanner operates with the time-of-flight principle (occasionally also referred to as “pulse”-based laser scanning) [52] with a range of 60 m and the capability of collecting 360,000 points per second. The manufacturer claims an accuracy of 6 mm at a distance of 10 m and 8 mm at a distance of 20 m [53], with the performance having been noted to adhere to the specifications [3,54]. This makes the scanner appropriate for use in indoor spaces [55].
The data obtained with the BLK360 can be processed with Matterport’s processing system, in the cloud, with the scanner being operated through Matterport’s Capture app [28]. Alternatively, Leica’s proprietary Register360 software [56] or Autodesk ReCap Pro [57] applications can be utilized to process the data further. Register360 can facilitate the automated co-registration of scans, or the user can visually align the clouds and use the iterative closest point (ICP) algorithm to fine-tune the alignment [56,58].
In this paper, the BLK360 is operated with the Matterport Capture app, after which the processing is carried out via two alternative methods: firstly, the automated processing the Matterport cloud is performed to obtain a point cloud and a textured mesh model. The resulting point clouds and meshes are hereafter referred to as Matterport point clouds (MPC) and meshes (MM). Secondly, the default processing offered in Register360 is used to automatically obtain a point cloud, referred to as Leica point clouds (LPC). These point clouds are used to examine the impact of the Matterport processing on the results that can be obtained from the BLK360.

2.5. Leica RTC360

The Leica RTC360 terrestrial laser scanner is applied for obtaining a reference point cloud. Like the BLK360, its function is based on time-of-flight [52]. With a data collection rate of two million points per second, a range of 130 m, and an accuracy of 2.9 mm at 20 m [59], it is a suitable choice for obtaining a reference point cloud. The measurement data are processed with Leica Register360. In the scanning process, no targets are used, requiring the point clouds to be combined using automated cloud-to-cloud matching in Register360.

2.6. Test Sites and Data Acquisition

Two test sites, shown in Figure 1, with different characteristics were used for testing the described instruments. The Tetra Conference Hall at the Hanaholmen Swedish-Finnish Cultural Centre in Espoo, Finland is a 173.5 m2 hall with an irregular hexagonal shape and a roof height of 3.20 m. The interior is quite large, and the curtains along the walls give it an unorthodox shape for the Matterport processing. Lecture hall 101 at the Aalto University Department of Mechanical Engineering in Espoo, Finland is rectangular with solid walls and, at 69 m2, is significantly smaller than the Tetra hall. It also has a lower roof height at 2.50 m.
The characteristics of the applied instruments are presented in Table 1, as well as their end products. The applied instruments are the Matterport Pro2 3D (M), Ricoh Theta V (T), Leica BLK360 (BM for Matterport-processed data, BL for Leica-processed data), and Leica RTC360 (R), which produce point clouds (PC) and meshes (M).
Data acquisition was performed with each sensor in immediate succession for the conditions between the sensors to remain as close as possible. In order to minimize outliers, the RTC360 scans measured all points twice. The sensor systems were used as is to evaluate their performance as purchased, though the results could potentially have been improved by calibration [3,60,61,62].
Table 2 shows an overview of the scanning process of both test sites, with the total scanning time comprising the full scanning process from the start of the first scan to the end of the last, including the time spent moving the instrument. For the BLK360, a low resolution corresponds to a 15 × 15 mm resolution at 7.5 m, while a medium resolution corresponds to 10 × 10 mm at 7.5 m. For the RTC360 data, the instrument’s medium resolution corresponding to 6 × 6 mm at 10 m was used, and all points were scanned twice, denoted as 2x.

2.7. Comparison Methods

The processed point clouds and meshes were compared to the reference point cloud in CloudCompare 2.10.2 [63] using cloud-to-cloud (C2C) and cloud-to-mesh (C2M) distance analyses. For the distance analysis, point clouds and meshes were co-registered using the ICP algorithm following an approximate manual alignment. In order to ensure an optimal registration, points outside the examined area were removed, eliminating the possibility of stray points affecting the registration. The algorithm was set to finish once the root mean square error (RMSE) difference between two iterations was less than 10−5 m, as subsequent iterations would provide negligible benefit. The meshes were sampled, and subsequently aligned in the same manner as the point clouds.
CloudCompare offers four methods for calculating C2C distances; direct Euclidean distance, distance calculation with a least squares best fitting plane, using a 2.5D Delaunay triangulation of the projection of the points on the plane, or with a quadratic function [64]. In this paper, the quadratic function is used for the C2C calculation, as it is capable of representing smooth and curvy surfaces in addition to straight planes. For C2M calculations, CloudCompare only supports the calculation of Euclidean distances from the point cloud to the closest point on the mesh.
The analyses were conducted both on the room geometries with the furniture and all objects between floor and roof level removed, and on a small, detailed segment of the room with furniture present. In both cases, the segment consisted of a table with chairs, featuring small objects on the table. This makes it possible to separately analyze the performance of the sensor systems in large spaces with sparse features, as well as their capability to reconstruct detailed objects. In order to evaluate the presence of outliers in the data, the 90th and 99th percentile deviations were calculated. Additionally, the share of points below 1 cm was noted as a general, singular value of performance.
According to the ISPRS Benchmark on Indoor Modelling evaluation framework presented by [65], the quality of indoor modeling can be assessed in terms of completeness (the extent of the reconstruction of the reference), correctness (the extent of constructed elements present in the reference), and accuracy (the geometric distance between the elements of the source and reference). While this framework specifically concerns reconstructed mesh models, these principles can also be applied to point clouds, though with differing calculations. The ISPRS benchmark defines accuracy as the median of the unsigned distances between the reconstructed vertices of a geometric model and a reference surface. The points of the compared point cloud can directly be used in place of mesh vertices, however, in this paper, the closest point of the reference point cloud is used to measure C2C and C2M distances, rather than measuring the distance to a reference surface.
For evaluating the accuracy of the tested sensor systems, we use the mean and standard deviation, as the distribution of the errors between the point clouds and meshes displays the consistency of the sensor systems’ performance throughout the data set better than the singular value of the median.
According to the benchmark, completeness is defined as the intersection between the source and reference model, while the correctness is calculated as the area of intersection between the source and reference summed over all surfaces. As point clouds do not contain surfaces, we used the 90th and 99th percentile distances to measure completeness and correctness. As stray points outside the examined space have been eliminated manually a priori, the 99th percentile distance is used to find any notable inconsistencies, with a distance greater than a few centimeters (which could be explained by the limited function of the sensor system) indicating an incomplete representation of elements in the compared point cloud or mesh. The purpose of the 90th percentile value is twofold; an unexpectedly large value points to significant inconsistencies in the elements, evaluating completeness and correctness, and the value itself provides a measure of the accuracy. Finally, the share of points or vertices within 1 cm of any point in the reference point cloud is examined. This threshold was selected as it provides a singular value of reference for evaluating the performance, with any deviations smaller than 1 cm assumed to be located in an area with high correctness and completeness.
Additionally, the characteristics of the Matterport processing can be evaluated by examining the point and triangle counts of the generated point clouds and meshes, with the numbers demonstrating the impact of the system on the point cloud density.

3. Results

From the Matterport processing system, a mesh and point cloud were obtained for each instrument. The processing times required for Matterport (MP) and Leica processing are provided in Table 3 and Table 4, along with the point and triangle counts for each point cloud (PC) and mesh (M).
In Table 5 and Table 6, the results of the C2C and C2M analyses of the Tetra test site are shown, first for the room geometry in Table 5 and followed by the detailed segment in Table 6. The results are further divided into the analysis of point clouds and meshes in both cases.
Figure 2a,b demonstrates the difference between the Matterport and Theta V point clouds of the room geometry, with the Theta V exhibiting notable error propagation towards the left of the image. Figure 2c) highlights the inability of the BLK360 to obtain full coverage of the desk in the segment, while the Matterport has captured the scene to a larger extent, with the exception of some parts of the objects in the scene close to floor level. For C2M distances, the results are always shown as projected onto the reference point cloud; the desk has been fully covered in the reference, but is colored red in the C2M analysis of the BLK360 data due to holes in the mesh.
The results of the distance analysis of the hall 101 test site room geometry are shown in Table 7, and Table 8 displays the results of the segment.
Similarly to what can be seen in the Tetra data, Figure 3a,b shows that the Theta V suffers from error propagation, which is found to a lesser extent in the BLK360 data. Figure 3c,d displays the difference between the ability of the Matterport and Theta V to accurately reconstruct small details, with the Theta V only being able to capture the general shape of the table.

4. Discussion

4.1. Analysis of Data Acquisition and Processing Times

In terms of data acquisition times, longer-range instruments, such as the BLK360, become advantageous in larger open spaces, requiring fewer scans to cover the entire space. For the spaces used in this study, however, this is offset by the shorter scan duration of the Theta V and Matterport, which also enables them to cover occluded areas quicker than the BLK360. While the intention of the comparison was to study the capabilities of the sensor systems as is, in the state they are delivered to a user, the calibration of the sensor systems could potentially improve the results. The Matterport can be calibrated using a set of TLS-scanned targets and a comparison of their coordinates, which has been shown to improve performance and eliminate the possibility of systematic errors in the sensor system [3]. As a dual fisheye lens camera, the calibration of the Theta V is challenging [60], but the successful calibration of its predecessor Theta S has been conducted [61]. The self-calibration of the TLS can be conducted using either point or planar targets to ensure adequate data quality, though correlation between the calibration parameters, particularly the scanner rangefinder offset and the position of the scanner, must be accounted for. The use of an asymmetric target field and the measurement of tilt angle observations has been found to reduce correlation, thus improving the calibration [62].
The processing times differed notably between the sensor systems, as shown in Table 3 and Table 4. The choice of sensor system may even be impacted by the processing time; for example, the processing of the Theta V data of the Tetra hall initially failed after 36 h, and required more than ten hours to complete on a second attempt. Processing times in excess of 12 h may already complicate the daily operation of systems. The Theta V data also took the longest to process of the hall 101 data sets, but the difference was significantly smaller, and at slightly under two hours, it is a comparatively quick process. For smaller spaces, the Theta V can be a viable option in terms of the required time resources, though the 173.5 m2 Tetra hall proved difficult to process, to the point of limiting the feasibility of the Theta V in large spaces.
The geometric accuracy of the tested sensor systems with automatic processing should be adequate for measurements being conducted on the resulting point clouds and models. In addition, sufficiently dense point clouds or mesh models are required for accurate reconstruction and detailed visualization, though a high density does not necessarily reflect the quality of the point cloud or model.

4.2. Point Cloud Density and Mesh Triangle Counts

As seen in Table 3 and Table 4, the point count difference between the Matterport-processed point clouds is smaller than the difference between the Matterport- and Leica-processed BLK360 point clouds, as the Matterport processing limits the point clouds to a 1-cm grid by default unless the algorithm detects details smaller than 1 cm. This detection differs depending on the sensor system used, and can also lead to false positives, where the processing has detected details in the Matterport point cloud that do not exist in reality, as shown in Figure 4. Conversely, however, small objects may not be present in the Theta V point cloud.
The Leica processing does not limit the point cloud to a perceivable grid, creating a significant difference in the point counts of the BLK360 point clouds depending on the processing system. The Leica processing produces a dense point cloud, containing 2175% and 742% of the points of the Matterport-processed BLK360 data for Tetra and hall 101, respectively. The markedly lower density of the Matterport-processed point clouds may impact their feasibility in applications requiring the visualization of point clouds, as the textures of the space or small details may not be visible in a sparse point cloud.
When comparing the mesh triangle counts to point cloud point counts, we can see that the mesh triangle counts vary less by the room size. This is likely a result of decimation in the Matterport processing. Most notably, the BLK360 triangle count is lower for the larger Tetra hall than for the smaller hall 101, this being notable with the curtains lining the walls containing complex shapes to reconstruct. The Theta V is an outlier in both cases, however, with a triangle count several times that of the other systems despite the Theta V point clouds having a lower point count.

4.3. Distance Analysis of Indoor Space Geometries

As shown in Table 5 and Table 7, the C2C distances of the Matterport and BLK360 point cloud of the room geometries are similar, with an improvement in accuracy for the BLK360 when Leica processing is used. Figure 2 shows the difference between the sensor systems’ capabilities in a large space, with the Matterport point cloud showing moderate deviations in the roof and the curtain along the walls, while the Theta V point cloud is increasingly skewed towards the left parts of the image, also having areas with clearly higher deviations along the curtain. Figure 5 shows the deviation of the Theta V point clouds along the walls, where the shape for hall 101 is skewed, though it follows the general shape of the wall, while the shape of the curtain in the Tetra hall has not been taken into account.
The deviations of the Matterport point cloud are consistent with the findings of [4], where the errors in an indoor setting generally fell within the one-percent deviation stated by the manufacturer. While [9] present a TLS–Matterport comparison where the roof height forces the Matterport to exceed its recommended range, our test sites have a roof height well within the range of the Matterport, and the deviations of the area within its range appear similar. In our results, the deviations of the area within the range of the Matterport appear similar for both test sites. The Matterport-processed BLK360 point cloud and Matterport point cloud exhibit similar characteristics in all metrics, while the Theta V point cloud has larger deviations with a broader spread. With 53 percent of points within 1 cm of the hall 101 room geometry reference point cloud, as noted in Table 7, it falls well below the Matterport, which has the worst performance of the remaining sensors. Figure 6 shows the distribution of points in the hall 101 room geometry, displaying the difference between the points located below the 90th and 99th percentile of deviations, as well as the mean deviations. The mean indicates the spread of deviations when used in conjunction with the 90th and 99th percentile deviations, as a mean close to the 90th percentile deviation may point to outliers skewing the mean upwards. For the meshes, the deviation is calculated as the distance from a point in the reference point cloud to the closest point on the mesh. Both distributions are a measure of the ability of the sensor system to reconstruct geometry; a high 99th percent deviation indicates inconsistencies in the presence of elements in comparison to the reference, affecting completeness and correctness, while the 90th percent deviation measures accuracy, and in the case of a high value, also indicates severe deficiencies in completeness and correctness. The Theta V shows such values, while the Matterport and BLK360 with Matterport processing provide better, similar looking results for point clouds and meshes alike. In contrast, the Leica-processed BLK360 point cloud is superior to all other data sets, including the Matterport-processed BLK360 data.
In the meshes, the Theta V was an even further outlier than in the point clouds, with only 17 percent of the points in the Tetra room geometry reference cloud at a distance below 1 cm from the mesh. While the Theta V mesh contains more triangles than the other two meshes combined, this does not reflect positively in the C2M distance analysis, as seen in Figure 2 and Figure 3. Unlike for the point clouds, the Matterport-processed BLK360 clearly outperforms the Matterport. Figure 7 displays the two point clouds, showing the relative consistency of the BLK360 between the point clouds and the meshes in comparison to the Matterport.
The mean deviations do not significantly differ, though the Matterport exhibited a higher variance. The Theta V remains the outlier of the three tested sensor systems, showing larger C2M distances than the BLK360 and Matterport in every metric. In [10], panoramic photogrammetry is used to automatically generate a model from Samsung Gear360 images. With the default projection, the errors are larger than those we obtained with the Theta V, though by using a custom projection, the authors of [10] were able to achieve a higher degree of accuracy in photogrammetric modeling.
In a detailed segment, the results of Table 6 and Table 8 show a clearer difference between the Matterport and the Matterport-processed BLK360 data than is the case for the room geometry. As in the room geometry, the Theta V remains the clearly worst-performing sensor system. The choice of processing system for the BLK360 data clearly impacts the quality of the point cloud, with the Leica processing providing more accurate results, though the Matterport-processed BLK360 point cloud remains superior to the Matterport point cloud. Figure 8 displays the difference between the Matterport point cloud and the two BLK360 point clouds of the hall 101 segment.
The authors of [9] show a TLS–Matterport comparison, where the Matterport cannot accurately represent detailed areas. The choice of processing method makes a larger difference for the BLK360 in the detailed segment than for the room geometry, as the Leica-processed BLK360 point cloud exhibits the best results in every metric. A benefit of the Matterport processing for the BLK360, however, is the possibility to use an online walkthrough, and the measurement data captured by operating the scanner in Matterport’s Capture app can also be processed with Leica’s proprietary processing system.
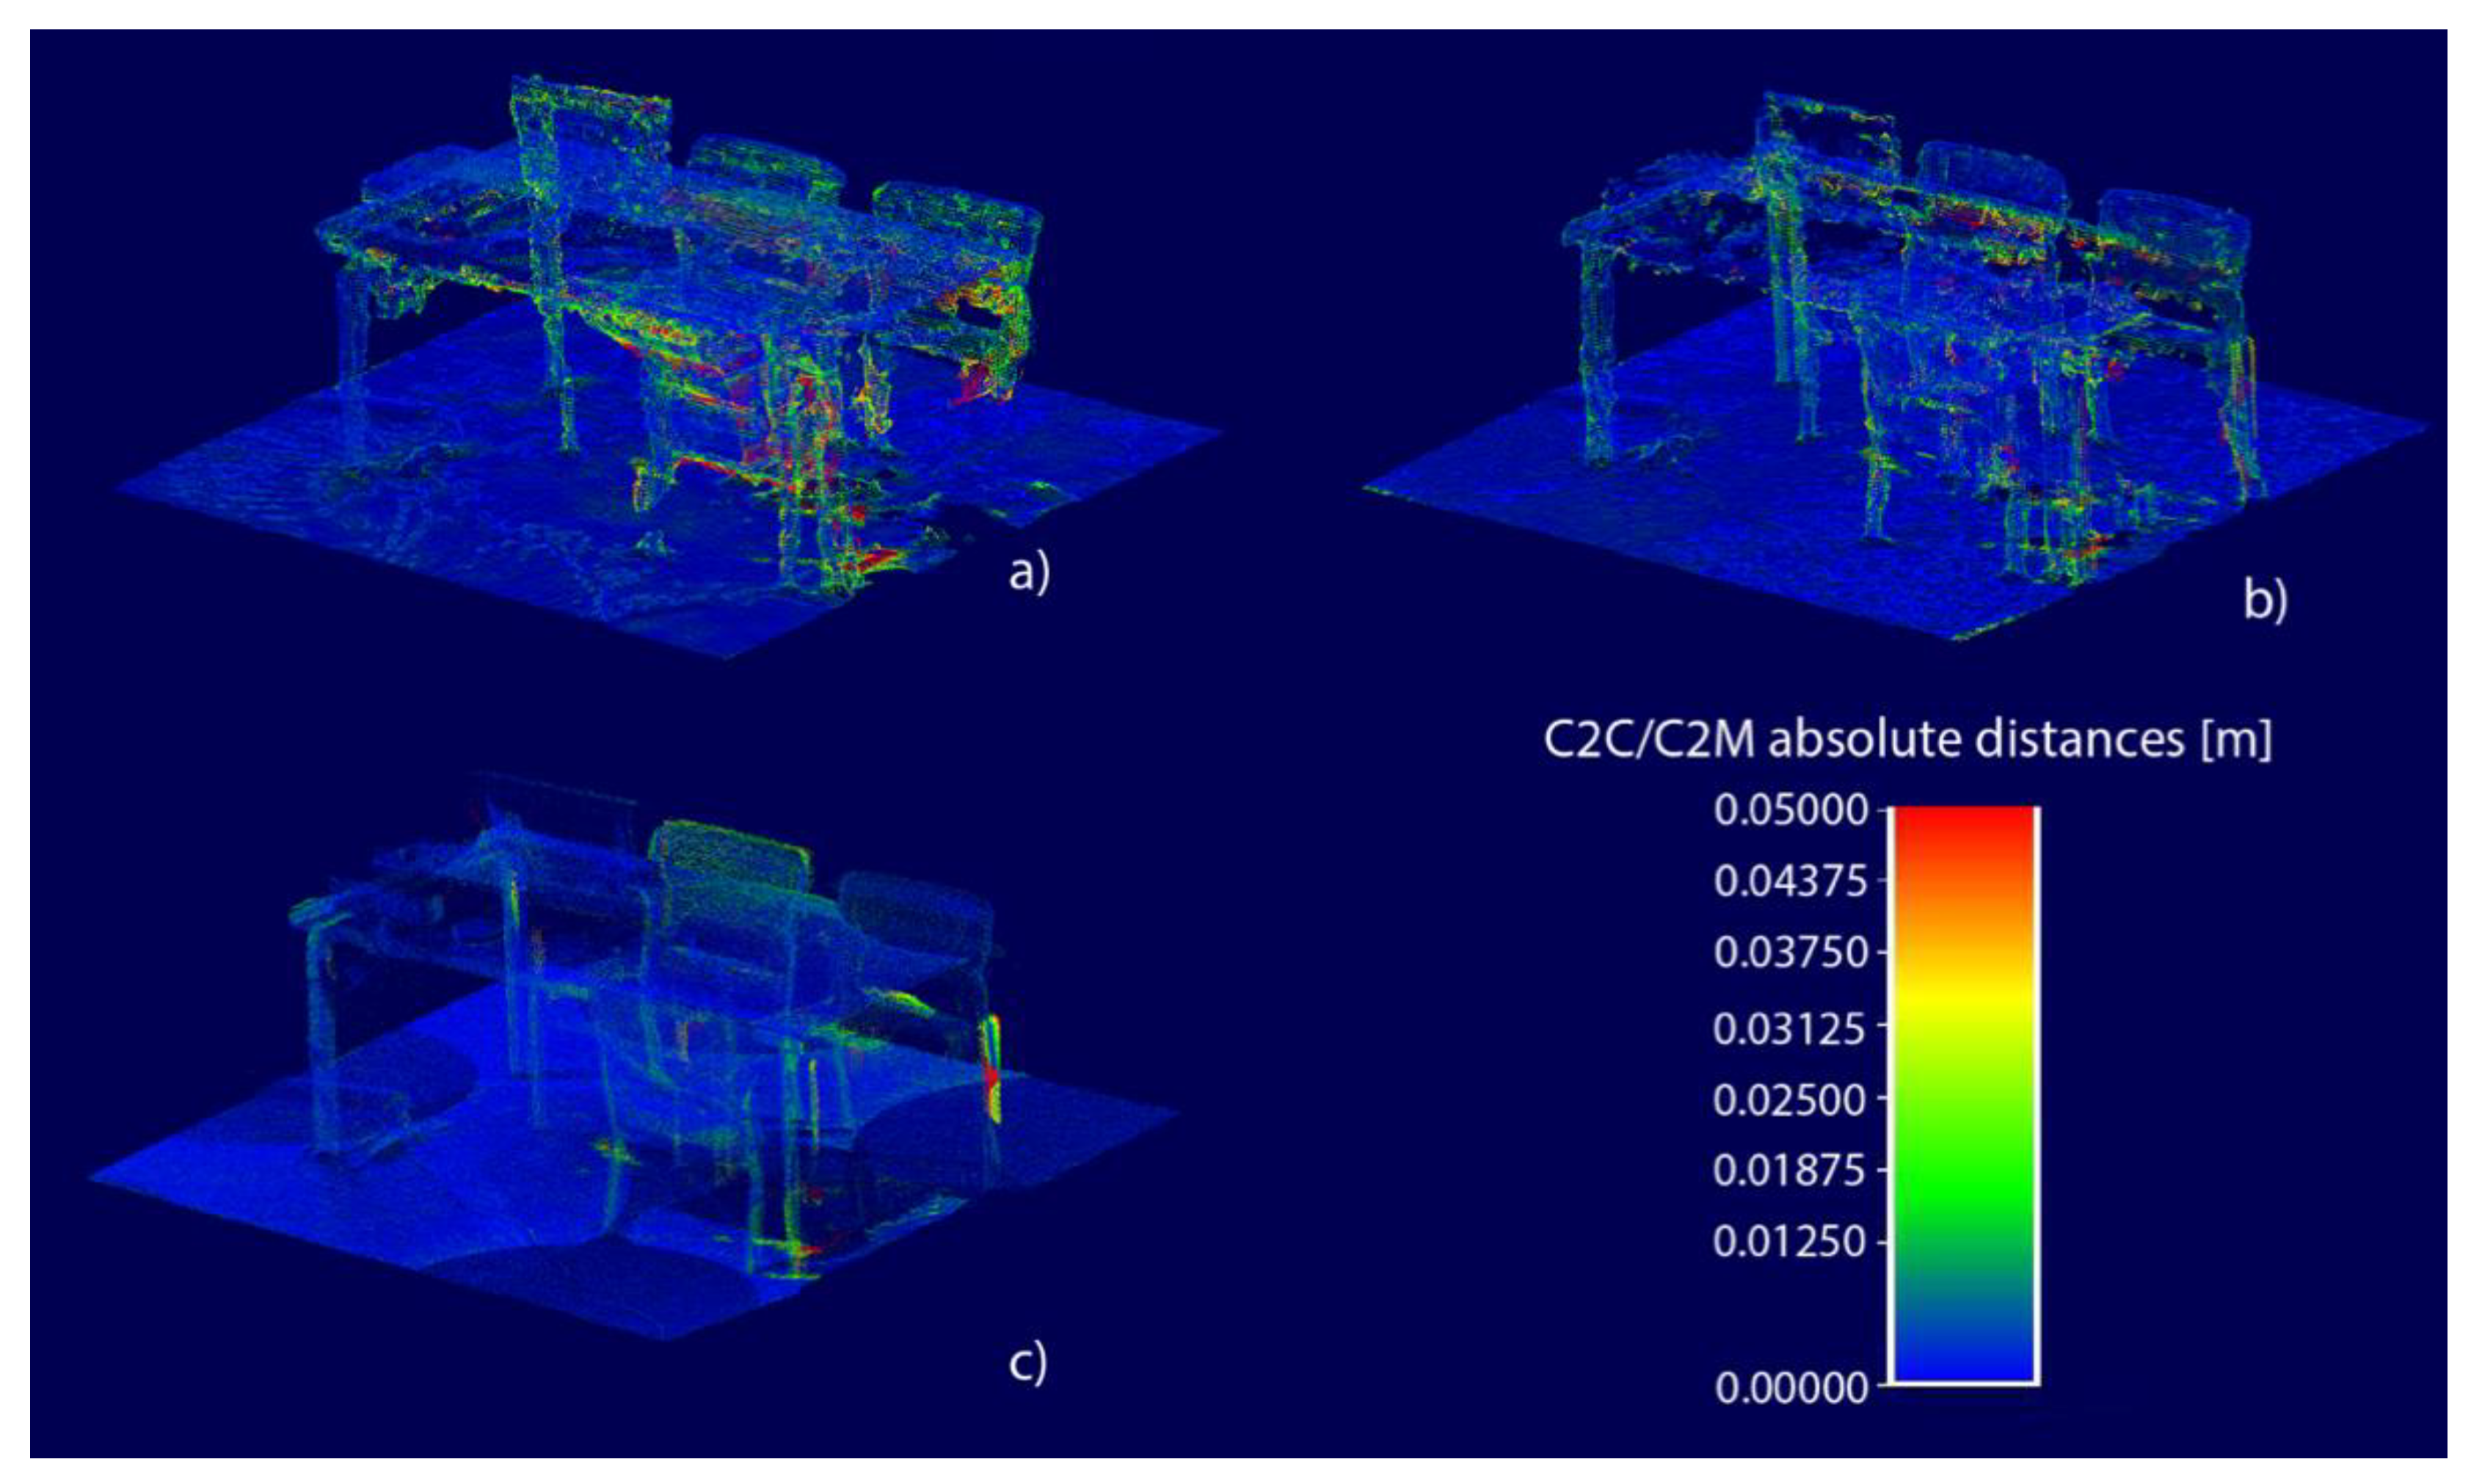
In the meshes of the segments, the Matterport outperforms the BLK360 in both spaces, having a larger share of points within 1 cm of the reference point cloud. The Theta V still exhibits the largest deviations, though it performs slightly better in the segment mesh than in the point cloud, as shown in Figure 9. The chairs by the desk have not been reconstructed in either Theta V data set, while the other sensor systems are capable of doing so.
The results of the hall 101 segment follow the ones of the Tetra segment, with similar differences between the sensor systems. Among the segment point clouds, the BLK360 outperforms the Matterport regardless of processing system, as shown in Figure 8. The opposite is true for the meshes, where the Matterport is ahead of the BLK360 in every metric. This may point to Matterport’s processing system having the best compatibility with their proprietary sensor system, despite also supporting the Leica BLK360, which optimally provides more accurate point clouds, particularly if processed through Leica’s processing system. If a higher-quality mesh is desired, Leica-processed point clouds must be processed with third-party software. The Theta V performs at a similar level to the Tetra segment in the point cloud, but its accuracy drops further in the mesh processing. The meshes of the hall 101 segment are presented in Figure 10.
In both segments, it can be noted that the Theta V performs poorly in reconstructing details, and even larger objects, causing significant completeness deficiencies in the data. If comparing the RGB-colored hall 101 segment point clouds of RTC360 and Theta V in Figure 11a,b, significant differences can immediately be seen. The computer on the table is missing entirely, and the furniture is poorly defined. Figure 11c shows the points on the RTC360 point cloud at a distance larger than the 90th percentile deviation to the Theta V point cloud, as the RTC360 point cloud contains more details, allowing the areas not captured by the Theta V to be easily distinguished. The points above the 99th percentile deviation in Figure 11d show the areas with the most significant completeness issues. Figure 11e shows the points with a deviation of larger than 1 cm, which corresponds to 43 percent of all points. These points are found throughout the point cloud, though less so on the surface of the table.
In all tested scenarios, the Matterport performs reasonably well, with the share of points below 1 cm falling within a maximum of eight percentage points in comparison to the BLK360 with Matterport processing, and the Matterport performing better by 73 to 64 percent in the Tetra segment. While the BLK360 mostly provided the best results for the Matterport-processed data, the Leica-processed BLK360 point cloud showed the lowest C2C distances up to the 90th percentile in every case. The room geometry mean deviations for of the Leica-processed BLK360 point cloud were 8 mm in the Tetra conference hall and 2 mm in the hall 101 test site, supporting the accuracy described in [3,40], though the deviations of the Matterport-processed point clouds and meshes were larger, and the difference was more pronounced in the detailed segments. The BLK360 uses a unique tripod, and is incompatible with most tripods used for other instruments, with the scanner base set to a height of 110 cm, which barely enables the scanner to reach the surface of a table of average height. In the Matterport-processed mesh of the Tetra segment displayed in Figure 2d, the top of the desk is mostly absent, causing large discrepancies between the mesh and the reference point cloud. Should the BLK360 be used from a taller height than the proprietary tripod, the results would be expected to improve, given its high accuracy in the areas in full view of the instrument. The other sensor systems can be set up on tripods of multiple types, and can be used from any height.
The Theta V is the clear outlier in every scenario, consistently showing the weakest performance of the tested sensor systems. While featureless areas are difficult for image-based sensors to model due to a lack of points to connect the images with, the processing has extracted sufficient geometry for the Theta V to create a full model of the room geometries. The largest deviations can be found in the details of the segment, as the Theta V is incapable of modeling small objects, with the objects on the tables not being present in either model. While small objects are missing entirely, there are also issues in modeling furniture, with objects being reduced to horizontal or vertical surfaces, e.g., the chairs by the table in the hall 101 segment, as seen in Figure 3d. Thus, the Theta V is unsuited for projects in which the shapes of objects within the space are to be reconstructed with a reasonable degree of accuracy. It remains a feasible alternative for obtaining the general geometry of a space, however.

5. Conclusions

The increasing availability of cloud-based software systems for automatic 3D modeling of indoor spaces and their compatibility with a number of differing sensor systems makes these systems an increasingly attractive alternative for indoor modeling. In this study, the results of the automatic, cloud-based processing of 3D point clouds and mesh models using data from different low-cost sensor systems were evaluated.
We have conducted a comparison between point clouds and meshes produced by the Matterport processing system based on data from the Ricoh Theta V panoramic camera, the Matterport Pro2 3D RGB-D camera, and the Leica BLK360 laser scanner, using a high-quality Leica RTC360 point cloud as a reference. As a black-box system, the exact function of the Matterport processing system is not publicly disclosed. Therefore, the results reflect both the performance of the sensors and the ability of the processing system to utilize scan data with no user input. As the BLK360 is compatible with both Matterport processing and Leica’s proprietary processing system, with the latter producing a point cloud, the impact of the Matterport processing on the TLS data was also examined.
A full model of the room geometry could be obtained from the automatic processing in all tested cases. Issues with error propagation, difficulty in finding sufficient features in the walls, and in the case of the Tetra hall, the irregular structure of the walls, affected the results, though all results fell well within the tolerances stated by the manufacturer. In a detailed segment, the ability of a laser scanner to capture small details was highlighted, with the Leica-processed BLK360 cloud showing the best accuracy. Using Matterport processing, the low scanning height and consequently low point density of objects located on a similar height to the scanner affected the results, as the Matterport outperformed the BLK360 with Matterport processing in both segments. As with the room geometry, the accuracy of the modeled areas fell within the tolerance stated by the manufacturer, with larger deviations stemming from the inability of the sensor system to capture data from particular areas, thus producing a model with limited completeness.
While the results demonstrate issues both with the performance of the sensor systems and the ability of the processing system to utilize the scan data, the tested processing system offers a low-cost solution for modeling indoor environments, where centimeter-level precision is not required and a visually pleasant model is desired. With the tested sensor systems ranging from a consumer-grade panoramic camera to a professional-grade laser scanner, the sensor system should be selected depending on the needs of the user. The automatic cloud-based processing of indoor scan data and panoramic images provides a viable alternative for the rapid modeling of indoor spaces, with a high rate of data acquisition and low time and resource requirements.

Author Contributions

Conceptualization, M.I., J.-P.V., M.T.V. and H.H.; Methodology, M.I., J.-P.V., M.T.V. and H.H.; Investigation, M.I.; Data curation, M.I.; Formal analysis, M.I.; Visualization, M.I.; Writing—original draft, M.I., J.-P.V., M.T.V. and H.H.; Writing—review and editing, M.I., J.-P.V., M.T.V. and H.H. All authors have read and agreed to the published version of the manuscript.

Funding

This research project was funded by the Academy of Finland, the Centre of Excellence in Laser Scanning Research (CoE-LaSR) (No. 272195, 307362). The Strategic Research Council of the Academy of Finland is acknowledged for financial support for the project, “Competence-Based Growth Through Integrated Disruptive Technologies of 3D Digitalization, Robotics, Geospatial Information and Image Processing/Computing—Point Cloud Ecosystem (No. 293389, 314312),” and the European Social Fund for the project S21272.

Acknowledgments

The authors would like to thank Kai Mattsson and Jaana Tamminen at the Hanaholmen Swedish-Finnish Cultural Centre for providing use of the Tetra Conference Hall.

Conflicts of Interest

The authors declare no conflict of interest.

References

  1. Adan, A.; Huber, D. 3D reconstruction of interior wall surfaces under occlusion and clutter. In Proceedings of the 2011 International Conference on 3D Imaging, Modeling, Processing, Visualization and Transmission, Hangzhou, China, 16–19 May 2011; pp. 275–281. [Google Scholar]
  2. Luhmann, T.; Chizhova, M.; Gorkovchuk, D.; Hastedt, H.; Chachava, N.; Lekveishvili, N. Combination of Terrestrial Laserscanning, Uav and Close-Range Photogrammetry for 3D Reconstruction of Complex Churches in Georgia. Int. Arch. Photogramm. Remote Sens. Spat. Inf. Sci. 2019, XLII, 753–761. [Google Scholar] [CrossRef] [Green Version]
  3. Shults, R.; Levin, E.; Habibi, R.; Shenoy, S.; Honcheruk, O.; Hart, T.; An, Z. Capability of Matterport 3d Camera for Industrial Archaeology Sites Inventory. Int. Arch. Photogramm. Remote Sens. Spat. Inf. Sci. 2019, XLII, 1059–1064. [Google Scholar] [CrossRef] [Green Version]
  4. Virtanen, J.P.; Kurkela, M.; Turppa, T.; Vaaja, M.T.; Julin, A.; Kukko, A.; Hyyppä, J.; Ahlavuo, M.; von Numers, J.E.; Haggrén, H.; et al. Depth camera indoor mapping for 3D virtual radio play. Photogramm. Rec. 2018, 33, 171–195. [Google Scholar] [CrossRef] [Green Version]
  5. Remondino, F.; Rizzi, A. Reality-based 3D documentation of natural and cultural heritage sites—Techniques, problems, and examples. Appl. Geomat. 2010, 2, 85–100. [Google Scholar] [CrossRef] [Green Version]
  6. Lercari, N. Terrestrial laser scanning in the age of sensing. In Digital Methods and Remote Sensing in Archaeology, 1st ed.; Forte, M., Campana, S., Eds.; Springer: Cham, Switzerland, 2016; pp. 3–33. [Google Scholar]
  7. Lehtola, V.V.; Kaartinen, H.; Nüchter, A.; Kaijaluoto, R.; Kukko, A.; Litkey, P.; Honkavaara, E.; Rosnell, T.; Vaaja, M.T.; Virtanen, J.-P.; et al. Comparison of the Selected State-Of-The-Art 3D Indoor Scanning and Point Cloud Generation Methods. Remote Sens. 2017, 9, 796. [Google Scholar] [CrossRef] [Green Version]
  8. Kersten, T.; Przybilla, H.; Lindstaedt, M.; Tschirschwitz, F.; Misgaiski-Hass, M. Comparative geometrical investigations of hand-held scanning systems. Int. Arch. Photogramm. Remote Sens. Spat. Inf. Sci. 2016, XLI, 507–514. [Google Scholar] [CrossRef]
  9. Pulcrano, M.; Scandurra, S.; Minin, G.; di Luggo, A. 3D cameras acquisitions for the documentation of cultural heritage. Int. Arch. Photogramm. Remote Sens. Spat. Inf. Sci. 2019, XLII, 639–646. [Google Scholar] [CrossRef] [Green Version]
  10. Campos, M.; Tommaselli, A.; Honkavaara, E.; Prol, F.; Kaartinen, H.; El Issaoui, A.; Hakala, T. A backpack-mounted omnidirectional camera with off-the-shelf navigation sensors for mobile terrestrial mapping: Development and forest application. Sensors 2018, 18, 827. [Google Scholar] [CrossRef] [Green Version]
  11. Barazzetti, L.; Previtali, M.; Roncoroni, F. Can we use low-cost 360 degree cameras to create accurate 3D models? In Proceedings of the 2018 ISPRS TC II Mid-Term Symposium “Towards Photogrammetry 2020”, Riva del Garda, Italy, 4–7 June 2018. [Google Scholar]
  12. Barazzetti, L.; Previtali, M.; Roncoroni, F. 3D modeling with the Samsung Gear 360. In Proceedings of the 2017 3D Virtual Reconstruction and Visualization of Complex Architectures, Nafplio, Greece, 1–3 March 2017; pp. 85–90. [Google Scholar]
  13. Altuntas, C.; Yildiz, F.; Scaioni, M. Laser Scanning and Data Integration for Three-Dimensional Digital Recording of Complex Historical Structures: The Case of Mevlana Museum. ISPRS Int. J. Geo. Inf. 2016, 5, 18. [Google Scholar] [CrossRef] [Green Version]
  14. Wasenmüller, O.; Stricker, D. Comparison of Kinect V1 and V2 Depth Images in Terms of Accuracy and Precision. In Computer Vision–ACCV 2016 Workshops. ACCV 2016. Lecture Notes in Computer Science; Chen, C.S., Lu, J., Ma, K.K., Eds.; Springer: Cham, Switzerland, 2017; Volume 10117, pp. 34–45. [Google Scholar]
  15. Sarbolandi, H.; Plack, M.; Kolb, A. Pulse Based Time-of-Flight Range Sensing. Sensors 2018, 18, 1679. [Google Scholar] [CrossRef] [Green Version]
  16. Henry, P.; Krainin, M.; Herbst, E.; Ren, X.; Fox, D. RGB-D mapping: Using Kinect-style depth cameras for dense 3D modeling of indoor environments. Int. J. Robot. Res. 2012, 31, 647–663. [Google Scholar] [CrossRef] [Green Version]
  17. Chiabrando, F.; Di Pietra, V.; Lingua, A.; Cho, Y.; Jeon, J. An Original Application of Image Recognition Based Location in Complex Indoor Environments. ISPRS Int. J. Geo. Inf. 2017, 6, 56. [Google Scholar] [CrossRef] [Green Version]
  18. Endres, F.; Hess, J.; Sturm, J.; Cremers, D.; Burgard, W. 3-D mapping with an RGB-D camera. IEEE Trans. Robot. 2013, 30, 177–187. [Google Scholar] [CrossRef]
  19. Khoshelham, K.; Díaz-Vilariño, L. 3D modeling of interior spaces: Learning the language of indoor architecture. Int. Arch. Photogramm. 2014, 40, 321. [Google Scholar]
  20. Fassi, F.; Achille, C.; Fregonese, L. Surveying and modeling the main spire of Milan Cathedral using multiple data sources. Photogramm. Rec. 2011, 26, 462–487. [Google Scholar] [CrossRef]
  21. Remondino, F.; Nocerino, E.; Toschi, I.; Menna, F. A Critical Review of Automated Photogrammetric Processing of Large Datasets. Int. Arch. Photogramm. 2017, 42, 591–599. [Google Scholar] [CrossRef] [Green Version]
  22. Julin, A.; Jaalama, K.; Virtanen, J.-P.; Maksimainen, M.; Kurkela, M.; Hyyppä, J.; Hyyppä, H. Automated Multi-Sensor 3D Reconstruction for the Web. ISPRS Int. J. Geo. Inf. 2019, 8, 221. [Google Scholar] [CrossRef] [Green Version]
  23. Xiong, X.; Adan, A.; Akinci, B.; Huber, D. Automatic creation of semantically rich 3D building models from laser scanner data. Automat. Constr. 2013, 31, 325–337. [Google Scholar] [CrossRef] [Green Version]
  24. Tran, H.; Khoshelham, K.; Kealy, A.; Diaz-Vilariño, L. Shape Grammar Approach to 3D Modeling of Indoor Environments Using Point Clouds. J. Comput. Civil. Eng. 2019, 33, 04018055. [Google Scholar] [CrossRef]
  25. Ma, W.; Xiong, H.; Dai, X.; Zheng, X.; Zhou, Y. An Indoor Scene Recognition-Based 3D Registration Mechanism for Real-Time AR-GIS Visualization in Mobile Applications. ISPRS Int. J. Geo. Inf. 2018, 7, 112. [Google Scholar] [CrossRef] [Green Version]
  26. Zhang, X.; Chen, Y.; Yu, L.; Wang, W.; Wu, Q. Three-Dimensional Modeling and Indoor Positioning for Urban Emergency Response. ISPRS Int. J. Geo. Inf. 2017, 6, 214. [Google Scholar] [CrossRef] [Green Version]
  27. Kang, Z.; Yang, J.; Yang, Z.; Cheng, S. A Review of Techniques for 3D Reconstruction of Indoor Environments. ISPRS Int. J. Geo. Inf. 2020, 9, 330. [Google Scholar] [CrossRef]
  28. Chen, L.; Kim, K.; Gu, J.; Furukawa, Y.; Kautz, J. PlaneRCNN: 3D plane detection and reconstruction from a single image. In Proceedings of the IEEE Conference on Computer Vision and Pattern Recognition, Long Beach, CA, USA, 16–20 June 2019; pp. 4450–4459. [Google Scholar]
  29. Eder, M.; Moulon, P.; Guan, L. Pano Popups: Indoor 3D Reconstruction with a Plane-Aware Network. In Proceedings of the 2019 International Conference on 3D Vision (3DV), Québec, QC, Canada, 16–19 September 2019; pp. 76–84. [Google Scholar]
  30. Pintore, G.; Mura, C.; Ganovelli, F.; Fuentes-Perez, L.; Pajarola, R.; Gobbetti, E. State-of-the-art in Automatic 3D Reconstruction of Structured Indoor Environments. STAR 2020, 39, 667–699. [Google Scholar] [CrossRef]
  31. Ding, Y.; Zheng, X.; Zhou, Y.; Xiong, H.; Gong, J. Low-Cost and Efficient Indoor 3D Reconstruction through Annotated Hierarchical Structure-from-Motion. Remote Sens. 2019, 11, 58. [Google Scholar] [CrossRef] [Green Version]
  32. Nikoohemat, S.; Diakité, A.; Zlatanova, S.; Vosselman, G. Indoor 3D reconstruction from point clouds for optimal routing in complexbuildings to support disaster management. Automat. Constr. 2019, 113, 103019. [Google Scholar]
  33. Gankhuyag, U.; Han, J.-H. Automatic 2D Floorplan CAD Generation from 3D Point Clouds. Appl. Sci. 2020, 10, 2817. [Google Scholar] [CrossRef] [Green Version]
  34. Virtanen, J.P.; Daniel, S.; Turppa, T.; Zhu, L.; Julin, A.; Hyyppä, H.; Hyyppä, J. Interactive dense point clouds in a game engine. ISPRS J. Photogramm. 2020, 163, 375–389. [Google Scholar] [CrossRef]
  35. Previtali, M.; Díaz-Vilariño, L.; Scaioni, M. Towards automatic reconstruction of indoor scenes from incomplete point clouds: Door and window detection and regularization. In Proceedings of the ISPRS TC-4 Mid-term Symposium 2018, Delft, The Netherlands, 1–5 October 2018; pp. 507–514. [Google Scholar]
  36. Shi, W.; Ahmed, W.; Li, N.; Fan, W.; Xiang, H.; Wang, M. Semantic Geometric Modelling of Unstructured Indoor Point Cloud. ISPRS Int. J. Geo. Inf. 2019, 8, 9. [Google Scholar] [CrossRef] [Green Version]
  37. Li, Y.; Li, W.; Tang, S.; Darwish, W.; Hu, Y.; Chen, W. Automatic Indoor as-Built Building Information Models Generation by Using Low-Cost RGB-D Sensors. Sensors 2020, 20, 293. [Google Scholar] [CrossRef] [PubMed] [Green Version]
  38. Chen, J.; Liu, C.; Wu, J.; Furukawa, Y. Floor-SP: Inverse CAD for floorplans by sequential room-wise shortest path. In Proceedings of the ICCV 2019, Seoul, Korea, 27 October–2 November 2019; pp. 2661–2670. [Google Scholar]
  39. Matterport, 2020a. Matterport Unveils New Cloud Platform, Unlocking Ubiquitous Access to 3D Technology. Available online: https://matterport.com/news/matterport-unveils-new-cloud-platform-unlocking-ubiquitous-access-3d-technology (accessed on 15 June 2020).
  40. Gausebeck, D.A.; Matterport Inc. Employing Three-Dimensional (3D) Data Predicted from Two-Dimensional (2D) Images Using Neural Networks for 3D Modeling Applications and Other Applications. U.S. Patent Application 16/141,630, 24 January 2019. [Google Scholar]
  41. Chang, A.; Dai, A.; Funkhouser, T.; Halber, M.; Niessner, M.; Savva, M.; Song, S.; Zeng, A.; Zhang, Y. Matterport 3D: Learning from RGB-D data in indoor environments. In Proceedings of the International Conference on 3D Vision (3DV), Qingdao, China, 18 September 2017; pp. 667–676. [Google Scholar]
  42. Gupta, T.; Li, H. Indoor mapping for smart cities—An affordable approach: Using Kinect Sensor and ZED stereo camera. In Proceedings of the 2017 International Conference on Indoor Positioning and Indoor Navigation (IPIN), Sapporo, Japan, 18–21 September 2017; pp. 1–8. [Google Scholar]
  43. Bell, M.T.; Gausebeck, D.A.; Coombe, G.W.; Ford, D.; Brown, W.J.; Matterport Inc. Selecting Two-Dimensional Imagery Data for Display within a Three-Dimensional Model. U.S. Patent 10,163,261, 25 December 2018. [Google Scholar]
  44. Matterport, 2020b. Matterport Price List. Available online: https://support.matterport.com/hc/en-us/articles/360000296927-Matterport-Price-List (accessed on 15 June 2020).
  45. Matterport, 2020c. Pro2 3D Camera—Professional 3D Capture. Available online: https://matterport.com/pro2-3d-camera/ (accessed on 15 June 2020).
  46. Gärdin, D.C.; Jimenez, A. Optical Methods for 3D-Reconstruction of Railway Bridges. Infrared Scanning, Close Range Photogrammetry and Terrestrial Laser Scanning. Master’s Thesis, University of Technology, Luleå, Sweden, January 2018. [Google Scholar]
  47. Popescu, C.; Täljsten, B.; Blanksvärd, T.; Elfgren, L. 3D reconstruction of existing concrete bridges using optical methods. Struct. Infrastruct. E. 2019, 15, 912–924. [Google Scholar] [CrossRef] [Green Version]
  48. Langmann, B.; Hartmann, K.; Loffeld, O. Depth Camera Technology Comparison and Performance Evaluation. In Proceedings of the International Conference on Pattern Recognition Applications and Methods, Barcelona, Spain, 15–18 February 2013; pp. 438–444. [Google Scholar]
  49. Matterport, 2020d. How Sunlight Affects Matterport Scans. Available online: https://support.matterport.com/hc/en-us/articles/209573687-Sunlight (accessed on 16 June 2020).
  50. Product|RICOH THETA, V. Available online: https://theta360.com/en/about/theta/v.html (accessed on 15 June 2020).
  51. Feurstein, M.S. Towards An integration of 360-degree video in higher education. In Proceedings of the DeLFI Workshops 2018 co-located with 16th e-Learning Conference of the German Computer Society (DeLFI 2018), Frankfurt, Germany, 10 September 2018. [Google Scholar]
  52. Ogawa, T.; Hori, Y. Comparison with accuracy of terrestrial laser scanner by using point cloud aligned with shape matching and best fitting methods. Int. Arch. Photogramm. 2019, 535–541. [Google Scholar] [CrossRef] [Green Version]
  53. Leica, 2019a. BLK360 Product Specifications. Available online: https://leica-geosystems.com/-/media/files/leicageosystems/products/datasheets/leica_blk360_specsheet_en.ashx (accessed on 16 June 2020).
  54. Blaskow, R.; Lindstaedt, M.; Schneider, D.; Kersten, T. Untersuchungen zum Genauigkeitspotential des terrestrischen Laserscanners Leica BLK360. In Proceedings of the Photogrammetrie, Laserscanning, Optische 3D-Messtechnik–Beiträge der Oldenburger 3D-Tage 2018, Oldenburg, Germany, 31 January–1 February 2018; pp. 284–295. [Google Scholar]
  55. Diaz, M.; Holzer, S.M. The facade’s dome of the St. Anthony’s basilica in Padua. Int. Arch. Photogramm. 2019, 42, 481–487. [Google Scholar] [CrossRef] [Green Version]
  56. León-Robles, C.A.; Reinoso-Gordo, J.F.; González-Quiñones, J.J. Heritage Building Information Modeling (H-BIM) Applied to A Stone Bridge. ISPRS Int. J. Geo. Inf. 2019, 8, 121. [Google Scholar] [CrossRef] [Green Version]
  57. Ronchi, D.; Limongiello, M.; Ribera, F. Field Work Monitoring and Heritage Documentation for the Conservation Project. The “Foro Emiliano” in Terracina (Italy). Int. Arch. Photogramm. 2019, 42, 1031–1037. [Google Scholar] [CrossRef] [Green Version]
  58. de Lima, R.; Sykora, T.; De Meyer, M.; Willems, H.; Vergauwen, M. On Combining Epigraphy, TLS, Photogrammetry, and Interactive Media for Heritage Documentation: The Case Study of Djehutihotep’s Tomb in Dayr al-Barsha. In Proceedings of the EUROGRAPHICS Workshop on Graphics and Cultural Heritage, Vienna, Austria, 12–15 November 2018. [Google Scholar]
  59. Leica, 2019b. Leica RTC360 3D Reality Capture Solution. Available online: https://leica-geosystems.com/products/laser-scanners/scanners/leica-rtc360 (accessed on 15 June 2020).
  60. Shere, M.; Kim, H.; Hilton, A. 3D Human Pose Estimation from Multiple 360° Scenes. In Proceedings of the IEEE Conference on Computer Vision and Pattern Recognition, Long Beach, CA, USA, 16–20 June 2019. [Google Scholar]
  61. Aghayari, S.; Saadatseresht, T.; Omidalizarandi, M.; Neumann, I. Geometric Calibration of Full Spherical Panoramic Ricoh-Theta Camera. ISPRS Ann. Photogramm. Remote Sens. Spatial Inf. Sci. 2017, IV, 237–245. [Google Scholar] [CrossRef] [Green Version]
  62. Lichti, D. Terrestrial laser scanner self-calibration: Correlation sources and their mitigation. ISPRS J. Photogramm. 2010, 65, 93–102. [Google Scholar] [CrossRef]
  63. CloudCompare–Open Source Project. Available online: https://www.danielgm.net/cc/ (accessed on 29 June 2020).
  64. CloudCompare v2.6.1–User Manual. Available online: https://www.danielgm.net/cc/doc/qCC/CloudCompare%20v2.6.1%20-%20User%20manual.pdf (accessed on 29 June 2020).
  65. Khoshelham, K.; Tran, H.; Díaz-Vilariño, L.; Peter, M.; Kang, Z.; Acharya, D. An Evaluation Framework for Benchmarking Indoor Modelling Methods. Int. Arch. Photogramm. 2018, 42, 4. [Google Scholar] [CrossRef] [Green Version]
Figure 1. The test sites used for the comparisons; the Tetra hall viewed from the entrance (left) and hall 101 viewed towards the entrance (right).
Remotesensing 12 02624 g001
Figure 2. From the Tetra data, C2C (cloud-to-cloud)distances of the Matterport (a) and Theta V point clouds (b); C2M (cloud-to-mesh) distances of the Matterport-processed BLK360 (c) and Matterport (d) segment meshes.
Remotesensing 12 02624 g002
Figure 3. From the hall 101 data, C2M distances of the Matterport-processed BLK360 (a) and Theta V (b) meshes; C2C distances of the Matterport (c) and Theta V (d) segment point clouds.
Remotesensing 12 02624 g003
Figure 4. A detail of C2C distances of a featureless floor area in the hall 101 Matterport point cloud (left) and Theta V point cloud (right).
Remotesensing 12 02624 g004
Figure 5. Detail of the walls in the hall 101 (top) and Tetra (bottom) Theta V point clouds in comparison to the reference point cloud, shown in original color.
Remotesensing 12 02624 g005
Figure 6. The deviations of the points within the 90th and 99th percentile deviations for the hall 101 room geometry, with mean deviations noted.
Remotesensing 12 02624 g006
Figure 7. From the Tetra room geometry, C2C distances of the Matterport (a) and Matterport-processed BLK360 (b) point clouds; C2M distances of the Matterport (c) and BLK360 (d) meshes.
Remotesensing 12 02624 g007
Figure 8. C2C distances of the Matterport (a), Matterport-processed BLK360 (b), and Leica-processed BLK360 (c) point clouds in the hall 101 segment.
Remotesensing 12 02624 g008
Figure 9. C2C distances of the Theta V point cloud (a) and Matterport point cloud (b); C2M distances of the Theta V mesh (c) in the Tetra segment.
Remotesensing 12 02624 g009
Figure 10. C2M distances of the Matterport (a), Theta V (b), and BLK360 (c) meshes in the hall 101 segment.
Remotesensing 12 02624 g010
Figure 11. The RGB-colored RTC360 (a) and Theta V (b) point clouds of the hall 101 segment, with the clearest visual differences noted; the points on the RTC360 point cloud with a distance to the Theta V point cloud larger than the 90th percentile deviations (c), 99th percentile deviations (d), and 1 cm (e), with points exceeding the threshold shown in red. Significant completeness issues can be seen, particularly in the 99th percentile deviations.
Remotesensing 12 02624 g011
Table 1. Overview of the selected sensor systems used for indoor mapping and modeling.
InstrumentTypeWeight (kg)Range (m)ProcessingProduct
Matterport Pro2 3DRGB-D camera3.44.5MatterportMPC MM
Ricoh Theta V360-degree camera0.1211.5MatterportTPC TM
Leica BLK360Laser scanner160Matterport LeicaBMPC BMM BLPC
Leica RTC360 (reference)Laser scanner5.35130LeicaRPC
Table 2. Overview of the scanning process for the two test sites.
Test SiteInstrumentSettingsNumber of ScansTotal Scanning Time
TetraMatterportN/A4452 min
Theta VN/A10458 min
BLK360Medium resolution HDR 318110 min
RTC360Medium resolution 2x942 min
Hall 101MatterportN/A1522 min
Theta VN/A3335 min
BLK360Low resolution HDR 318105 min
RTC360Medium resolution 2x730 min
Table 3. Point and triangle counts for the obtained point clouds and meshes of the Tetra test site, and the processing time required to obtain them.
InstrumentProcessing SystemData SetPoints/TrianglesProcessing Time
MatterportMatterportMPC8,165,597170 min
MM395,035
Theta VMatterportTPC6,627,988647 min
TM1,489,642
BLK360MatterportBMPC9,522,744298 min
BMM301,355
BLK360LeicaBLPC207,128,818115 min
Table 4. Point and triangle counts for the obtained point clouds and meshes of the hall 101 test site, and the processing time required to obtain them.
InstrumentProcessing SystemData SetPoints/TrianglesProcessing Time
MatterportMatterportMPC3,242,73655 min
MM322,850
Theta VMatterportTPC2,835,404118 min
TM1,119,757
BLK360MatterportBMPC3,210,68355 min
BMM343,693
BLK360LeicaBLPC23,826,22070 min
Table 5. Results of the distance analysis of the Tetra room geometry.
Data SetMaximum Deviation (m)Mean Deviation (m)Standard Deviation (m)90th Percentile Deviation (m)99th Percentile Deviation (m)Deviations below 1 cm (%)
MPC0.4140.0080.0100.0140.04475.72
TPC0.4230.0190.0200.0430.07742.48
BMPC0.5470.0100.0260.0140.13979.41
BLPC0.5380.0080.0220.0150.10082.46
MM0.6290.0110.0100.0200.04054.54
TM0.8030.0380.0580.0600.47617.03
BMM0.6340.0090.0200.0150.04273.27
Table 6. Results of the distance analysis of the Tetra segment.
Data SetMaximum Deviation (m)Mean Deviation (m)Standard Deviation (m)90th Percentile Deviation (m) 99th Percentile Deviation (m) Deviations below 1 cm (%)
MPC0.1900.0120.0190.0340.09673.19
TPC0.2220.0270.0340.0750.15944.52
BMPC0.1620.0110.0120.0260.05763.61
BLPC0.3090.0040.0080.0090.03591.00
MM0.3070.0040.0130.0080.05091.74
TM0.3370.0180.0230.0370.11642.46
BMM0.3110.0120.0290.0310.14977.94
Table 7. Results from the distance analysis of the hall 101 room geometry.
Data SetMaximum Deviation (m)Mean Deviation (m)Standard Deviation (m)90th Percentile Deviation (m)99th Percentile Deviation (m) Deviations below 1 cm (%)
MPC0.2310.0060.0080.0100.03888.74
TPC0.2840.0130.0130.0310.05353.37
BMPC0.2370.0040.0080.0100.03390.20
BLPC0.4980.0020.0030.0040.00899.44
MM0.4890.0080.0090.0120.04180.12
TM0.7220.0200.0270.0380.09333.01
BMM0.4960.0090.0130.0160.03265.10
Table 8. Results from the distance analysis of the hall 101 segment.
Data SetMaximum Deviation (m)Mean Deviation (m)Standard Deviation (m)90th Percentile Deviation (m)99th Percentile Deviation (m)Deviations below 1 cm (%)
MPC0.1810.0080.0130.0220.06577.22
TPC0.2290.0320.0450.0870.17756.83
BMPC0.1600.0050.0090.0140.04384.53
BLPC0.2010.0040.0070.0090.02892.06
MM0.4000.0070.0120.0180.05082.93
TM0.4110.0400.0680.1110.35835.85
BMM0.4070.0150.0230.0300.13057.50

