Article

Benefits and Lessons Learned from the Sentinel-3 Tandem Phase

1
ACRI-ST; 260 route du Pin Montard, 06410 Sophia Antipolis, France
2
European Space Agency, European Space Research and Technology Centre (ESA ESTEC), Keplerlaan 1, AZ 2201 Noordwijk, The Netherlands
3
National Physical Laboratory, Teddington TW11 0LW, UK
4
Science and Technology Facilities Council (STFC), Rutherford Appleton Laboratory Space (RAL Space), Harwell Oxford OX11 0QX, UK
5
Lancaster Environment Centre, Lancaster University, Bailrigg, Lancaster LA1 4YW, UK
6
Department of Meteorology, University of Reading, Reading RG6 6AL, UK
7
Marine Physics and Ocean Climate group, National Oceanography Centre, European Way, Southampton SO14 3ZH, UK
8
Marine Physics and Ocean Climate Group, National Oceanography Centre, Joseph Proudman Building, 6 Brownlow Street, Liverpool L3 5DA, UK
9
CLS, Parc Technologique du Canal, 11 Rue Hermès, 31520 Ramonville-Saint-Agne, France
10
Fluctus, 81800 Rabastens, France
*
Author to whom correspondence should be addressed.
Remote Sens. 2020, 12(17), 2668; https://doi.org/10.3390/rs12172668
Submission received: 7 July 2020 / Revised: 31 July 2020 / Accepted: 31 July 2020 / Published: 19 August 2020
(This article belongs to the Special Issue Cross-Calibration and Interoperability of Remote Sensing Instruments)

Abstract

:
During its commissioning phase, the Copernicus Sentinel-3B satellite has been placed in a tandem formation with Sentinel-3A for a period of 6 months. This configuration allowed a direct comparison of measurements obtained by the two satellites. The purpose of this paper was to present the range of analyses that can be performed from this dataset, highlighting methodology aspects and the main outcomes for each instrument. We examined, in turn, the benefit of the tandem in understanding instrument operational modes differences, in assessing inter-satellite differences, and in validating measurement uncertainties. The results highlighted the very good consistency of the Sentinel-3A and B instruments, ensuring the complete inter-operability of the constellation. Tandem comparisons also pave the way for further improvements through harmonization of the sensors (OLCI), correction of internal stray-light sources (SLSTR), or high-frequency processing of SRAL SARM data. This paper provided a comprehensive overview of the main results obtained, as well as insights into some of the results. Finally, we drew the main lessons learned from the Sentinel-3 tandem phase and provided recommendations for future missions.

Graphical Abstract

1. Introduction

The Copernicus Sentinel-3 mission [1] is devoted to the measurement of water surface topography, temperature, and optical radiometry over land and ocean. Its accuracy and revisit are designed to support ocean forecasting systems as well as environmental and climate monitoring. The Sentinel-3 satellite accommodates four main instruments:
  • SRAL, the SAR radar altimeter working in bands Ku/C
  • MWR, the microwave radiometer, which complements SRAL to perform the sea surface topography mission
  • SLSTR, the sea and land surface temperature radiometer, with channels covering VIS, SWIR, and thermal infra-red
  • And OLCI, the ocean and land color imager in the VISNIR domain
Sentinel-3A was launched on 16 February 2016, and Sentinel-3B on 25 April 2018. From June to October 2018, Sentinel-3B operated in close formation (tandem configuration with 30 s overpass time delay) with Sentinel-3A, before rallying its nominal orbital position forming a 140° orbital angle with respect to Sentinel-3A.
The Sentinel-3 tandem phase was designed as a short-term period, allowing better understanding and characterization differences between the satellites. This is in contrast with some other missions where formation-flying is a key part of the mission operation concept: e.g., tandem X (two satellites operating at 200 m of distance), or FLEX ([2], to be operated in formation with Sentinel-3). A short-term tandem phase was previously implemented for altimetry missions and provided significant benefits (see e.g., [3,4,5,6]). Sentinel-3 is, however, the first mission with a significant tandem period for optical instruments (OLCI and SLSTR). A short tandem phase (4 days) was implemented with Landsat 5-TM and Landsat 7-ETM+ [7]. The previous ERS-1/2 tandem configuration (with 2 satellites at one-day interval) did not allow a direct comparison of optical instrument measurements.
The main objective of the Sentinel-3 tandem phase is ensuring the consistency of the data provided by the two satellites. This is important because they are intended to operate as a constellation and to establish reliable long-term climate data records. With this objective in mind, a specific study (“Sentinel-3 Tandem for Climate” [8]) was started in May 2019. This study complemented previous analyses performed by the Sentinel-3B commissioning team and the Sentinel-3 mission performance center (MPC), which led to the successful transfer to operations of Sentinel-3B on 23rd November 2018. An important aspect of the tandem study was the collection and curation of a consistent archive of Sentinel-3A and Sentinel-3B data for all instruments. The data set consisted of operational (Sentinel-3A), pre-operational (Sentinel-3B), or reprocessed data (for optical instruments only) sampled at the rate of one day per week and covering the pre-tandem, tandem, and post-tandem phases.
The present paper provided an overview of the activities performed in the frame of the Sentinel-3 tandem for climate study. Reference is made throughout the paper to several companion papers presenting specific analyses in more detail. The next chapter describes the motivations and characteristics of the Sentinel-3 A/B tandem phase. The following chapters detail, in turn, the main benefits of the tandem phase analyses to address different aspects of inter-calibration and validation. Each aspect is illustrated by an example for one of the Sentinel-3 instruments, highlighting the unique benefits of the collocated tandem data.
Finally, we gather lessons learned and recommendations for future tandem operations.

2. Motivation and Design of the S3B Tandem Phase

2.1. Tandem Inter-Comparisons from a Metrology Point of View

Metrology, the science of measurement, provides a framework for creating a robust, long-term, interoperable framework for climate records (see, e.g., [9]). Metrology has three basic principles:
  • Traceability of measurements to a stated metrological reference.
  • Uncertainty analysis.
  • Comparisons of measurements to confirm traceability and validate uncertainty analysis.
In the domain of earth observation, the availability of significant comparisons is a critical issue. Although it is common practice to compare measurements obtained by different satellites, the comparisons are limited by:
  • Temporal variations of the geophysical signal;
  • Variations of the observation geometry;
  • And variations of atmospheric conditions.
Inter-satellite comparisons often rely on simultaneous nadir observations (for optical data) or cross-over measurements (altimetry). This is possible only in a few specific locations, which leads to a poor and possibly biased statistical sampling. Atmospheric and bi-directional geometry effects can be estimated through models or ancillary measurements, and temporal variations of the geophysical signal can be limited by looking for pseudo-invariant sites. This allows the relaxation of simultaneity requirements, increasing the number of measurements. However, it also introduces additional uncertainty in the comparison process and, therefore, reduces the quality of the inter-comparison. This is particularly true for altimetry as the sea surface height (used to retrieve geostrophic currents) is estimated, thanks to the knowledge of several oceanic and atmospheric geophysical parameters, e.g., the water vapor content in the atmosphere, the air pressure on the oceanic surface, the surface elevation induced by ocean tides. The high spatial and temporal variability of these parameters leads to increased uncertainty in inter-comparison methods.
When two satellites are placed in a tandem configuration on the same orbit at a short time interval, all measurements are (at first order) directly comparable. This allows robust statistical analysis of the measurements with good control of the uncertainty.
For an observation system based on a constellation of satellites, a tandem phase during the commissioning phase is, therefore, the best way to (a) ensure the traceability of measurements obtained by the different satellites of the constellation, (b) validate the uncertainty on the measurements. Both aspects are critical to building reliable long-time series as needed by, e.g., climate change studies. This has been recognized early on by the satellite altimetry community. As a result, tandem inter-calibration phases were implemented for the JASON satellite series to precisely estimate the absolute biases between the two different altimeters and construct a reliable and long time series of the mean sea level (MSL) [10,11]. These considerations naturally led to consider a tandem phase with Sentinel-3A during the commissioning phase of Sentinel-3B. It became evident that this would also bring significant benefits to the optical missions (OLCI and SLSTR).
While the tandem phase provides opportunities to acquire measurements with the same viewing conditions, the drift phase between the tandem and nominal positions allowed earth scenes to be observed with increasing differences in viewing angles. Of particular interest is a moment in time where the dual view of the SLSTR-B overlaps with the nadir view of SLSTR-A. In order to take advantage of this specific geometric configuration, the drift rate was kept low, while the swath of the A and B optical instruments was overlapping and increased subsequently.

2.2. Timeline of the Sentinel-3B Tandem Phase

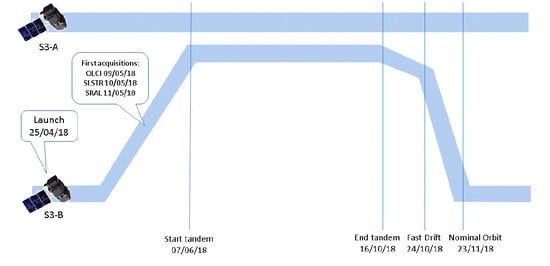
The Sentinel-3B satellite was launched on 25th April, 2018. After early operations, the satellite was put on a drifting orbit. The Sentinel-3B instruments were activated during the month of May 2018, and the satellite reached its tandem position on 7th June, 2018. Both satellites followed the same ground track (within the across-track control range of ±1 km) at a 30 s interval. During the tandem phase, the operational mode of the SRAL-B instrument was changed several times for sensitivity analyses. On 16th October, 2018, Sentinel-3B was placed on a drifting orbit to reach its nominal operational position, forming an orbital angle of 140° with Sentinel-3A. As mentioned above, the drift rate was kept low until 24th October and increased during the following month. The nominal orbital position was reached on the 23rd November 2018. Figure 1 below provides a schematic overview of the main events of the Sentinel-3 tandem operations. A detailed mission activity timeline is available from the website of the Sentinel-3 tandem for climate study [12].
The tandem phase provided the opportunity to compare various operational modes for the surface topography mission: synthetic aperture radar (SAR) mode in “open” or “closed” loop tracking, low-resolution mode (LRM). The timeline of the joint S3A/S3B altimetry operations is provided in Figure 2. This point is further addressed in Section 3.

3. The Sentinel-3 Tandem for Climate Study

3.1. Study Objectives

Measurements acquired during the tandem phase can be used for several purposes:
  • Supporting commissioning of Sentinel-3B operations, by allowing straightforward comparisons with a similar operational satellite
  • Understanding the impact of different instrument operations modes: this has been especially important for the altimetry mission
  • Understanding inter-satellite differences, assessing harmonization needs and requirements; this point being the core objective of the tandem phase
  • Validating uncertainties
  • Exploiting differences in the geophysical signal, due either to the time lag during the tandem phase or the differences in geometry during the drift phase
The Sentinel-3 tandem for climate study was commissioned by ESA to exploit the tandem data and improve the long-term usability of data from the Sentinel-3 constellation for climate data records. The study looked at all Sentinel-3 instruments and covered a large range of the topics listed above.

3.2. Data Archive

To support the investigations of the study, an archive of Sentinel-3A and 3B products was collected. Access to the archive can be obtained upon request to the authors.
The archive for optical instruments contains data from every Monday from 20/08/2018 to 18/03/2019. It contains non-time-critical level 1 and Level 2 products from OLCI and SLSTR: OL_1_EFR, OL_2_WRR, SL_1_RBT, SL_2_LST, SL_2_WST. The archive also contains reprocessed products for the months of July, September, and December (post-tandem). The OLCI reprocessing concerns OLCI-A and B and relies on the processing baseline 2.42 (released on 12/2018), with an ad-hoc radiometric calibration to harmonize OLCI-A to the radiometry of OLCI-B (see Section 6.2 for details). The SLSTR reprocessing concerns SLSTR-B only. Processing baseline 2.37 (released 08/2018) has been used with optimized geometric calibration with respect to the nominal processing. The optical archive is accessible from the C-TEP data exploitation platform [13].
The altimetry archive contains S3A and S3B level 2 products over the tandem period (May to December 2018). It is hosted on the Sobloo DIAS (data information and access service) [14]. In the analyses, a correction 0.5 dB was applied on the sigma0 data of SRAL-B, see [15].

3.3. Main Results

Table 1 below provides an overview of the main analyses performed on Sentinel-3 tandem data and the outcomes and lessons learned. These points are further described in the rest of the paper.

4. Methodology for Inter-Comparisons

The tandem configuration provides an opportunity to assess the measurement uncertainties. To formalize this point, let us denote by LA and LB the measurements of the A and B instruments, and define the difference, ΔL = LALB. Then, the uncertainty u associated to the difference ΔL satisfies
u2L) = u2(LA) + u2(LB) − 2 u(LA,LB) + u2match-upL),
where u(LA,LB) is the covariance of the measurements, and umatch-up is the uncertainty associated with the match-up.
The covariance between measurement errors can arise from, e.g., characterizing both instruments with the same set-up. This quantity is generally difficult to estimate. In this, the study has been neglected because we expect it generally to be small and because it has the effect of reducing the uncertainty associated with the difference; therefore, neglecting it provides a more cautious estimate of the uncertainty.
The uncertainty associated with the match-up can be reduced to a negligible value if care is taken to colocalize the measurements. For the SRAL altimeter, the match up uncertainty can be minimized by finding pairs of spatially nearest measurement points, rather than by using the simultaneous observations.
For optical images, two approaches can be followed. One consists of finding tie-points using image correlation in sensor geometry. This procedure is accurate but time-consuming. The other approach consists of re-projecting images of both sensors in cartographic projection. This approach introduces an interpolation error in the comparison, but it is faster and more straightforward. The approaches have been compared, and the latter has been eventually retained for the study. It is useful to consider a relatively large grid cell for the projection of radiometric comparisons (typically 0.5°): this reduces the impact of measurement noise, cloud motion, and parallax effects. Applying cloud masking or filtering for the most homogenous cells further improves the comparisons.
At this point, the difference ΔL can be compared to a priori knowledge of the measurement uncertainty. In order to do so, one may need to separate the common uncertainty (with spatial and/or temporal correlation, e.g., due to calibration errors) from the independent uncertainty (due to measurement noise). Indeed, some of the common uncertainty components will be canceled out in taking the difference and so will not contribute to the final signal. Note here that we use the simplified phrases “independent uncertainty” and “common uncertainty” as shorthand for the more formal “uncertainty associated with independent effects” and “uncertainty associated with common effects”. Uncertainties themselves, representing a distribution, cannot be independent, common, random, or systematic, it is the unknown errors that have these correlation structures.
The difference between sensors, ΔL, will include known differences in instrument characteristics, such as the slightly different spectral responses for the two OLCI instruments. Such differences can be corrected for in the comparison, modifying the difference to ΔL’ = LALB + δ, and extending the uncertainty expression in Equation (1) to include an uncertainty associated with the correction itself (e.g., from the uncertainty associated with the spectral response functions and/or the spectral radiance of the scene). Following such corrections, the comparison may show up further, previously unknown, differences between the sensors, if the differences are (statistically) larger than the uncertainty associated with the differences for some or all of the observations. Ideally, the identified, previously unknown, differences will be corrected through an improved understanding of the instrument model (recalibration) rather than through a simplistic correction to the measurement (bias correction). Recalibration can be performed either while respecting known differences in, e.g., spectral response functions (harmonization) or by correcting for these as though both instruments were identical (homogenization).
For recalibration, the differences must be understood at the instrument level. This can be supported through a detailed sensitivity analysis of the observed differences. The methodology used here consists of plotting the inter-sensor differences as a function of the variable using appropriate statistical binning. The techniques include generation of geographic maps or regional averages, across-track histograms, plotting the differences as a function of the signal itself to investigate non-linearities, examples of which are shown below.
Tandem data also provide an opportunity to compare the statistics of ΔL to the total uncertainty given in Equation (1) √(u2(LA) + u2(LB)) using ex-ante uncertainty models. This is particularly interesting as uncertainty models are otherwise very difficult to validate. It has been applied successfully to SLSTR level 1 and L2 sea surface temperature (SST) data (see Section 7).
Tandem data can also be used to evaluate the measurement noise (independent uncertainty). Since the two satellites are observing the same scenes and nearly identical conditions, a direct comparison of the measurement noise is possible. This has been done to compare the SRAL-A and B altimetry precision over land ice and to analyze the impact of measurement noise on climate records for mean sea level or chlorophyll concentration.
The triple-collocation methodology (see e.g., [27,28]) is another powerful tool, which can be leveraged to analyze measurement uncertainty in the context of tandem operations. In this approach, we introduced a third independent dataset of measurements LC, and we used the observed standard deviations of the three different pairs to establish the uncertainty associated with random effects for each sensor. Based on the method given in [27,28], but updating the notation to be compatible with the GUM and metrological standards, the uncertainty associated with independent effects for sensor A can be evaluated through:
u(εA) = (√(σ2AB + σ2ACσ2BC))/2,
where σi,j denotes the observed standard deviation of the differences between the pair of observations from datasets i and j. The uncertainties associated with independent effects for measurements B and C are obtained using similar formulas as Equation (2). This methodology was used to compare SRAL sea state measurements to buoys and ERA-5 model data, see [19].

5. Understanding the Impact of Instrument Operating Modes

5.1. SRAL Acquisition Mode Comparisons for Sea Surface Height

The Sentinel-3 tandem phase has been a unique opportunity to investigate the impact of different operating modes of the altimeter. More precisely, measurements of SRAL-A in pseudo-low-resolution mode (PLRM) could be compared to measurements of SRAL-B in low-resolution mode (LRM). In addition, it has been possible to compare measurements of SRAL-A operating in closed-loop tracking mode with SRAL-B operating in open-loop tracking mode. These analyses are necessary for assessing the consistency between the different operating modes and, in particular, for improving our understanding of the altimeter SAR-mode signal processing, which is of high importance for the upcoming missions that tend toward more use of SAR-mode altimeter in the future (as for the Sentinel-6 mission).
Two of the main results that come out from these analyses are that (1) the SAR-mode altimeter estimates are sensitive to the position of the waveform within the altimeter tracking window as evidenced in assessing SAR-mode data acquired in open-loop mode, and (2) the pulse-to-pulse correlation effects impact PLRM estimates to such an extent that the use of adapted LRM look-up tables is needed to ensure the data continuity of this mode (also implemented in the upcoming Sentinel-6/JASON-CS mission) with previous JASON time series.

5.2. SRAL Acquisition Mode Comparisons for Sea State

Another study looked at sea state measurements (wind speed (WSP) and significant wave height (SWH)). Comparisons were made between S3A, S3B measurements, buoy in-situ measurements from the US National Data Buoy Center [29] online archive, and ERA5 [30] model data. Analyses included scatter plots, such as presented in Figure 3 below, and triple collocations using the methodology described in Section 4 (see [19] for details). Such comparisons allowed not only to verify the consistency of S3A and S3B measurements but also to assess the relative precision of different acquisition modes for sea state.
Overall, the results indicate a better agreement of SARM SWH with in-situ or model, while for wind speed, the agreement is slightly better for LRM or PLRM.

6. Understanding Inter-Sensor Differences

6.1. SRAL Differences Due to Sensor Mis-pointing

Inter-comparisons between S3A and S3B measurements generally reveal an excellent agreement for sea surface height, wind speed, significant wave height, and land ice.
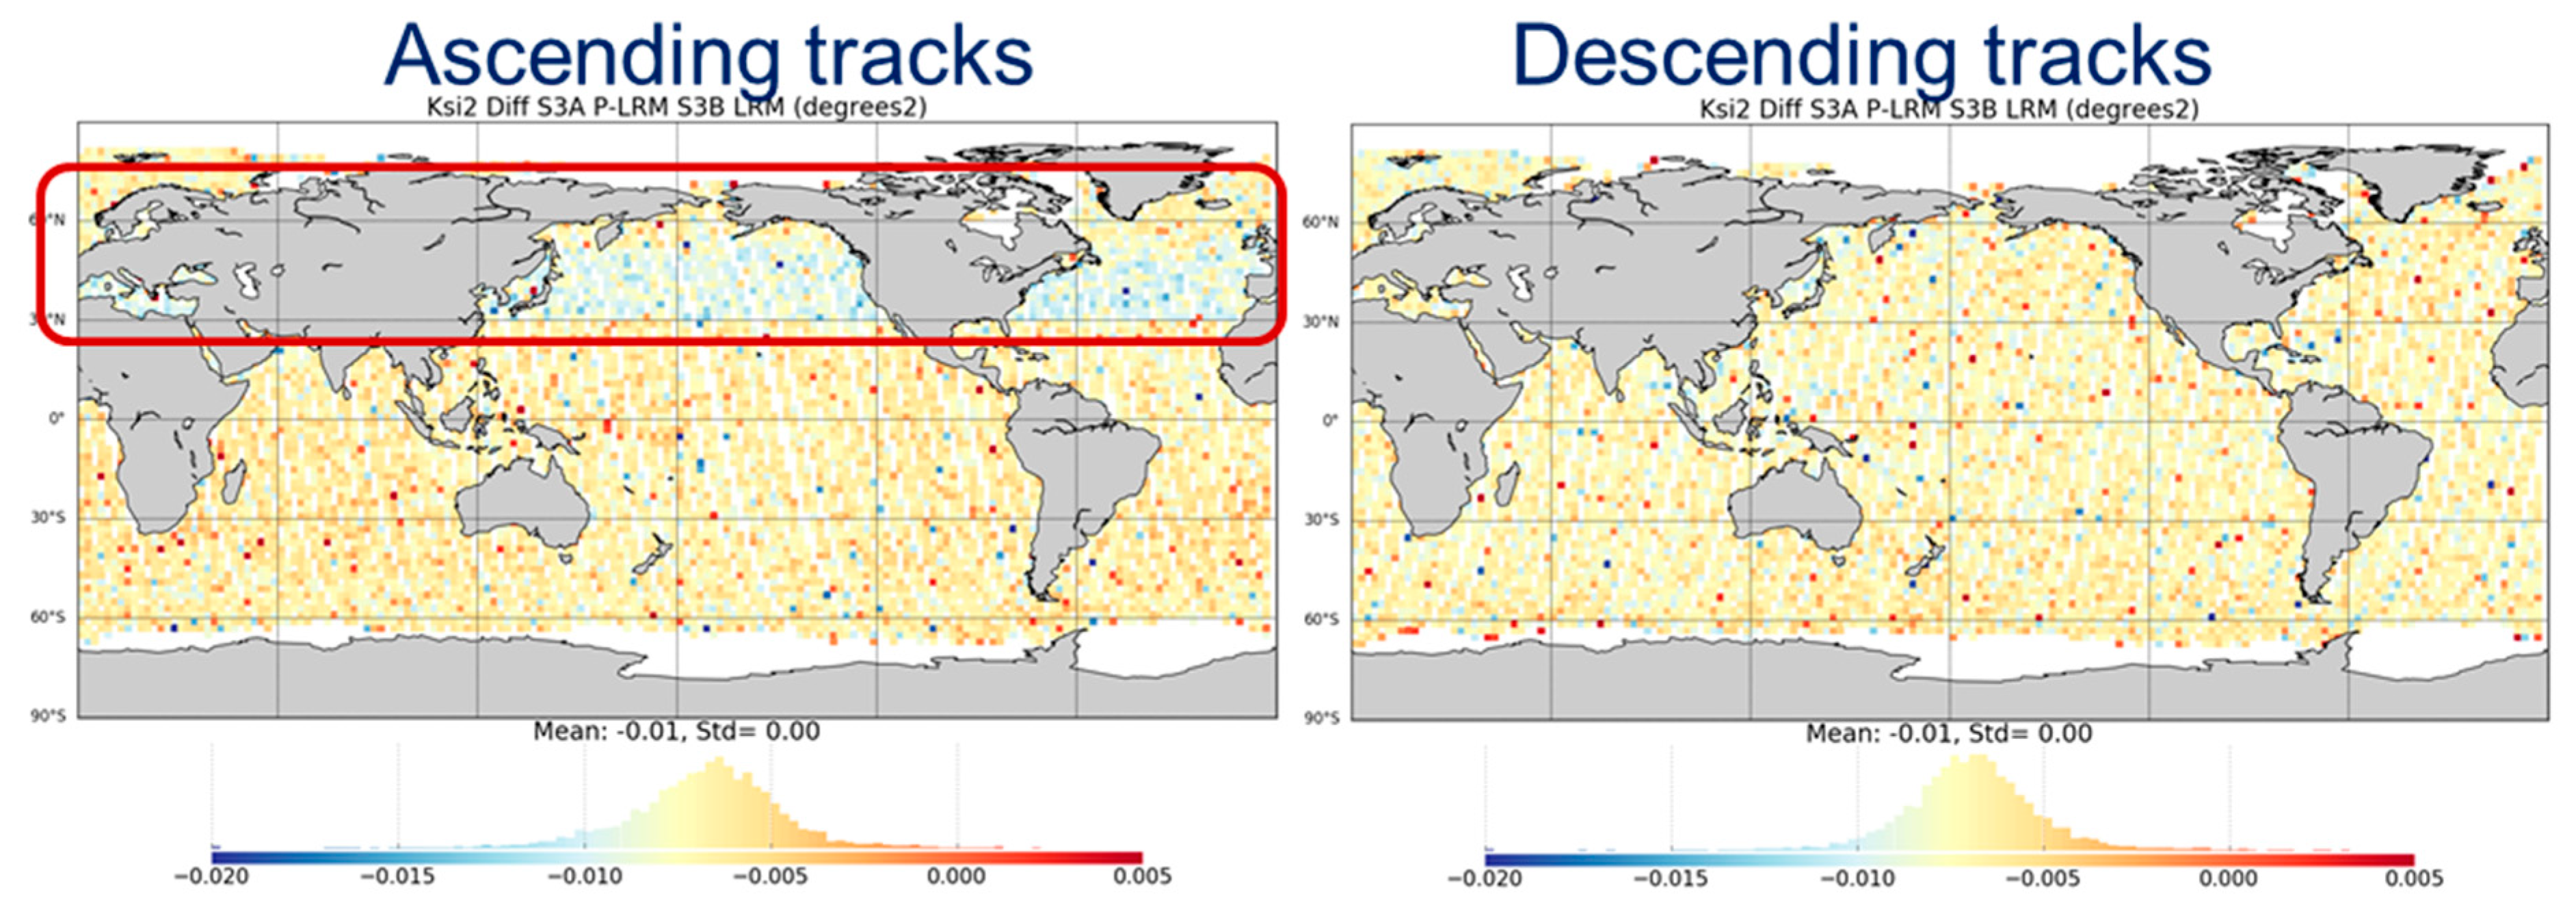
In this subsection, we present an example of the capability of tandem data to reveal minor error sources. It concerns the assessment of regional biases due to orbital effects in comparisons between SRAL-A and B. Comparisons between the two sensors reveal a very small bias in Northern latitudes (30° to 60° North) on ascending tracks, see Figure 4. This difference has been eventually traced back to a waveform mispointing of 0.003 deg² on SRAL-A. This anomaly has never been detected before.

6.2. OLCI Radiometric Differences and Homogenization

For OLCI, the homogenization of the L1 radiance must be performed to adjust for the slight spectral differences between the two sensors. This homogenization corresponds to the smile correction step of the level 2 processing and is more sensitive for spectral channels having either high gradient of the solar irradiance (400 nm), fine absorption features (O2 and H2O absorption bands), and/or sensitive ground spectral signatures (e.g., red-edge at 709 nm).
Cross-comparisons over the homogenized reflectances provide evidence of a persistent radiometric bias between 2% (in the blue) and 1% (in the NIR) between the two sensors, see Figure 5. The S3A harmonization model was established to harmonize the products and validate the benefits for L2 products [21]. Further investigations highlight the necessity of performing flat-fielding prior to harmonization.

6.3. SLSTR Inter-Comparisons

Inter-comparisons of SLSTR-A and B measurements allow verification of the data from thermal infrared channels that would only have been possible with the tandem mission to a level of fidelity not usually possible with standard comparisons using simultaneous-nadir overpass data. At thermal infra-red (TIR) wavelengths, such comparisons are ordinarily difficult because of atmospheric effects and the temporal variability of the surface temperatures, and particularly so for the 55° off-nadir oblique view, where angle matching with other satellite sensors is not generally possible.
The analysis of the tandem phase datasets allows investigation into potential instrumental effects. These include:
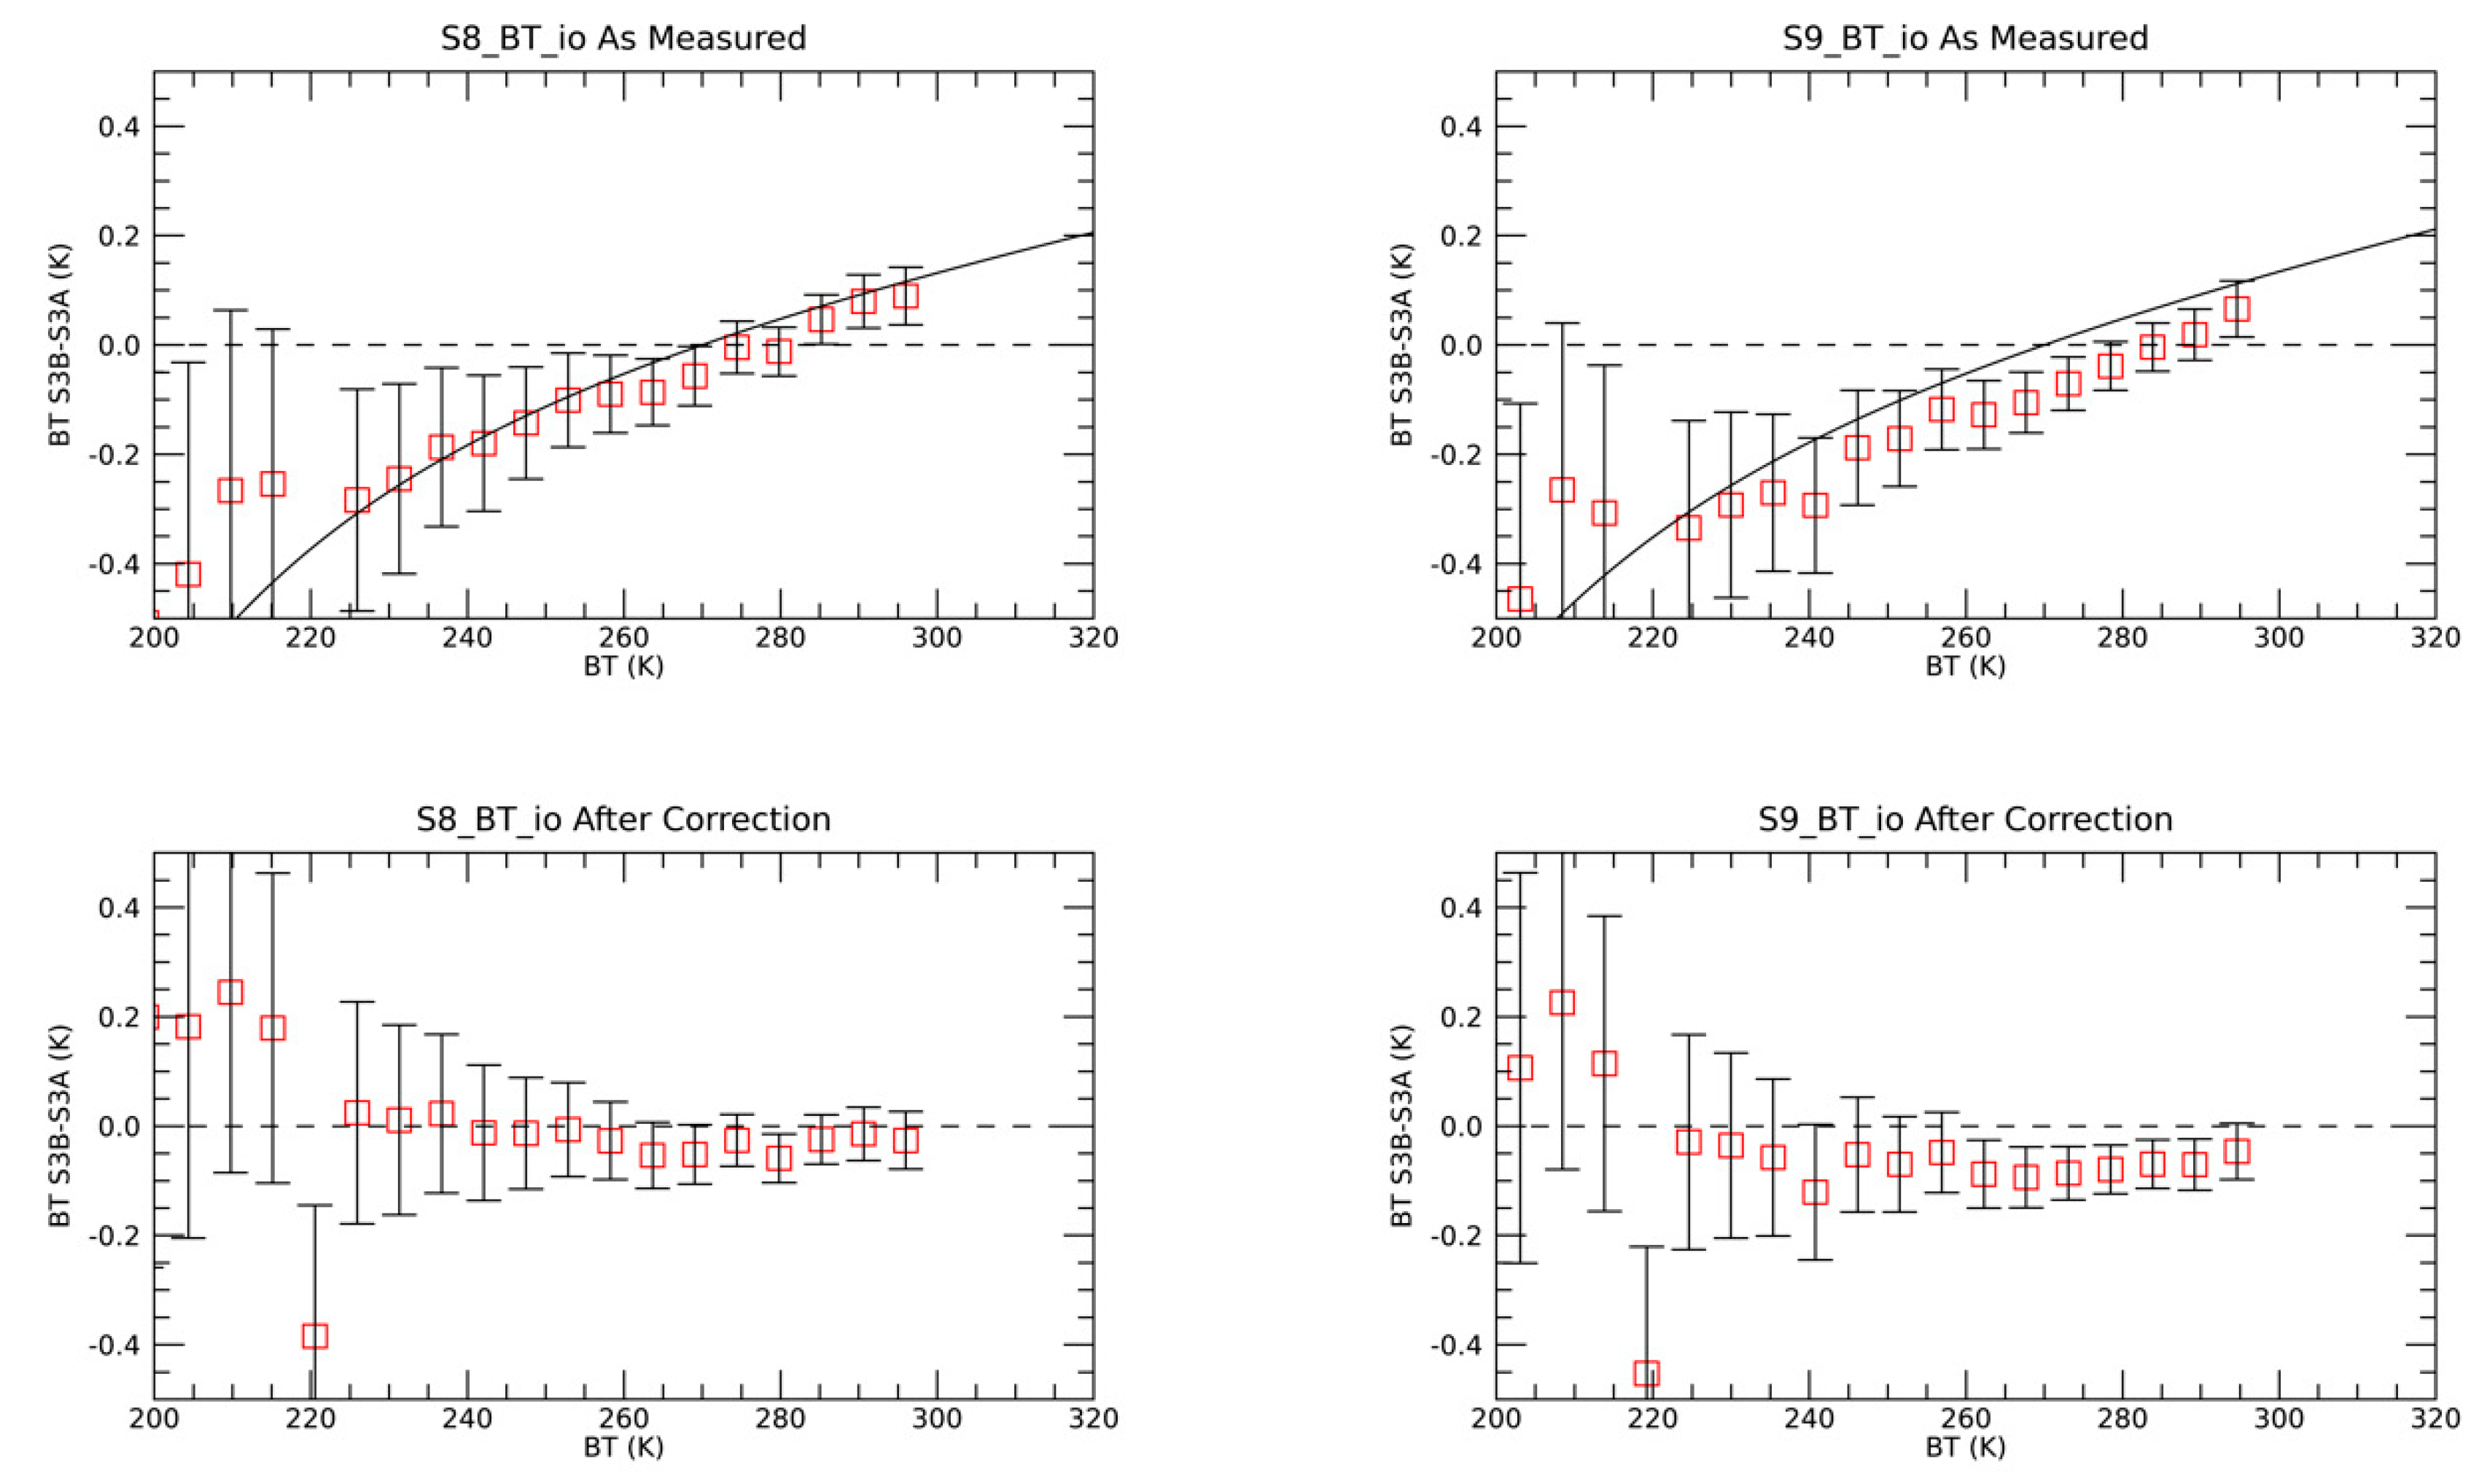
  • Sensor-to-sensor differences. Results are generally found to be within the expected uncertainties, except for channels S8 and S9 in the oblique view, which show differences vs. temperature (Figure 6). These results are consistent with the presence of an internal stray light effect observed during the SLSTR pre-launch calibration campaign [25]. The results of this tandem-phase analysis show the potential benefits of a stray-light correction.
  • Sensitivity to total column water vapor can indicate an issue with sensor spectral response function characterization. No apparent sensitivity is found in the tandem phase data.
The tandem data also provides the opportunity to investigate the time series of differences and connect them to onboard events (see [25] for more details). Figure 7 presents a small transient drop of the S3A/S3B difference observed in early August 2018. This event has followed a change in the S3A focal plane temperature set point and an S3B outgassing operation, both of which may explain the observed change. Such an effect has never been directly observed before, and indeed has been made visible only, thanks to the tandem configuration.

7. Assessment of Measurement Uncertainties

Using the methodology described in Section 4, differences between SLSTR-A and B measurements are compared to the modeled per-pixel uncertainties. For this purpose, we generated histograms of the differences normalized by the estimated uncertainty on the difference. The technique is applied to level 1 (Figure 8) and level 2 sea-surface temperature (SST, Figure 9) measurements. The statistics provide useful insights into the reliability of the uncertainties, the influence of which on the SLSTR view is used, and the consistency of the SSTs between sensors dependent on retrieval algorithm is used.

8. Impact on Climate Change Monitoring

8.1. Impact of Global Mean Sea Level Bias Uncertainty on Trend Detection

A precise estimation of the inter-satellite bias on the global mean sea level (GMSL) is needed to build consistent data records and estimate long-term trends. The tandem configuration provides an optimal configuration to estimate this bias because the two satellites observe exactly the same oceanic conditions. On the other hand, the switch of SRAL-B between several observation modes (see Figure 2 and Section 5) introduces differences in the time series; although a correction can be applied, this will result in additional uncertainty in the bias estimation. During the Sentinel-3 tandem for climate Study, an uncertainty analysis has been performed to quantify these effects and assess their net impact on the bias uncertainty, see Table 2 and Table 3 reports the maximum value on the propagated uncertainty on the GMSL trend for different scenarios:
  • An “ideal” tandem scenario with all cycles performed in SAR open-loop (OL)
  • A tandem phase with switches to SAR closed-loop modes
  • A tandem phase with additional switches to low-resolution mode (LRM): this is the actual Sentinel-3B scenario
  • Estimation from data acquired on the Sentinel-3B final orbit (post-tandem).
This comparison shows that while the GMSL trend uncertainty would be minimal under an “ideal” tandem scenario, operational constraints due to commissioning activities (mode switches) increase the uncertainty to the point where the tandem phase becomes less advantageous than the post-tandem phase for GMSL bias estimation. This finding has important consequences for the planning of future tandem operations, see Section 8.

8.2. Impact of OLCI Uncertainties on Chlorophyll Trend Detection Capabilities

The tandem data has been used to extract measurement noise for OLCI L3 chlorophyll concentration products and evaluate its impact on trend detection capabilities. For this purpose, a synthetic time series is generated as follows:
  • A baseline time series representative of seasonal effects is created by regridding and de-trending ESA OC-CCI v3.1 products;
  • “Observational” noise is added by sampling a zero-mean distribution whose variance matches the one computed for each grid cell in the tandem data;
  • Finally, a global trend in the range of ±2 %yr−1 is added to the time series.
Representative synthetic bootstrap times series is thus created for OLCI-A vicariously adjusted, OLCI-B and OLCI-A aligned to OLCI-B using the harmonization methodology described in Section 6.2. For each time bootstrap, the trend is then estimated using generalized least squares regression. The error between the input trend and the estimated trend reveals the impact of observational noise on trend detection capability.
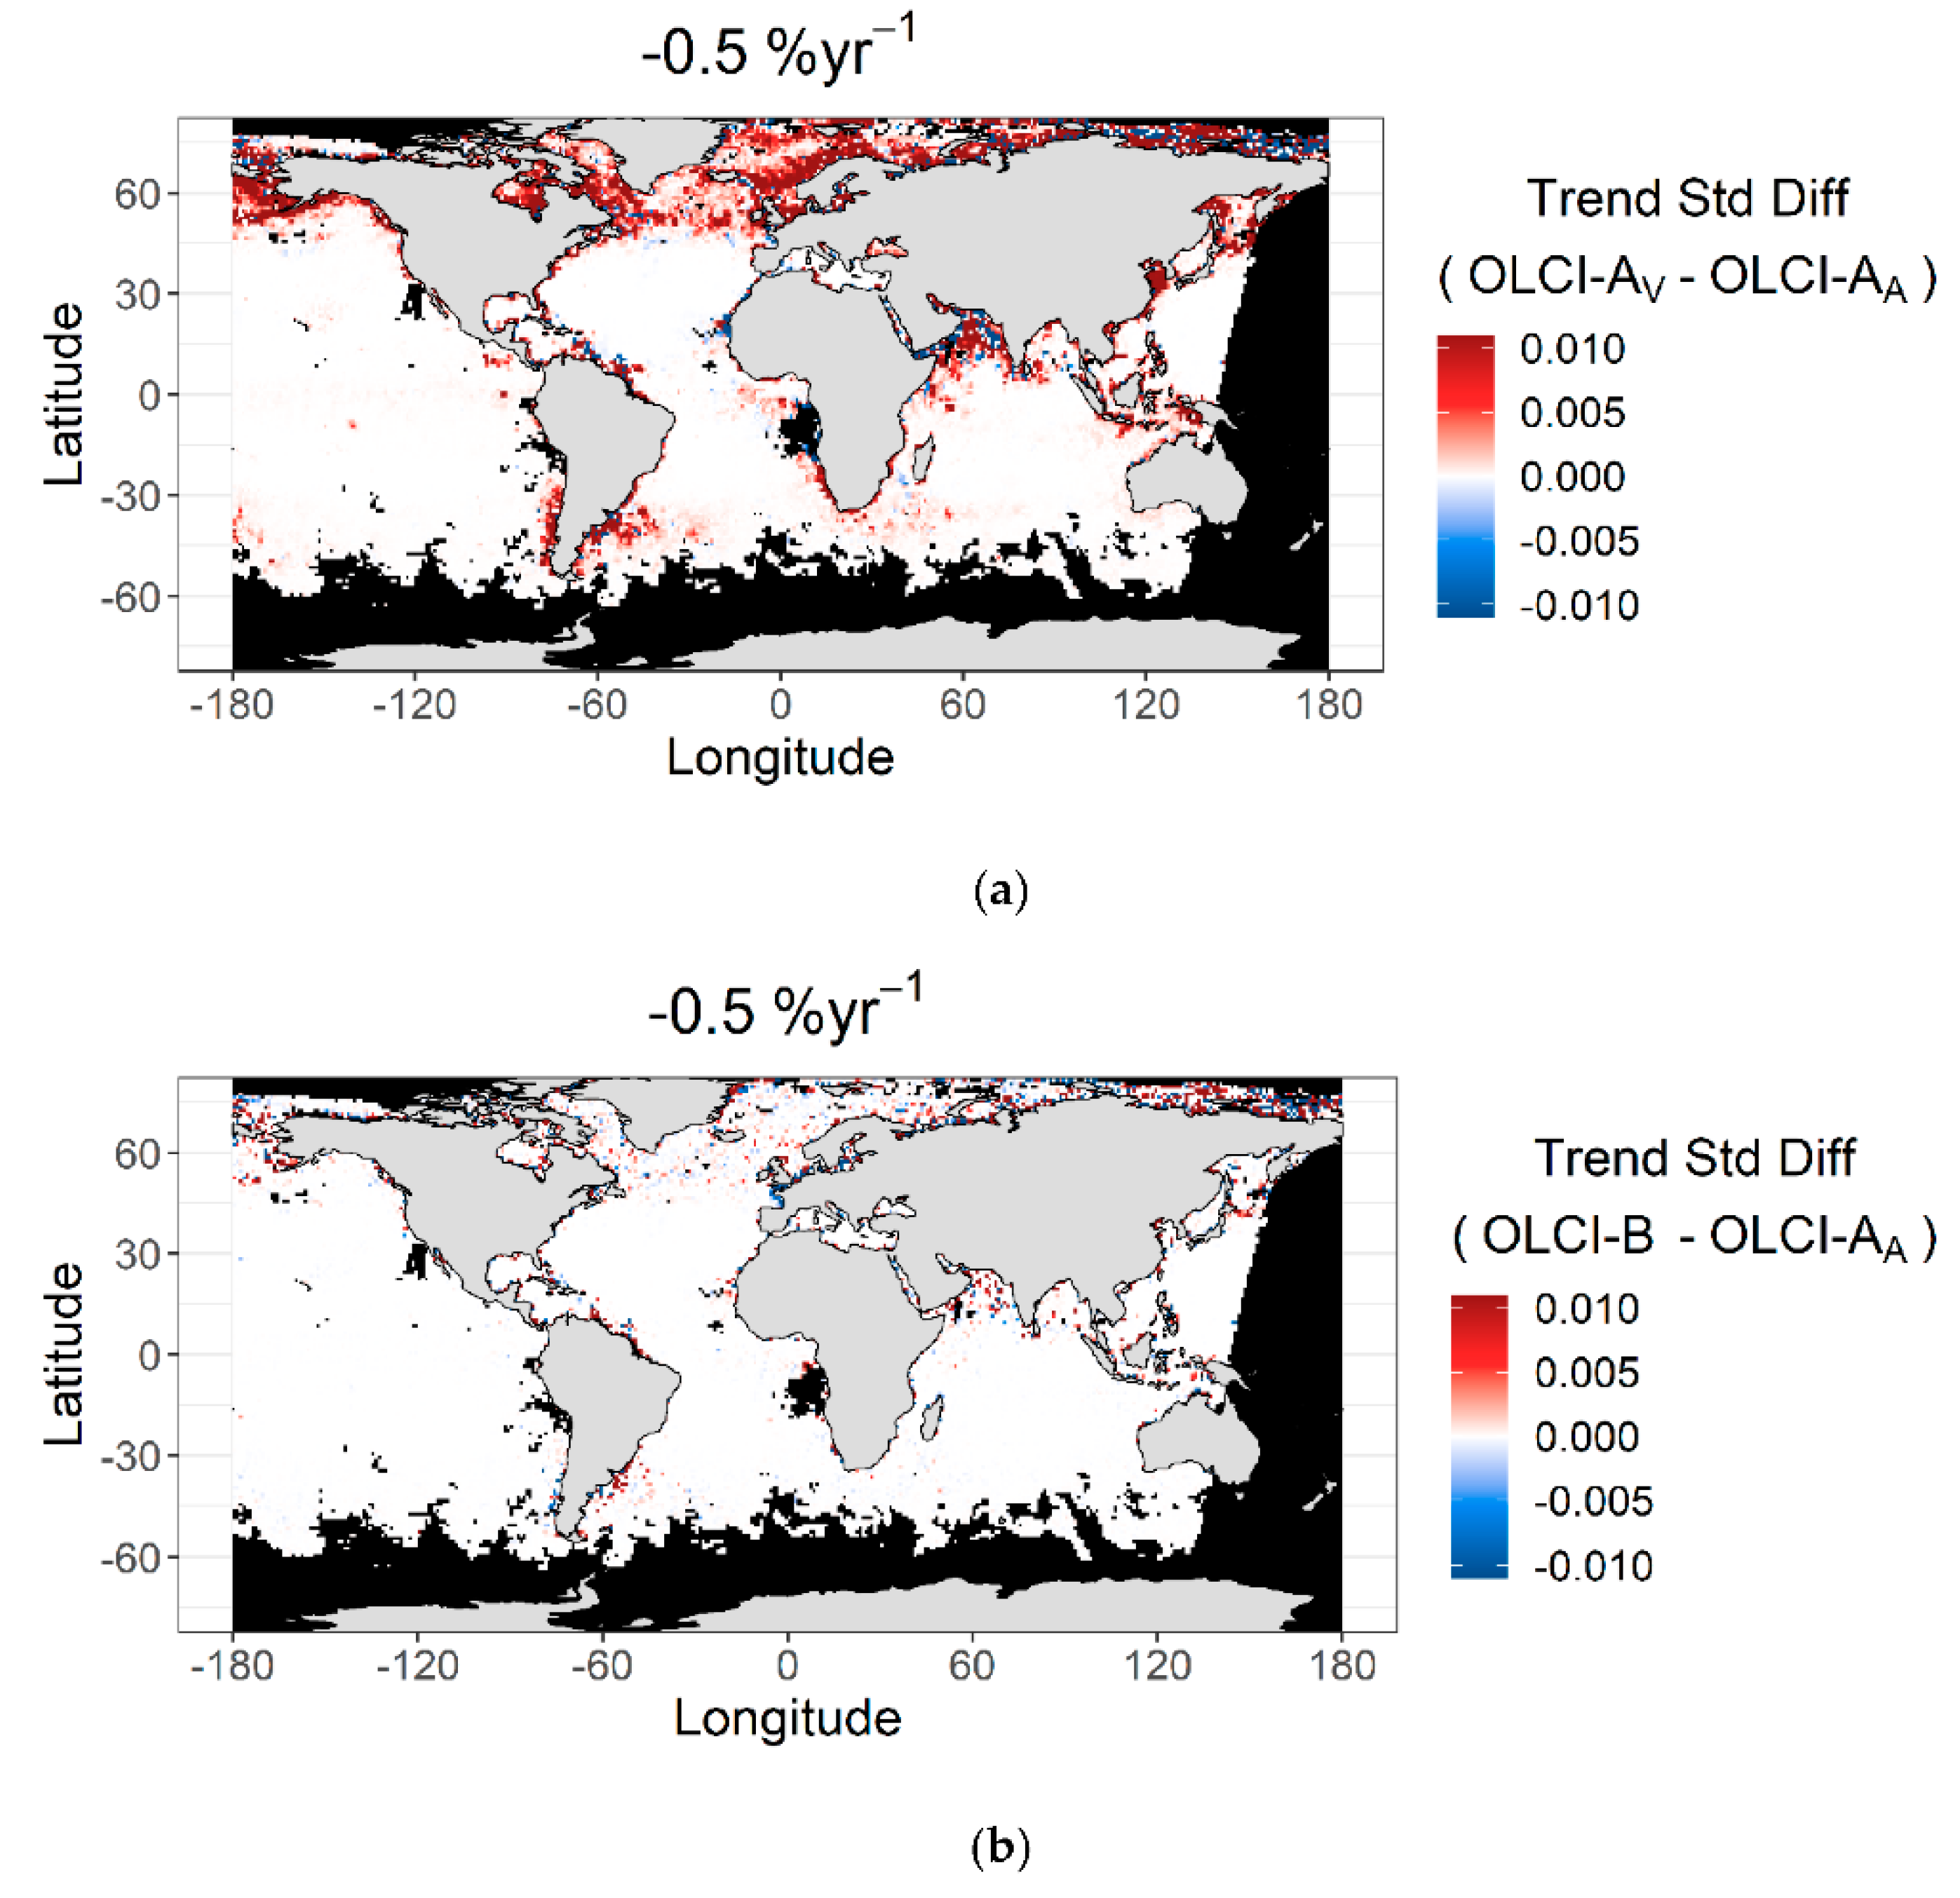
The analysis reveals that the trends are retrieved for all simulated sets without any significant bias and a standard deviation of 0.27 % yr−1. No significant difference in trend detection capabilities is found between the three data sets OLCI-B, OLCI-A vicariously adjusted, and OLCI-A aligned. The OLCI-A-aligned and OLCI-B data sets are found to be most similar. In addition, the analysis identifies spatial patterns in the differences, see Figure 10. The larger differences are found in the high latitudes, possibly because of higher values of the chlorophyll concentration and associated dispersion.

9. Geophysical Signal and Geometric Differences

9.1. Impact of Swell on SAR Altimetry

The thirty-second interval between the two satellites has a generally negligible impact on the measured geophysical variables. But this is not the case for sea surface height measurements in the presence of swell. The time difference between S3A and S3B can be used to assess the impact of the swell signal on SAR altimetry measurements. As displayed in Figure 11, the spectral analyses of tandem phase data show that long ocean waves are responsible for high-frequency sea level anomaly (SLA) signals and that the spatial wavelength corresponds to the swell wavelength. It is even possible to show evidence that the phase shifts observed between the two-satellite acquisitions are consistent with the properties of the propagating waves given by the dispersion relation. Because the 20 Hz SAR mode altimeter processing does not sample fast enough, the high-frequency signals induced by swells are aliased down to lower frequency and mistaken for another signal (see Figure 12). To avoid long-wavelength errors, it is thus advocated to increase the sampling of the SAR-mode processing to provide time-series of SLA altimeter data sets of higher quality.

9.2. SRAL Waveform Consistency over Land Ice

In this section, we provide an initial investigation of the consistency of S3A and S3B acquisitions over land ice. Because this is an overview paper, we focused on a high-level comparison of the waveforms acquired by each altimeter at the same point in space and time; a more detailed quantitative analysis is provided in a companion paper [13], which is dedicated purely to the analysis of tandem phase data over ice sheets. To assess the consistency of waveforms acquired by the Sentinel-3A and Sentinel-3B SRAL instruments, we focused on the ice surface above subglacial Lake Vostok in East Antarctica. This is an established validation site for new altimetry missions [31,32,33,34] due to its low surface gradients and relatively uniform topography. Specifically, we compared cotemporaneous, co-located (within 150 m) acquisitions made during Sentinel-3A’s cycle 34 and Sentinel-3B’s cycle 11 along a ground track crossing the central part of the lake (Figure 13). Because tandem phase acquisitions represent co-located, cotemporaneous, and co-orientated acquisitions, they provide a unique opportunity to isolate the instrument performance, and therefore to check interoperability between the A and B units. Our analysis demonstrates that S3A and S3B are operating with an extremely high level of consistency, with close similarity of waveforms, both in terms of their magnitude and the distribution of backscattered power (i.e., waveform amplitude and shape). This consistency applies both to the waveform leading edge (corresponding to the surface return from the point of closest approach) and the trailing edge (corresponding to any subsurface and off-nadir contribution). This indicates the performance of both instruments in a near-identical manner and, additionally, that small (~100 m) shifts in the imaging location do not substantially impact upon the received echo shape over flat ice surfaces (Figure 13).

9.3. Impact of Viewing Geometry on OLCI Level2 Products

During the drift phase, the distance between the satellite progressively increases, leading to different viewing conditions, as illustrated in Figure 14. Data from two dates, in particular, have been collected in the tandem optical data archive. On 22/10/2018, the along-track separation between the satellites was 3 min. While this time difference hardly affected sun illumination conditions, the difference in viewing angles ranged between 1 and 6 degrees. On 29/10/2018, the separation reached 9 min, while the difference in viewing angles was between 4 and 20 degrees. In these circumstances, it is reasonable to assume that the main differences between Sentinel-3 A and B products come from the impact of viewing conditions rather than from changes in sun illumination or target evolution (provided that the inter-calibration differences observed during the tandem phase are accounted for).
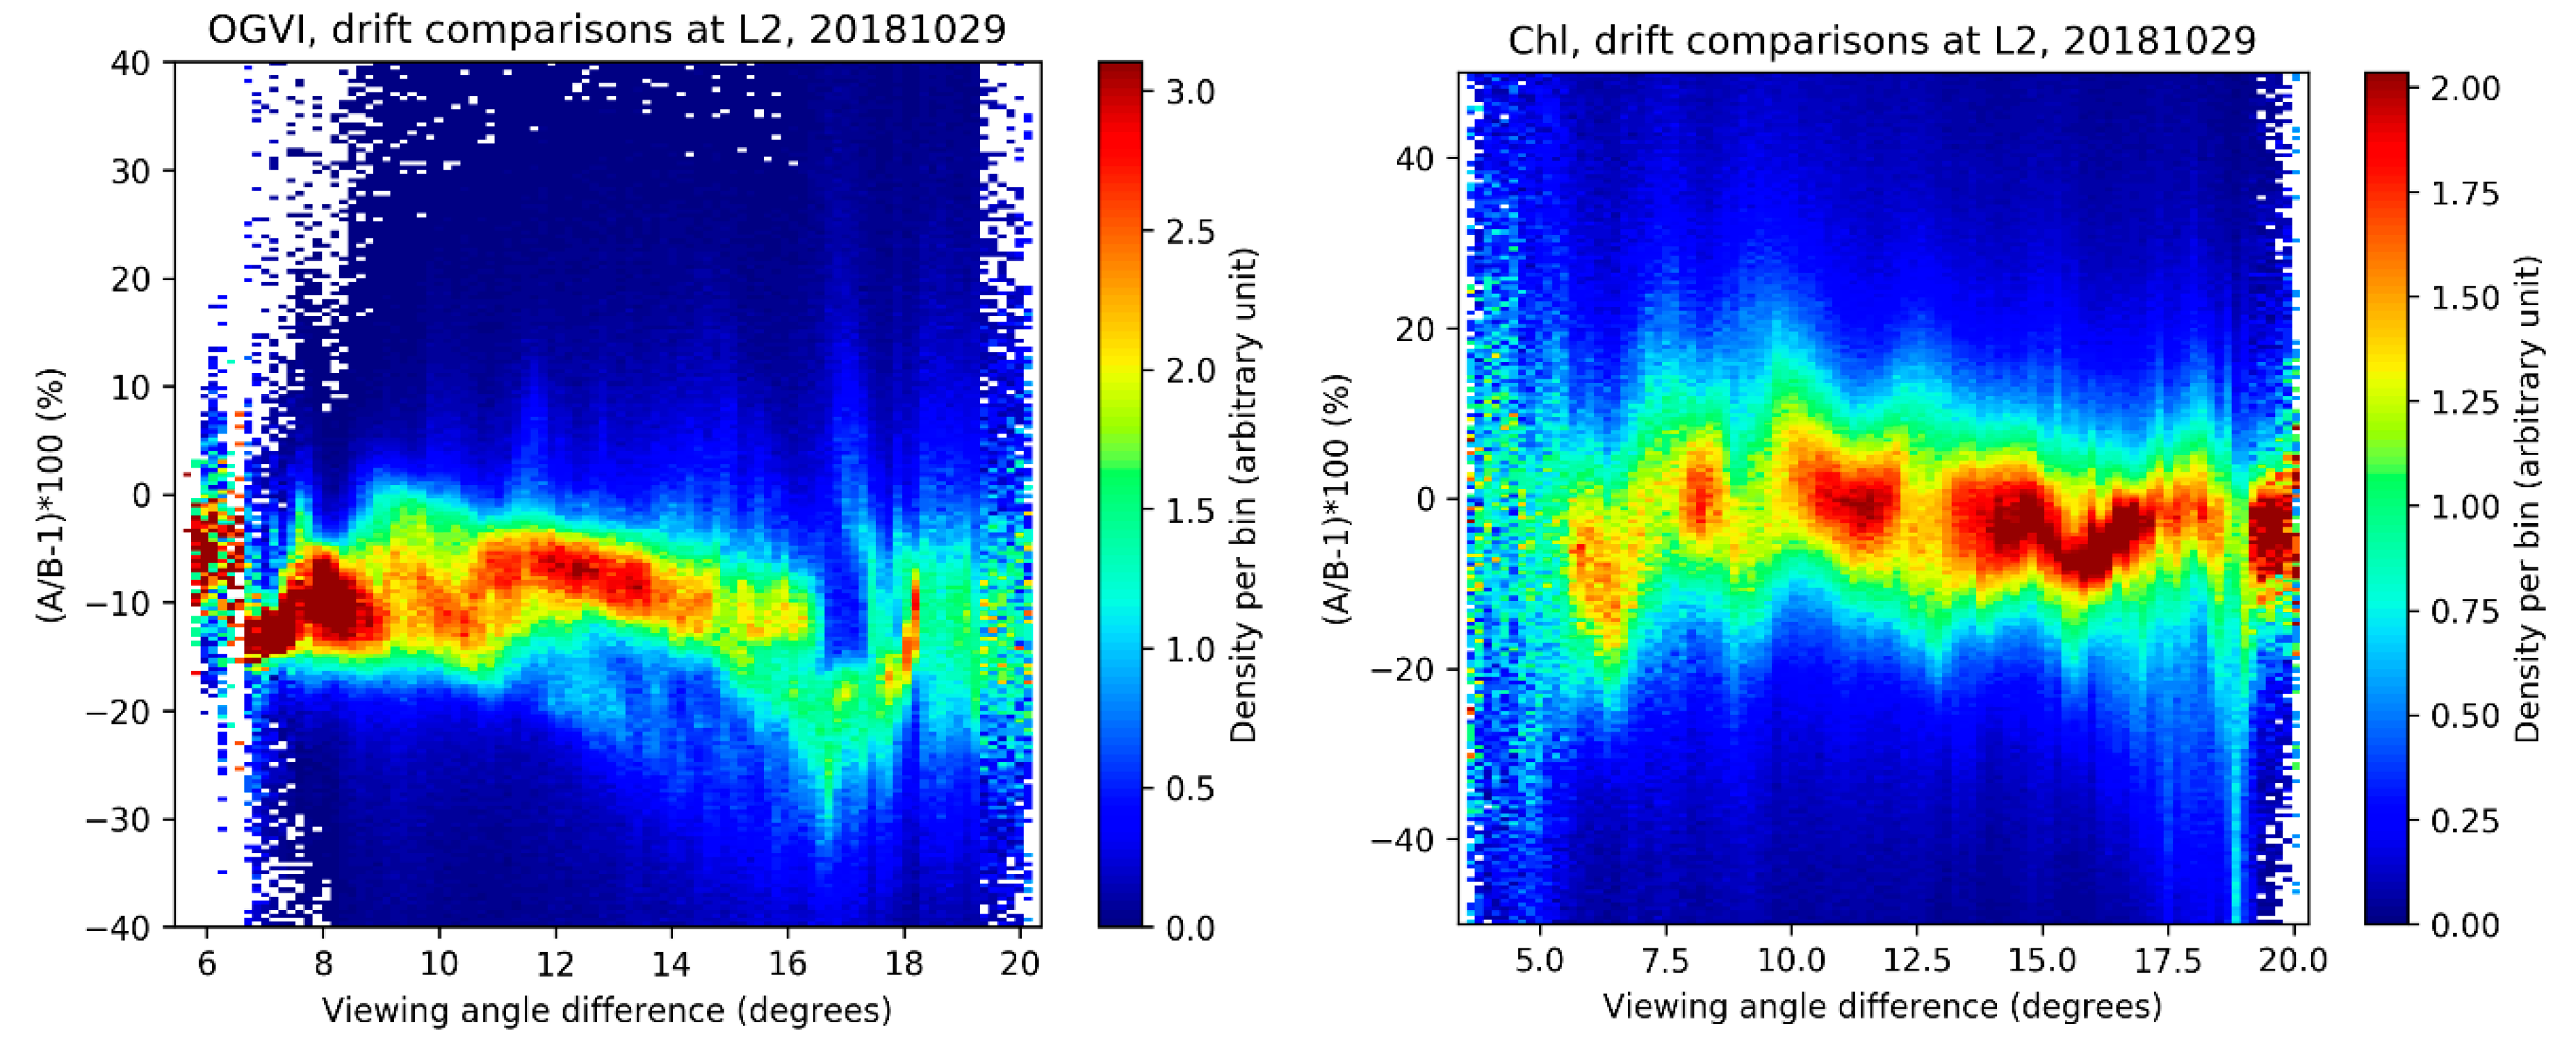
This configuration allows us to investigate the impact of viewing conditions on the retrieval of geophysical parameters in level 2 products. Comparisons of OLCI land and water products reveal some interesting results. While the OLCI green vegetation index (OGVI) algorithm attempts to correct for bi-directional Reflectance Distribution Function (BRDF) effects, differences of 10% or more are observed for angular differences greater than 5°. For the OLCI total chlorophyll index (OTCI) algorithm, inter-satellite differences are shown to be mainly coming from differences in spectral characteristics, highlighting current limitations of the smile correction approach (not shown). Water products (water leaving reflectances and chlorophyll concentration) are shown to be comparatively more robust to changes in viewing conditions. Examples of results are presented in Figure 15; see [23] for complete results. These findings provide meaningful guidance for the future improvement of retrieval algorithms.

10. Discussion

The Sentinel-3 tandem phase has provided very significant results at several levels. Tandem data can be used to precisely quantify the inter-operability of all instruments. Assessment of its impact on climate data records is possible in some cases. Triple collocations studies for altimetry (land ice and sea state) highlight the excellent consistency of the measurements, in terms of accuracy and precision. However, the sea state analysis would have benefitted from a longer tandem period to increase the number of collocation opportunities with buoys.
We have shown that harmonization of OLCI L1 data could improve the interoperability of the sensors. Although the inter-calibration coefficients are shown to be stable during the tandem period, the stability over the mission lifetime is an issue. To address this point, an inter-comparison method based on deep convective clouds (DCC) is recently developed [22]. The method, which can be used throughout the mission lifetime, is shown to reproduce tandem inter-comparison results with 0.5%.
Tandem data has also been used to address some fundamental questions about error sources and uncertainties. The tandem analyses have, for example, quantified the impact of swell on SAR mode altimetry, assessed the validity of SLSTR per-pixel uncertainties, and quantified the impact of uncertainties on trend retrieval capabilities for OLCI ocean color products. In the case of the impact of the swell, we have shown that processing SAR data at 80 Hz greatly reduces aliasing errors on the measurements. Some perspectives for improvement are also identified for OLCI products beyond the harmonization discussed in Section 6.2: flat-fielding or equalization of camera gains, modification of the smile correction approach for red-edge bands. For all these cases, additional investigations or validation work will be required before an operational solution can be implemented.
Another interesting aspect is the possibility to assess the effects of the viewing geometry on optical measurements. During the drift phase at the end of the tandem, the two satellites are acquiring nearly simultaneous observations with different viewing geometries. Preliminary analyses performed during our study show the potential of this dataset to investigate the sensibility of the level-2 retrieval algorithms to geometry or to compare the different views of the SLSTR instrument. However, the investigations are somewhat limited by the scarcity of the collected data and the lack of an optimal calibration. Deeper analyses beyond the scope of the present study would be needed to progress on geometric aspects of level 2 processing.

11. Conclusions and Recommendations for Future Tandem Phases

In view of this experience, we provide a list of recommendations for the implementation of tandem phases for the constellation of earth observation satellites. These conclusions are particularly relevant for future Copernicus missions.
  • A tandem phase should be implemented for satellites operating in constellations whenever possible. This recommendation applies to all types of earth observation missions, as the benefits are found to be equally important for all Sentinel-3 instruments.
  • The duration of the tandem phase must be adapted to the needs of the particular mission. Altimetry missions require a relatively long tandem phase covering several observation cycles. For Sentinel-3C, at least 4 cycles of tandem operations in SAR open-loop mode are considered necessary to reduce the uncertainty on the bias on the global mean sea level to an acceptable level. For the optical mission, the duration shall include enough time for the instrument to reach a stabilized state after launch (radiometrically and geometrically).
  • A time-lag of 30 s between the two satellites is considered appropriate for all analyses. Altimetry studies would probably benefit from several phases with different time lags, in order to assess the impact of different oceanic effects on measurements. Measurements acquired during the post-tandem drift phase can be used to analyze the impact of viewing geometry for optical instruments.
  • A data reprocessing campaign at the end of the commissioning should be planned in order to obtain the best possible data from the commissioning period, corrected for, e.g., inaccuracies in pre-launch characterization, post-launch effects, etc.
  • Whenever possible, inter-satellite differences should be compared to uncertainty assessed from models and budgets.

Author Contributions

Methodology and investigations: N.L., S.E.H., D.S., M.M., J.M., E.W., M.H., C.B., T.M., B.P., M.R., and P.R.; Data curation: S.C. and T.M.; Writing—original draft preparation: S.C.; Writing—review and editing: All; Supervision: C.D. and F.B.; Project administration: S.C.; Project concept and funding acquisition, C.D.; Formal analysis: A.G. All authors have read and agreed to the published version of the manuscript.

Funding

This work has been performed under the European Space Agency Science and Society Contract 4000124211/18/I-EF.

Acknowledgments

Support from EUMETSAT for tandem data collection is acknowledged.

Conflicts of Interest

The authors declare no conflict of interest.

References

  1. Donlon, C.; Berruti, B.; Buongiorno, A.; Ferreira, M.-H.; Féménias, P.; Frerick, J.; Goryl, P.; Klein, U.; Laur, H.; Mavrocordatos, C.; et al. The Global Monitoring for Environment and Security (GMES) Sentinel-3 mission. Remote Sens. Environ. 2012, 120, 37–57, ISSN 0034-4257. [Google Scholar] [CrossRef]
  2. Drusch, M.; Moreno, J.; Del Bello, U.; Franco, R.; Goulas, Y.; Huth, A.; Kraft, S.; Middleton, E.M.; Miglietta, F.; Mohammed, G.; et al. The FLuorescence EXplorer Mission Concept—ESA’s Earth Explorer 8. IEEE Trans. Geosci. Remote Sens. 2017, 55, 1273–1284, no. 3. [Google Scholar] [CrossRef]
  3. Willis, P.; Haines, B.; Bar-Sever, Y.; Bertiger, W.; Muellershoen, R.J.; Kuang, D.; Desai, S. Topex/Jason combined GPS/DORIS orbit determination in the tandem phase. Adv. Space Res. 2003, 31, 1941–1946. [Google Scholar] [CrossRef]
  4. Le Traon, P.Y.; Dibarboure, G. Illustration of the contribution of the tandem mission to mesoscale studies. Mar. Geod. 2004, 27, 3–13. [Google Scholar] [CrossRef]
  5. Dibarboure, G.; Pujol, M.-I.; Briol, F.; Le Traon, P.Y.; Larnicol, G.; Picot, N.; Mertz, F.; Ablain, M. Jason-2 in DUACS: Updated system description, first tandem results and impact on processing and products. Mar. Geod. 2011, 34, 214–241. [Google Scholar] [CrossRef] [Green Version]
  6. Biancamaria, S.; Schaedele, T.; Blumstein, D.; Frappart, F.; Boy, F.; Desjonquères, J.-D.; Pottier, C.; Blarel, F.; Niño, F. Validation of Jason-3 tracking modes over French rivers. Remote Sens. Environ. 2018, 209, 77–89. [Google Scholar] [CrossRef] [Green Version]
  7. Teillet, P.M.; Barker, J.L.; Markham, B.L.; Irish, R.R.; Fedosejevs, G.; Storey, J.C. Radiometric cross-calibration of the Landsat-7 ETM+ and Landsat-5 TM sensors based on tandem data sets. Remote Sens. Environ. 2001, 78, 39–54, Issues 1–2, ISSN 0034-4257. [Google Scholar] [CrossRef] [Green Version]
  8. Sentinel-3 Tandem for Climate Project Website. Available online: http://s3tandem.eu (accessed on 18 August 2020).
  9. Mittaz, J.; Merchant, C.J.; Woolliams, E.R. Applying principles of metrology to historical Earth observations from satellites. Metrologia 2019, 56, 032002, Number 3. [Google Scholar] [CrossRef]
  10. Ablain, M.; Cazenave, A.; Larnicol, G.; Balmaseda, M.; Cipollini, P.; Faugère, Y.; Fernandes, M.J.; Henry, O.; Johannessen, J.A.; Knudsen, P.; et al. Improved sea level record over the satellite altimetry era (1993–2010) from the Climate Change Initiative project. Ocean Sci. 2015, 11, 67–82. [Google Scholar] [CrossRef] [Green Version]
  11. Zawadzki, L.; Ablain, M.; Thibaut, P.; Prandi, P. Estimating a Drift in TOPEX—A Global Mean Sea Level Using Poseidon—1 Measurements; paper presented at the OSTST meeting; OSTST: La Rochelle, France, November 2016. [Google Scholar]
  12. Sentinel-3 Tandem Mission Activity Timeline. Available online: https://s3tandem.eu/?mdocs-file=410 (accessed on 18 August 2020).
  13. C-TEP Data Exploitation Platform. Available online: https://c-tep.eu/geobrowser (accessed on 18 August 2020).
  14. Sentinel-3 Tandem Altimetry Archive. Available online: https://web-s3tc.dias.groupcls.com (accessed on 18 August 2020).
  15. Sentinel-3 Product Notice. Available online: https://sentinel.esa.int/documents/247904/2753172/Sentinel-3-Product-Notice-STM-Level-2-Land (accessed on 17 August 2020).
  16. Rieu, P.; Moreau, T.; Cadier, E.; Raynal, M.; Clerc, S.; Donlon, C.; Borde, F.; Boy, F.; Maraldi, C. Exploiting the Sentinel-3 Tandem Phase Dataset and Azimuth Oversampling to Better Characterize the Sensitivity of SAR Altimeter Sea Surface Height to Long Ocean Waves. Adv. Space Res. 2020. submitted for publication. [Google Scholar]
  17. McMillan, M.; Muir, A.; Shepherd, A.; Donlon, C. Assessment of Sentinel-3 Tandem Phase Altimetry over Ice Sheets. Cryosphere 2020. submitted for publication. [Google Scholar]
  18. Banks, C.; Gommenginger, C.; Calafat, F.M.; Dayoub, N.; Snaith, H.M.; Wimmer, W.; Hammond, M.; Timmermans, B. Evaluation of Sea State Products from the Sentinel-3A and Sentinel-3B Tandem Phase. In Proceedings of the Ocean Sciences meeting, San Diego, CA, USA, 16–21 February 2020. [Google Scholar]
  19. Banks, C.; Hammond, M.; Wimmer, W.; Snaith, H.; Gommenginger, C. Assessment of Sentinel-3A and Sentinel-3B sea state products during the tandem phase using in situ and reanalysis data. 2020. in preparation. [Google Scholar]
  20. Picard, B.; Bennartz, R.; Fell, F.; Denneulin, M.-L.; Siméon, M.; Donlon, C. Assessment of the ”Zero-Bias Line” Homogenization 1 Method for Microwave Radiometers Using Sentinel-3A and Sentinel-3B Tandem Phase. Remote Sens. 2020. submitted for publication. [Google Scholar]
  21. Lamquin, N.; Clerc, S.; Bourg, L.; Donlon, C. OLCI A/B tandem phase analysis, part 1: Level 1 homogenisation and harmonisation. Remote Sens. 2020, 12, 1804. [Google Scholar] [CrossRef]
  22. Lamquin, N.; Clerc, S.; Bourg, L.; Donlon, C. OLCI A/B tandem phase analysis, part 3: Post-tandem monitoring of cross-calibration from statistics of Deep Convective Clouds observations. Remote Sens. 2020. in revision. [Google Scholar]
  23. Lamquin, N.; Deru, A.; Clerc, S.; Bourg, L.; Donlon, C. OLCI A/B Tandem Phase Analysis, Part 2: Benefits of Sensors Harmonization for Level 2 Products. 2020. in revision. [Google Scholar] [CrossRef]
  24. Hammond, M.L.; Henson, S.A.; Lamquin, N.; Clerc, S.; Donlon, C. Assessing the Effect of Tandem Phase Sentinel 3 OLCI Sensor Uncertainty on the Estimation of Potential Ocean Chlorophyll Trend. Remote Sens. 2020, 12, 2522. [Google Scholar] [CrossRef]
  25. Smith, D.L.; Barillot, M.; Bianchi, S.; Brandani, F.; Coppo, P.M.; Etxaluze, M.; Frerick, J.; Kirschstein, S.; Lee, A.; Maddison, B.J.; et al. Sentinel-3A/B SLSTR Pre-Launch Calibration of the Thermal Infrared Channels. Remote Sens. 2020, 12, 2510. [Google Scholar] [CrossRef]
  26. Samuel, E.; Hunt; Jonathan, P.D.; Mittaz; David, L.; Smith; Polehampton, E.; Yemelyanova, R.; Emma; Woolliams, R.; et al. Level 1 and Level 2 Comparison of the Sentinel-3A/B SLSTR Tandem Phase Data Using Metrological Principles. Remote Sens. 2020. in revision. [Google Scholar]
  27. Tokmakian, R.; Challenor, P.G. On the joint estimation of model and satellite sea surface height anomaly errors. Ocean Model. 1999, 1, 39–52, no. 1. [Google Scholar] [CrossRef]
  28. O’Carroll, A.G.; Eyre, J.R.; Saunders, R.W. Three-Way Error Analysis between AATSR, AMSR-E, and In Situ Sea Surface Temperature Observations. J. Atmos. Ocean. Technol. 2008, 25, 1197–1207. [Google Scholar] [CrossRef] [Green Version]
  29. US National Data Buoy Center. Available online: https://www.ndbc.noaa.gov (accessed on 18 August 2020).
  30. ERA-5 Data Archive. Available online: https://apps.ecmwf.int/data-catalogues/era5 (accessed on 18 August 2020).
  31. Richter, A.; Popov, S.V.; Fritsche, M.; Lukin, V.V.; Matveev, A.Y.; Ekaykin, A.A.; Lipenkov, V.Y.; Fedorov, D.V.; Eberlein, L.; Schröder, L.; et al. Height changes over subglacial Lake Vostok, East Antarctica: Insights from GNSS observations (2014). J. Geophys. Res. 2014, 119. [Google Scholar] [CrossRef] [Green Version]
  32. Schröder, L.; Richter, A.; Fedorov, D.V.; Eberlein, L.; Brovkov, E.V.; Popov, S.V.; Knöfel, C.; Horwath, M.; Dietrich, R.; Matveev, A.Y.; et al. Validation of satellite altimetry by kinematic GNSS in central East Antarctica. Cryosphere 2017, 11, 1111–1130. [Google Scholar] [CrossRef] [Green Version]
  33. Shuman, C.A.; Zwally, H.J.; Schutz, B.E.; Brenner, A.C.; DiMarzio, J.P.; Suchdeo, V.P.; Fricker, H.A. ICESat Antarctic elevation data: Preliminary precision and accuracy assessment. Geophys. Res. Lett. 2006, 33, L07501. [Google Scholar] [CrossRef]
  34. McMillan, M.; Muir, A.; Shepherd, A.; Escola, R.; Roca, M.; Aublanc, J.; Thibaud, P.; Restano, M.; Ambrozio, A.; Benveniste, J. Sentinel-3 Delay-Doppler altimetry over Antarctica. Cryosphere 2019, 13, 709–722, no. 2. [Google Scholar] [CrossRef] [Green Version]
Figure 1. The main phases of the Sentinel-3B tandem operations.
Remotesensing 12 02668 g001
Figure 2. Sentinel-3A and -3B tandem phase altimetry chronology.
Remotesensing 12 02668 g002
Figure 3. Buoy match-up results for significant wave height (SWH) Sentinel-3 and buoys. Labels identify variables plotted on the x-axis and y-axis. Histograms on diagonal relate to the variable identified on the x-axis. Scatterplots show data as grey dots, the least-square fit line in red, and the one-to-one line in blue. Each scatterplot includes the Pearson correlation coefficient (R; those that are significant at the 0.05 level are marked by *) and the number of data pairs (N).
Remotesensing 12 02668 g003
Figure 4. Mispointing angle differences between Sentinel-3 A and B for ascending (left panel) and descending passes (right panel).
Remotesensing 12 02668 g004
Figure 5. Inter-calibration model for the relative error of OLCI-B with respect to OLCI-A, obtained after fitting a 5th order polynomial for the measured differences for each camera. The estimated uncertainty on the model is better than 0.5%, an achievement that would not be possible without tandem operations. Reprinted from [21].
Remotesensing 12 02668 g005
Figure 6. Differences in oblique view S8 (left column) and S9 (right column) brightness temperatures (reprinted from [25]). The top-frames show the as-measured results compared against the stray-light model. The lower frames show the results after correction.
Remotesensing 12 02668 g006
Figure 7. Time series of differences between SLSTR-A and SLSTR-B for the S9 infrared channel in the nadir view for night-time data for 280 ± 0.5 K scenes during the tandem phase. The time series shows the coincidence of the evolution of the detector temperatures of the instruments and the measurement differences. For SLSTR-A, the set point of the detectors is adjusted by 1 K, while for SLSTR-B, decontamination is performed, both for operational reasons.
Remotesensing 12 02668 g007
Figure 8. Example of SLSTR L1 per-pixel uncertainty validation for the nadir (left) and oblique (right) views. Blue: histogram of normalized differences. Black: normal distribution (solid) and 3-sigma values (dashed). The comparison reveals a general under-estimation of the uncertainties, while the bimodal distribution on the oblique viewpoints to an instrumental effect not properly accounted for in the uncertainty model. Reprinted from [25].
Remotesensing 12 02668 g008
Figure 9. Left: Histogram of A-B SST differences, per retrieval algorithm (N2-blue, N3-green, D2-red, D3-cyan). Right: normalized differences for each retrieval algorithm. All data are for quality level 5. The raw histogram reveals that, in general, the two instruments provide very similar SSTs. The histograms of normalized differences reveal an over-estimation of the N2 retrieval uncertainty, a fair estimation for the N3 and D2 retrievals, and an under-estimation for the D3 algorithm. Reprinted from [25].
Remotesensing 12 02668 g009
Figure 10. The global map at 1° resolution of the differences between the standard deviation of all trend estimates from all bootstraps for an input trend of −0.5 % yr−1 for (a) S3A-aligned and S3B, and (b) S3A-vicarious and S3B in each grid cell. Red indicates that the latter dataset in each pair has a higher standard deviation of trend estimates than the former dataset in each pair. Reprinted from [24].
Remotesensing 12 02668 g010
Figure 11. Left: Spectral analysis of 80-Hz sea-level anomaly showing an energy bump in the power spectral density (PSD), high magnitude squared coherence (MSC) value, and decreasing phase shift around the swell wavelength. Right: WAVEWATCHIII wave spectrum showing strong swell partition with 16.4 s period and 200° angle wrt track. Reprinted from [16].
Remotesensing 12 02668 g011
Figure 12. S3-A and S3-B radargrams exhibiting distorted waveforms and SLA oscillations due to aliasing. Reprinted from [16].
Remotesensing 12 02668 g012
Figure 13. Repeatability of S3A and S3B tandem acquisitions above subglacial Lake Vostok, East Antarctica. Panel a: the locations of satellite tracks (white) and the acquisitions shown in panels bi (turquoise); the background image is taken from the MODIS Mosaic of Antarctica. Panels bi: co-located, contemporaneous, and co-orientated (within 150 m) tandem phase waveforms acquired by S3A (blue) and S3B (magenta), demonstrating excellent agreement between S3A and S3B acquisitions.
Remotesensing 12 02668 g013
Figure 14. Geometric acquisition differences during the tandem (left) and post-tandem drift phase (right). While the geometric conditions are almost identical for both satellites during the tandem phase, the sensor acquire the same target with significantly different viewing conditions during the drift phase.
Remotesensing 12 02668 g014
Figure 15. Inter-satellite comparisons of OLCI level 2 products OGVI (left) and chlorophyll concentration (right) during the drift phase: histograms of relative differences as a function of the differences in viewing angles. OGVI shows a relatively strong dependency on the viewing angle, while the chlorophyll retrieval algorithm seems to be immune to such geometric effects. Reprinted from [23].
Remotesensing 12 02668 g015
Table 1. Overview of the Sentinel-3 tandem for climate analyses.
SensorProductsAnalysesOutcome and Lessons LearnedReferences (Paper or Subsection)
SRALSSHSignal correlation under different swell conditionsQuantified impact of swell on SAR acquisitions[16]
SRALIce surface heightComparisons at different sites
Triple co-location with IceBridge measurements
Sentinel-3A and B are statistically indistinguishable on land ice.
Accuracy ranges from the order of ~0.1 m (inland regions) to ~1 m (coastal regions).
[17] and Section 9.2
SRAL SWH, WSTriple collocations with buoys and models
Statistics per mode and region
Very good agreement between S3A and S3B[18,19] and Section 5.2
MWRBTAlternative harmonization methodHarmonization accuracy better than 0.5 K obtained[20]
OLCIL1Across-track profiles
Statistics per target classes
Temporal stability
OLCI-A brighter than OLCI-B
After empirical flat-fielding, differences are linearly decreasing with a spectral wavelength
Possible non-linearity effects and impact of stray-light correction in camera
Homogenization and harmonization prototyped and validated
[21] and Section 6.2
OLCIL1 over deep convective cloudsAcross-track uniformity cross-calibration temporal stability out of tandemAlthough not as precise as tandem analyses, independent analysis over DCCs (monthly statistics) allows quantifying (between 0.5% and 1% precision) the relative calibration of OLCI-A and OLCI-B out of tandem phase[22]
OLCIL2 land and waterImpact of L1 harmonization
Impact of spectral response differences
Impact of viewing geometry
L1 harmonization more efficient than L2 vicarious calibration for water products
OGVI (land product) better aligned after harmonization
OTCI mostly sensitive to spectral differences
[23] and Section 9.3
OLCI L3 waterTrend retrieval on simulated datasetsTrend detection capabilities of the Sentinel-3 constellation confirmed[24] and Section 8.2
SLSTRL1Sensibility studies (WV, signal linearity)
Temporal stability
Uncertainty validation
Low differences between SLSTR-A and B nadir view, slightly higher for oblique view
Non-linearity effects observed, most likely due to internal background signal
Uncertainty under-estimated for oblique view
[25,26] and Section 6.3
SLSTR L2 SSTUncertainty validation
Impact of retrieval algorithm and quality level
The agreement is generally good, with notable differences for some algorithms and quality level
[26] and Section 7
SST: sea surface temperature; SWH: significant wave height; WS: wind speed; BT: brightness temperature; OGVI: OLCI green vegetation index; OTCI: OLCI total chlorophyll index; WV: water vapour.
Table 2. GMSL bias uncertainty budget, comparisons between estimations on the tandem and final orbits.
GMSL Bias Uncertainties (2-Sigmas) (mm)Tandem Phase
(5 Cycles)
Final Orbits
(5 Cycles)
SourcesEstimation MethodSARPLRMSARPLRM
Ocean variability (orbit)CMEMS L4 extraction0.061.1
Instrument acquisition modes GMSL corrections2.321.60--
SSH measurementsMonte Carlo0.300.650.400.60
Total uncertainty2.341.721.161.24
PLRM: pseudo-low-resolution mode; CMES: Copernicus maritime environment monitoring service.
Table 3. Maximum GMSL trend uncertainty (mm/yr) resulting from the S3A/B bias uncertainty for various scenarios.
Maximum GMSL Trend Uncertainty (2-Sigma) (mm/Year)SARPLRM
Ideal tandem (5 cycles in SAR OL)0.130.26
Tandem with SAR OL/CL switch0.70-
Tandem with LRM and SAR OL/CL switches (actual S3B tandem)0.940.70
Final orbits0.450.48
OL: open-loop; CL: closed-loop.