1. Introduction
Urbanization has become a global trend affecting most of the world’s citizens. According to the World Urbanization Outlook (2018 revision) [
1], approximately 55% of the world’s population is actually living in urban areas and is expected to increase to 68% by 2050. With the acceleration of urbanization, accurate and timely global human presence information becomes essential for risk assessment, infrastructure planning, population estimation and economic construction as well as to support sustainable urban development [
2].
Satellite remote sensing has been widely recognized as the most economical and feasible approach to derive human settlement information over large areas [
3,
4]. Most of the current regional or global land cover products are based on time–series optical satellite data [
5,
6,
7,
8,
9,
10,
11,
12,
13,
14,
15,
16], and have been formed by a series of data sets and algorithms [
17,
18,
19]. These data have also been widely used in cities, but the extraction results of urban areas cannot meet the needs of urban change detection. Due to the data availability problems caused by rainy and cloudy weather—as well as the large amount of data and computation involved—the mapping of regional or global city boundaries using optical data are still a major challenge.
Compared to optical data, synthetic aperture radar (SAR) data have the advantages of observing the land surface because of their all-weather/all-time capability and unique information content [
20]. SAR data have been increasingly investigated for global urban extent extraction at various spatial resolutions with promising results. In 2012, Esch et al. [
21] of DLR in Germany validated the potential of high-resolution X-band data for the automated mapping of settlement areas. Several years later, the group introduced the Urban Footprint Processor (UFP), a novel unsupervised and fully automated system from the TanDEM-X mission (TDM) [
22]. Then, inspired by the findings of several studies [
23,
24,
25,
26], the UFP suite was optimized and modified by adding an automated postediting module aiming at the elimination of false positive alarms. The methodology was then applied at a global scale and resulted in the global urban footprint (GUF) dataset with a spatial resolution of 12 m [
27]. Gamba and Lisini et al. [
28] developed a fast and efficient method for global urban extent mapping using ENVISAT ASAR wide swath mode data with 75-m resolution, and the results are more accurate than the existing global datasets, including GlobCover 2009. To evaluate ENVISAT SAR data for global urban mapping, one group developed the KTH-Pavia urban extractor to effectively extract urban extent and small towns using ENVISAT ASAR 30 m data [
29]. Since the Sentinel-1 images were published and shared globally, some scholars have attempted to extract global human settlements based on Sentinel-1 data. Ban et al. [
30] used Sentinel-1A SAR data to evaluate the KTH-Pavia urban extractor for urban extent extraction and preliminarily determined that the Sentinel-1A stripmap mode is very suitable for urban extraction, reaching accuracy more than 83%. This attempt lays a foundation for the extraction of new generation human settlements. Cao et al. [
31] introduced the spatial indicator and texture feature together with the intensity of Sentinel-1 SAR data to the seed selection procedure and successfully extracted the built-up areas of cities in China.
At present, the traditional algorithms applied to SAR urban area extraction are mainly the threshold method based on intensity and texture features [
27,
28,
32], support vector machine (SVM) [
33], neural network [
34], etc. In recent years, deep learning has made remarkable achievements in the field of classification and target recognition [
35,
36,
37,
38,
39]. Many scholars use deep-learning methods to solve the problem of multiscale distribution of building area in SAR data. Based on the abundant building feature information in SAR data, Li et al. [
40] proposed a multiscale convolution neural network composed of CNN84, CNN42 and CNN14 which realized multiscale and multilevel feature extraction. Gao et al. [
41] employed transfer learning to extract building areas in SAR images. To solve the problem of insufficient receptive field of convolutional neural network, the context network was used to enhance the original network, and the detection result was better than that of multiscale CNN method. Wu et al. [
42] proposed a multiscale structured network to solve the problem of multiscale distribution of building areas in SAR data.
These methods solved the problem of multiscale distribution of buildings in SAR images to some extent, but they have not been applied to large-scale mapping of complex terrain and multicategory buildings. To date, there are two main problems in building-area extraction under the complex background of large regions: (1) Omission errors: Low-rise buildings—such as villages in cities and scattered villages in rural areas—present low backscattering values in SAR images, which are prone to be missed. Some flat-roofed buildings are dominated by single scattering, and the scattering echo is relatively weak. Under some imaging conditions, only linear outlines are displayed in SAR image, which are easy to be omitted; (2) Commission errors: Some roads, bridges and ships exhibit high backscattering and texture characteristics similar to building areas, which easily lead to misclassification.
Therefore, in order to accurately delineate building areas, it is necessary to obtain deeper texture feature information of buildings; a network must have the extraction performance of building areas with large-scale changes. Thus, in this paper, a pyramid multiscale building-area extraction network is designed based on a residual convolutional network and pyramid-pooling module. While deepening the depth of the network, residual network (ResNet) [
43] addresses the problem of gradient disappearance problem well; the pyramid structure takes into account the target features under multiple receptive fields in parallel [
44], which is suitable for multiscale building-area extraction. In addition, to solve the problem of imbalanced distribution of positive and negative samples, focal loss [
45] was introduced to the classifier to replace the original cross-entropy (CE) loss function. GF-3 SAR data of four regions in China were selected to verify the effectiveness and accuracy of the proposed method. The data robustness of the method is evaluated by Sentinel-1 and ALOS-2/PALSAR-2 data. The experimental results show that the method cannot only be applied to building-area extraction in a variety of complex environments, but also suitable for multi-source data. It will have a good application prospects for urban mapping in the future.
2. Methodology
The difference in scattering characteristics of buildings in SAR images is caused by differences in building properties, heights and scales. Not only is the scattering intensity of high-rise buildings very different from that of low-rise buildings, but the scale difference of building areas is also be characterized as multiscale in SAR images. In addition, the scattering characteristics of vegetation, roads and mountains are similar to those of buildings under certain imaging conditions. Therefore, it is necessary to extract deeper levels of information and multiscale features of buildings; the corresponding postprocessing for building-area extraction is also important.
Therefore, a method for building-area extraction using SAR images is proposed as shown in
Figure 1. The main research work includes the following three parts: (1) building pixel-level-labeled samples for multicategory building areas, (2) construction of a pyramid multiscale building-area extraction network based on a residual-feature extraction network and multiscale pyramid-pooling module, (3) false-alarm removal based on non-building masks.
First, all SAR images were preprocessed by radiometric calibration, filtering and geocoding using ENVI SARscape software. Second, pixel-level-labeled samples of multicategory buildings were produced based on the preprocessed SAR data and the auxiliary data using ArcGIS software and the sample images were divided into 256 × 256 patches covering the training set and test set. Then, the pyramid multiscale building-area extraction network based on the residual-feature extraction network and multiscale pyramid-pooling module were constructed. Next, the training set and test set were used to train and test the network, respectively. Finally, the optimized network was obtained. Finally, the preprocessed SAR image was input into the network to obtain the preliminary binary image of building areas, and the final results were obtained by removing non-building mask layers through logical operations.
2.1. Building Pixel-Level Labeled Samples for Multicategory Building Areas
As mentioned above, the urban distribution of each city has multiscale characteristics. Building areas in the central city are distributed in patches, while building areas in the suburbs are small and scattered. However, due to the influence of topography, history and other factors, the spatial layout of buildings in different cities is still different. In some cities, there are many factories and villages; in some cities, the terrain fluctuates greatly, and the buildings are mostly distributed along the roads or rivers; in some cities, there are many small settlements scattered on the plain.
Therefore, this paper designs a pixel-level-labeled samples strategy for multicategory building areas—including downtown built-up areas, mountain buildings, plain villages and urban villages.
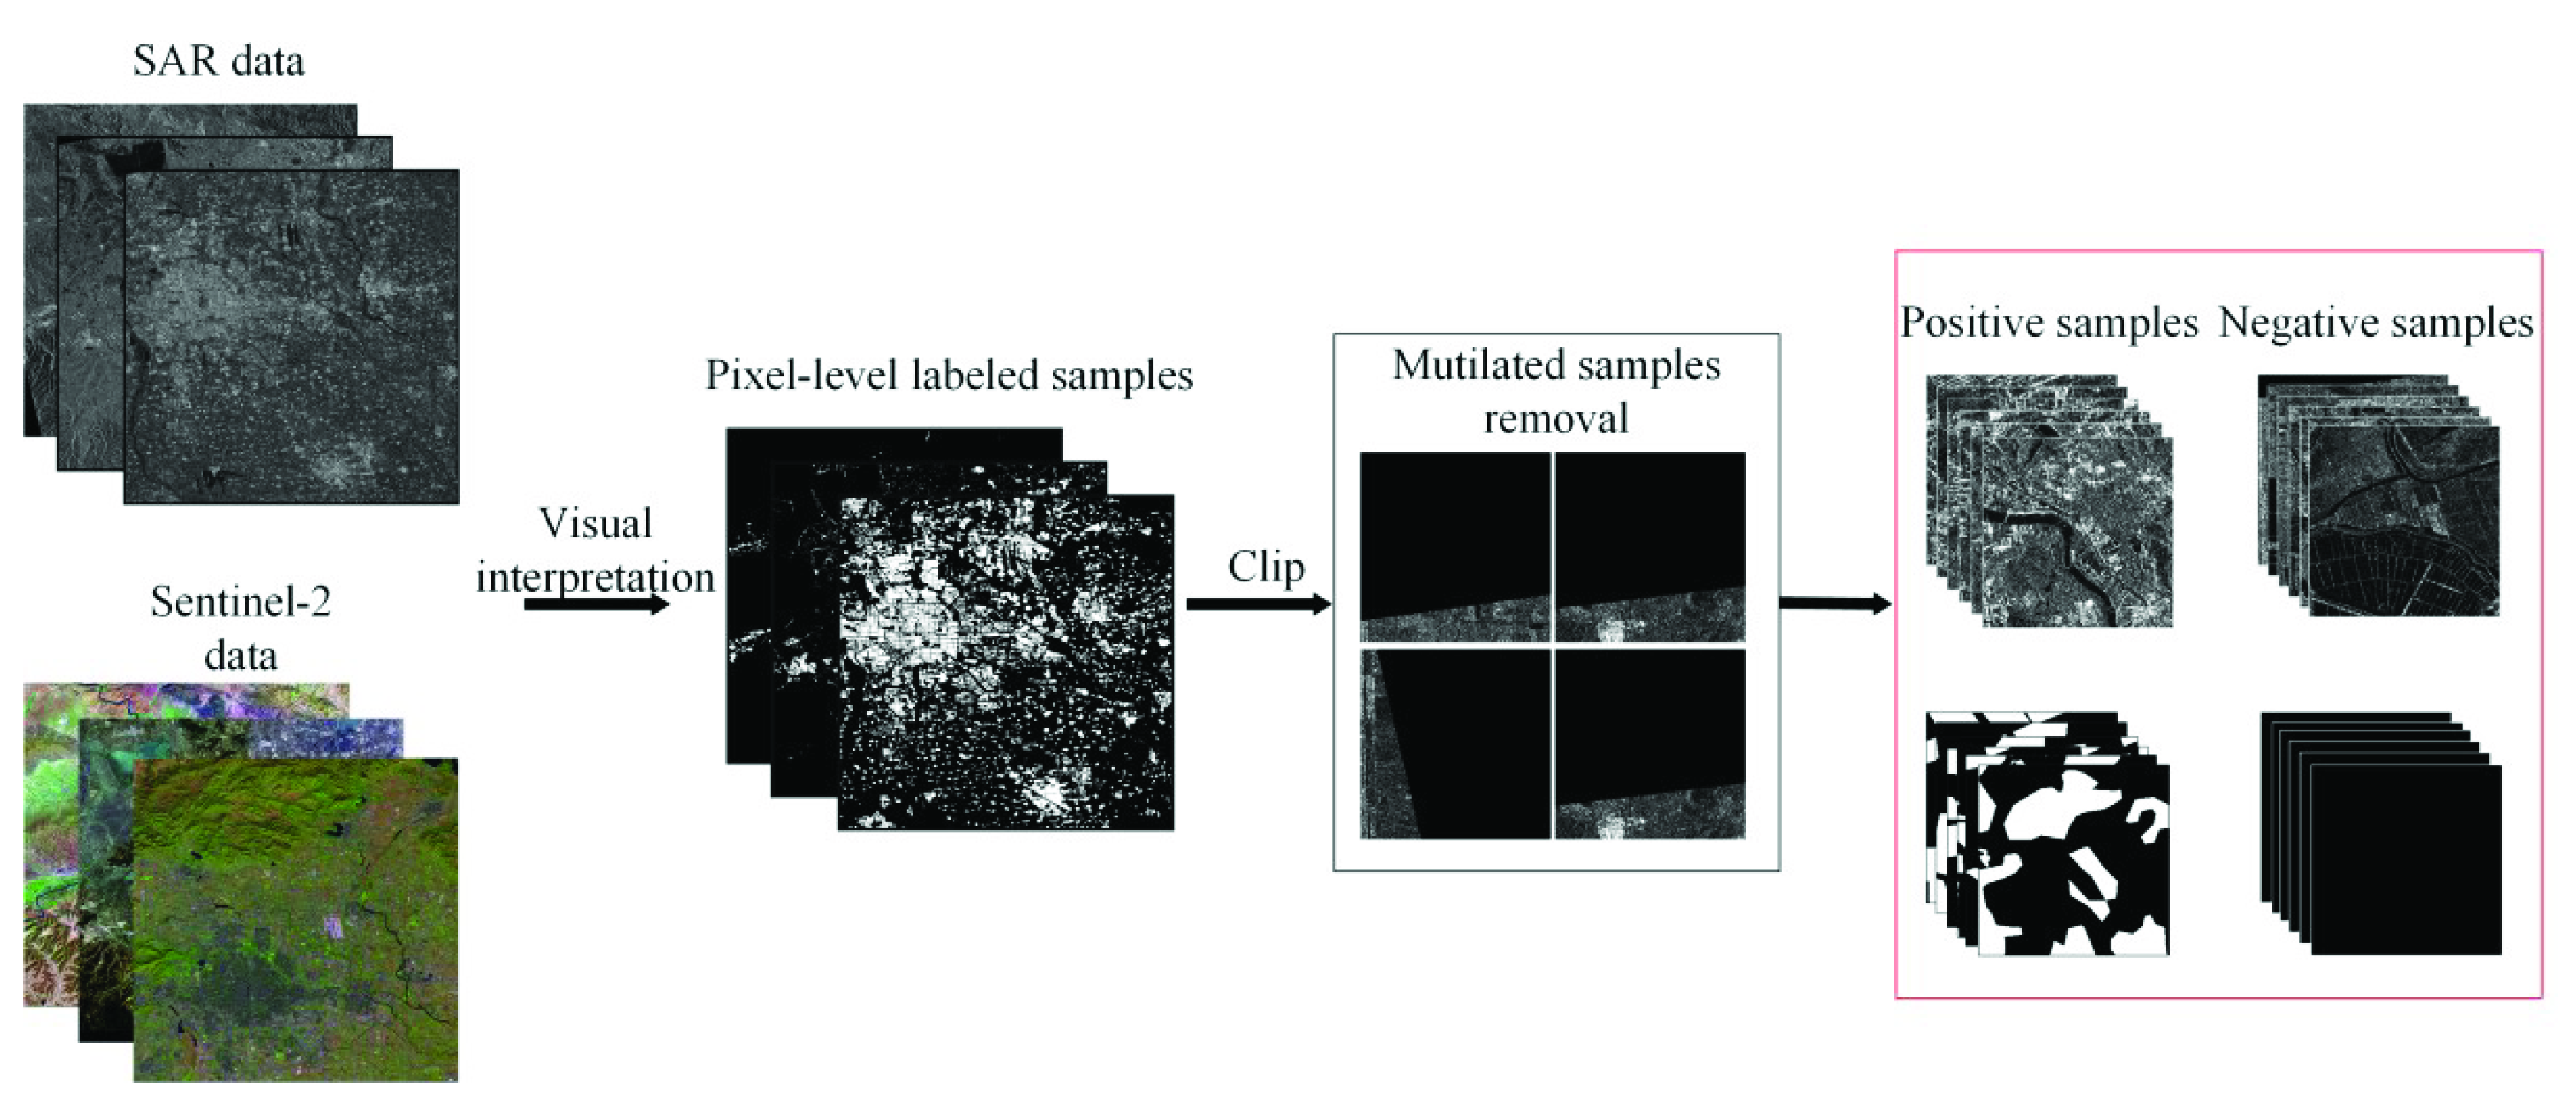
Figure 2 shows the production process of pixel-level-labeled samples. First, in order to ensure the accuracy of the building area samples, Sentinel-2 data with 10-m resolution were referenced to ensure the integrity of the building area, so as to reduce the omission error. Second, in the process of clipping, an overlap area of 30 pixels was set to ensure that the boundary of small buildings was not damaged. Then, the incomplete samples (SAR image edge containing less building information) were eliminated to ensure the quality of the samples. Each sample was divided into positive samples (effective samples) or negative samples according to whether the sample contains building area targets and then stored in different subsets. According to the actual situation of the study area, building area and nonbuilding area in plain area could be easily distinguished, so the samples in these areas were all positive samples; while building samples in mountainous areas include positive samples and negative samples, which ensured that the network could fully learn building features and mountain features to accurately distinguish them.
2.2. Construction of Pyramid Multiscale Building Area Extraction Network
Based on residual network (ResNet) and the pyramid-pooling module proposed in the pyramid scene parsing network (PSPNet) model, a pyramid multiscale building-area extraction network was constructed. ResNet was mainly used for the extraction of deeper level texture features, and the pyramid-pooling module was used for multiscale feature extraction and pixel-level classification. To solve the classification problem of the imbalanced pixel proportion between the building areas and the non-building areas in SAR images, focal loss was introduced to the classifier of the network to replace the original cross-entropy loss function.
2.2.1. Residual Feature Extraction Network
ResNet [
43] is based on the convolutional neural networks (CNN) model by introducing a deep-residual-learning framework, and can effectively address the degradation problem with increasing network depth. In this paper, ResNet50 was designed as the feature extraction network of building areas, which is a stack of many identity blocks and convolutional blocks (CONV blocks). The framework of ResNet50 is shown in
Figure 3.
Figure 3b shows that the identity block is a residual module with a stack of 3 layers, and each layer is composed of CONV2D, Bach normalization (BN), and rectified linear unit (ReLU) with a shortcut connection, in which shortcut connections go across feature maps of two sizes. The shortcut connection, which also denotes identity mapping, is the core idea of ResNet for addressing the gradient degradation problem. The identity mapping sends the feature map of building areas extracted from the shallow network to the deeper network directly across several layers, which can ensure that the details of the extracted texture information do not degrade as the network depth increases.
Figure 3c shows the structure of the CONV block. The difference between the CONV block and the identity block is that there is a 1 × 1CONV2D layer in the shortcut connection, which is used to reduce the dimensions of the feature map so that the dimensions of the input match the output connected behind. The identity block and CONV block all use a stack of 3 layers with 1 × 1, 3 × 3 and 1 × 1 convolutions, where the 1 × 1 layers are responsible for reducing and then increasing (restoring) dimensions, leaving the 3 × 3 layer a bottleneck with smaller input/output dimensions. Thus, not only is the accuracy of feature extraction increased, but also the number of calculations is reduced. However, ResNet can only obtain the multilevel texture information of buildings at one scale. For multiscale building distribution, the pyramid module is needed.
2.2.2. The Pyramid Pooling Module
The pyramid-scene-parsing network (PSPNet) achieves state-of-the-art performance in embedding difficult scenery context features in an FCN-based pixel-prediction framework [
44], in which the pyramid-pooling module has been empirically demonstrated to be an effective global contextual prior. In this paper, the pyramid pool module was introduced into the extraction of multiscale building areas. The pyramid-pooling module fuses features under four-level pyramid scales with bin sizes of 1 × 1, 2 × 2, 3 × 3 and 6 × 6 (see
Figure 4). The coarsest level highlighted in red is global pooling to generate a single bin output. The following pyramid level separates the feature map of building areas into different subregions and forms a pooled representation for different locations. The output of different levels in the pyramid-pooling module contains the feature map with varied sizes. To maintain the weight of the global feature, the 1 × 1 convolution layer after each pyramid level reduces the dimensions of the context representation to
of the original one, if the level size of the pyramid is
. Then, the low-dimensional feature maps are directly upsampled to obtain the same size feature as the original feature map via bilinear interpolation. Finally, different levels of features are concatenated as the final pyramid pooling global feature, which was used for subsequent classification work. The pyramid-pooling module collects multilevel information of multiscale building areas and combines them with the original feature map extracted from ResNet50 to improve the accuracy of building-area mapping.
2.2.3. Focal Loss
The building samples contained some small villages. In this kind of sample, the area of buildings accounted for a relatively small proportion, and there was a serious imbalance between positive and negative samples of buildings. To address this problem, focal loss was introduced to the classifier to replace the original cross-entropy (CE) loss function.
Focal loss is proposed based on CE loss function [
45]. The formula of CE is as follows:
In the above, specifies the category of labels, in this paper, including buildings and non-buildings. is the model’s estimated probability for the class with label , which is obtained from the sigmoid activation function. It can be seen that for normal cross entropy, the higher the output probability is, the smaller the loss is for positive samples; for negative samples, the smaller the output probability is, the smaller the loss. The loss function is slow and may not be optimized optimally in the iterative process of a large number of samples.
Thus, focal loss is proposed by reshaping the loss function to downplay easy examples and thus focus training on hard negatives. The formula of focal loss is as follows:
A tunable focusing parameter
was added to the CE loss function, which can reduce the loss of easily classified samples and make the classification focused more on difficult and misclassified samples. In addition, a weighting factor
is added to balance the unbalanced proportion of positive and negative samples.
Through a series of parameter adjustments, we found to work best in our extraction task.
2.3. False-Alarm Removal
Finally, further postprocessing was needed to eliminate false alarms and improve the extraction accuracy. Common false alarms include vegetation, roads and mountains. Using auxiliary data to obtain several kinds of nonbuilding mask layers, a logic calculation was used to remove the intersection of initial extraction results and mask layers (See
Figure 5). The specific steps were as follows: (1) Normalized Difference Vegetation Index (NDVI) and Modified Normalized Difference Water Index (MNDWI) images were obtained from Sentinel-2 optical data using the spectral index module of ENVI Software. Then, appropriate thresholds were set to obtain vegetation and water mask layers. In this paper, the threshold values of vegetation and water mask layers were 0.42 and 0.38, respectively. (1) Road data were obtained from OpenStreetMap open source data website. In this paper, highway, national highway and provincial highway layers were merged to one road layer and then polyline layer was converted to polygon layer; (3) The 30-m SRTM DEM was resampled to 10-m resolution. Then, the average slope was computed in a window around the pixel under test with the slope threshold value 15° [
28]. Finally, false-alarm removal work was carried out to erase the mask layers from the initial results layer to obtain the final postprocessing layer.
4. Experimental Results and Analysis
In order to evaluate the effectiveness of the proposed method, we designed two experimental schemes. First, GF-3 SAR data were used to evaluate the effectiveness of this method in different regions with multiscale and multicategory building areas, and then the robustness of the method in different SAR data sources (Sentinel-1, ALOS-2/PALSAR-2) was analyzed.
For the residual-feature extraction network, the main parameters used in our experiment are summarized as follows: the training environment of the network was Ubuntu 16.0.4 with a Core i7 CPU and NVIDIA GTX 1080Ti 12G GPU. The learning rate, epoch and batch size were 0.0005, 30 and 5, respectively.
4.1. Experimental Results of Four Regions
Figure 7 shows the mapping results of four regions based on the pyramid multiscale building-area extraction network proposed in this paper. The results indicate that the building area extracted by the proposed method was basically consistent with the building area representation in SAR images. We can see that the detection results were very good in the urban center, mountainous buildings, suburban villages, dense contiguous building areas and small-scale villages.
Figure 8 shows the local region extraction results in detail. The green marks in the first and second columns are flat-roofed buildings and low-rise buildings. In the SAR images, flat-roofed buildings were hollow buildings, and the backscattering values of low-rise buildings were low. The green mark in the third column indicates the village in the mountain area, and the backscattering value was very low, which was difficult to detect. In the last column, buildings close to paddy fields were densely distributed, which were difficult to distinguish from non-buildings in SAR images. As could be seen from figure, all the buildings were detected completely. The global and local extraction results of
Figure 7 and
Figure 8 show that the proposed method is suitable for multicategory and multiscale regional building areas mapping.
Table 4 shows the accuracy evaluation of the extraction results of the four regions. The overall accuracy of the extracted building areas at different test sites in four regions was higher than 85%, and Kappa coefficient was greater than 0.7. These results show that the proposed method has high extraction accuracy of building areas in large and small cities, in plains, mountainous areas, especially in small-scale plain villages.
To give a quantitative assessment, the results were compared with the global human settlement layer (GHSL 2014) and finer resolution observation and monitoring-global land cover 10 (FROM-GLC10). The image data of GHSL products with resolutions ranging from 0.5 to 10 m were collected by satellite SPOT (2 and 5), CBERS 2B, RapidEye (2 and 4), WorldView (1 and 2), GeoEye 1, QuickBird2, Ikonos 2 and airborne sensors. The FROM-GLC10 product is a global 10-m resolution land cover map produced by the team of Professor Gong Peng of Tsinghua University using Sentinel-2 optical data. Our results are compared with GHSL and FROM-GLC10 as shown in
Figure 9, the results of each region are a whole building area layer containing different buildings. It can be seen that the building area extracted by the proposed method was basically consistent with the other two products. However, GHSL was somewhat overfitting—in which the boundary range and density of urban areas were larger than those of the other two products. For small-scale villages, FROM-GLC10 product missed most of the villages, while our results show a good detection results in small villages. The GHSL product was better than the FROM-GLC10, but worse than our result.
Table 5 shows the comparison results of our results and optical products in four regions. For Beijing, our results were consistent with FROM-GLC10 product, but the commission error of FROM-GLC10 was 6.55% and that of GHSL product was 30.40%. For Wuhan, the overall accuracy of our results and optical products was more than 90%, but GHSL product had the highest commission error, which amounts to 10.86%, while FROM-GLC10 product had the highest omission error, reaching 11.76%. For Guangzhou, GHSL product had the highest accuracy and FROM-GLC10 product had the highest commission error. For Shangqiu city in Henan Province, our result had the highest accuracy among the three products, followed by GHSL product and FROM-GLC10 product had the worst extraction effect with 31.3% omission error. On the whole, the commission error of our results was the lowest among the four regions compared with the other products, However, in four regions, the omission error of our results was 6.61% in Beijing and 5.11% in Wuhan, the omission error mainly occurs in the building area with low backscattering values. The texture and geometric structure of buildings in SAR image were incomplete, thus these building features were unstable in the convolution neural network, so as to be divided into nonbuilding areas in the classification layer. For Guangzhou, our result had the highest omission error, because there were many paddy fields in Guangzhou, and some of the ridges and crops had similar characteristics with building areas in SAR data, leading to high omission error. However, from the perspective of spatial scale, our method could still accurately map the regional building areas. In addition, our method could make up for the 10-m resolution optical mapping in a certain extent in terms of small-scale village extraction and provide technical support for the application of surface monitoring based on multi-source remote sensing data.
At the same time, A total of 38 GF-3 FSII data in Henan Province from October 2018 to July 2019 were selected to extract building areas of Henan Province, as shown in
Figure 10. We can see that the spatial distribution of small villages in the suburbs is highly consistent with that in Google Earth images. For a clearer quantitative analysis, we counted the area of the built-up area extracted in this paper and compared it with the official statistics. The results are shown in
Figure 11. The comparison result indicates that our results were roughly consistent with the official statistics obtained from the Henan Province Bureau of Statistics (
http://www.ha.stats.gov.cn/). Here, the predicted area and the official statistical area refer to the area of built-up areas, including only the central part of the city.
4.2. Comparison of the Proposed Method with Fully Convolutional Network (FCN) and Residual U-Net Methods
In order to verify the extraction performance of the proposed method, we compared it with FCN and residual U-Net. FCN and residual U-Net models were trained with the same training data. The comparison of building areas extracted by the three methods is shown in
Figure 12; the accuracy evaluation results are shown in
Table 6.
Figure 12 shows that the visualization detection results of the proposed method in four regions were the best, and the visualization detection results of FCN method in Beijing, Wuhan and Guangzhou were the worst with high omission error. In Henan Province, the detection effect of residual U-Net was the worst. It can be seen from
Table 6 that the overall detection accuracy of our method in the four regions was above 95% (the average value of Kappa was 0.88), while the average kappa values of FCN and residual U-Net were 0.61 and 0.70, respectively. Compared with the proposed method, FCN in Beijing, Wuhan and Guangzhou had the highest omission error, followed by the residual U-Net method, while in Henan Province, the omission error of residual U-Net method was the highest, reaching 28.32%, which was consistent with the visualization results in
Figure 12. In terms of method analysis, the residual U-Net method was generally more accurate than FCN method in urban extraction. The main reason was that residual U-Net not only used the U-shaped structure to transfer the encoded features to the decoder, but also used residual connection to ensure the transmission of detailed features in each convolution block of the encoder, while FCN did not take advantage of the feature transfer advantage of U-shaped network. Our method had the highest extraction accuracy, which was mainly attributed to using ResNet50 as the feature extraction network. The network not only ensures the deepening of depth, but also solves the problem of gradient disappearance. The texture and geometric structure features of the building area were fully learned by the network, and then the pyramid-pooling module was introduced to further extract the characteristics of different sub regions of the building area. Finally, the deep level features and multiscale features were combined to realize the accurate extraction of multiscale building areas.
4.3. Evaluating the Robustness of the Proposed Method in Different SAR Data Sources
In order to evaluate the robustness of proposed method using different SAR data, Sentinel-1 and ALOS-2/PALSAR-2 data were selected as experimental data.
Table 7 shows the detailed information of training data and test data.
Figure 13 and
Figure 14 show the extraction results using Sentinel-1 and ALOS-2/PALSAR-2 data.
Table 8 shows the accuracy evaluation result. In central city and suburb, the overall extraction accuracy was higher than 93%. The omission error of the results based on Sentinel-1 data in central city was the highest due to low backscattering value of some building areas. While the commission error of the results based on ALOS-2/PALSAR-2 data were higher because some farmland show similar characteristic as buildings. On the whole, the experimental results show that the multiscale building-area extraction network had good generalization ability in regional urban mapping using different SAR data.
5. Discussion
It can be seen from the experimental results that all types of buildings under different terrain environment were well-detected, which shows that multicategory labeled samples are necessary. Compared with FCN-based methods, the ResNet50 and pyramid models can learn deeper and multiscale features of buildings. Using Sentinel-1 and ALOS-2/PALSAR-2 data for regional building-area mapping also achieved considerable accuracy, indicating that the pyramid multiscale building-area extraction network has good generalization performance. These results show that our building extractor is suitable for regional urban mapping using medium resolution SAR data, and it is feasible to apply deep-learning methods and SAR data to regional or global urban mapping.
To date, we have achieved promising building-area extraction results, but there are still some commission and omission error in the four regions. There is spatial correlation between SAR image pixels, thus the landscape near the building area, small villages in paddy fields, roads and ridge are easy to be detected as building targets. The postprocessing module is used to optimize the initial extraction results and the extraction accuracy is improved. The main reasons to omission error is that some GF-3 SAR data are difficult to distinguish the buildings from the background due to the low image contrast. In addition, the quantity and quality of pixel level labeled samples have certain limitations on the accuracy of building mapping and the error of manual marking will lead to omission error. Therefore, future work can focus on building-area extraction methods based on few-shot learning methods and improving SAR image contrast.
6. Conclusions
According to the application requirements of regional and global scale urban mapping, in this paper, a multiscale urban extraction network was designed, and a regional urban mapping extraction framework based on SAR data has been proposed. GF-3 SAR data with 10-m resolution were used for regional urban mapping, the experimental results of four different regions show that the proposed method could accurately extract building areas and villages in different terrain environments, with the overall accuracy higher than 85%. Compared with optical products, the building area extracted by this method was highly consistent with optical products in the central urban area, and the extraction accuracy in rural areas was significantly higher than that of optical products. In addition, compared with FCN and residual U-Net methods, the visualization and quantitative evaluation in four regions show that the proposed approach had stronger building detection ability than FCN and residual U-Net methods.
Moreover, Sentinel-1 and ALOS-2/PALSAR-2 data were used to test the applicability of the algorithm. The experimental results in Beijing city showed that the extraction accuracy of the proposed method was better than 93% in the two kinds of data, indicating that our method had good data robustness and was suitable for a variety of medium resolution SAR data.
These findings indicate that the proposed method is suitable for multiscale building-area extraction in different terrain environment and has strong robustness in the application of building-area extraction from different SAR data. In the future, we will study the sustainable urban development based on long time series data to support urban sustainable development.


