Article

Glider-Based Active Acoustic Monitoring of Currents and Turbidity in the Coastal Zone

1
CEFREM, CNRS, Université de Perpignan Via Domitia, 52 Avenue Paul Alduy, 66860 Perpignan, France
2
LA, Observatoire Midi-Pyrénées, 14 Avenue Edouard Belin, 31400 Toulouse, France
3
COAS, School of Environmental Sciences, University of East Anglia, Norwich NR4 7TJ, UK
4
Univ Brest, CNRS, Ifremer, IRD, Laboratoire d’Océanographie Physique et Spatiale (LOPS), IUEM, F-29280 Plouzané, France
5
CNRS-Sorbonne Universités (UPMC Univ. Pierre et Marie Curie, Paris 06)-CNRS-IRD-MNHN, UMR 7159, Laboratoire d’Océanographie et de Climatologie (LOCEAN), Institut Pierre Simon Laplace (IPSL), 4 Place Jussieu, F-75005 Paris, France
6
IFREMER, DHYSED, ZI Pointe du Diable, 29280 Plouzané, France
*
Author to whom correspondence should be addressed.
Remote Sens. 2020, 12(18), 2875; https://doi.org/10.3390/rs12182875
Submission received: 15 July 2020 / Revised: 27 August 2020 / Accepted: 31 August 2020 / Published: 4 September 2020

Abstract

:
The recent integration of Acoustic Doppler Current Profilers (ADCPs) onto underwater gliders changes the way current and sediment dynamics in the coastal zone can be monitored. Their endurance and ability to measure in all weather conditions increases the probability of capturing sporadic meteorological events, such as storms and floods, which are key elements of sediment dynamics. We used a Slocum glider equipped with a CTD (Conductivity, Temperature, Depth), an optical payload, and an RDI 600 kHz phased array ADCP. Two deployments were carried out during two contrasting periods of the year in the Rhone River region of freshwater influence (ROFI). Coastal absolute currents were reconstructed using the shear method and bottom tracking measurements, and generally appear to be in geostrophic balance. The responses of the acoustic backscatter index and optical turbidity signals appear to be linked to changes of the particle size distribution in the water column. Significantly, this study shows the interest of using a glider-ADCP for coastal zone monitoring. However, the comparison between suspended particulate matter dynamics from satellites and gliders also suggests that a synoptic view of the processes involved requires a multiplatform approach, especially in systems with high spatial and temporal variability, such as the Rhone ROFI area.

Graphical Abstract

1. Introduction

Sediment dynamics on continental margins play an essential role in marine habitats and ecosystems dynamics, in the dispersion and sequestration of land-derived chemical elements (e.g., carbon, contaminants) and, in the long term, the evolution of continental shelf morphology [1]. This dynamic is influenced by multiple forcings (river discharges, currents, wind, waves), which strongly affect the spatio-temporal variability of suspended particulate matter (SPM) distribution. Operational monitoring of SPM is thus necessary to improve sediment transport and ecosystem modelling, with a final goal to prevent long-term damage to coastal waters [2].
Over the past decade, technological advances in ocean color satellite observation have made it possible to describe the variability of SPM dynamics in the surface layer of the coastal zone on large spatial and temporal scales [2,3,4]. However, satellite data cannot provide information on the vertical structure of SPM dynamics in the water column. Until recently, most in-situ observations of SPM transport in the water column were gathered at a few fixed locations over the shelves. However, in-situ monitoring throughout the water column is essential to characterize the spatio-temporal variability of the processes involved in sediment transport and deposition in coastal areas [5]. Autonomous underwater vehicles (AUVs), such as gliders, appear to be useful tools for the monitoring of coastal hydrodynamics, sediment transport, and coastal ecosystems, especially during extreme events such as floods and storms, which are critical elements of sediment dynamics and particulate transport in the coastal zone [5,6,7,8].
Gliders driven by variable buoyancy [9] can measure a large number of environmental variables at the same time, collecting data which they transmit in near real-time. Glider-based monitoring allows sampling of the entire water column and continental shelf over long periods. Gliders markedly supplement the fixed measurements of buoys and moorings, as well as data collected during shipborne surveys, which are shorter, potentially less frequent, and weather-sensitive. They are becoming increasingly important for the collection of oceanographic measurements in observing programs [10,11,12]. Several recent studies have dealt with the integration of Acoustic Doppler Current Profilers (ADCPs) on gliders for applications in the open ocean as well as the coastal zone [13,14,15,16]. However, few of them have dealt with sediment transport [6,7]. The sampling strategy for most of the latter studies was based on high-frequency measurements over short periods (a few hours to a week). Endurance deployments to monitor currents and turbidity are necessary in order to fill the gap in measurements concerning SPM dynamics at the regional scale, and to validate hydro-sedimentary models [17].
In this study, a Slocum glider equipped with a CTD, optical sensors, and an ADCP was tested in conjunction with ocean color satellite images to evaluate its capacity to monitor the interplay of hydrographic features, water circulation, and particulate matter distribution in the coastal zone. The study area is located in the region of freshwater influence (ROFI) of the Rhone River in the Gulf of Lions (NW Mediterranean), and measurements encompass two different seasons with stratified and non-stratified hydrological conditions. The sampling strategy was adapted to target a continuous observation period of several weeks so as to capture sporadic events, such as storms or floods. The objectives of this work are (i) to evaluate the performance of current estimations by ADCP with reduced sampling frequency allowing endurance deployment, (ii) to evaluate the complementarity between the evaluation of turbidity derived from acoustic backscattering of an ADCP and optical measurements, (iii) to estimate SPM fluxes at the scale of a continental shelf, and (iv) to assess the complementarity between the glider and satellite platforms to monitor the turbidity in the Rhone’s ROFI.

2. Materials and Methods

2.1. Deployment Strategy

A glider equipped with an ADCP was deployed within the Rhone ROFI during two measuring campaigns (Figure 1a,b). The first one lasted for 30 days (from 26 October to 21 November 2016), in autumnal conditions of thermal stratification, with a pycnocline at around 50–60 m depth. The second campaign lasted for 35 days (from 30 January to 3 March 2017) and took place in winter during unstratified conditions. However, for both deployments, haline stratification conditions could be observed along some sections up to 40 m depth, depending on the Rhone River inflow. In total, 14 and 17 cross-shelf sections were carried out in 2016 and 2017, respectively, among which were six and 12 complete sections from the river mouth to the shelf edge (40 km offshore to 120 m depth). Each section was generally performed in 1.5–2 days. During these two glider deployments, no significant flood or storm was recorded.
Concomitant sea surveys were carried out on board the R/V Tethys II at the same location from 2–11 November 2016 for the autumnal conditions, and from 24 January to 3 February 2017 for the winter conditions. During these surveys, water samples were collected at specific depths for the determination of SPM concentration in the water column.

2.2. Environmental Data

Satellite data: spatial maps of daily SPM concentrations (Figure 1a,b), with 1 km resolution, were obtained from the Moderate Resolution Imaging Spectroradiometer (MODIS) on the Aqua satellite (Level-2 reflectance products). Products, analysis, and calibrations used were provided by IFREMER, and OC5 IFREMER algorithms for SPM concentrations estimations were obtained from [3].
Rhone River discharge time-series: hourly water discharges of the Rhone River were measured at the Beaucaire-Tarascon gauging station (code V7200015) and were provided by the French national data bank “HYDRO” (http://www.hydro.eaufrance.fr). Solid discharges were estimated using a calibration established for the Rhone River [18], based on the fitting of rating curves to existing SPM-flow data pairs.
Meteorological time-series: hourly (10-min burst average) wind speed and direction were measured at the Météo-France station of Cap-Couronne (43°20.23′N; 5°01.38′E). Data were provided by the Publithèque database.

2.3. Glider Data

2.3.1. Glider System, CTD, and Optical Sensors

The autonomous underwater glider (depth range 30–200 m) used for this work is a Teledyne Webb Research Slocum G1 [9]. It uses a variable buoyancy engine to move in a saw-tooth pattern from the surface (0–1 m depth) to typically 2 m above-bottom. For this experiment, the glider was carefully ballasted to enter into and measure both the low-density waters (<27.5 kg m−3) of the Rhone ROFI and the denser outer shelf waters (>29 kg m−3). The chosen settings allowed the glider to descend and ascend through the water column with a pitch angle of approximately 26°, and horizontal and vertical speeds of 0.4 and 0.2 m s−1, respectively. The glider surfaced every six down- and up-casts (yos) in order to obtain GPS fixes so as to transfer data to land and to receive any new information about its route or configuration. For the subsequent data analyses, the glider’s surfacings were removed because of very noisy data, likely due to bubbles or provoked by rapid changes in heading and attitude on the surface. Conductivity, temperature, and pressure measurements were made using a pumped SeaBird 41cp CTD. Conductivity and temperature measurements were corrected for thermal lag effects [19]. Salinity, density, Brunt–Väisälä frequency, and dynamic-height anomaly were derived using the TEOS-10 equation [20]. An optical backscatter sensor (Wetlabs BB2FLS) provided light scattering measurements (expressed in m sr−1) at a wavelength of 700 nm for turbidity, and at 695 nm for fluorescence of chlorophyll-a. The sampling frequency was 4 s for CTD and optical sensors and 10 s for ADCP sensors. CTD and optical data were synchronized with ADCP data and interpolated to the same periodicity (10 s).

2.3.2. Optical Data Processing

Optical signal calibration: the BB2FLS sensor provided light scattering measurements (β(θ, λ)) at specific angles θ = 124° in the backward direction [21]. The particulate backscattering coefficients (bbp700, in m−1) were derived using the following equation:
bbp(λ)) = 2π·X·(βp(θ,λ),
where X is an adjustment factor provided by the manufacturer according to particle type (1.077), and βp(θ, λ) is the volume scattering function of the particles. The light backscattering measurements at 700 nm (bbp700) from the ship- and glider-based Wetlabs instruments were used to derive SPM concentrations from in situ gravimetric SPM measurements. Data were binned into classes of 0.005 m−1 to improve the calibration. The outliers of each bin, above and below 1.5 times the upper and lower quartile, were removed. Then, a least squares regression method was used to estimate the relationship between the SPM concentration (mg L−1) and the turbidity at 700 nm (Equation (2)).
[SPM]OPT = (104.2 +/− 9.1)*bbp700 + (0.81 +/− 0.3) (r2 = 0.88)
Schlieren effects: the stratified water column shows varying refractive indices associated with density gradient that can cause light scattering, resulting in optical artefacts known as Schlieren effects [22]. The refraction index of seawater, n, is a function of temperature, salinity, pressure, and wavelength of the optical backscattering. The empirical equation of [23] was used to calculate n at 700 nm. For both seasons (autumn and winter), the hydrological profiles (temperature, salinity, density, Brunt–Väisälä frequency) and the refraction index of seawater profiles (Figure 2a,b,d,e) were compared with the optical backscattering signal to assess the presence of Schlieren effects.
Spike analyses: spikes were recorded by all optical measurements as rapid, transient, and often large increases in optical signals. Spikes result from the interception by optical instruments of coarse particles, such as aggregates and biological debris [24], which are scarce relative to the fine particles that induce most of the turbidity signal. We used a similar spikes analysis on our data to characterize the presence of large particles (Figure 2c–f). A 5-point running minimum filter followed by a 5-point running maximum was applied on the raw optical backscattering data at 700 nm (one measurement every meter depth) for the determination of the background (baseline) at each profile (Figure 2c–f). Then, spike height was calculated by subtracting the baseline from the raw optical profile.

2.3.3. ADCP Settings

An Explorer Doppler Velocity Log with Acoustic Doppler Current Profiling capacity (Explorer ADCP) was integrated into a special payload bay on the Slocum glider. It allowed to measure echo intensity and velocity profiles in the water column. The Explorer ADCP has a downward-facing transducer which was tilted forward by 11°, enabling to compensate for the pitch of the glider during downcasts. The inclination of the transducer optimized the three-beam measurements on the 26° pitched glider downcasts with the three forward ADCP beams oriented 15° from vertical, and with the fourth, 45° aft relative to the glider. This fixed forward configuration rendered the instrument unsuitable for collecting velocity profile data during upcasts [25], so for this reason, only downcasts measurements were used in this study. Dedicated high accuracy attitude and compass sensors were used by the ADCP to monitor the beam orientation and were carefully calibrated before deployment. Velocities used in this work were associated with Earth coordinates using dead reckoning and were bin-mapped.
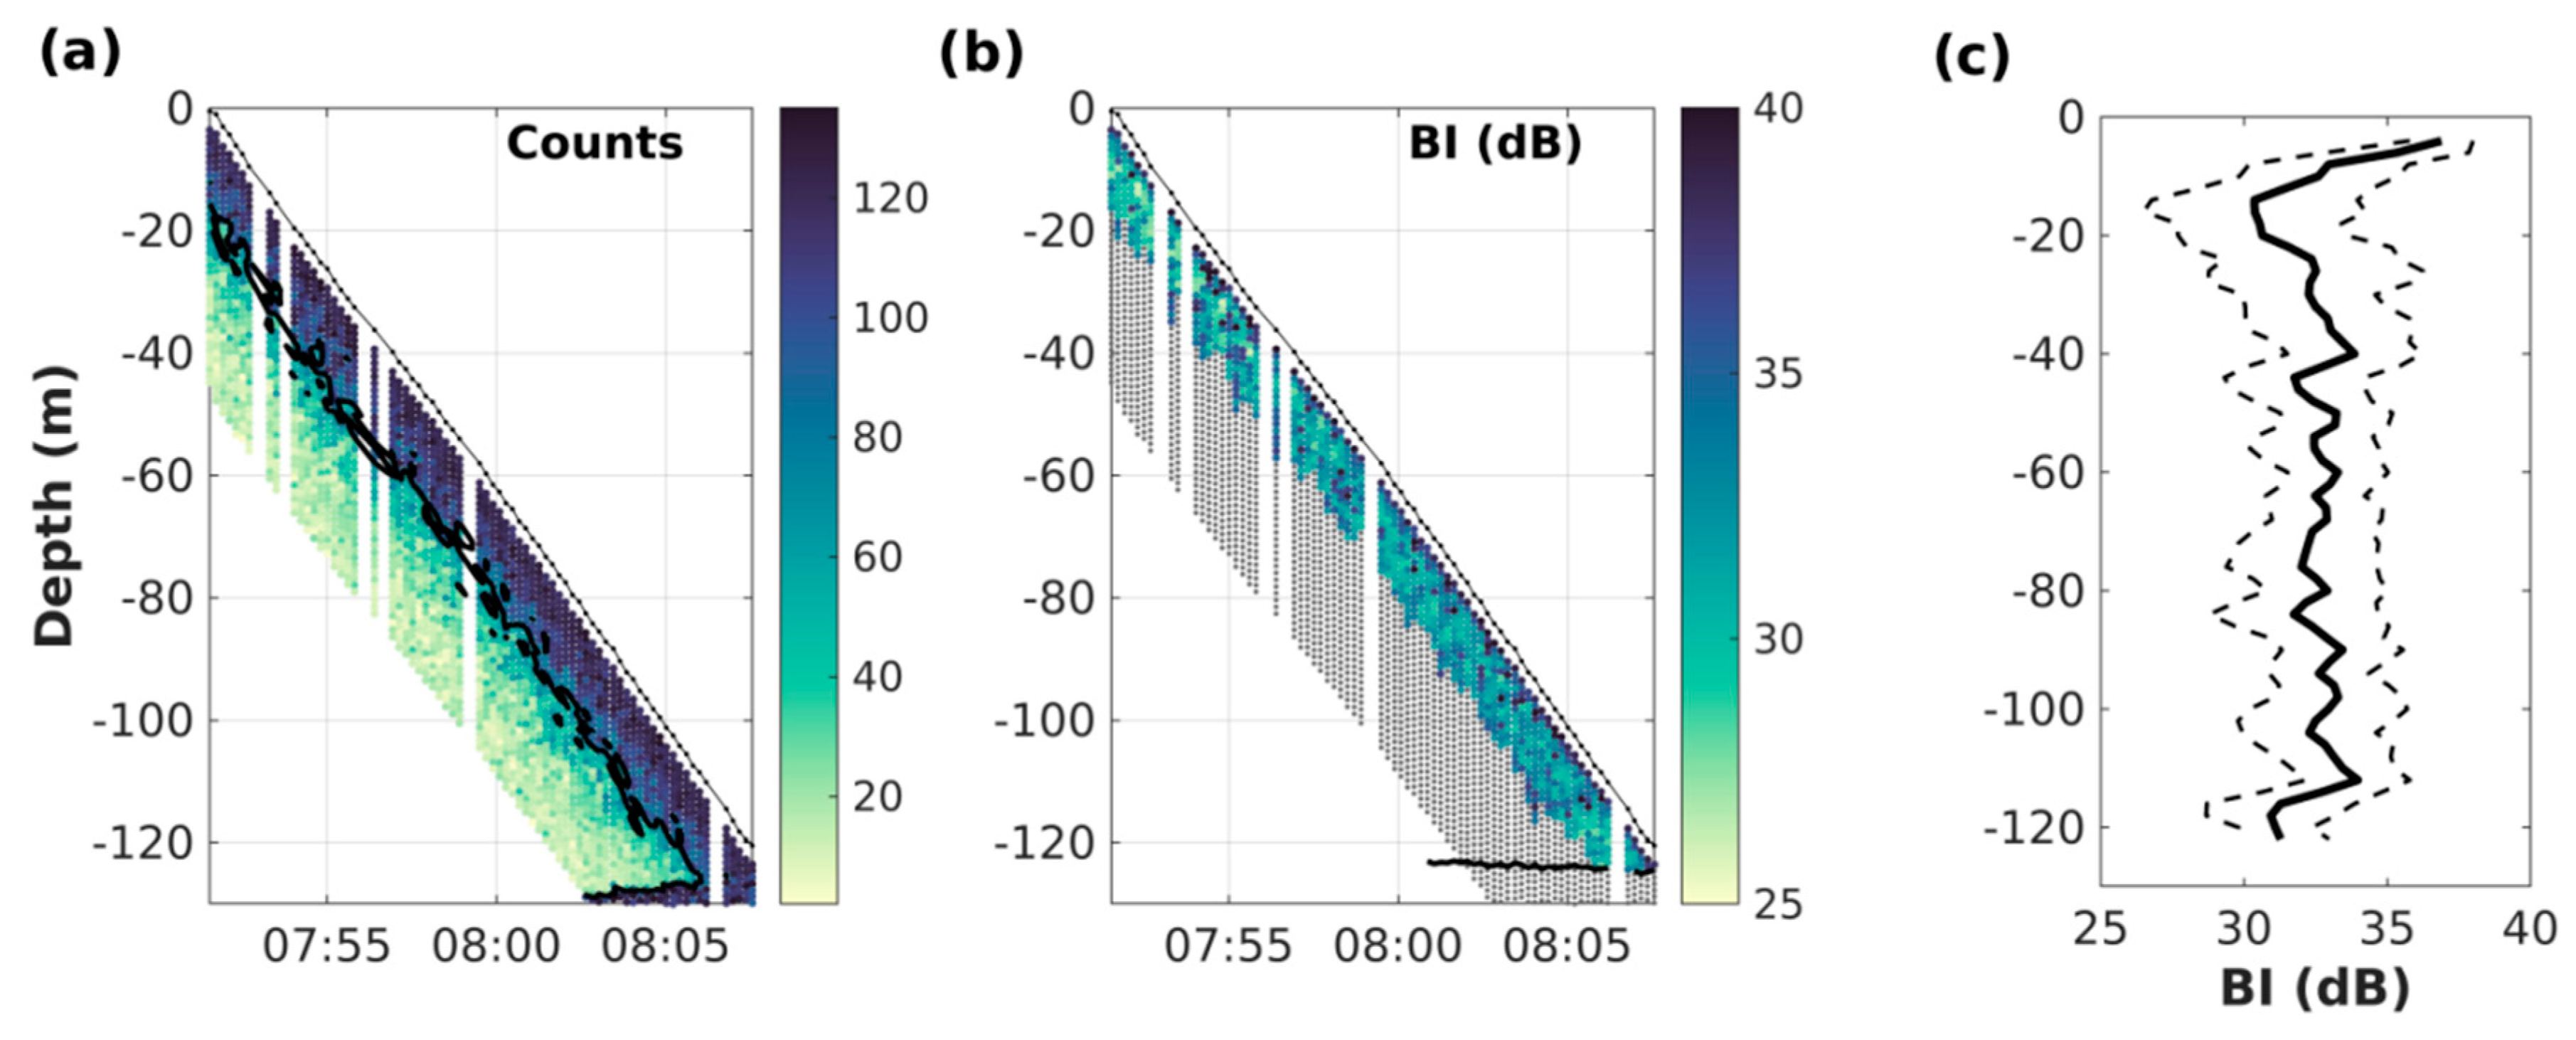
During a glider descent, the ADCP periodically recorded echo intensity and relative water velocities along water profiles (WP). A sampling frequency of 0.1 Hz was set to optimize the duration of the glider deployment. This sampling frequency (ensemble of 1 ping every 10 s) allowed sampling of WPs spaced on average every 4 m along the glider trajectory and 1.7 m vertically. The maximum range of each WP was 40 m. Results were thus organized along a diagonal swath, with overlapping measurements at each depth (Figure 3a and Figure 4a). A blanking distance of 2 m close to the transducer was generally observed for this ADCP and data were vertically averaged into 1 m cell sizes. For echo intensity measurements, a correction was applied on cell depths to avoid the effect of the pitched transducer [26]. The real depth of each cell was thus calculated, taking into account the pitch and roll effects, the blanking distance, and the depth of the glider. Finally, to properly estimate the backscatter index and the relative water velocities, the factory threshold of 64 counts of the correlation signal [27] was used to discard erroneous values. This threshold generally reduced the usable part of the profiles to about 20 me from the transducer (Figure 3b and Figure 4b).

2.4. ADCP Data Processing

2.4.1. Estimation of Backscatter Index

The received level (RL) of the acoustic return along each beam was converted into the backscatter index (BI, in dB) (Equation (3)) [28,29,30]:
BI = 10log10(10(Kc*(RL − Er)/10) − 1) + TLw + TLg,
where Kc is the count to dB factor (0.61 for the ADCP used in this work), RL the received level in counts, Er the noise in counts (50 counts for the ADCP used in this work), TLw the loss due to absorption by seawater [31], and TLg the loss due to geometrical spreading. The computation of the speed of sound was based on the Explorer temperature sensor and an average salinity value of 38.
The successive profiles of the backscatter index were stacked (bins of 1 m) to reconstruct the profile over the entire water column from the median values of the overlapping data at each level. The number of overlapping data ranged between 1 for the first bin at the surface and 12 on average over most of the profile. The associated uncertainty corresponds to the standard deviation of the stacked values for each 1 m depth bin. A final three-point centered moving-average filter was applied to eliminate the high-frequency noise (Figure 3c).

2.4.2. Water Velocity Estimates

ADCP measurements combine glider motion with current velocity. In order to derive current velocities, several methods are available. For the “direct” method, the glider motions are estimated by a steady-state flight model [32,33], and then subtracted from the ADCP data. For the velocity inversion method [34], a set of linear equations is solved to estimate absolute water velocities from a combination of velocity-referencing constraints (navigational data, shipboard ADCP measurements, bottom tracking, etc.). The shear method [35,36,37] is based on the assumption that glider speed is constant for each profile and can, therefore, be eliminated. After reconstructing the shear of the current over the whole water column, its integration allows to obtain a relative water velocity profile. Integrated relative velocities do not include glider motion bias but require an integration constant corresponding to a barotropic velocity component (profile referencing from a single constraint) in order to derive absolute water velocities profiles. In this study, the shear method was preferred over the velocity inversion method since bottom tracking was the only constraint that could be used to reference the profile. The “direct” method gives similar results except for the first 10 m, where data cannot be estimated. This is the depth by which the glider has traveled several body lengths after its inflexion point and for which acceleration terms can be reasonably neglected (steady-state flight model) [32].
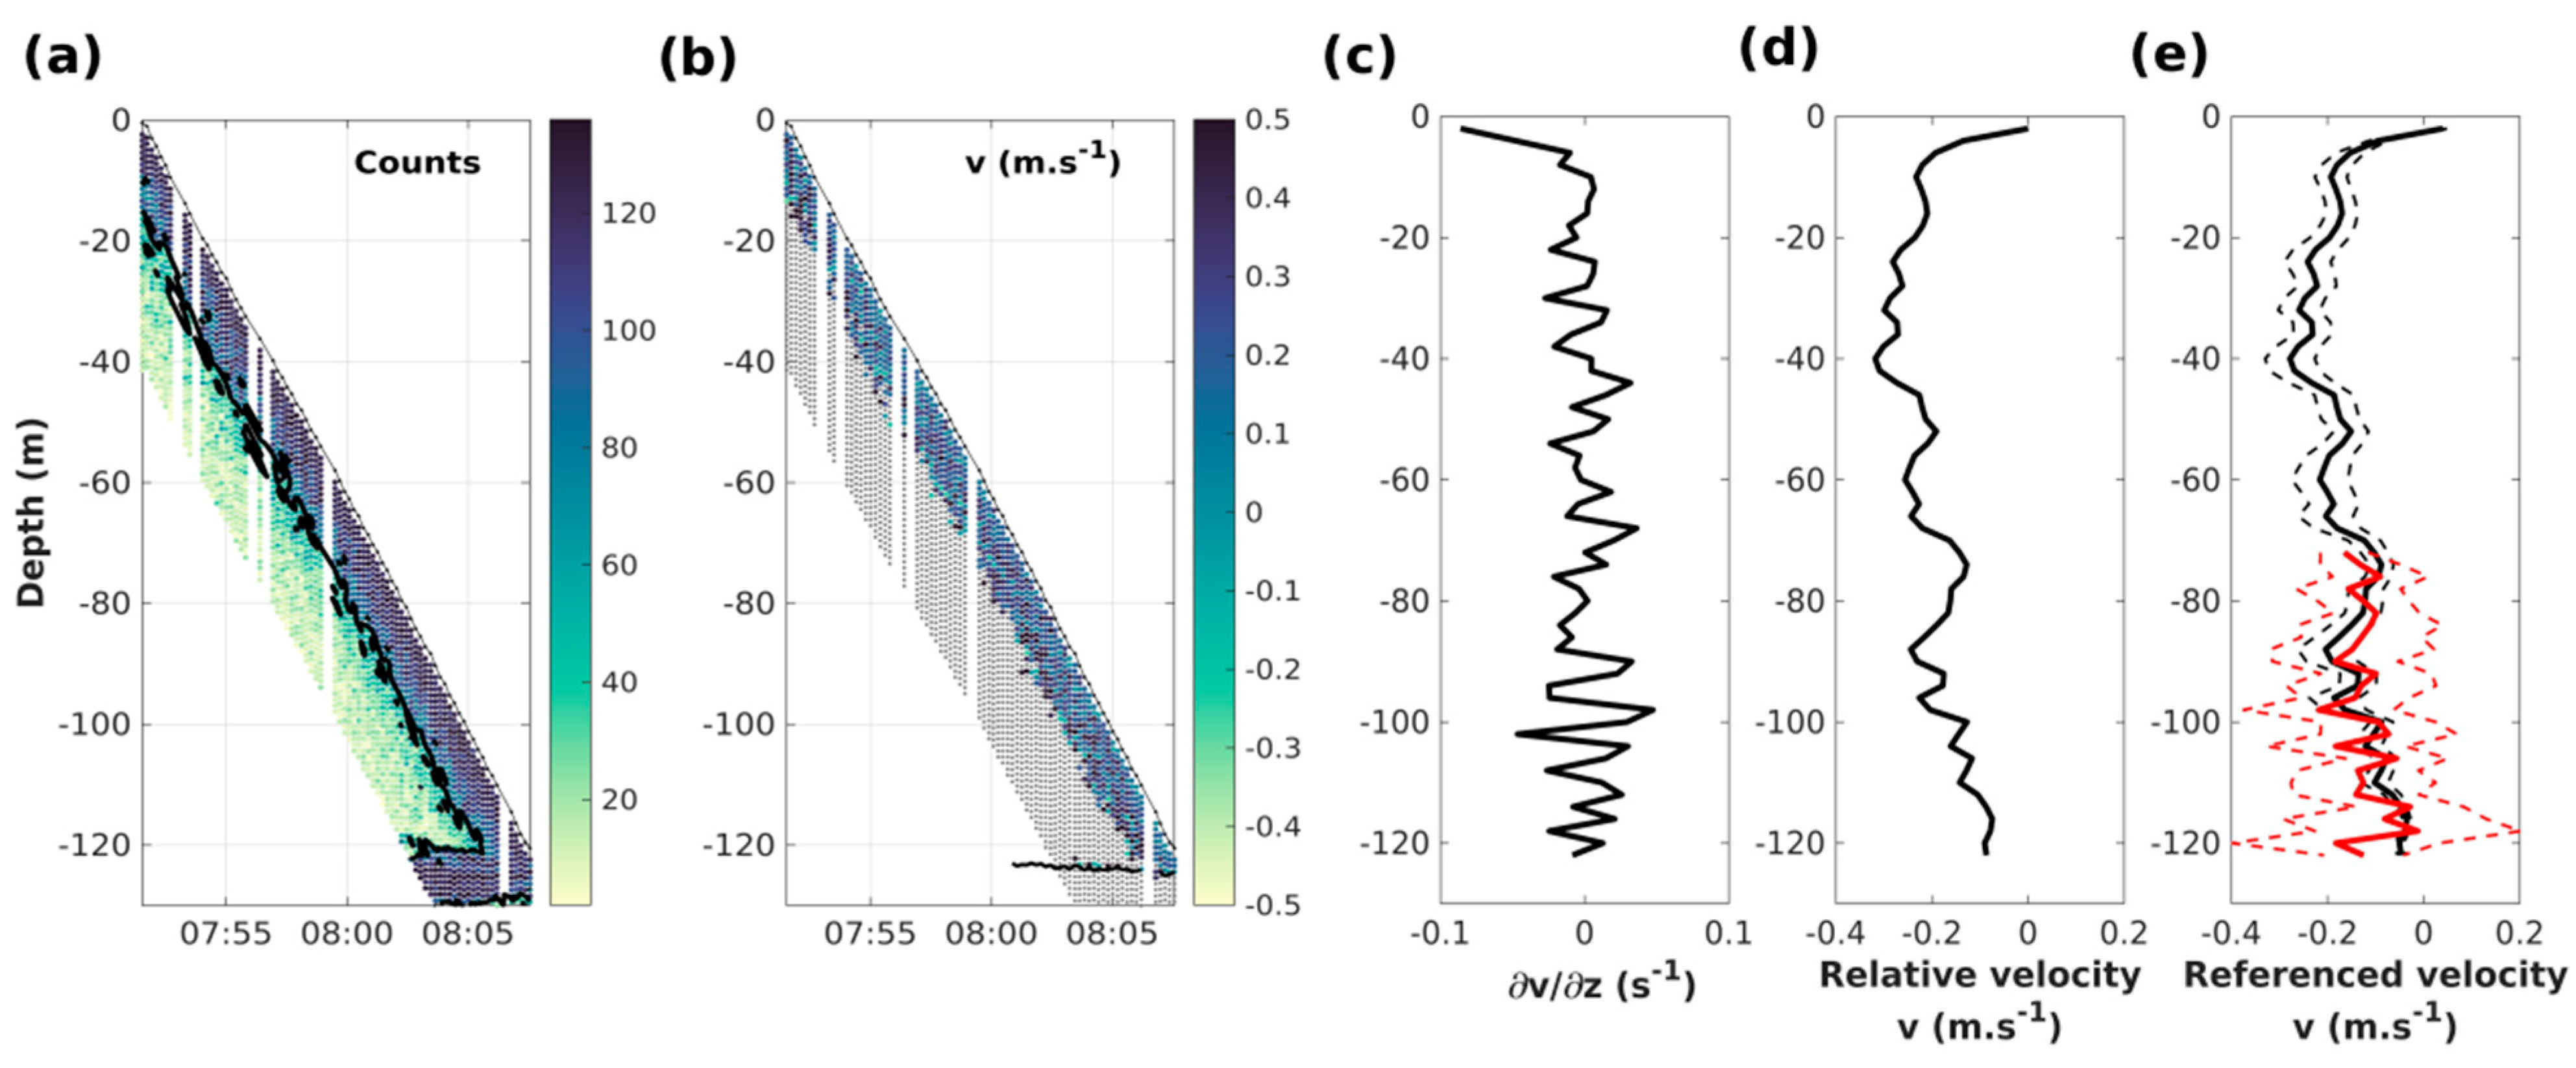
The different steps of the shear method were applied independently to E–W and N–S components to (i) calculate single-ensemble shear by vertically differentiating ADCP velocity profiles (Figure 4c); (ii) grid the resulting shear estimates in depth space (median values of shear current per 1 m cell); (iii) vertically integrate shear to yield the relative velocity profile (Figure 4d), and (iv) estimate absolute velocities by adjusting relative velocity profiles to the current velocities measured by bottom tracking. Estimation of velocity started at a depth of 3 m, due to the position of the ADCP under the glider and a blanking distance of 2 m.
Uncertainties regarding absolute water velocities vary depending on the ADCP settings (mainly cell size, instrument frequency, pulse length, and number of pings per ensemble [27]). The standard deviation of single ping measurements for 1 m cell size at 614 kHz is about 0.066 m s−1. To estimate the uncertainty of the relative velocity estimates, we performed a Monte-Carlo simulation based on 500 iterations, with initial velocity values sampled randomly according to a normal distribution centered on the measured value for each bin of each WP during the downcast. The probability distribution of the resulting outcomes for all the downcasts collected during the two surveys yielded an average standard deviation of 0.04 m s−1. In addition, the uncertainty concerning the near-bottom current velocity determined by bottom tracking was estimated as the average standard deviation after stacking the data, and amounted to 0.12 m s−1. Finally, an average standard deviation of the absolute velocity—calculated from the sum of the variances of the relative velocities and the absolute near-bottom current—was estimated at 0.13 m s−1.
Geostrophic velocities were estimated using the observed density field. This allowed to determine the degree to which the flow perpendicular to the glider track (generally in the E–W direction during this experiment) can be associated with the horizontal density gradient. The cross-track component of the velocities is thus derived by adjusting the integrated geostrophic velocities in the water column—calculated from the dynamic-height anomaly differences between each pair of downcasts and with a subsurface reference level (5 m, i.e., minimum depth common to each profile)—to the corresponding depth-averaged velocities from ADCP measurements.

3. Results

3.1. Observations Context

Six and 12 complete cross-shelf sections were carried out from the river mouth to the shelf edge, respectively, for the autumnal and winter periods. Analyses (depth-averaged current (DAC) comparison vs. ADCP integrated mean current, geostrophy, and optic vs. acoustic) were done on all sections. For convenience and clarity, we chose one section for each deployment (Section 2 on 11–13 November 2016, and Section 3 on 5–7 February 2017) to illustrate key hydrological, hydrodynamical, and biogeochemical features. The high variability of hydrological and hydrodynamical structures is also addressed in Section 4.
During both deployments, variable wind conditions were observed. Several south-easterly (i.e., marine) wind events of 5–10 m s−1 occurred during both seasons. North-westerly (i.e., continental) winds were observed during the two selected sections (Figure 5a,b), with maximum wind speeds of 21 m s−1 in February 2017. For both deployments, the Rhone River discharges fluctuated between 650–1950 m3 s−1 and 800–2100 m3 s−1, respectively, in autumnal and winter conditions. River discharges were around 1500 and 1900 m3 s−1 for the selected sections, i.e., close to the mean annual flow of the Rhone River (1700 m3 s−1).
The shallowest part of the Rhone River submarine delta was not sampled because the glider was unable to make dives in water depths of less than 30 m. Subsequently, glider sections were divided into two parts: the mid-shelf (4–20 km) and the outer-shelf (>20 km).

3.2. Hydrological Conditions

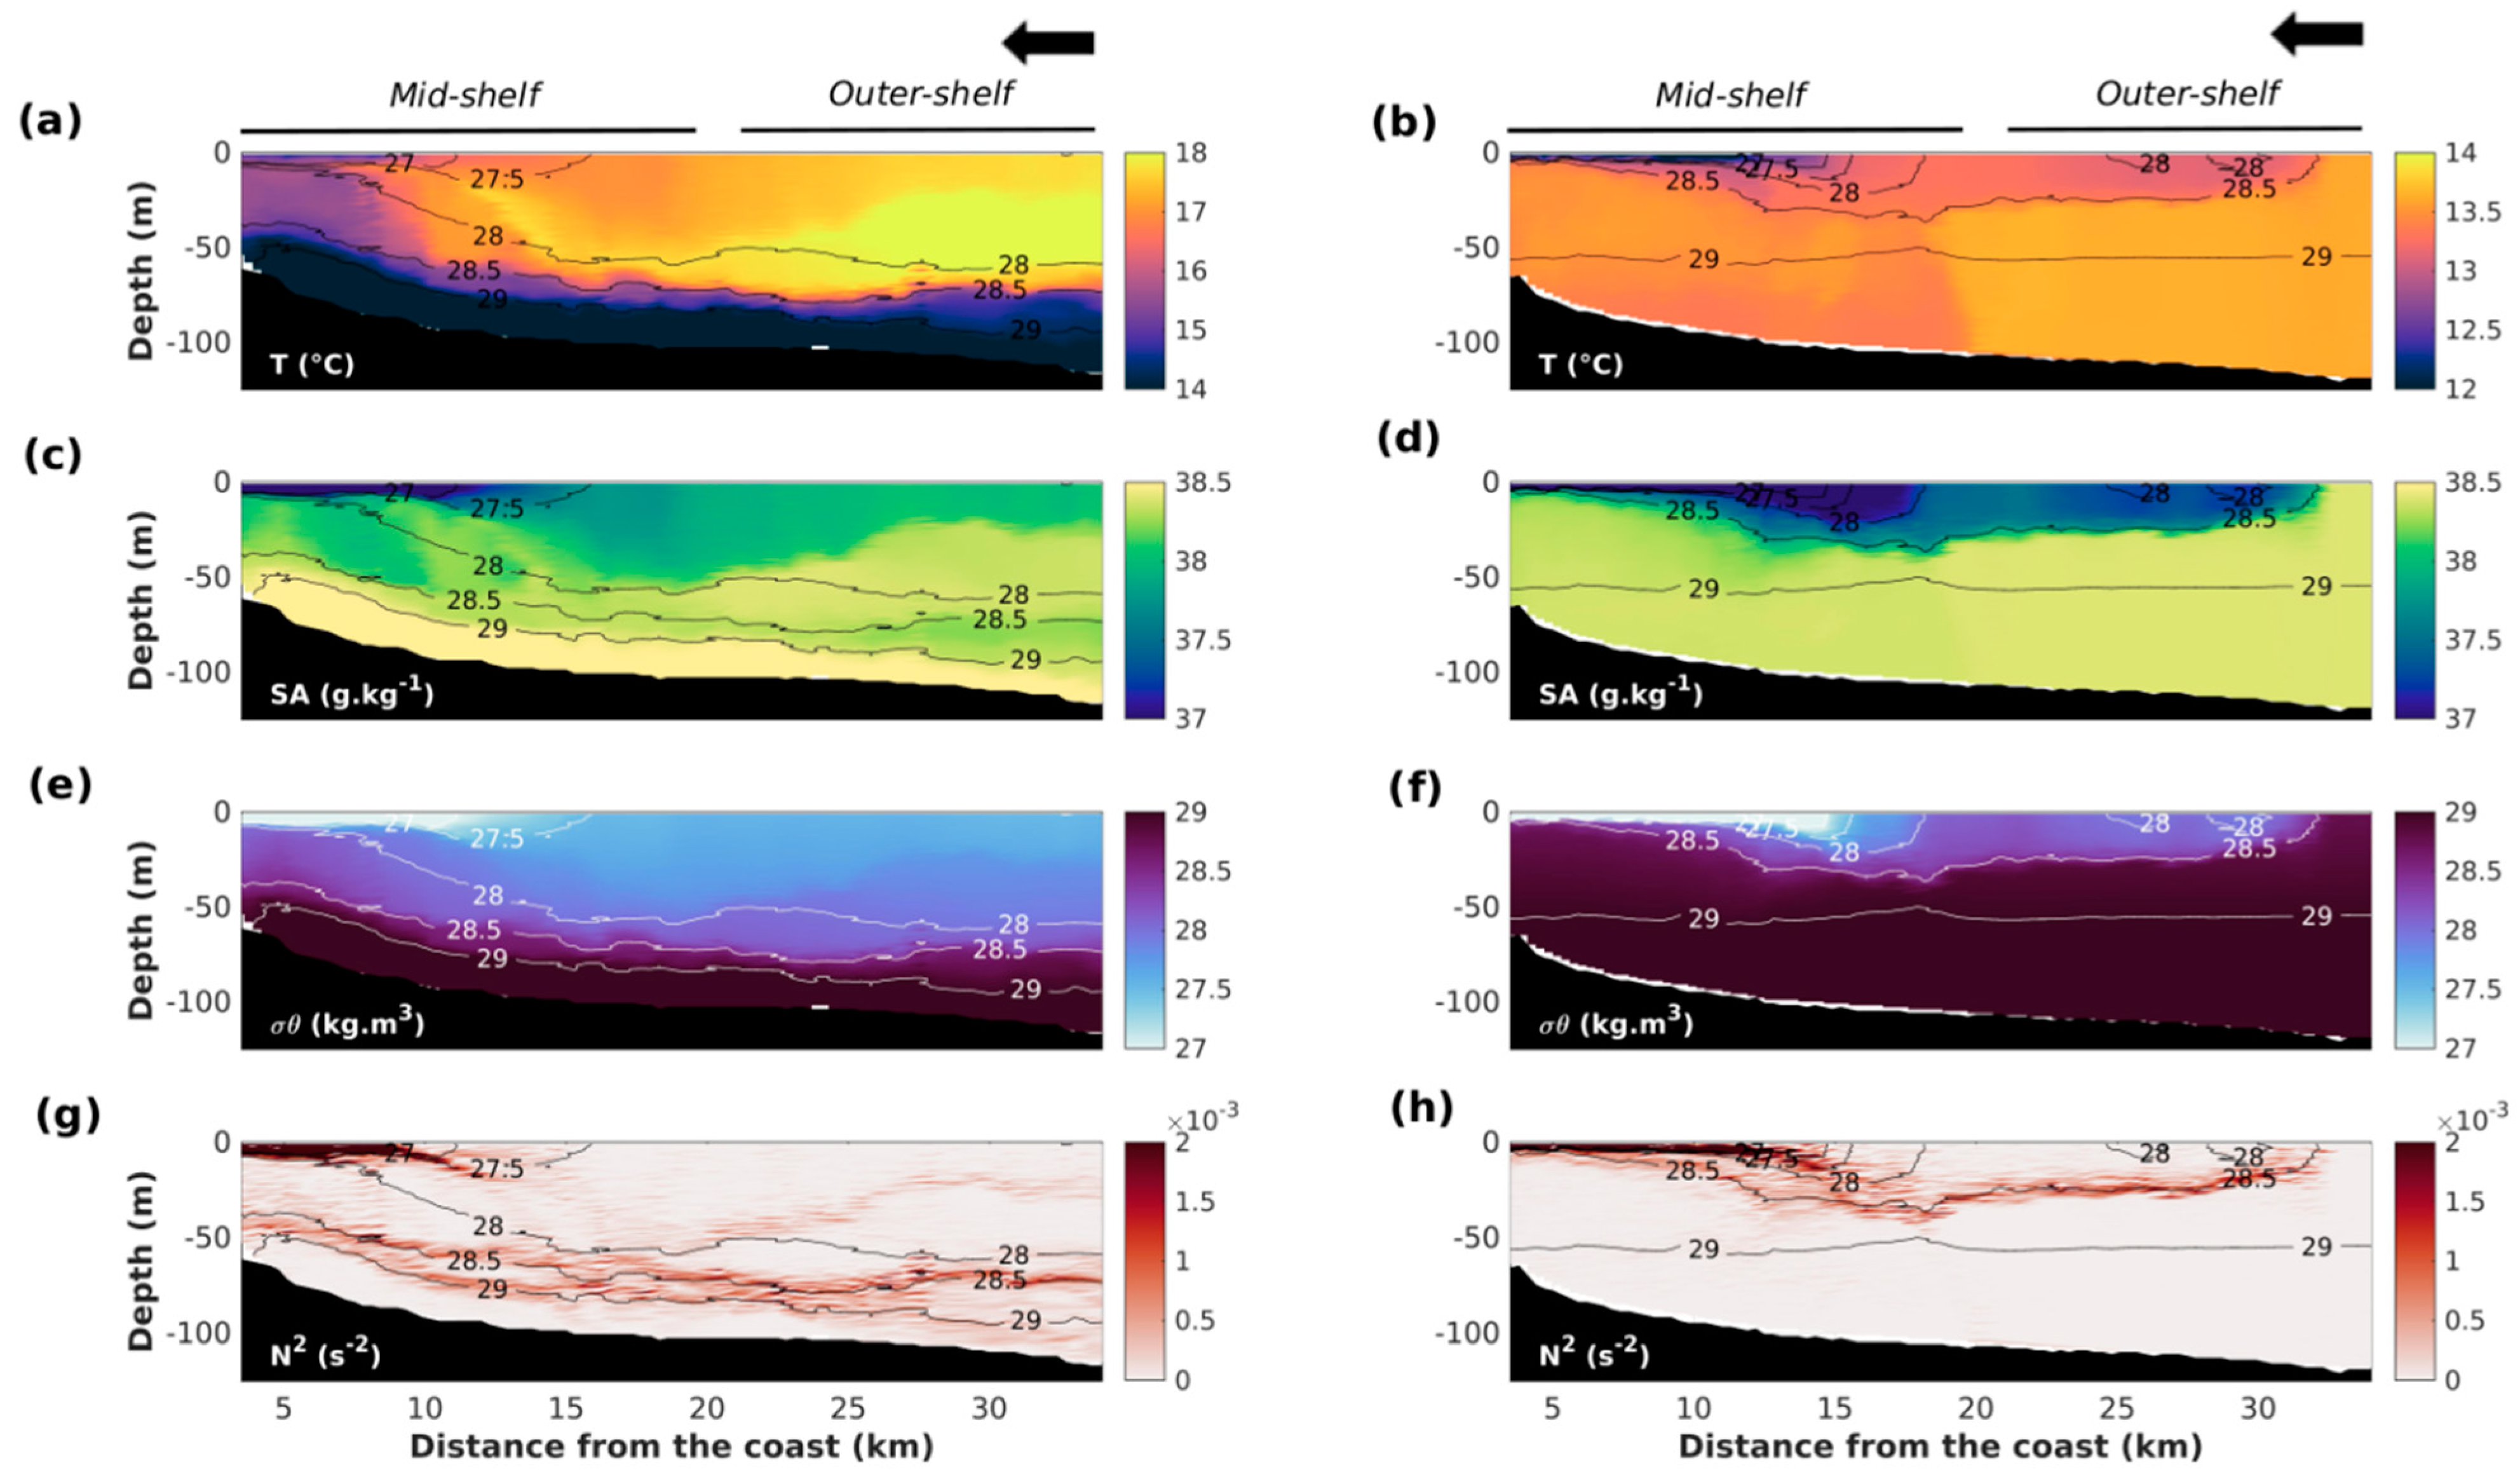
Observations along the selected sections (Figure 6) revealed the offshore extension of the Rhone River surface plume with fresher, colder, and lighter water. During the two study periods, the plume was pushed offshore by continental N–NW winds. The plume extended as far as the shelf break (Figure 6c,d) with a thickness of less than 10 m near the coast, and a thickening up to 15 m offshore. These continental inputs resulted in saline stratification, as shown by the Brunt–Väisälä frequency (N2 > 1.3 × 10⁻³ s−1) in the upper water layer (< 30 m depth) (Figure 6g,h).
During the autumnal period, thermal stratification around 50–60 m depth was observed (Figure 6a,c,e, left panel). Colder (<15.5 °C), saltier (>38.3 g kg−1), and denser water (>28.5 kg m−3) was covered by warmer (≈15.5–18 °C), fresher (≈37.8–38.3 g kg−1), and lighter water (≈27.8–28.5 kg m−3). This seasonal stratification was characterized by Brunt–Väisälä frequencies between 0.8 and 1.3 × 10⁻³ s−1 (Figure 6g).
During the winter season, the water column became homogeneous below the river plume with temperatures around 13.5–14 °C, salinity around 38–38.5 g kg−1, and density anomalies around 28.5–28.8 kg m−3 (Figure 6b,d,f, right panel). The Rhone River plume offshore extension varied significantly during the winter deployment due to wind variability.

3.3. Hydrodynamical Conditions

3.3.1. Validation of Current Measurements

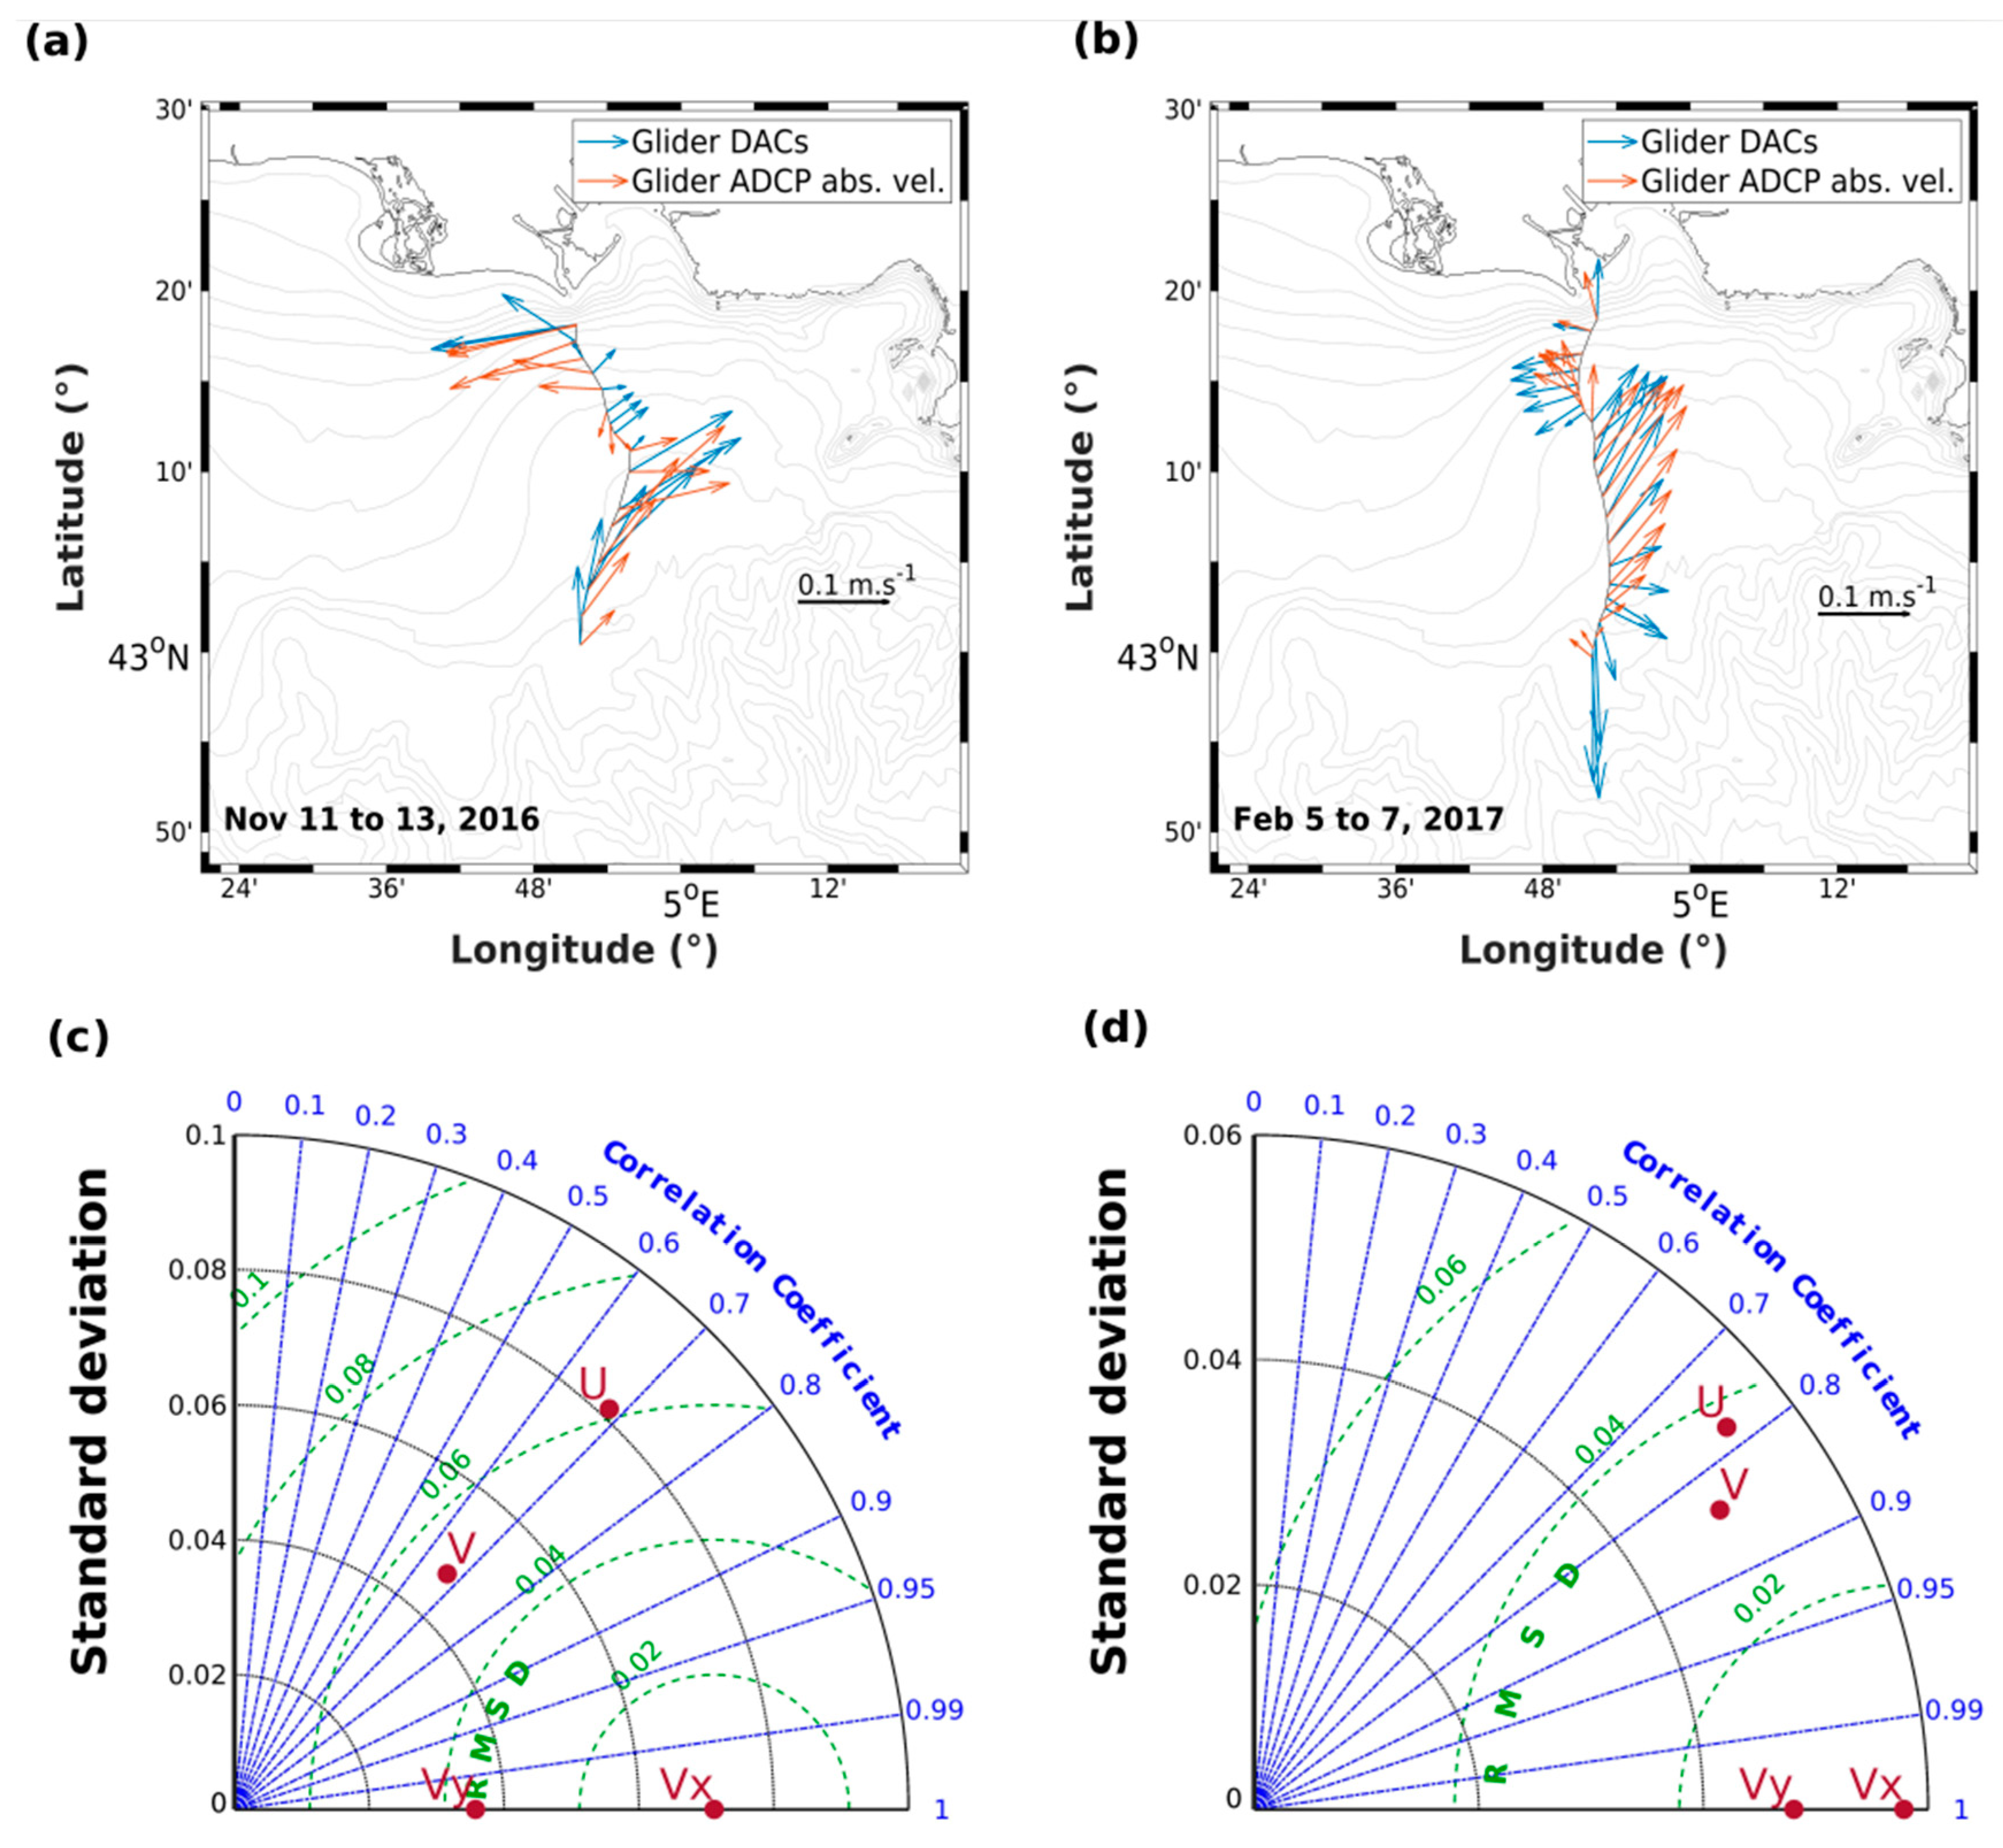
After multiple yos (about six), the glider used GPS positioning to estimate the difference between the expected surface location as calculated through underwater dead reckoning, and the actual new position. Such position difference, relative to the time of dive, allowed the glider to estimate the depth-averaged current (DAC) between two surfacings [9]. To assess the quality of the ADCP measurements compared to this independent estimate of the currents, we contrasted the residual current velocities and direction computed from the downcast ADCP data between two surfacings with the corresponding DAC estimates (see the example on a section in Figure 7a,b). The two estimates of the integrated average current over the water column were broadly comparable and reproduced the main inversions and intensifications of the currents for both periods.
This comparison was also carried out for all sections of each deployment, with the eastward and northward components considered separately (Figure 7c,d). The Taylor diagrams showed a good agreement between the DAC (used as a reference) and the ADCP-derived residual currents. The correlation coefficient for the 2016 and 2017 surveys, respectively, was 0.69 and 0.78 for u, and 0.68 and 0.84 for v. Furthermore, the average standard deviation was 0.06 and 0.05 m s−1, while the average RMSD was around 0.06 and 0.04 m s−1, respectively, for the 2016 and 2017 deployments.

3.3.2. Characteristics of Observed Coastal Currents

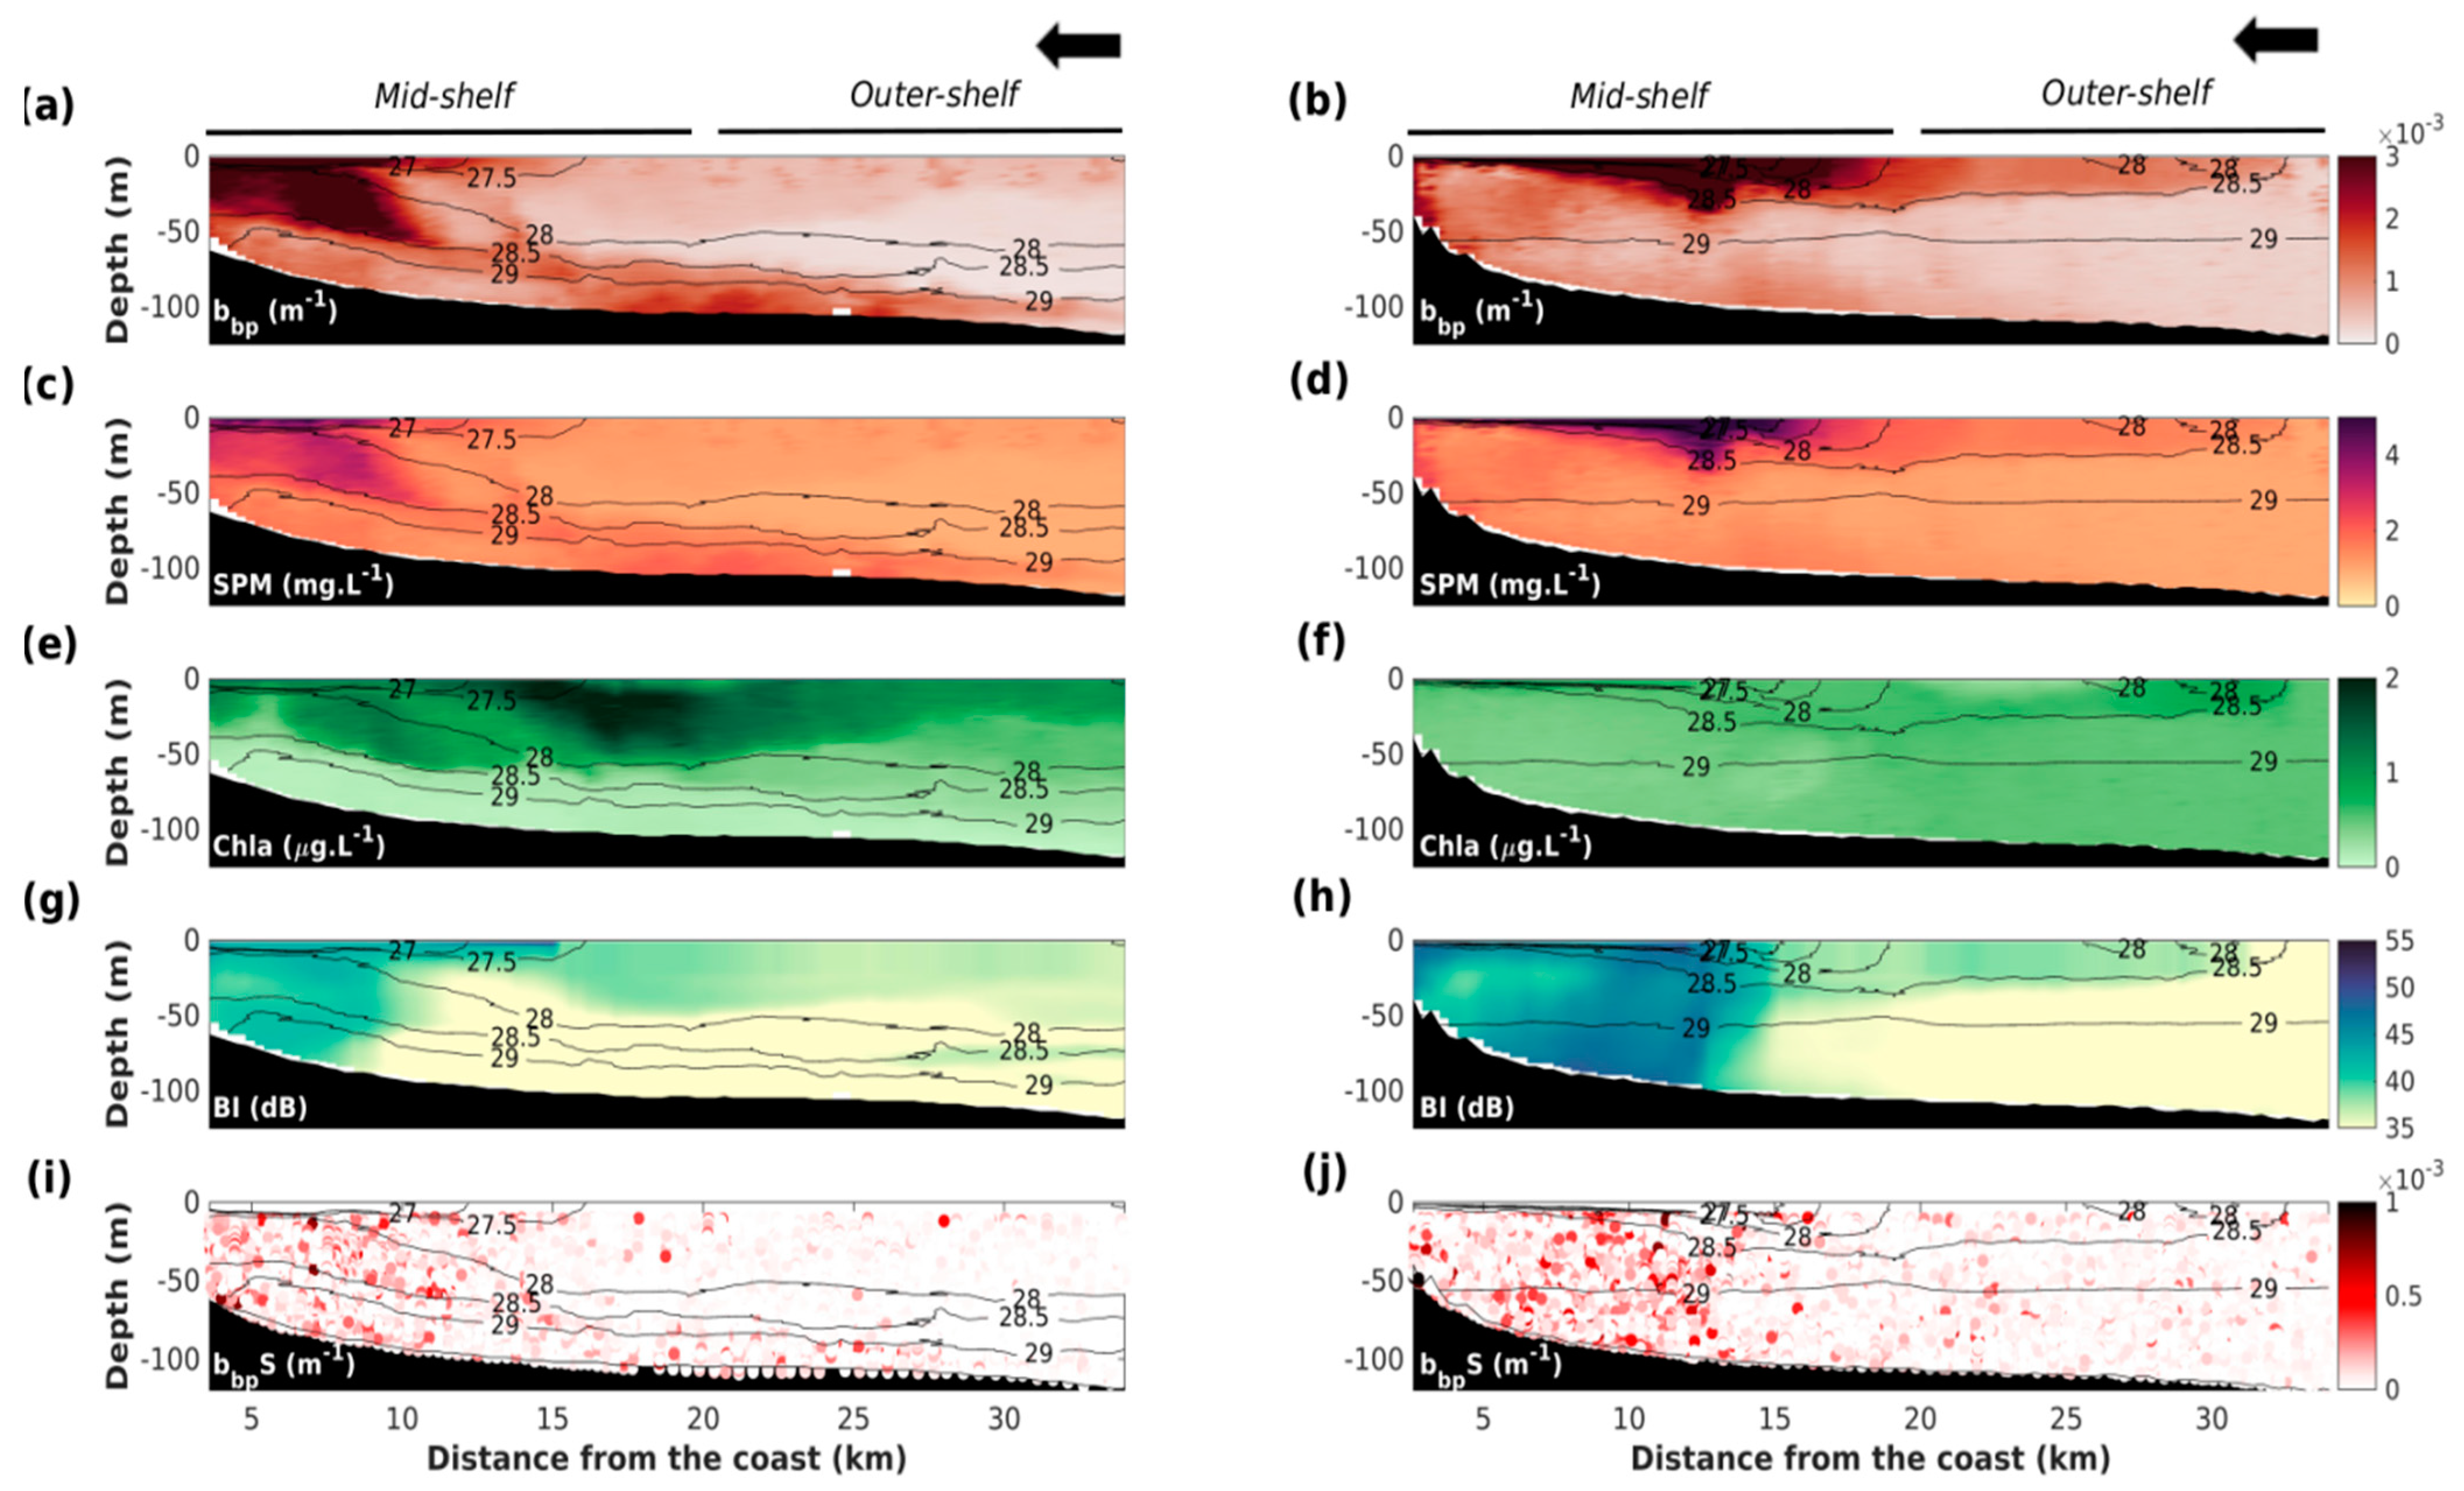
Figure 8 shows the components of the cross-shelf (N–S) and along-shelf (E–W) currents derived from ADCP measurements for the selected sections. For the E–W and N–S components, current velocity (starting at 3 m under the surface) was generally homogeneous throughout the water column, with a maximum intensity of 0.5 m s−1. However, strong northward subsurface currents were sometimes observed on the outer-shelf, as in the section dating from 5 to 7 February 2017 (Figure 8b). A westerly coastal current (v ≈ -0.4 m s−1) was often observed during autumnal conditions on the mid-shelf (up to 13 km) (Figure 8c). During winter conditions, the inner part of the slope current was observed at the shelf edge (not shown here).

3.4. Cross-Shelf Variability of Biogeochemical Variables

Optical and acoustic turbidity sections observed for the two selected periods are presented in Figure 9. Surface optical turbidity (Figure 9a,b) and, incidentally, suspended particulate matter concentrations (Figure 9c,d) decreased rapidly seaward from 6 mg L−1 next to the river mouth to 1 mg L−1 at the shelf break for both periods. Highest concentrations were observed in the plume. However, on some sections, a thin bottom nepheloid layer was observed with an SPM concentration around 2 mg L−1. Finally, from 11–13 November 2016 an intermediate nepheloid layer extended over the mid-shelf from 5 to 50 m depth, with a concentration of around 3 mg L−1.
The concentration of chlorophyll-a was maximum in the surface layer, and its depth distribution was limited by the stratification. A chlorophyll-a rich layer (1–2 µg L−1), with maximum thickness on the mid-shelf (10–20 km offshore), was visible in November 2016 (Figure 9e). During February 2017, chlorophyll-a concentration was both low (<0.5 µg L−1) and homogeneous in the water column (Figure 9f).
Observations show that the acoustical backscatter index (Figure 9g,h) and optical spikes (Figure 9i,j) were higher on the mid-shelf for both deployments. An increase in the intensity of the spike signal was observed at the base of the intermediate nepheloid layer along the seasonal pycnocline (around 50–60 m depth) from 11–13 November 2016 (Figure 9i). During the autumnal deployment, the strong density stratification of the water column induced a significant change of the refractive index (Figure 2a,b). The absence of a turbidity anomaly on either side of this interface indicates there was no Schlieren effect.

4. Discussion

4.1. Currents Observation by Glider-Mounted ADCP

Validation of absolute water velocities: differences are observed between the DAC computed using glider drift and dead reckoning, and the ADCP sensor. The ADCP samples neither during upcasts (transducer misalignment) nor at the surface (blanking distance close to the transducer and downward position), which may explain the main differences. However, the correlation coefficients between both components of the residual currents computed from glider drift and the ADCP range between 0.69 and 0.84. These highly significant correlations (p-value < 0.001), with a mean bias between 0.05 and 0.06 m s−1, give us some confidence in the method used for the estimation of absolute velocities.
The average uncertainty of the absolute current profile derived from the shear method is estimated at 13 cm s−1, mainly due to the bottom tracking uncertainty which is about 12 cm s−1. The ADCP sampling rate is likely the main parameter affecting the quality of the bottom tracking measurements, as our sampling frequency (0.1 Hz—1 ping per ensemble) was 10 times lower than that used in other studies (1 Hz—10 pings per ensemble) [6,13]. Nevertheless, in yet another study, the total uncertainty estimated from the shear method and a similar instrument (DVL mounted on a Slocum glider)—but with a higher temporal resolution (1 Hz sampling frequency, ensembles averaging every 3.5 s)—was also close to 10 cm s−1 [26]. An error velocity of 6 cm s−1 has previously been achieved using the inverse method with several constraints (DAC, surface current, and modelled velocity) and a high sampling frequency (1 Hz) [13]. In spite of a higher uncertainty in current measurement, the chosen sampling strategy in our study allows deployments of several weeks. This choice was motivated by our intention to capture sporadic events, which are key elements of sediment dynamics in the coastal zone. Future deployments using different optimizations of sampling parameters (increasing the size of the bins, reducing the number of bins, increasing the acquisition frequency [27], and doubling the bottom tracking pings [25]) should be investigated in order to assess the reduction of uncertainty in current estimations, while continuing to maintain autonomy.
Coastal current dynamics: the geostrophic component of the along-shelf flow (Figure 8e,f) shows that the main structures of the ADCP-derived absolute currents were preserved. A least squares regression method was used to estimate the relationship between the geostrophic and absolute velocities, for all sections (Table 1). Coefficients of determination (r2) were highly variable (0.02–0.99) from one section to another for both seasons. Coefficients of determination of all the data were high, between 0.69 and 0.8, respectively, in the autumn and winter seasons (Table 1). The local density field, which is affected by the freshwater input from the Rhone River, appears to play a major role in the coastal current dynamics.
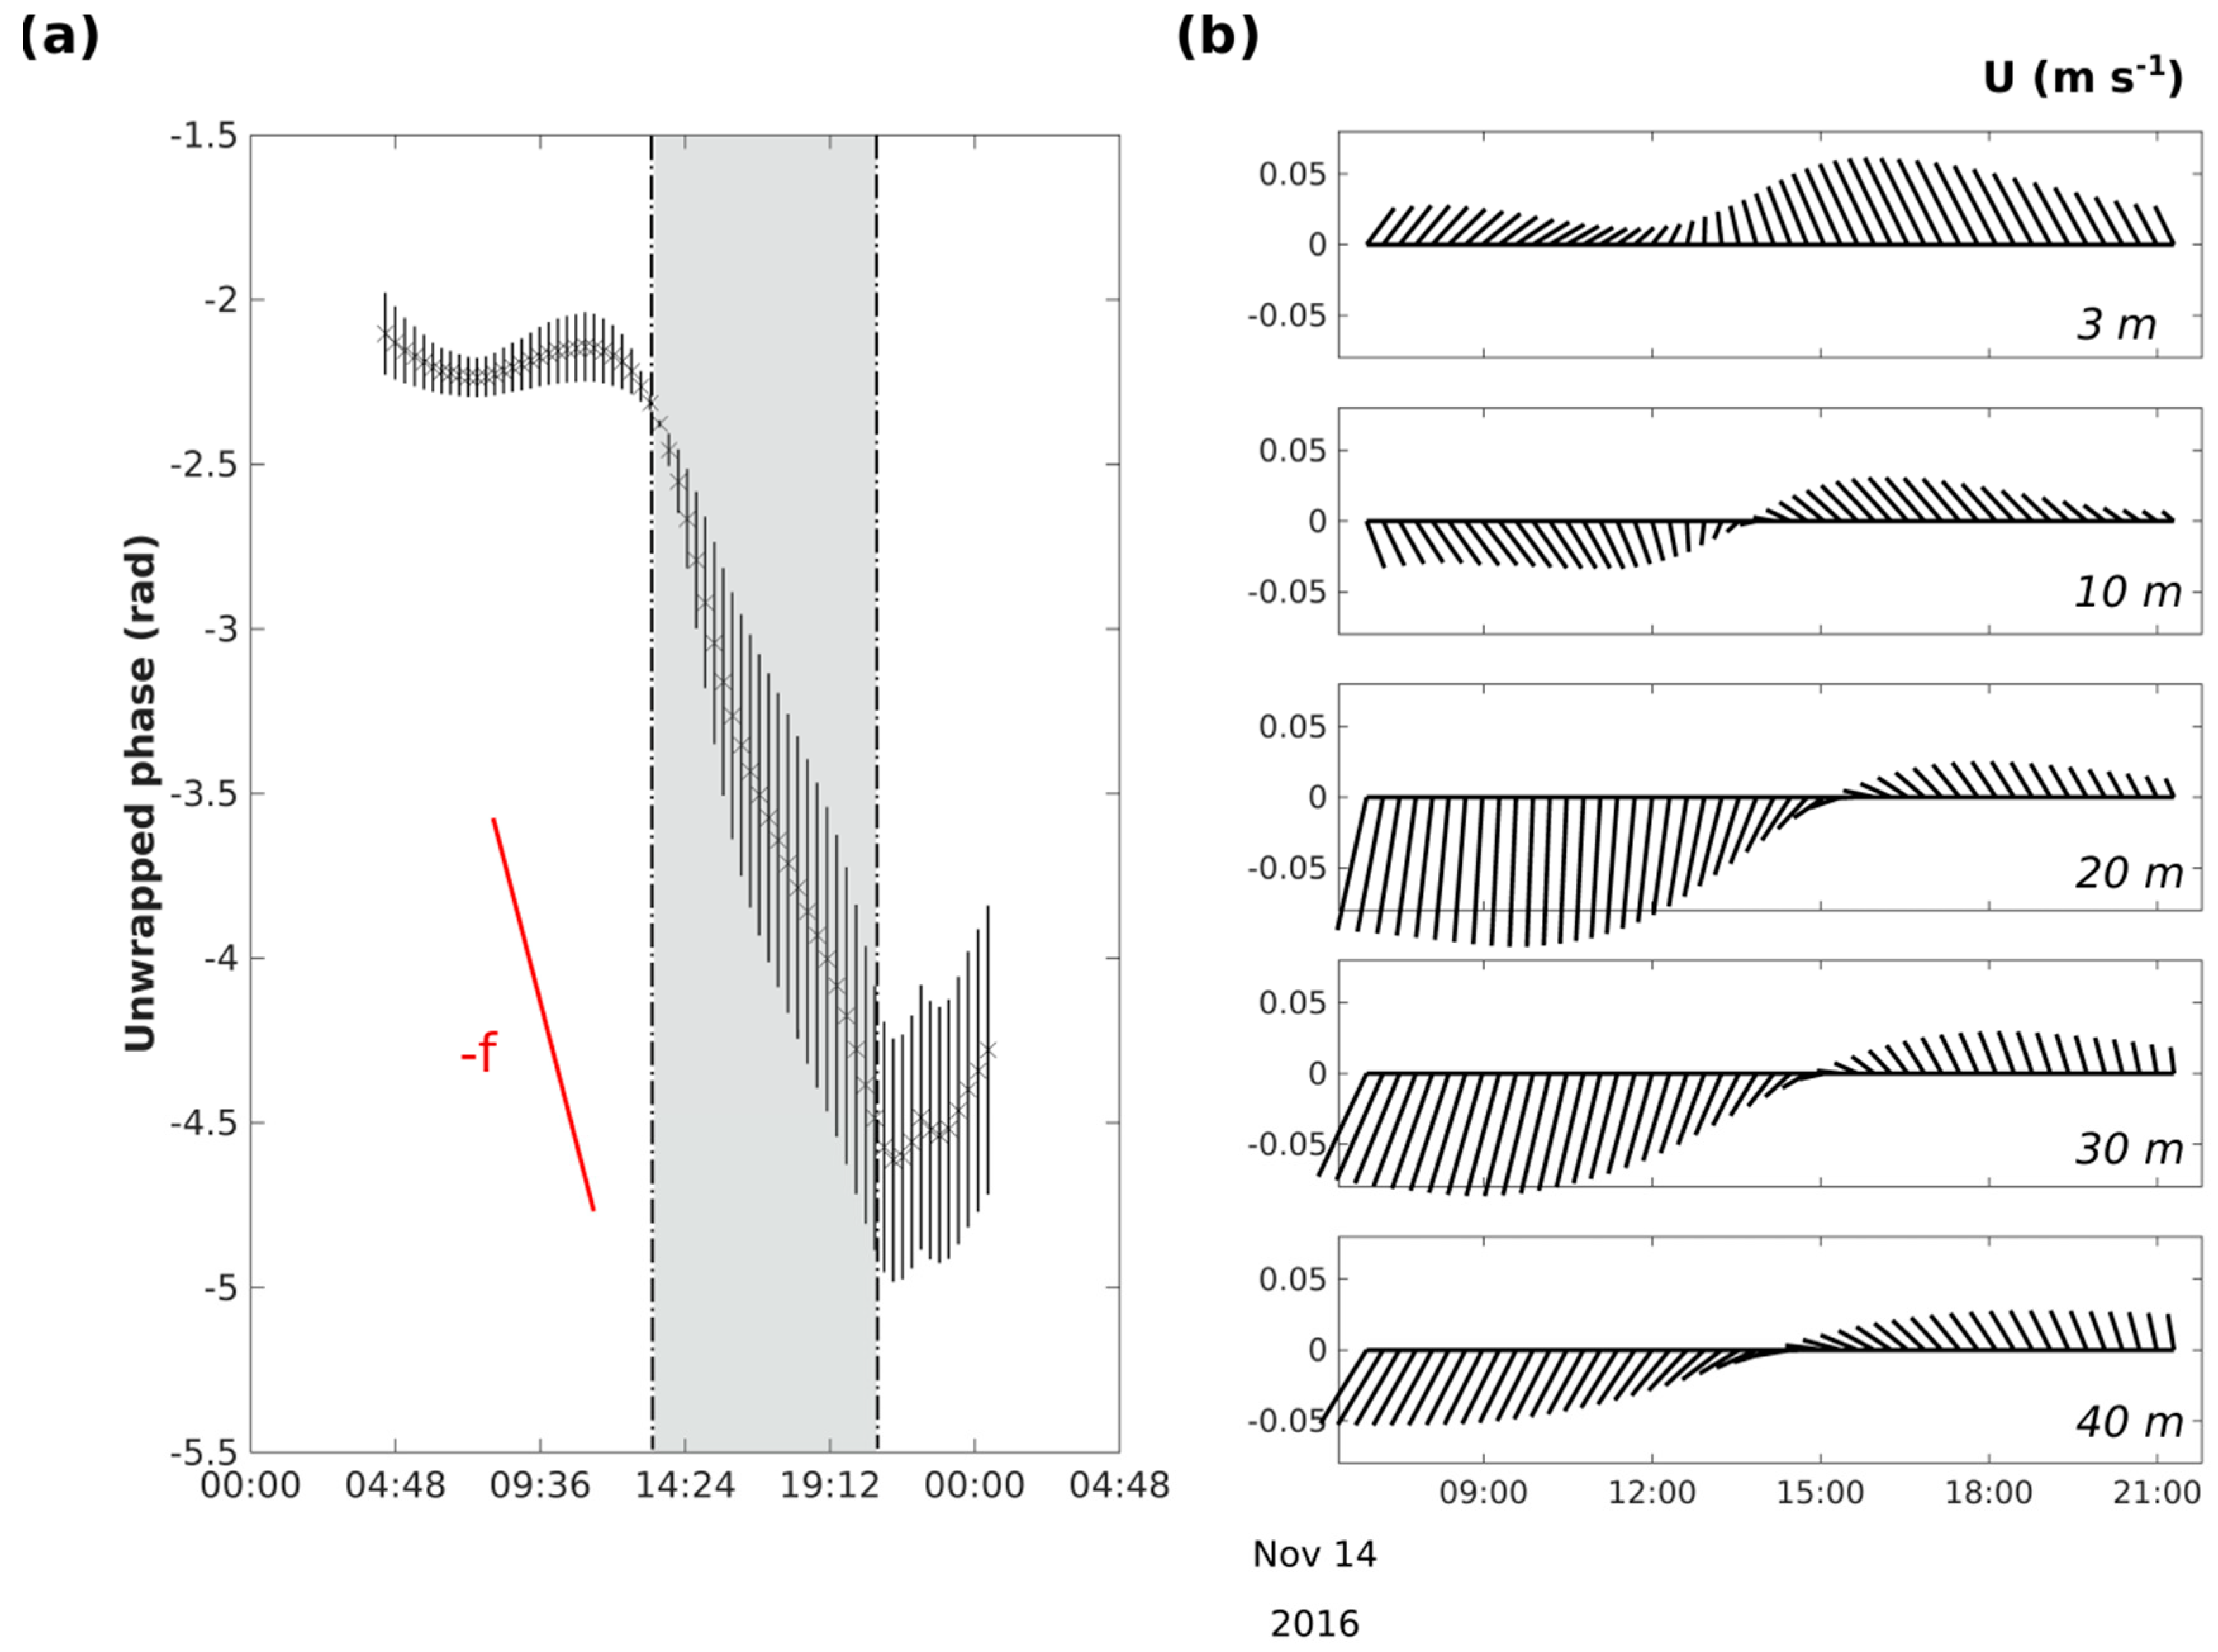
However, wind may be a cause of non-geostrophic motion. The intense NW gusts of 5–7 February 2017 (shaded area on Figure 5b), with speeds up to 21 m s−1, pushed the fresh surface (0–3 m depth) water offshore inducing a strong northward subsurface counter-current (3–30 m depth) (Figure 8b). Satellite measurements of sea surface temperature in summer [38], and hydrodynamic modeling studies [39,40,41,42] have, indeed, described the presence of coastal upwelling in this region under the effect of N–NW winds. Moreover, near-inertial currents are recurrent on the Gulf of Lions shelf, where they tend to be triggered by windy events [43,44]. They appear as rotational movements with characteristic diameters of a few kilometers and currents of about 10 cm s−1. Using the method of unwrapping the phase of the shear vector of the current [45], between 3 and 40 m depth on glider sections, we were able to isolate periods when currents had a rotating component with a frequency close to the local Coriolis frequency (17.5 h) (Figure 10a). Figure 10b shows the clockwise near-inertial current component of a few cm s−1 superimposed on a baroclinic mean current. These inertial currents were observed at the end of the section on the outer-shelf following a strong NW wind episode that lasted several days. Current data collection ceases while the glider negotiates the half turn necessary for changing direction. Unfortunately, these data gaps prevent from observing the integrality of an inertial period.
Gliders thus appear to be unique tools for high resolution characterization of such transient phenomena throughout the entire water column and across the continental shelf.

4.2. Turbidity Observation by Glider Optical and ADCP Sensors

Optical and acoustic signals vary significantly with respect to particle concentration and to particle properties such as size, nature, and shape [46,47]. In addition, particle abundance in the Rhone River ROFI decreased by six orders of magnitude, ranging between particles of a few μm and those of 300 μm in size [48]. In this study, we hypothesize that optical spikes and acoustic backscatter sample a similar size range of particles.
Optical backscatter sensors that sample a small volume (approximately 1.10−6 m3) are preferentially sensitive to fine particles. Indeed, measured optical turbidity for a given concentration of suspended particles increases with decreasing particle size, due to both increased abundance and to light scattering from smaller particles. Although not very abundant, aggregates with sizes between a few tens and a few hundreds of microns [48] often appear as spikes on the optical signal.
For acoustical measurements, the ADCP used in this work, with a frequency of 614.4 kHz, has a peak sensitivity for particles of 775 μm in diameter [49], which represents the upper limit of the observed aggregates. Its sensitivity is 10–170 times lower for particles of 200 and 50 μm in diameter, respectively. Finally, the ADCP samples large insonified volumes—e.g., considering bins of 1 m and an acoustic beam width of 2°, the volume derived from the “footprint” of a single beam ranges between 1.10−3 m3 at 2 m and about 1 m3 at 20 m from the transducer—which may contain a significant number of aggregates.
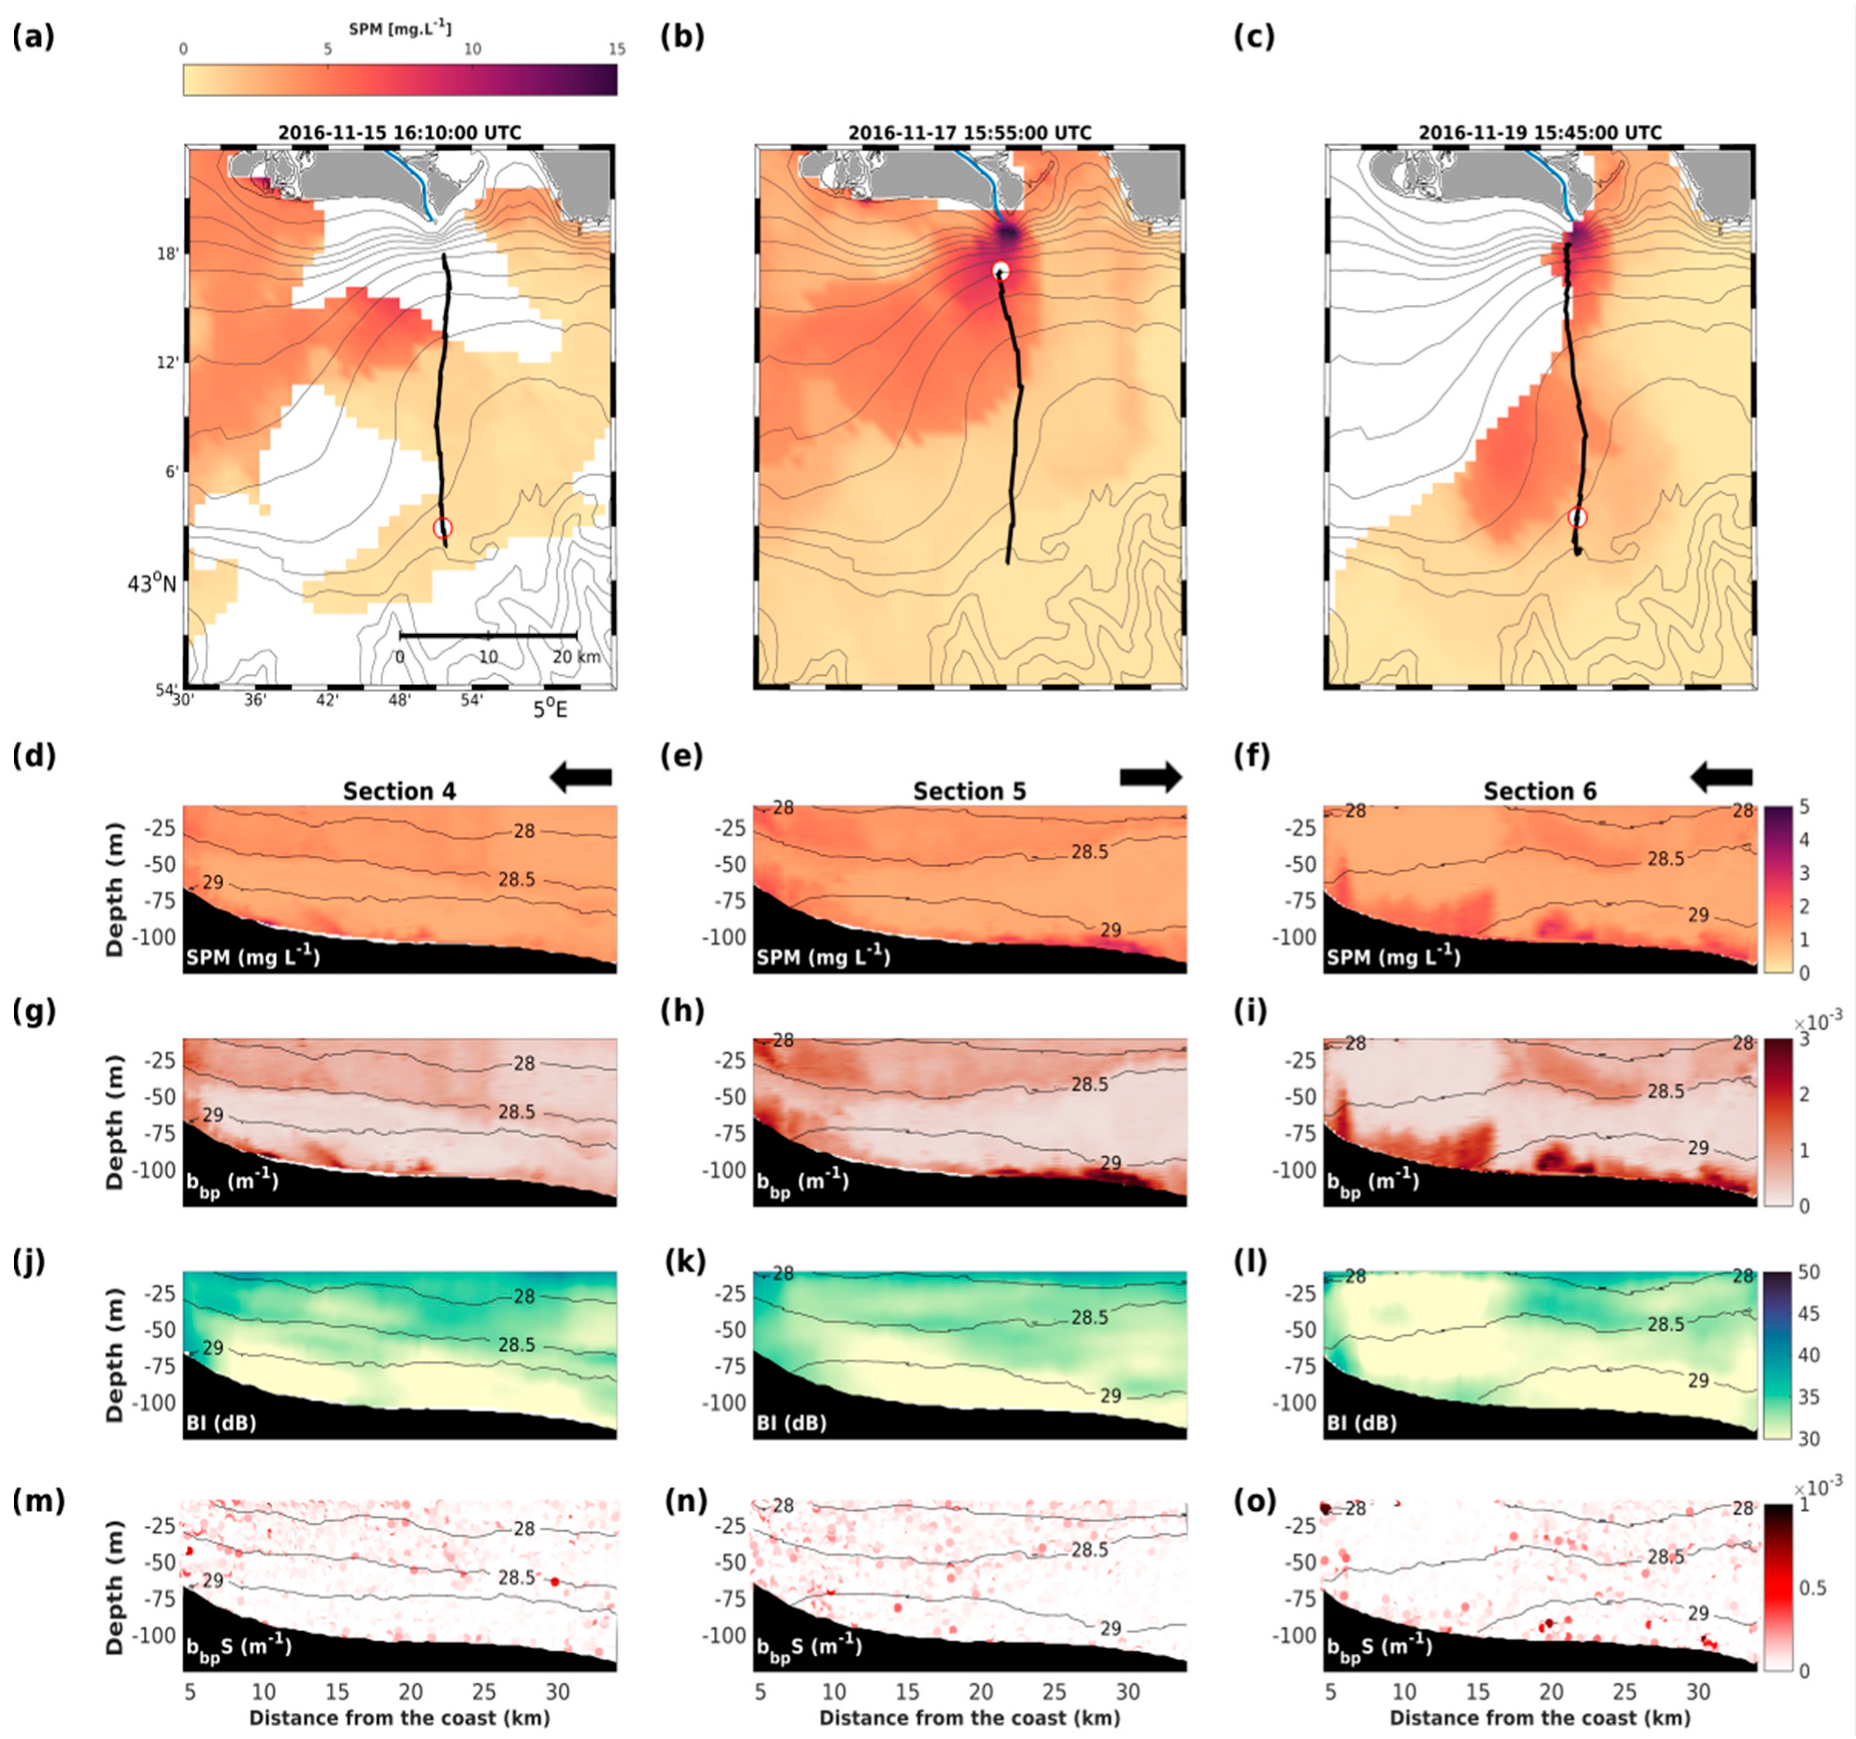
A comparison of the different optical turbidity and acoustic backscatter index sections during the two deployments reveals both similarities (e.g., sections 5 and 6 in November 2016; Figure 11) and dissimilarities (e.g., sections 2, 3, and 4 in February 2017; Figure 12). For sections with similarities, mainly in the autumnal season, the distribution of optical spikes reproduces the main structures of both optical turbidity and acoustic backscatter index (Figure 9a,g,i; Figure 11). This concordance suggests that both instruments perceive signals from a narrower particle size distribution, mostly consisting of fine and micro-aggregate particles, in an equivalent manner. The presence of the intermediate nepheloid layer can thus be explained by the accumulation along the pycnocline of fine particles and micro aggregates that are insufficiently dense to move across this density interface.
For sections with substantial dissimilarities, mainly during the winter season, it can be seen that the distribution of optical spikes differs from optical turbidity structures, but strongly corresponds to acoustic backscatter index structures (Figure 9b,h,j; Figure 12). This suggests that there are indeed two distinct (fine vs. large), relatively abundant particle size populations. The optical backscatter sensor detects these two populations through the base signal on one hand and the spikes on the other hand (Figure 9b,j; Figure 12), while the ADCP mainly senses the coarser fraction. This interpretation is in agreement with observations on particle size distribution in the Rhone ROFI area completed at the beginning of the February 2017 deployment [48]. Using LISST-100 and LISST-HOLO in situ grain sizers, those authors showed the concomitant abundance of fine particles (<30 μm), micro aggregates (between 30 and 100 μm), and large aggregates (up to 400 μm) on the proximal part of the mid-shelf, at both the surface and the bottom. They revealed the presence of large particles—both aggregates and planktonic organisms (e.g., copepods)—in the surface layer further offshore, where we observe an increase in acoustic backscatter index, corresponding to the increase in chlorophyll-a concentration (Figure 9e–g).
Our study illustrates the complementarity between concomitant optical and acoustic backscatter measurements from a glider to characterize the dynamics of different particle size populations. These results are consistent with observations made on the New Jersey shelf [18], which focused on intercomparison of acoustic and optical sensors to estimate sediment resuspension and transport. However, this information remains qualitative in nature, and there is currently no single glider-based instrument for the accurate description of variability and size of SPM in the water column. Recent technological advances have made it possible to integrate a Sequoia LISST-Glider [50] or a Hydroptics UVP6-LP (www.hydroptic.com/index.php/public/Page/product_item/UVP6-LP), and more quantitative estimates can legitimately be expected soon.

4.3. Estimates of SPM Fluxes

Sediment transport plays a key role in the dynamics of coastal areas. However, the quantification of these fluxes on the continental shelf is still poorly documented, as over the last two decades measurements have been carried out mainly in a single given location, using bottom-mounted instruments [51,52,53,54]. In the Rhone ROFI area, quantitative studies have been derived solely from modelling [55,56]. However, the combined measurement of currents and particle concentration along a glider’s trajectory has allowed us to estimate along- and cross-shore SPM fluxes. We calculated the integrated SPM fluxes throughout the water column by considering homogeneous currents and SPM concentrations in the surface and bottom layers not sampled by the glider. The fluxes were then cumulated over the entire length of each section. We estimated the uncertainty on cumulative SPM fluxes by propagating the average relative uncertainties related to the currents (≈70%) and SPM concentrations (≈35%). Relative error was seen to increase with decreasing SPM and water fluxes, ranging from 20% to 600%.
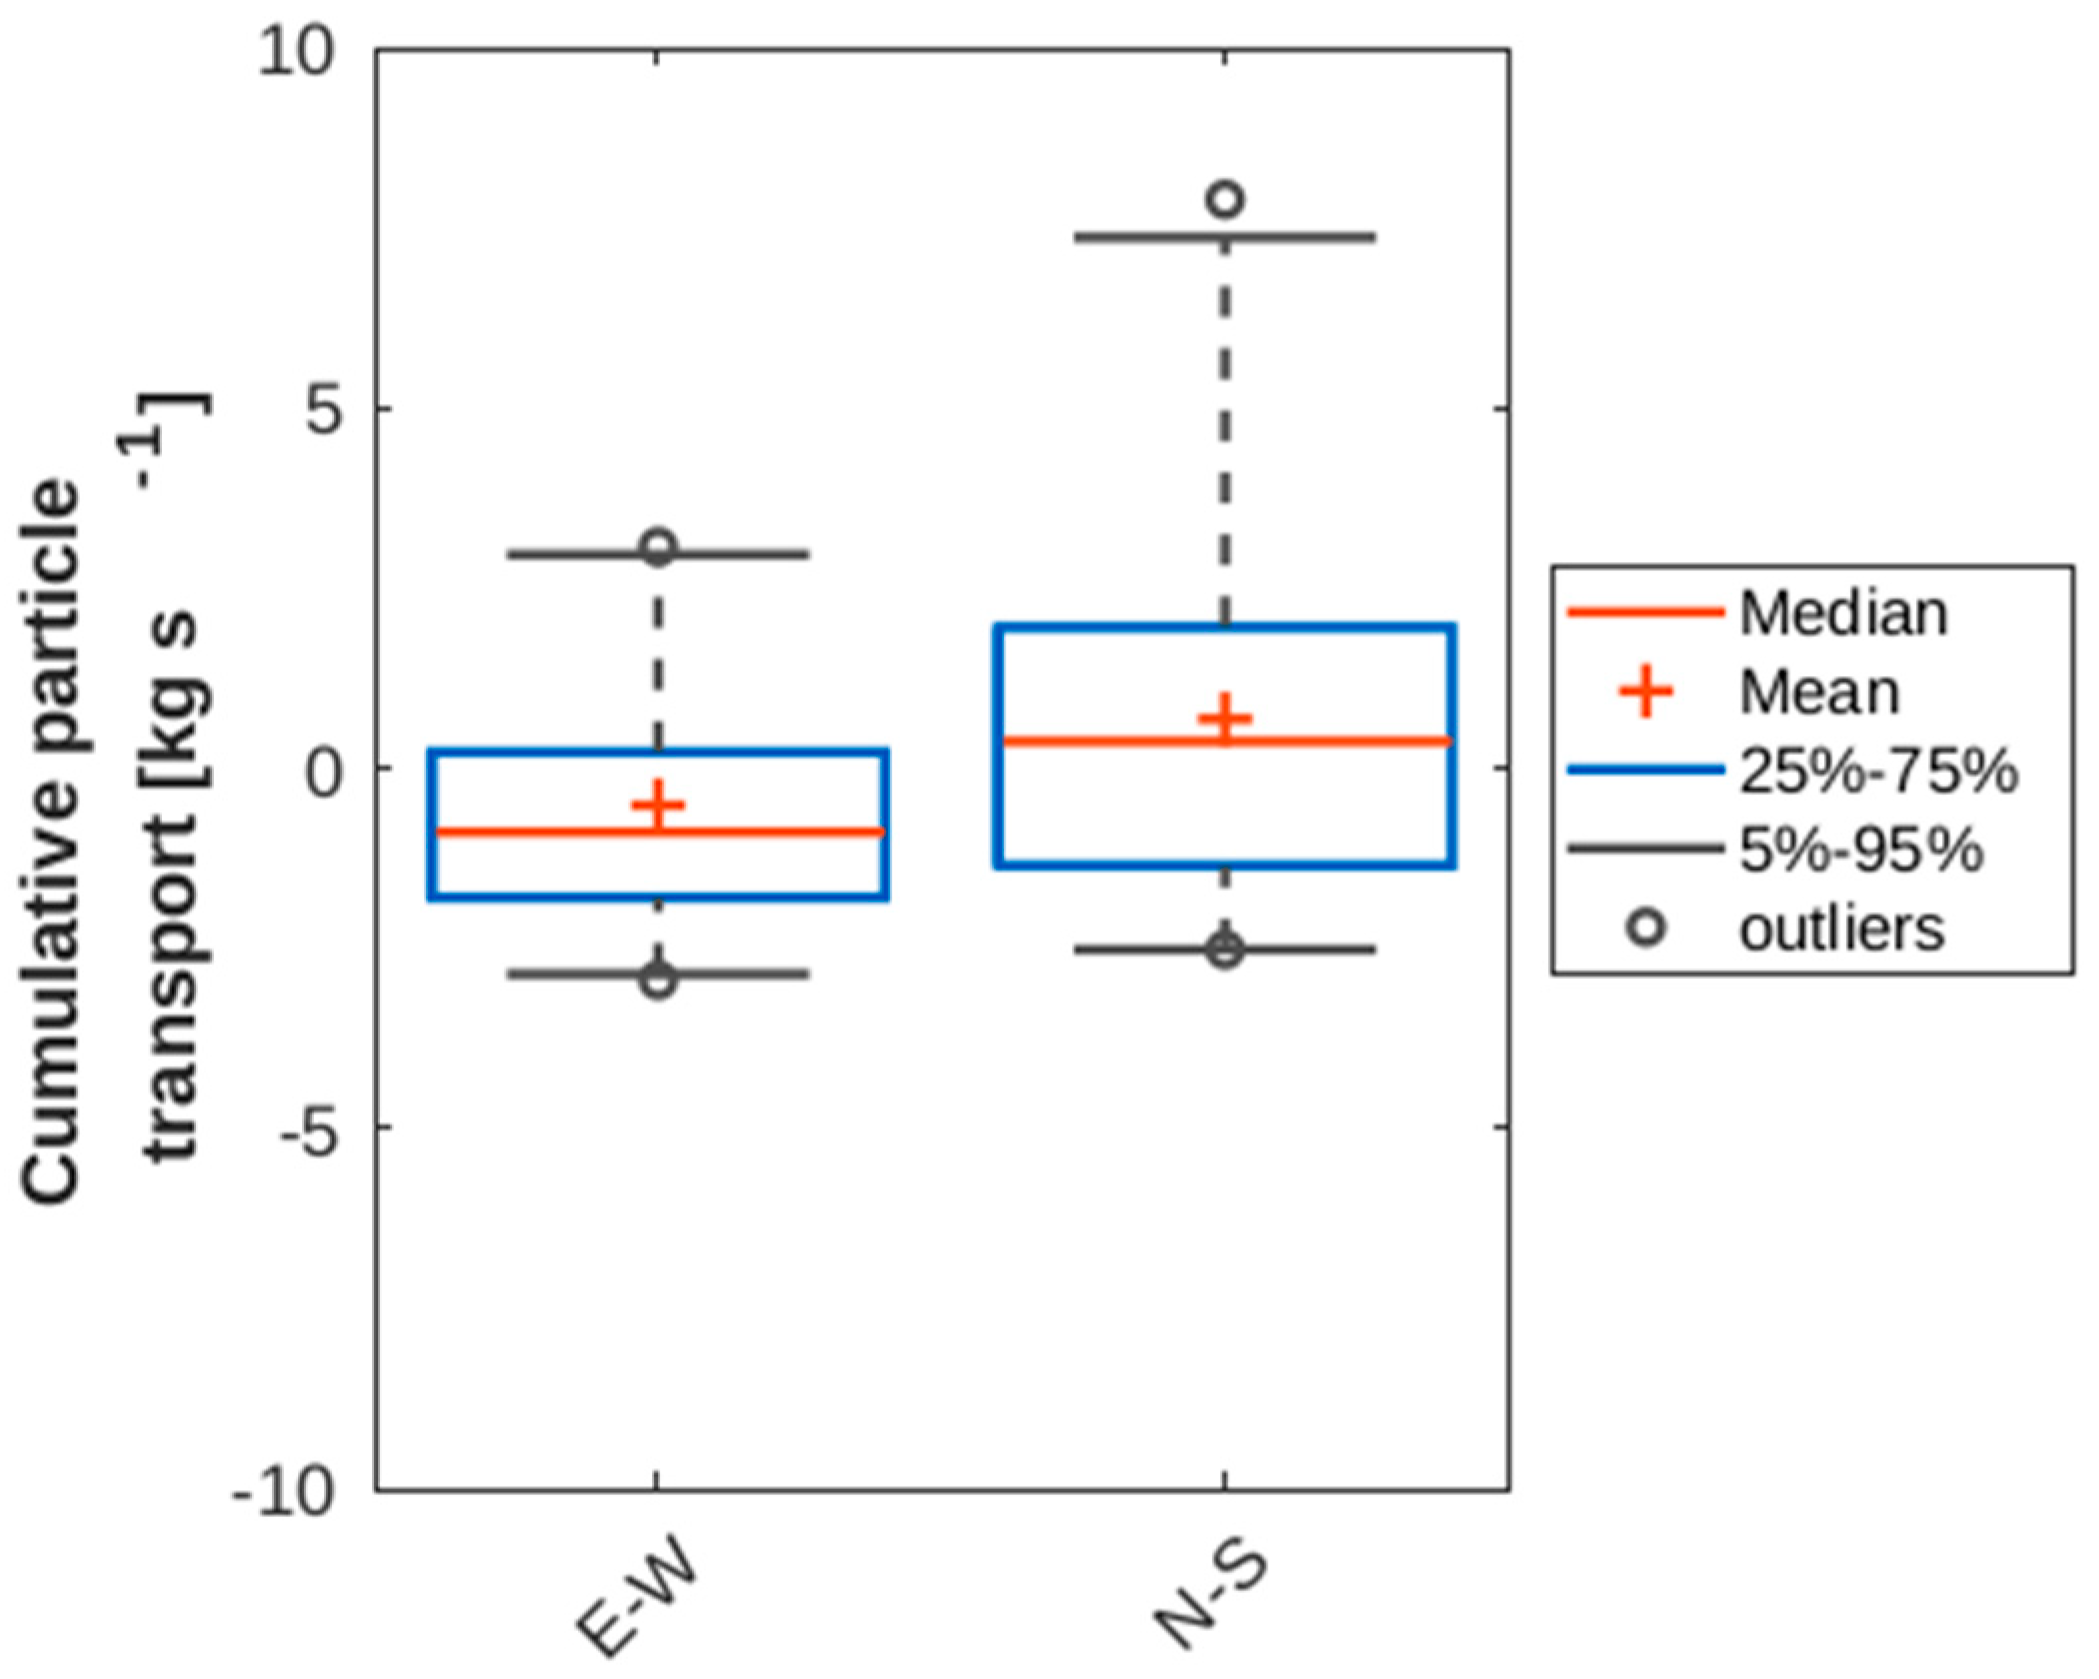
The along-shelf (E–W) and cross-shelf (N–S) SPM fluxes for the different glider sections are variable but generally remain lower than ±5 kg s−1 (Figure 13). The highest value (8 kg s−1) corresponds to the period from 5–7 February 2017, during which a strong NW wind induced an upwelling on the shelf, with the highest subsurface current (up to 0.5 m s−1) and SPM concentration (≈6 mg L−1) (Figure 8b and Figure 9d).
In the absence of storm or flood events, however, estimated SPM fluxes remain low, about one order of magnitude lower than the SPM fluxes from the Rhone River during the same periods (10–130 kg s−1). This suggests a significant deposition next to the river mouth in line with [57,58,59]. Estimated SPM fluxes are also three orders of magnitude lower than those observed on the Catalan shelf in the Gulf of Lions during stormy conditions [5]. We see here the difficulty of estimating SPM flows with a reasonable level of certainty because this requires accurate conversion of optical turbidity or acoustic backscatter index signals into SPM concentration. This step therefore remains challenging because of the great variability in the nature of the suspended particulate material, especially in coastal areas and during storms or flood events.

4.4. SPM Dynamics from Glider vs. Satellite Observations

Several studies have emphasized the value of combining satellite and glider measurements to accurately characterize SPM dynamics in coastal areas, especially during extreme events [5,6,60]. We compared satellite images of surface SPM concentrations with those observed by the glider close to the surface in order to assess their complementarity in terms of monitoring turbidity in the Rhone’s ROFI. The relationship between SPM derived from glider/MODIS measurements can be expressed as SPMMODIS = 2.6 × SPMGlider, with a coefficient of determination of 0.87, which is very similar to observations already made in this area [61].
The Rhone’s ROFI is a complex system in which the high spatial and temporal variability of the river plume can shift by several kilometers in a few hours, depending on wind and river discharge conditions. For stable conditions, or when satellite data are partial (Figure 11a,c) or lacking (Figure 12a,c) due to cloud cover, glider measurement near the surface ensures some continuity between daily satellite snapshots. The complementarity of the glider as a tool resides primarily in the fact that gliders make it possible to describe the vertical extension of superficial structures in the water column, such as the turbid plumes of rivers.
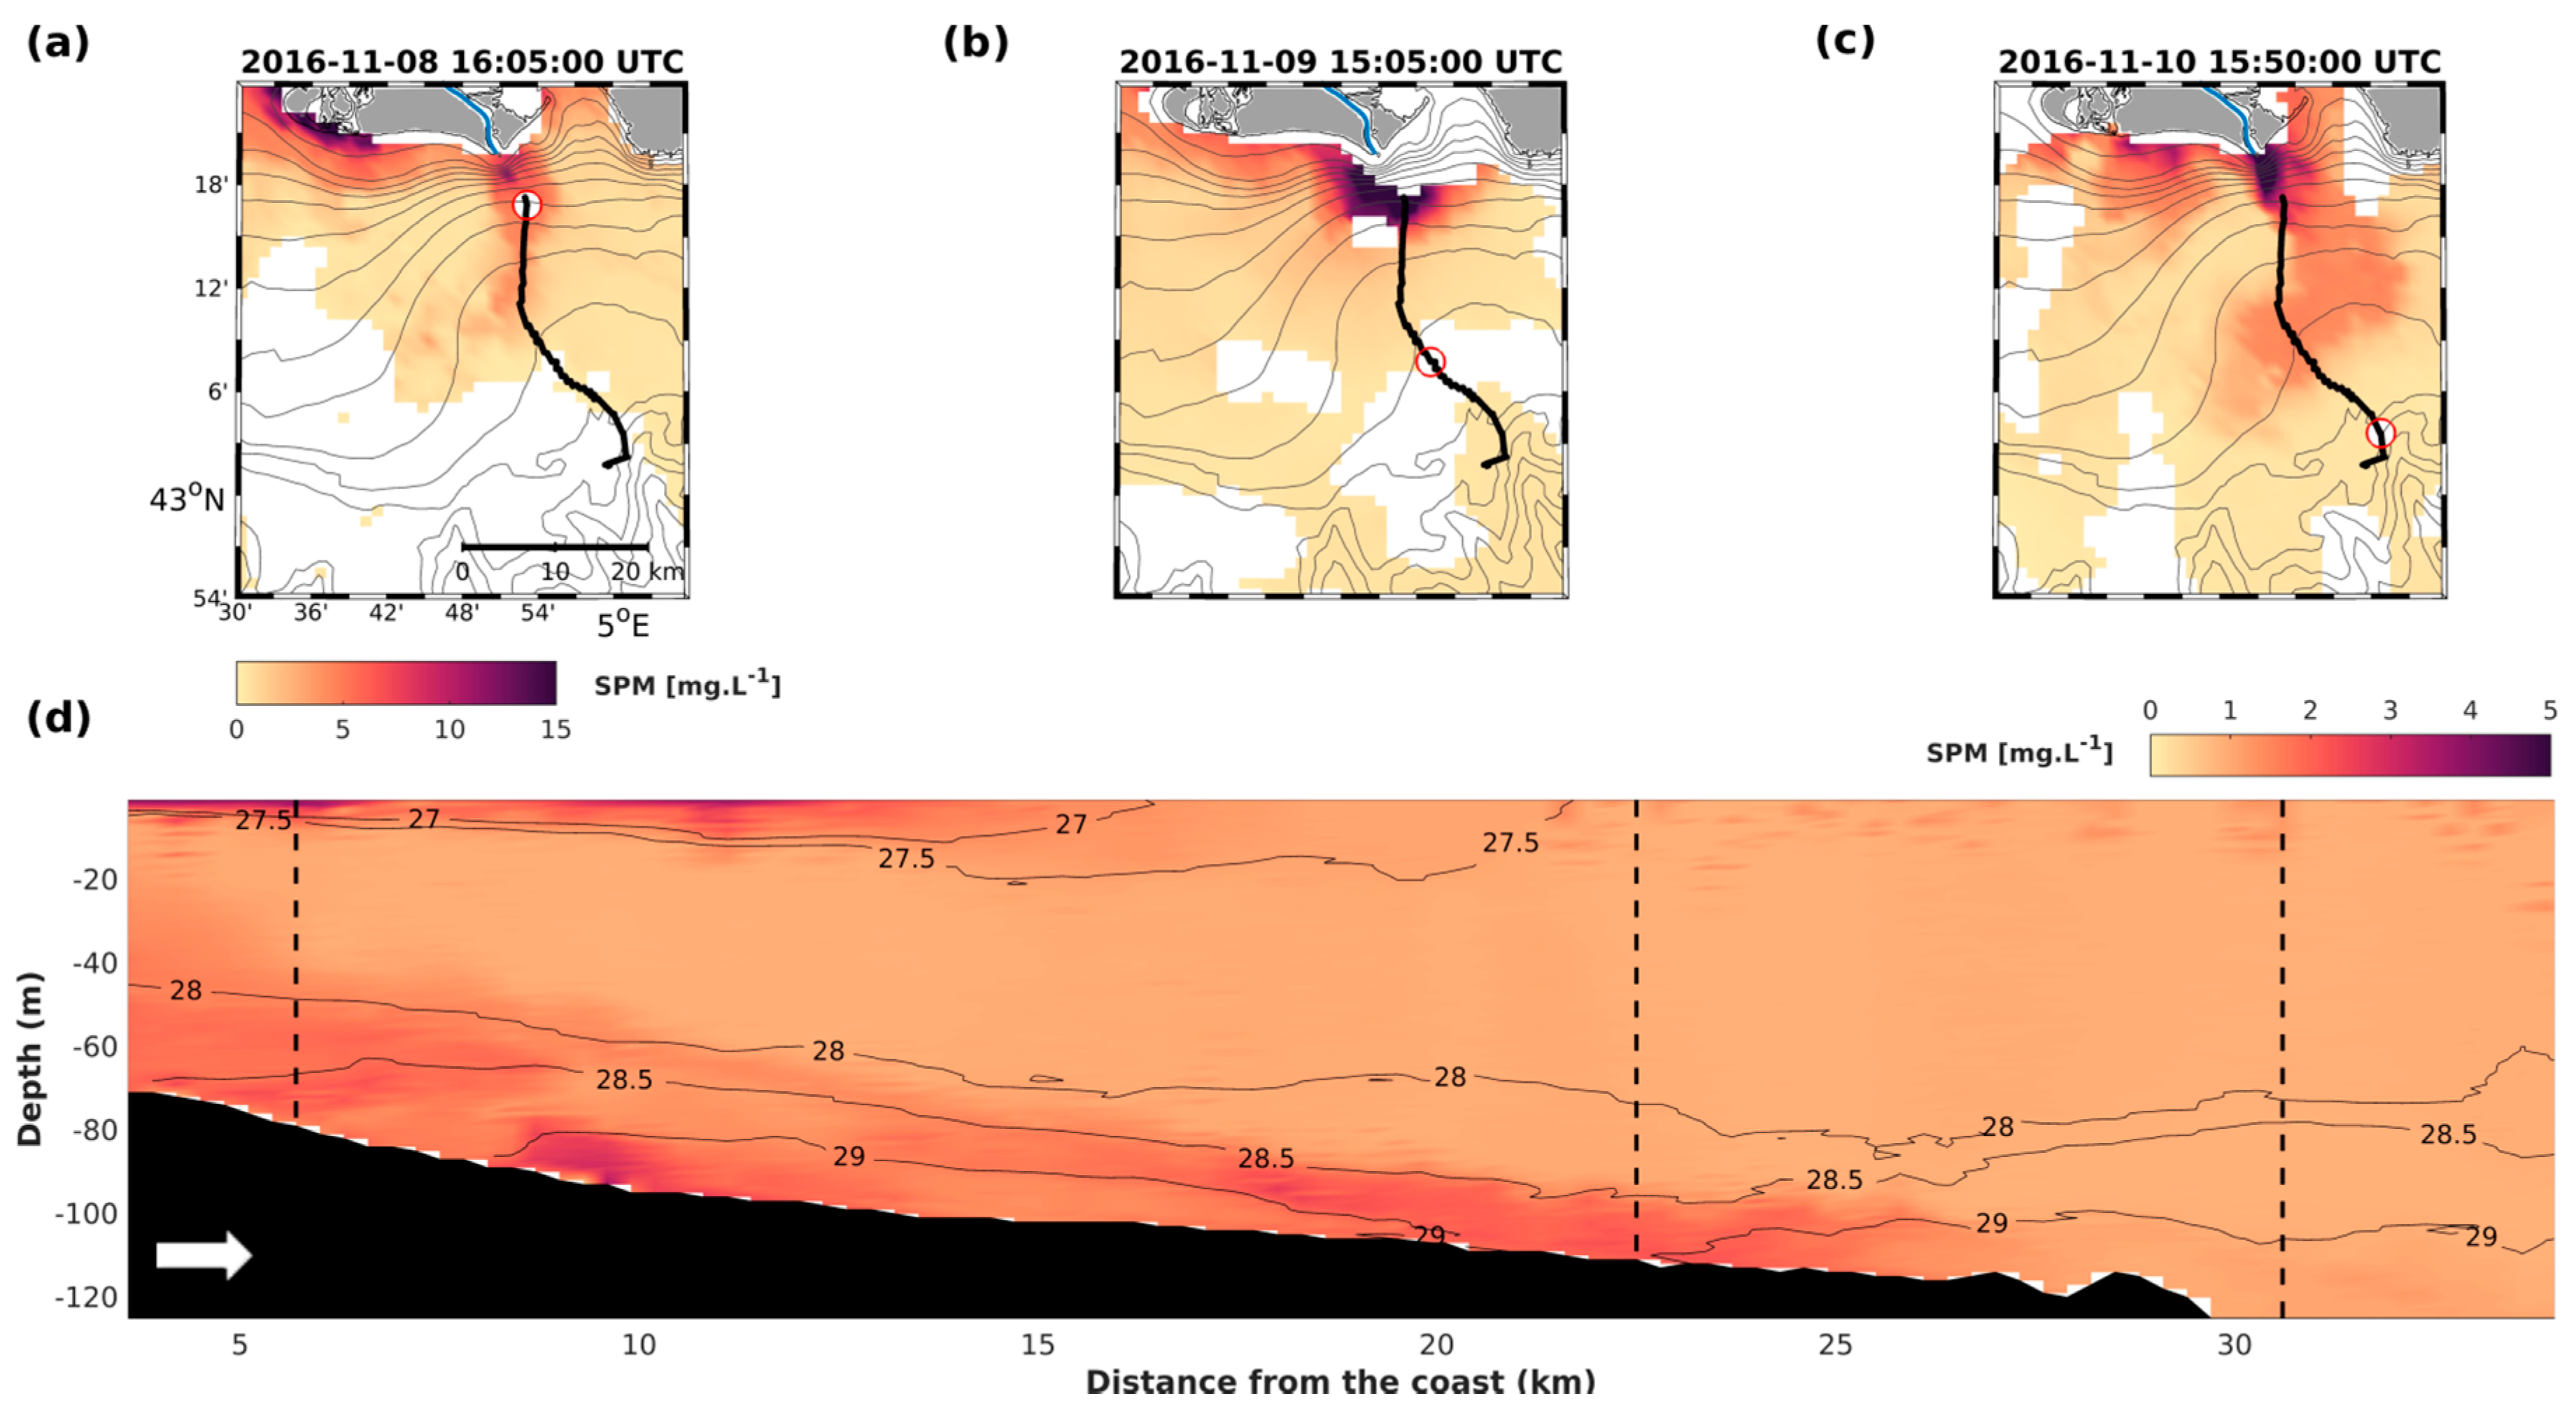
Conversely, when conditions are very changeable it is more difficult to correlate the surface structures as seen by satellites with the glider’s observations that couple space and time. Figure 14 shows a glider section and the associated satellite images of 8–10 November 2016. Daily satellite images (Figure 14a–c) show significant variability of the Rhone River plume which the glider observations (Figure 14d) fail to capture. Throughout the section, which was covered in two days, the glider was in the plume on the first day only (Figure 14a), when the plume was located near the river mouth. The plume was then deflected by the wind on the following days and moved offshore (Figure 14b,c), away from the glider.
This example shows the limits of agreement between these two observation platforms in a system with high spatial and temporal variability. However, the above-mentioned complementarity proves useful in systems where variability is lower and compatible with the time it takes the glider to traverse the monitoring section.

5. Conclusions

In this study, we successfully deployed a glider equipped with a CTD, an optical payload, and a 600 KHz phased array ADCP to monitor currents and turbidity in the Rhone River ROFI during two contrasted periods (autumn and winter). The major outcomes and conclusions of this study are as follows:
  • In line with previous studies, our comparison of currents estimated from ADCP data with the DAC confirms that this system is suitable for measuring currents in coastal areas, with an uncertainty of 0.13 m s−1. The repeated glider transects across the shelf show the importance of freshwater input from the Rhone River as one of the main drivers of local hydrodynamics.
  • In order to qualify the results by comparison with the DAC, we employed the shear method to determine absolute currents. We applied the bottom track constraint to near-bottom currents. Unfortunately, this constraint was seen to have a fairly high uncertainty due to the low ADCP sampling frequency.
  • Coincident optical and acoustic backscatter measurements show complementarity in the characterization of small and large suspended particles, respectively. Analysis of optical spikes and acoustic backscatter indicates the presence of coarse particles on the proximal part of the mid-shelf close to the river mouth, where hydrological conditions likely favor the formation of macro flocs.
  • The calculated SPM fluxes and their uncertainties (20–600%) are highly variable. Furthermore, the SPM fluxes on the shelf are one order of magnitude lower than the concomitant SPM fluxes from the nearby Rhone River, which suggests a significant deposition of particulate matter at the river mouth.
  • The combination of both satellite and glider SPM measurements is important for monitoring both surface and subsurface parts of the river plume.
  • The sampling strategy used in this study showed that the monitoring of currents and turbidity in the coastal zone over periods ranging from several weeks to several months is feasible. This technique enables the capture of difficult to monitor sporadic events such as storms or floods, which is essential both for improving existing knowledge of coastal circulation and sediment transport, and for the validation of hydro-sedimentary regional models.
In future work we plan to continue estimating currents using the inverse method, simultaneously using independent estimates of current velocities using bottom tracking, a flight model, and the DAC. This should enable to reduce the uncertainty in current estimates and to extend the study area beyond the continental shelf, where bottom tracking is inoperative. We also intend to optimize sampling (by increasing the size of the bins, reducing the number of bins, increasing the acquisition frequency) so as to reduce uncertainties while maintaining a large autonomy. For the estimation of SPM fluxes, we foresee improving the calibration of the optical sensor (by increasing the number of measurements and triplicates) and carrying out an independent calibration of the acoustic sensor, which may allow us to discriminate coarse particle (acoustic) and fine particle (optic) fluxes. Future use of glider-based direct measurements of particle size will allow to better characterize the entire spectrum of suspended particles and their dynamics.

Author Contributions

Conceptualization, methodology, and writing, M.G., G.M., F.B., X.D.d.M., I.P., P.T., R.V.; analyses, M.G., G.M., P.C., F.B., X.D.d.M.; funding acquisition, F.B., X.D.d.M. All authors have read and agreed to the published version of the manuscript.

Funding

The corresponding author is funded through a PhD grant of French Occitanie Region. This work was funded by the MATUGLI project (ANR-14-ASTR-0021-01) under the ANR ASTRID DGA Program and the MISTRALS-MERMEX Program.

Acknowledgments

We thank N. Briggs for his help on optical spike characterization. We thank the Parc National des Gliders of the DT INSU, CNRS for the integration of the ADCP, glider deployment, and piloting. We also thank the captain and crews of the R/V Tethys II for their help during sampling.

Conflicts of Interest

The authors declare no conflict of interest.

References

  1. Durrieu De Madron, X.; Wiberg, P.L.; Puig, P. Sediment dynamics in the Gulf of Lions: The impact of extreme events. Cont. Shelf Res. 2008, 28, 1867–1876. [Google Scholar] [CrossRef]
  2. Ody, A.; Doxaran, D.; Vanhellemont, Q.; Nechad, B.; Novoa, S.; Many, G.; Bourrin, F.; Verney, R.; Pairaud, I.; Gentili, B. Potential of High Spatial and Temporal Ocean Color Satellite Data to Study the Dynamics of Suspended Particles in a Micro-Tidal River Plume. Remote Sens. 2016, 8, 245. [Google Scholar] [CrossRef] [Green Version]
  3. Gohin, F. Annual cycles of chlorophyll-a, non-algal suspended particulate matter, and turbidity observed from space and in-situ in coastal waters. Ocean Sci. 2011, 7, 705–732. [Google Scholar] [CrossRef] [Green Version]
  4. Doxaran, D.; Froidefond, J.-M.; Castaing, P.; Babin, M. Dynamics of the turbidity maximum zone in a macrotidal estuary (the Gironde, France): Observations from field and MODIS satellite data. Estuar. Coast. Shelf Sci. 2009, 81, 321–332. [Google Scholar] [CrossRef]
  5. Bourrin, F.; Many, G.; Durrieu De Madron, X.; Martin, J.; Puig, P.; Houpert, L.; Testor, P.; Kunesch, S.; Mahiouz, K.; Beguery, L. Glider monitoring of shelf suspended particle dynamics and transport during storm and flooding conditions. Cont. Shelf Res. 2015, 109, 135–149. [Google Scholar] [CrossRef]
  6. Miles, T.; Seroka, G.; Kohut, J.T.; Schofield, O.M.; Glenn, S. Glider observations and modeling of sediment transport in Hurricane Sandy. J. Geophys. Res. Oceans 2015, 120, 1771–1791. [Google Scholar] [CrossRef] [Green Version]
  7. Miles, T.; Glenn, S.; Kohut, J.; Seroka, G.; Xu, Y. Observations of Hurricane Sandy from a glider mounted aquadopp profiler. In Proceedings of the Oceans 2013 Mtsieee—San Diego Ocean Common, San Diego, CA, USA, 23–27 September 2013. [Google Scholar]
  8. Glenn, S.; Jones, C.; Twardowski, M.; Bowers, L.; Kerfoot, J.; Kohut, J.T.; Webb, D.; Schofield, O.M. Glider observations of sediment resuspension in a Middle Atlantic Bight fall transition storm. Limnol. Oceanogr. 2008, 53, 2180–2196. [Google Scholar] [CrossRef] [Green Version]
  9. Davis, R.; Eriksen, C.; Jones, C. Autonomous Buoyancy-Driven Underwater Gliders. In Technology and Applications of Autonomous Underwater Vehicles; Routledge: London, UK, 2002; pp. 37–58. [Google Scholar] [CrossRef]
  10. Liblik, T.; Karstensen, J.; Testor, P.; Alenius, P.; Hayes, D.; Ruiz, S.; Heywood, K.J.; Pouliquen, S.; Mortier, L.; Mauri, E. Potential for an underwater glider component as part of the Global Ocean Observing System. Methods Oceanogr. 2016, 17, 50–82. [Google Scholar] [CrossRef] [Green Version]
  11. Rudnick, D.L. Ocean Research Enabled by Underwater Gliders. Annu. Rev. Mar. Sci. 2015, 8, 519–541. [Google Scholar] [CrossRef]
  12. Testor, P. Gliders as a Component of Future Observing Systems. In Proceedings of the OceanObs’09: Sustained Ocean Observations and Information for Society, Venice, Italy, 21–25 September 2009; p. 978. [Google Scholar]
  13. Ma, W.; Wang, Y.; Wang, S.; Zhang, H.; Zhang, H.; Gong, Q. Absolute Current Estimation and Sea-Trial Application of Glider-Mounted AD2CP. J. Coast. Res. 2019, 35, 1343–1350. [Google Scholar] [CrossRef]
  14. Todd, R.E. High-Frequency internal waves and thick bottom mixed layers observed by gliders in the Gulf Stream. Geophys. Res. Lett. 2017, 44, 6316–6325. [Google Scholar] [CrossRef]
  15. Todd, R.E.; Rudnick, D.L.; Mazloff, M.R.; Davis, R.E.; Cornuelle, B. Poleward flows in the southern California Current System: Glider observations and numerical simulation. J. Geophys. Res. Oceans 2011, 116, 116. [Google Scholar] [CrossRef] [Green Version]
  16. Ellis, D.; Washburn, L.; Ohlmann, C.; Gotschalk, C. Improved methods to calculate depth-resolved velocities from glider-mounted ADCPs. In Proceedings of the 2015 IEEE/OES Eleveth Current, Waves and Turbulence Measurement (CWTM), St. Petersburg, FL, USA, 2–6 March 2015; pp. 1–10. [Google Scholar] [CrossRef]
  17. Ouillon, S. Why and How Do We Study Sediment Transport? Focus on Coastal Zones and Ongoing Methods. Water 2018, 10, 390. [Google Scholar] [CrossRef]
  18. Sadaoui, M.; Ludwig, W.; Bourrin, F.; Raimbault, P. Controls, budgets and variability of riverine sediment fluxes to the Gulf of Lions (NW Mediterranean Sea). J. Hydrol. 2016, 540, 1002–1015. [Google Scholar] [CrossRef]
  19. Garau, B.; Ruiz, S.; Zhang, W.G.; Pascual, A.; Heslop, E.; Kerfoot, J.; Tintoré, J. Thermal Lag Correction on Slocum CTD Glider Data. J. Atmos. Ocean. Technol. 2011, 28, 1065–1071. [Google Scholar] [CrossRef] [Green Version]
  20. Mcdougall, T.; Feistel, R.; Millero, F.; Jackett, D.R.; Wright, D.; King, B.; Marion, G.; Chen, C.-T.A.; Spitzer, P. The International Thermodynamic Equation of Seawater 2010 (TEOS-10): Calculation and Use of Thermodynamic Properties; IOC UNESCO: Paris, France, 2010.
  21. Sullivan, J.M.; Twardowski, M.S.; Ronald, J.; Zaneveld, V.; Moore, C.C.; Kokhanovsky, A.A. Measuring optical backscattering in water. Light Scatt. Rev. 2013, 7, 189–224. [Google Scholar] [CrossRef]
  22. Styles, R. Laboratory evaluation of the LISST in a stratified fluid. Mar. Geol. 2006, 227, 151–162. [Google Scholar] [CrossRef]
  23. Quan, X.; Fry, E.S. Empirical equation for the index of refraction of seawater. Appl. Opt. 1995, 34, 3477–3480. [Google Scholar] [CrossRef]
  24. Briggs, N.; Perry, M.J.; Cetinić, I.; Lee, C.; D’Asaro, E.; Gray, A.M.; Rehm, E. High-Resolution observations of aggregate flux during a sub-polar North Atlantic spring bloom. Deep. Sea Res. Part. I Oceanogr. Res. Pap. 2011, 58, 1031–1039. [Google Scholar] [CrossRef]
  25. Mullison, J.; DeCollibus, C.; Allsup, B. An investigation of the accuracy of current profile measurements from a glider-mounted ADCP operating in shallow water. In Proceedings of the 2013 OCEANS—San Dego, San Diego, CA, USA, 23–27 September 2013; pp. 1–8. [Google Scholar]
  26. Ordonez, C.E.; Shearman, R.K.; Barth, J.A.; Welch, P.; Erofeev, A.; Kurokawa, Z. Obtaining absolute water velocity profiles from glider-mounted Acoustic Doppler Current Profilers. In Proceedings of the 2012 Oceans—Yeosu, Yeosu, Korea, 21–24 May 2012; p. 7, ISBN 978-1-4577-2089-5. [Google Scholar]
  27. Gordon, R.L. Acoustic Doppler current profiler-Principles of operation: A practical primer. RD Instrum. 1996, 54, 54. [Google Scholar]
  28. Deines, K.L. Backscatter estimation using Broadband acoustic Doppler current profilers. In Proceedings of the IEEE Sixth Working Conference on Current Measurement (Cat. No.99CH36331), San Diego, CA, USA, 13 March 1999; pp. 249–253. [Google Scholar]
  29. Gostiaux, L.; Van Haren, H. Extracting Meaningful Information from Uncalibrated Backscattered Echo Intensity Data. J. Atmos. Ocean. Technol. 2010, 27, 943–949. [Google Scholar] [CrossRef]
  30. Mullison, J. Backscatter Estimation Using Broadband Acoustic Doppler Current Profilers-Updated. In Proceedings of the ASCE Hydraulic Measurements & Experimental Methods Conference, Durham, NH, USA, 9–12 July 2017. [Google Scholar]
  31. Francois, R.E.; Garrison, G.R. Sound absorption based on ocean measurements. Part II: Boric acid contribution and equation for total absorption. J. Acoust. Soc. Am. 1982, 72, 1879–1890. [Google Scholar] [CrossRef]
  32. Merckelbach, L.; Smeed, D.A.; Griffiths, G. Vertical Water Velocities from Underwater Gliders. J. Atmos. Ocean. Technol. 2010, 27, 547–563. [Google Scholar] [CrossRef] [Green Version]
  33. Frajka-Williams, E.; Eriksen, C.C.; Rhines, P.B.; Harcourt, R.R. Determining Vertical Water Velocities from Seaglider. J. Atmos. Ocean. Technol. 2011, 28, 1641–1656. [Google Scholar] [CrossRef]
  34. Visbeck, M. Deep Velocity Profiling Using Lowered Acoustic Doppler Current Profilers: Bottom Track and Inverse Solutions. J. Atmos. Ocean. Technol. 2002, 19, 794–807. [Google Scholar] [CrossRef]
  35. Firing, E.; Gordon, R.L. Deep ocean acoustic Doppler current profiling. In Proceedings of the IEEE Fourth Working Conference on Current Measurement, IEEE, Clinton, MD, USA, 3–5 April 1990; pp. 192–201. [Google Scholar]
  36. Fischer, J.; Visbeck, M. Deep Velocity Profiling with Self-contained ADCPs. J. Atmos. Ocean. Technol. 1993, 10, 764–773. [Google Scholar] [CrossRef]
  37. Thurnherr, A.M.; Symonds, D.; Laurent, L.S. Processing explorer ADCP data collected on slocum gliders using the LADCP shear method. In Proceedings of the 2015 IEEEOES 11th Current Waves and Turbulence Measurment CWTM, St. Petersburg, FL, USA, 2–6 March 2015. [Google Scholar] [CrossRef]
  38. Millot, C. Wind induced upwellings in the Gulf of Lions. Oceanol. Acta 1979, 2, 261–274. [Google Scholar]
  39. Estournel, C.; Durrieu de Madron, X.; Marsaleix, P.; Auclair, F.; Julliand, C.; Vehil, R. Observation and modeling of the winter coastal oceanic circulation in the Gulf of Lion under wind conditions influenced by the continental orography (FETCH experiment). J. Geophys. Res. Oceans 2003, 108, 108. [Google Scholar] [CrossRef]
  40. Reffray, G.; Marsaleix, P.; Fraunié, P. Secondary flows induced by wind forcing in the Rhône region of freshwater influence. Ocean Dyn. 2004, 54, 179–196. [Google Scholar] [CrossRef]
  41. Petrenko, A.; Dufau, C.; Estournel, C. Barotropic eastward currents in the western Gulf of Lion, north-western Mediterranean Sea, during stratified conditions. J. Mar. Syst. 2008, 74, 406–428. [Google Scholar] [CrossRef]
  42. Schaeffer, A.; Garreau, P.; Molcard, A.; Fraunié, P.; Seity, Y. Influence of high-resolution wind forcing on hydrodynamic modeling of the Gulf of Lions. Ocean Dyn. 2011, 61, 1823–1844. [Google Scholar] [CrossRef]
  43. Millot, C. The Gulf of Lions’ hydrodynamics. Cont. Shelf Res. 1990, 10, 885–894. [Google Scholar] [CrossRef]
  44. Petrenko, A.A. Variability of circulation features in the Gulf of Lion NW Mediterranean Sea. Importance of inertial currents. Oceanol. Acta 2003, 26, 323–338. [Google Scholar] [CrossRef] [Green Version]
  45. Chereskin, T.K.; Levine, M.D.; Harding, A.J.; Regier, L.A. Observations of near-inertial waves in acoustic Doppler current profiler measurements made during the Mixed Layer Dynamics Experiment. J. Geophys. Res. Oceans 1989, 94, 8135. [Google Scholar] [CrossRef]
  46. Lynch, J.F.; Irish, J.D.; Sherwood, C.R.; Agrawal, Y.C. Determining suspended sediment particle size information from acoustical and optical backscatter measurements. Cont. Shelf Res. 1994, 14, 1139–1165. [Google Scholar] [CrossRef]
  47. Downing, J. Twenty-Five years with OBS sensors: The good, the bad, and the ugly. Cont. Shelf Res. 2006, 26, 2299–2318. [Google Scholar] [CrossRef]
  48. Many, G.; Bourrin, F.; Durrieu De Madron, X.; Pairaud, I.; Gangloff, A.; Doxaran, D.; Ody, A.; Verney, R.; Menniti, C.; Le Berre, D.; et al. Particle assemblage characterization in the Rhone River ROFI. J. Mar. Syst. 2016, 157, 39–51. [Google Scholar] [CrossRef] [Green Version]
  49. Lohrmann, A. Monitoring sediment concentration with acoustic backscattering instruments. Nortek Tech. Note 2001, 3, 1–5. [Google Scholar]
  50. Miles, T.; Kohut, J.T.; Slade, W.; Gong, D. Suspended particle characteristics from a glider integrated LISST sensor. In Proceedings of the OCEANS 2018 MTS/IEEE Charleston, Charleston, SC, USA, 22–25 October 2018; pp. 1–5. [Google Scholar] [CrossRef]
  51. Guillén, J.; Bourrin, F.; Palanques, A.; De Madron, X.D.; Puig, P.; Buscail, R. Sediment dynamics during wet and dry storm events on the Têt inner shelf (SW Gulf of Lions). Mar. Geol. 2006, 234, 129–142. [Google Scholar] [CrossRef]
  52. Palanques, A.; Guillén, J.; Puig, P.; Durrieu De Madron, X. Storm-Driven shelf-to-canyon suspended sediment transport at the southwestern Gulf of Lions. Cont. Shelf Res. 2008, 28, 1947–1956. [Google Scholar] [CrossRef]
  53. Bourrin, F.; Friend, P.; Amos, C.; Manca, E.; Ulses, C.; Palanques, A.; De Madron, X.D.; Thompson, C. Sediment dispersal from a typical Mediterranean flood: The Têt River, Gulf of Lions. Cont. Shelf Res. 2008, 28, 1895–1910. [Google Scholar] [CrossRef]
  54. Bourrin, F.; De Madron, X.D.; Heussner, S.; Estournel, C. Impact of winter dense water formation on shelf sediment erosion (evidence from the Gulf of Lions, NW Mediterranean). Cont. Shelf Res. 2008, 28, 1984–1999. [Google Scholar] [CrossRef]
  55. Dufois, F.; Verney, R.; Le Hir, P.; Dumas, F.; Charmasson, S. Impact of winter storms on sediment erosion in the Rhone River prodelta and fate of sediment in the Gulf of Lions (North Western Mediterranean Sea). Cont. Shelf Res. 2013, 72, 57–72. [Google Scholar] [CrossRef] [Green Version]
  56. Gangloff, A. Devenir des Apports Solides du Rhône dans le Golfe du Lion: Étude de la Dynamique du Panache Turbide du Rhône en Réponse aux Forçages Hydrométéorologiques. Ph.D. Thesis, Université de Bretagne Occidentale, Brest, France, 2017. [Google Scholar]
  57. Noël, M.-H. Le Plutonium Comme Traceur du Transfert et de l’accumulation des Apports Particulaires du Rhône en Méditerranée Nord Occidentale. Ph.D. Thesis, Université Paris-Est Créteil Val de Marne (UPEC), Créteil, France, 1996. [Google Scholar]
  58. Lansard, B. Distribution et Remobilisation du Plutonium dans les Sédiments du Prodelta du Rhône. Ph.D. Thesis, Université de la Méditerranée—Aix-Marseille II, Marseille, France, 2004. [Google Scholar]
  59. Maillet, G.M.; Vella, C.; Berné, S.; Friend, P.L.; Amos, C.L.; Fleury, T.J.; Normand, A. Morphological changes and sedimentary processes induced by the December 2003 flood event at the present mouth of the Grand Rhône River (southern France). Mar. Geol. 2006, 234, 159–177. [Google Scholar] [CrossRef] [Green Version]
  60. Castelao, R.M.; Glenn, S.; Schofield, O.M.; Chant, R.; Wilkin, J.; Kohut, J. Seasonal evolution of hydrographic fields in the central Middle Atlantic Bight from glider observations. Geophys. Res. Lett. 2008, 35, 35. [Google Scholar] [CrossRef]
  61. Many, G.; Bourrin, F.; De Madron, X.D.; Ody, A.; Doxaran, D.; Cauchy, P. Glider and satellite monitoring of the variability of the suspended particle distribution and size in the Rhône ROFI. Prog. Oceanogr. 2018, 163, 123–135. [Google Scholar] [CrossRef] [Green Version]
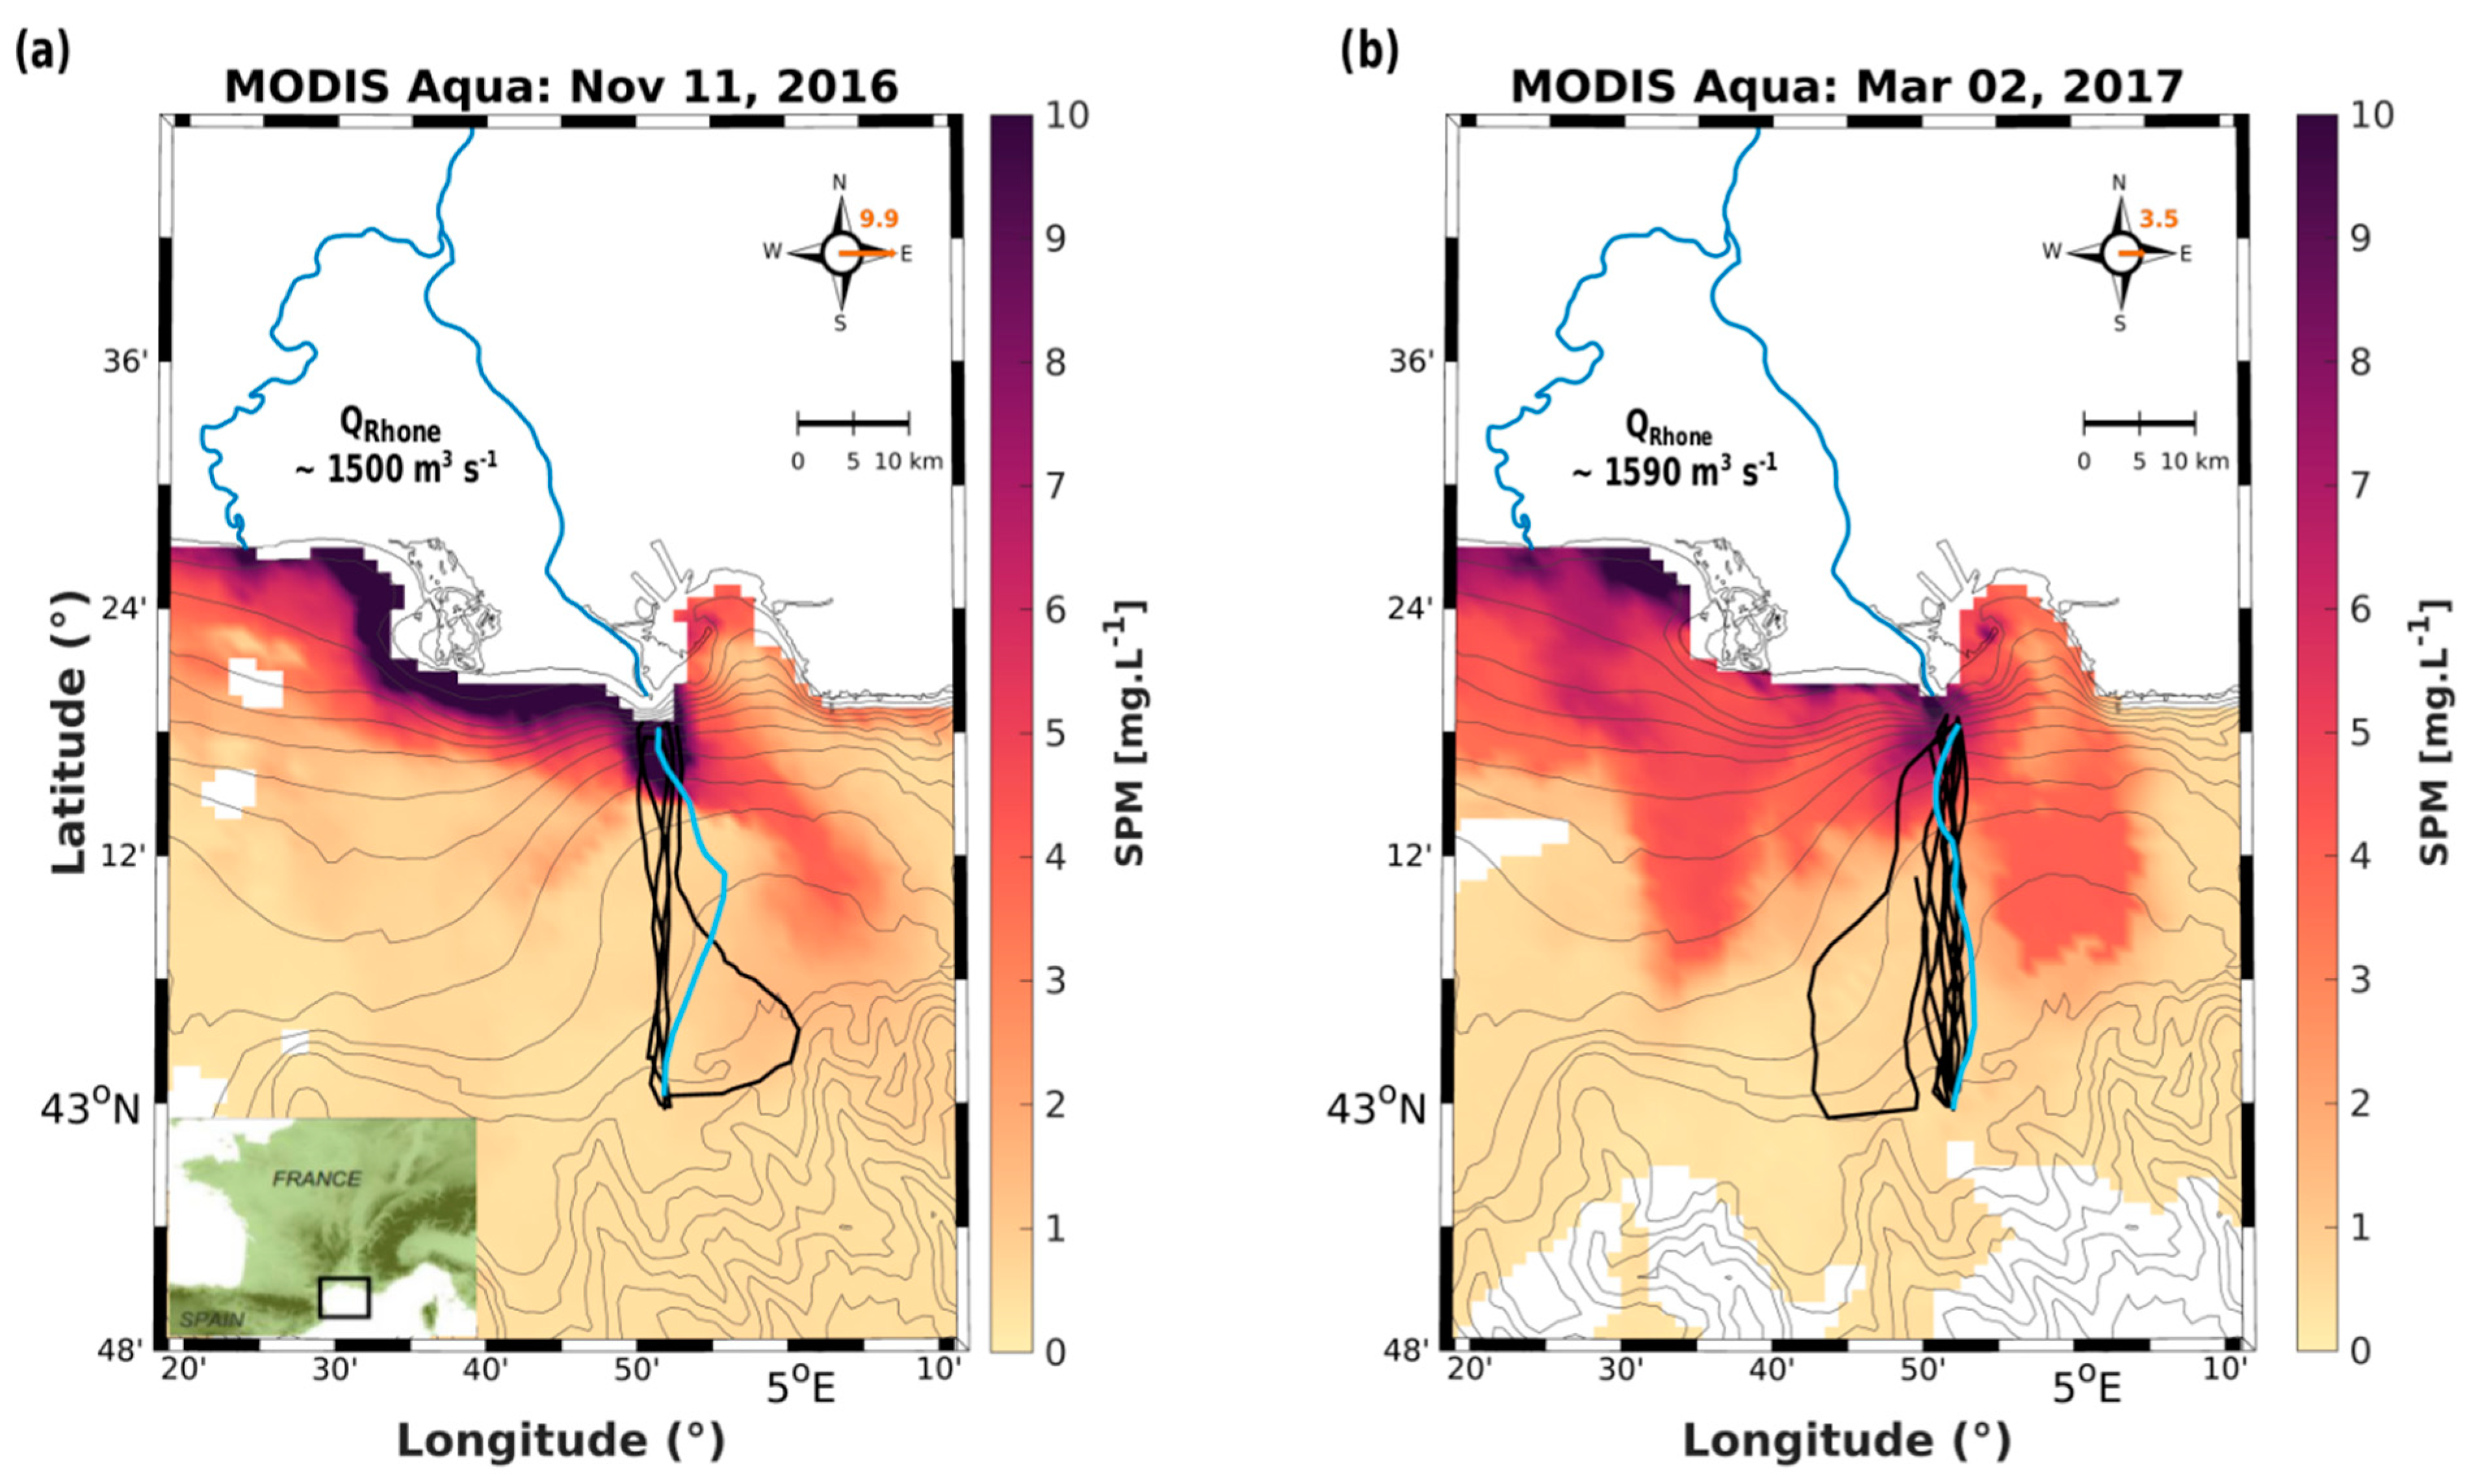
Figure 1. Moderate Resolution Imaging Spectroradiometer (MODIS) Aqua images of suspended particulate matter (SPM) concentration for (a) November 11th 2016, with a flow from the Rhone River of about 1500 m3 s−1 and (b) March 2nd 2017, with a flow of about 1590 m3 s−1. Clouds are shown as white patches and wind speed (in m s−1) and direction are specified. Depth contours are shown in gray and represent the 10 m isobaths from the coast. The glider track and sections of interest are shown as thick black and blue lines, respectively, for each deployment.
Remotesensing 12 02875 g001
Figure 2. (a,d) Water-column profiles of salinity (S), temperature (T), and density (σθ); (b,e) index of refraction of seawater (n) and Brunt–Väisälä frequency profiles (N); and (c,f) backscattering profiles of bbp700 of Wetlabs BBFL2 (raw-signal) and the baseline extract from a filter 5-point running minimum followed by a 5-point running maximum applied on the bbp700 measurements. The top panels correspond to the autumnal season (November, 2016) showing a seasonal thermocline around 50 m depth characteristic of the coastal area surrounding the Rhone region of freshwater influence (ROFI) area. The lower panels correspond to the winter season, with a homogeneous water column (15–80 m depth), except in subsurface waters due to the Rhone River plume.
Remotesensing 12 02875 g002
Figure 3. Example of measurements carried out by the Acoustic Doppler Current Profiler (ADCP) during a descent of the glider. (a) Swath of the counts signal for each cell of the multiple water profiles. The threshold of 64 counts used to discard erroneous velocity values is shown in black. (b) Filtered backscatter index (BI) measurements (dB). Discarded values are shown in gray. A black line shows bottom detection. (c) Reconstructed median backscatter index profile and associated standard deviation.
Remotesensing 12 02875 g003
Figure 4. Example of measurements carried out by the ADCP during a descent of the glider. (a) Swath of the counts signal for each cell of successive water profiles. The empirical threshold of 64 counts used to discard erroneous velocity values is shown in black. (b) Filtered raw northward velocity measurements (m s−1). Discarded values are shown in gray. The black line shows bottom detection. (c) Mean profile reconstructed after stacking the successive profiles of the vertical derivatives of measured currents. (d) Integrated relative velocity profile. (e) Absolute velocity profile (black line) after adjustment with near-bottom current measurements derived from bottom tracking (red line); dashed lines indicate uncertainties (standard deviation) for each variable.
Remotesensing 12 02875 g004
Figure 5. Time-series of atmospheric conditions at Cap-Couronne station (40°20.23′N; 5°01.38′E) for (a) autumnal and (b) winter conditions. Black lines correspond to hourly (10-min burst average) wind speed and direction. By convention, wind direction indicates its origin. The shaded area corresponds to the sections chosen to illustrate hydrological, hydrodynamical, and biogeochemical features.
Remotesensing 12 02875 g005
Figure 6. Hydrological variables: (a,b) temperature, (c,d) absolute salinity, (e,f) density anomalies, and (g,h) the Brunt–Väisälä frequency. The isopycnals are superimposed on all plots and indicated by black or white lines. The left panels correspond to autumnal conditions, from 11–13 November 2016. The right panels correspond to winter conditions, from 5–7 February 2017. The black arrow at the top of each panel indicates the direction of the glider’s motion.
Remotesensing 12 02875 g006
Figure 7. Comparison of depth-averaged current (DAC) vs. ADCP-derived residual current on sections of interest, respectively (a) from 11–13 November 2016 and (b) from 5–7 February 2017. Taylor’s diagram comparing the DACs (Vx, Vy) and ADCP-derived residual current (U,V)—respectively for each component of eastward and northward velocity—across an entire deployment, for (c) the autumn (November 2016) and (d) winter seasons (February 2017).
Remotesensing 12 02875 g007
Figure 8. Hydrodynamical variables: (a,b) northward velocity, (c,d) eastward velocity, (e,f) and eastward geostrophic velocity. The left panels correspond to the autumnal season, from 11–13 November 2016. The right panels correspond to the winter season, from 5–7 February 2017. The black arrow at the top of each panel indicates the direction of the glider’s motion.
Remotesensing 12 02875 g008
Figure 9. Turbidity measurements: (a,b) optical backscattering, (c,d) suspended particulate matter, (e,f) chlorophyll-a, (g,h) acoustic backscatter index, and (i,j) optical backscatter spikes. The left panels correspond to the autumnal season, from 11–13 November 2016. The right panels correspond to the winter season, from 5–7 February 2017. The black arrow at the top of each panel indicates the direction of the glider’s motion.
Remotesensing 12 02875 g009
Figure 10. (a) Phase unwrapping of the horizontal current shear (3–40 m) from 14–15 November 2016. The negative slope corresponding to the Coriolis factor (-f) is shown. The shaded area corresponds to the portion of the period during which inertial oscillations are observed. (b) Horizontal currents from 14–15 November 2016, at 3, 10, 20, 30, and 40 m depth. All of these profiles show a clockwise oscillation of the currents.
Remotesensing 12 02875 g010
Figure 11. Surface turbidity from MODIS images (ac) and glider measurements in the autumnal season: (df) suspended particle matter, (gi) optical backscattering, (jl) acoustic backscatter index, and (mo) optical backscatter spikes. The left panels are estimates for Section 4, from 15–17 November 2016. The center panels are estimates for Section 5, from 17–18 November 2016. The right panels are estimates for Section 6, from 19–21 November 2017. The black arrows indicate the glider’s direction. For the top panels, the glider’s location at the time the satellite image was taken is shown by the red circle, and clouds and land are shown as white patches and gray areas, respectively.
Remotesensing 12 02875 g011
Figure 12. Surface turbidity from MODIS images (ac) and glider measurements in the winter season: (df) suspended particle matter, (gi) optical backscattering, (jl) acoustic backscatter index, and (mo) optical backscatter spikes. The left panels are estimates for Section 3, from 4–5 February 2017. The center panels are estimates for Section 4, from 5–7 February 2017. The right panels are estimates for Section 5, from 7–9 February 2017. The black arrows indicate the glider’s direction. For the top panels, the glider’s location at the time the satellite image was taken is shown by the red circle, and clouds and land are shown as white patches and gray areas, respectively.
Remotesensing 12 02875 g012
Figure 13. Distribution of cumulative along- (E–W) and cross-shelf (N–S) particle transport (kg s−1) for all the sections performed during autumnal and winter deployments.
Remotesensing 12 02875 g013
Figure 14. (ac) Surface turbidity from MODIS images, for the glider’s Section 1 in November 2016. Clouds and land are shown as white patches and gray areas, respectively. (d) Glider turbidity observations in the water column along the cross-shelf track. The black line indicated the glider’s path and the white arrow shows its direction. The glider’s location at the time the satellite image was taken is shown by the red circle and by dashed black lines in the upper and lower panels, respectively.
Remotesensing 12 02875 g014
Table 1. Results of linear regression analysis of eastward geostrophic currents with eastward ADCP currents for both deployments. Asterisks in the table indicate the sections of interest.
Observation
Time
No. of Datar2
1 Nov to
12 Nov 2016
Section 110,7380.15
Section 2 *10,3990.59
Section 310,0230.35
Section 410,1560.02
Section 597520.68
Section 610,2560.72
Total61,3240.69
30 Jan to
3 Mar 2017
Section 110,3430.84
Section 210,2140.75
Section 3 *10,6610.61
Section 410,3070.68
Section 510,6150.74
Section 610,2210.79
Section 795070.99
Section 810,1840.61
Section 910,4440.64
Section 1010,1460.4
Section 1110,4330.47
Total113,0750.8