Letter

Improved Anchor-Free Instance Segmentation for Building Extraction from High-Resolution Remote Sensing Images

1
Aerospace Information Research Institute, Chinese Academy of Sciences, Beijing 100094, China
2
University of Chinese Academy of Sciences, Beijing 100049, China
*
Author to whom correspondence should be addressed.
Remote Sens. 2020, 12(18), 2910; https://doi.org/10.3390/rs12182910
Submission received: 21 July 2020 / Revised: 3 September 2020 / Accepted: 4 September 2020 / Published: 8 September 2020

Abstract

:
Building extraction from high-resolution remote sensing images plays a vital part in urban planning, safety supervision, geographic databases updates, and some other applications. Several researches are devoted to using convolutional neural network (CNN) to extract buildings from high-resolution satellite/aerial images. There are two major methods, one is the CNN-based semantic segmentation methods, which can not distinguish different objects of the same category and may lead to edge connection. The other one is CNN-based instance segmentation methods, which rely heavily on pre-defined anchors, and result in the highly sensitive, high computation/storage cost and imbalance between positive and negative samples. Therefore, in this paper, we propose an improved anchor-free instance segmentation method based on CenterMask with spatial and channel attention-guided mechanisms and improved effective backbone network for accurate extraction of buildings in high-resolution remote sensing images. Then we analyze the influence of different parameters and network structure on the performance of the model, and compare the performance for building extraction of Mask R-CNN, Mask Scoring R-CNN, CenterMask, and the improved CenterMask in this paper. Experimental results show that our improved CenterMask method can successfully well-balanced performance in terms of speed and accuracy, which achieves state-of-the-art performance at real-time speed.

Graphical Abstract

1. Introduction

In pace with the high-speed development of high-resolution remote sensing data in both China and International Community, the spatial information, geometric structures, textural features and intensity information contained in remote sensing images and point cloud data are becoming clearer, which makes it possible to identify and detect terrestrial objects. Among them, building is an important feature of city and the most important place for human production and life [1]. The geometry, area, or the dimensions of buildings gained from two-dimensional information-rich optical remote sensing images and three-dimensional information-containing point cloud data [2] are the relevant urban metrics. They can effectively represent the urban spatial structure, and then quantify the morphology of city [3], reflect the processes that occur during a city’s development [4], and monitor urban management and planning strategies [5]. Thus, the identification and extraction of the individual building will play a vital role in a wide range of applications such as urban planning, safety supervision, real-estate management and Geo-database updates.
For decades, researchers have made considerable efforts to extract buildings from remote sensing data. Huertas and Nevatia [6] assumed that the building is composed of rectangular components (such as “T” shape, “L” shape and “E” shape), and then designed a building model to detect buildings. Irvin and McKeown [7] used the spatial constraint relationship between shadows and buildings to extract buildings. Inglada [8] achieved automatic recognition of buildings in high resolution optical remote sensing images by support vector machine (SVM) classification of geometric image features. Meng et al. [9] proposed a novel object-oriented building extraction method based on fuzzy SVM. Awrangjeb et al. [10], designed an innovative image line guided segmentation technique to extract the roof planes based on light detection and ranging (LIDAR) and orthoimage, and applied a newly proposed rule-based procedure to removing planes constructed on trees. In Reference [11], to represent an individual building or tree, researchers clustered the non-ground LIDAR points, and then the planar roof segments were extracted from each cluster of points and refined using rules, such as the coplanarity of points and their locality. Gilani et al. [12] used LIDAR data to present a non-manifold points creation methods that provides a better interpolation of roof regions, these geometric features were preserved to achieve automated identification and segmentation of the building roof. Besides, they also used features from point cloud and orthoimagery to extract and regularise the buildings, so as to overcome the limitations of shadow and partly occlusion [13]. As can be seen from above, scholars have tried many methods to extract buildings from optical remote sensing images, point cloud data, or the fusion of optical images and point cloud data. However, the features of buildings used in all the above methods are artificially designed shallow features, which are time-consuming and labor-intensive, sparse for feature distribution, and cannot express higher-level semantic information.
In the past few years, deep learning algorithms have made breakthrough progress in the field of image processing. And the convolutional neural network (CNN) has been used to abstract multi-level and metaphysical features from original images, which undoubtedly provides a huge advantage for obtaining the complex spectrum, texture, and geometric features contained in remote sensing images. Based on that, currently, most researchers have used semantic segmentation frameworks (such as U-Net [14], SegNet [15], and DeepLab [16]), to achieve efficient and automatic buildings extraction from high-resolution remote sensing images. For instance, Xu et al. [17] designed a segmentation method with deep residual networks and a guided filter to gain buildings from remote sensing images. In Reference [18], to balance high accuracy with low network complexity, Shrestha and Vanneschi proposed an enhanced fully convolutional network (FCN) structure by adding conditional random fields (CRFs) and successfully obtained buildings. Li et al. [19] integrated latent high-order structural features learned by the adversarial network into semantic segmentation network during network training, and can effectively rectify spatial inconsistency on aerial images.
Although the CNN-based semantic segmentation methods have achieved promising results, they still have drawbacks.The main problem lies in a large number of closely adjacent buildings existing in remote sensing images. But semantic segmentation can not distinguish different objects of the same category. Under complex and fluid geographical environment, it may lead to edge connection and is unfavorable for the application and research which focused on single building extraction. Compared with the task of image semantic segmentation, instance segmentation can not only identify the individual buildings on the image, but also give the pixel-levels semantic categories of each target on this basis.
At present, most state-of-the-art approaches to instance segmentation are based on the two-stage object detection model, and Mask R-CNN [20] is one of the classic models and standard frameworks for them, which has achieved the best result of a single model in COCO instance segmentation challenge. It designed RoIAlign instead of RoI pooling layer used in Faster R-CNN [21], and plugged an FCN branch into the original classification and regression network branch to predict the mask. As scholars continue to study, there have been many works [22,23,24,25] on improving the Mask R-CNN, but few considered the speed of instance segmentation. Inspired by SSD [26] and YOLO [27], some scholars have designed instance segmentation model based on one-stage object detection methods. For example, YOLACT [28] used RetinaNet as the basic network and added two parallel branches to complete the mask prediction task: the first branch applied FCN to generating a series of prototype masks independent of a single instance; the second branch added mask coefficients to prediction head to encode the representation of an instance in the prototype mask space. Finally, after Non-Maximum Suppression(NMS) operation, the output results of the two branches were linearly combined to get the final prediction results. Based on state-of-the-art instance segmentation approaches, some researchers designed novel building extraction methods from high-resolution remote sensing images. Potlapally et al. [29] extracted various types of remote sensing features including buildings by employing Mask R-CNN. Ji et al. [30] utilized building extraction network implemented with a Mask R-CNN branch for object-based instance segmentation, and a multi-scale FCN branch for pixel-based semantic segmentation to locate changed buildings as well as the changed pixels from aerial remote sensing images. Li et al. [31] improved Mask R-CNN by adding key points map, and completed well preservation of geometric details for buildings. Su et al. [32] proposed an advanced Cascade Mask R-CNN which named HQ-ISNet and made the predicted instance masks more accurate.
As can be seen from above, CNN-based instance segmentation methods for building extraction from high-resolution remote sensing images are generally via two-stage, just like Mask R-CNN, which focus primarily on extraction performance, few take the speed and real-time ability into account. Although there are some instance segmentation methods, such as YOLACT, are built on one-stage detector that directly predicts boxes without proposal step. They still rely heavily on pre-defined anchors, which are sensitive to data sets and hyperparameters (e.g., aspect ratio, ratio, input size, etc.). In addition, to ensure sufficient overlap with most ground truth boxes, excessively anchor setting results in the matters of higher computation/storage cost and imbalance between positive and negative samples. In order to address these problem, recently, many kinds of research [33,34,35,36,37] tended to replace the anchors with anchor-free by using corner/center points. Compared with anchor-based detectors, anchor-free will contribute to more efficient computation and better performance.
Therefore, in this paper, we propose an improved anchor-free instance segmentation method based on CenterMask [37] with spatial and channel attention-guided mechanisms for accurate extraction of buildings in high-resolution remote sensing images. It maintains good performance yet realize efficient. The main contributions of our work can be summarized as follows:
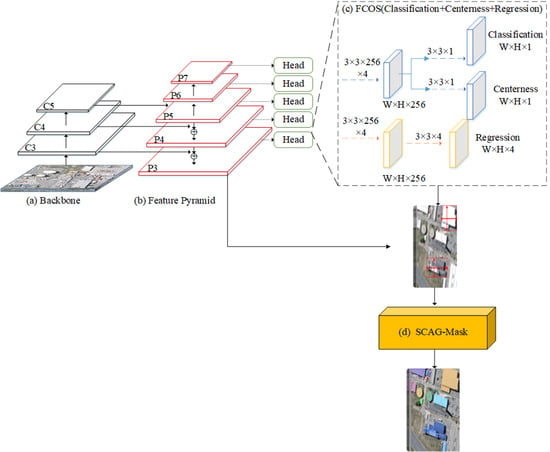
  • An improved anchor-free instance segmentation architecture is proposed for building extraction from high-resolution remote sensing images, which is composed of an efficient one-stage anchor-free object detector FCOS [33] and a novel spatial and channel attention-guided mask branch.
  • Besides, we design a more effective backbone network by improving VoVNetV2 that is designed in Reference [37], and receives better performance than ResNet and VoVNetV2.
  • In order to improve the segmentation performance of CenterMask, we also develop the mask branch in CenterMask. A spatial and channel attention-guided mask (SCAG-Mask) branch is designed in this paper to effectively optimize the building extraction behavior.
The next content of the paper is organized as follows—Section 2 introduces our instance segmentation network architecture and the details for building extraction. Section 3 details the dataset and evaluation approach used in the experiment. Section 4 describes the experimental results and analysis in detail. Then Section 5 draws a conclusion and looks forward to the follow-up work.

2. Methods

The overall architecture of the improved CenterMask is shown in Figure 1. It consists of four parts, and (a) in Figure 1 represents the feature extraction network. This paper uses the improved VoVNetV2-57 to complete the convolution feature extraction of the input image. It consists of three convolutional layers and four stages (C2-C5) with different numbers of one-shot aggregation (OSA) modules. Each OSA module has five convolutional layers. In order to realize the fusion of the shallow position information and deep semantic information of the convolutional neural network, (b) in Figure 1 is connected to feature pyramid network (FPN) [38]. In this paper, the output of C3–C5 for improved VoVNetV2-57 network is operated through upsampling and horizontal connection operations to generate P3–P5, and P6 and P7 are obtained through convolution operations on the basis of P5, thus rich feature information extraction from a single-resolution input image is completed. After passing through FPN network, the FCOS bounding box prediction network is connected to each scale feature map to generate the region of interests(RoIs), as shown in (c) of Figure 1. By judging the relative size of the generated RoI and input image, the feature map matching the scale of the RoI is selected and operated by RoIAlign [20]. After processing, the RoI and the feature map are fed into the spatial and channel attention-guided mask branch in Figure 1d for segmenting the instance in this RoI. Finally, the exported instance segmentation extraction results are obtained.

2.1. Improved VoVNetV2

VoVNet [39] is an efficient feature extraction network. It uses one-time aggregation module. In this module, each convolution layer generates two kinds of connections. One is connected with the next layer through convolution to gain larger receptive fields. The other one is connected to the final output layer to aggregate features.
However, with the deepening of the network and the stacking of OSA modules, the accuracy of the model will be saturated. According to the ResNet [40] literature, this is because the deepening of the network causes the problem of gradient explosion and gradient disappearance. In Reference [37], to boost the performance of VoVNet, the identity mapping and an effective Squeeze-Excitation(eSE) module are added. In this paper, we let the C4 and C5 stages retain the added identity mapping as shown in Figure 2a. At the same time, we improve the eSE module, and the improved eSE module (im-eSE) is proposed and added to the OSA module at each stage of C2-C5 to learn the correlation between feature maps to filter out the more powerful feature maps, as shown in Figure 2b.
In order to obtain the global statistics while retaining the degree of the most significant part of each feature map, im-eSE module in this paper uses a global average pooling and a global max pooling. Suppose that after passing through the original OSA module, a feature map U of W × H × C is obtained. Then the gating unit in im-eSE module can be expressed as:
A i m e S E ( U ) = σ ( W c ( F g a p a v g ( U ) ) W c ( F g a p m a x ( U ) ) ) ,
where, σ is sigmoid function. ⊕ denotes element-wise addition. Fgapavg and Fgapmax are defined as:
F g a p a v g ( U ) = 1 W H i , j = 1 W , H U i , j ,
F g a p m a x ( U ) = m a x i W , j H U i , j .
Finally, output U ˜ of the im-eSE module is obtained by multiplying the gating unit A i m e S E ( U ) with the feature map U, see formula (4), where ⊗ denotes element-wise multiplication. After this, for the C4 and C5 stages, identity mapping is added to U ˜ , so as to obtain the output feature maps of this OSA module.
U ˜ = A i m e S E ( U ) U .

2.2. FCOS

FCOS uses pixel-by-pixel idea for object detection. For each point (x, y) on the feature map, it will be mapped back to the coordinates of the input image as ( x s , y s ). formula (5) shows the conversion relationship between these, where s represents the downsampling rate of the current feature map relative to the input image.
x s = s 2 + x × s , y s = s 2 + y × s .
For any ground truth box B i given in this paper, is defined as ( x 0 ( i ) , y 0 ( i ) , x 1 ( i ) , y 1 ( i ) , C), where ( x 0 ( i ) , y 0 ( i ) ) and ( x 1 ( i ) , y 1 ( i ) ) are the coordinates of the upper left and lower right corners of the ground truth box, C is the building category. If ( x s , y s ) calculated by formula (5) falls into any ground truth box, it is temporarily considered to be a positive sample, and its regression target is ( l * , t * , r * , b * ). Here l * , t * , r * , b * are the distances from the location to the four sides of the ground truth box, as shown in (6). Otherwise, it will be considered as a negative sample and its category will be set to 0. If the point is located in multiple ground truth boxes, it is considered an ambiguous sample. And then we select the ground truth box with the minimal area as the regression target. In addition, for multi-level prediction with FPN, if the regression target of positive sample at level i satisfies m a x ( l * , t * , r * , b * ) m i or m a x ( l * , t * , r * , b * ) m i 1 , it will be set as a negative sample, and can not regress a bounding box anymore. Here m i is the maximum distance that feature level i can regress. In this paper, we set m 2 , m 3 , m 4 , m 5 , m 6 and m 7 as 0, 64, 128, 256, 512 and , respectively.
l * = x s x 0 ( i ) , t * = y s y 0 ( i ) , r * = x 1 ( i ) x s , b * = y 1 ( i ) y s .
As can be seen from Figure 1, FCOS contains classification subnet and regression subnet. In classification subnet, we firstly use four 3 × 3 × 256 convolutional layers, and then through a 3 × 3 convolutional layer with the channel number of 1 to predict the probability that each bounding box belongs to a building in the range of W × H . The design of the regression subnet is same to classification subnet, the only difference is that the number of channels in the last layer is 4, that is, each bounding box will regress a four-dimensional vector, indicating the offset of the bounding box from the related ground truth box. In other words, without the anchor-box, FCOS directly predicts a 4D vector plus a class label at each spatial location on a level of feature maps.
Besides, in order to suppress the low-quality bounding boxes generated at the locations that are far from the center of a target object. FCOS adds a centerness branch to the classification subnet to predict the deviation of a pixel to the center of its corresponding bounding box. Given the regression targets l * , t * , r * , b * for a location, the centerness target can be defined as,
c e n t e r n e s s = m i n ( l * , r * ) m a x ( l * , r * ) × m i n ( t * , b * ) m a x ( t * , b * ) ,
When l * = = r * , t * = = b * , it is the most ideal state, and the centerness value is 1. In this paper, the binary cross-entropy(BCE) loss is used to calculate the loss caused by different centerness values. The smaller the centerness value is, the greater BCE loss will be, so that the predicted bounding box will be close to the center point during training. When testing, the value of centerness is equivalent to a weight, which is used to multiply the classification score of each RoI. Thus the centerness can down weight the scores of bounding boxes far from the center of an object. Finally, the detection performance can be effectively improved by filtering out the bounding boxes with low scores by NMS operation.

2.3. Spatial and Channel Attention-Guided Mask

We judge the feature map matched with the RoIs obtained by FCOS according to formula (8), where k m a x is the maximum level of the feature map. A i n p u t and A R o I represent the area of the input image and the area of RoI, respectively. If the area of the RoI is greater than half of the input image area, the RoI is assigned to the feature map with the largest scale. In this paper, we set k m a x = 7, if k is lower than the minimum level (in this paper, we set the minimum level to P3), then k is forcibly assigned to the minimum scale feature map P3.
k = k m a x log 2 A i n p u t A R o I .
Inspired by the spatial attention mechanism, this paper uses a SCAG-Mask mechanism to guide the mask subnet to predict class-specific masks by focusing on meaningful pixels and suppressing non-information pixels. The details are shown in Figure 3 and formula (9).
X = F 1 × 1 ( d e c o n v 2 × 2 ( ( σ ( F 3 × 3 ( P m a x P a v g ) ) x i ) ( σ ( W c ( F g a p a v g ( x i ) ) W c ( F g a p m a x ( x i ) ) ) x i ) ) ) ,
where x i denotes the input feature map obtained through RoIAlign operation and four convolutional layers. P m a x is the max pooling of all feature maps for each position. P a v g is the average pooling for all feature maps for each position. ∘ represents concatenate operation. F 1 × 1 and F 3 × 3 separately denote 1 × 1 conv and 3 × 3 conv. ⊕ and ⊗ respectively represent element-wise addition and element-wise multiplication.

2.4. Multi-Task Loss

During training time, we compute a multi-task loss on each RoI as:
L o s s = L c l s + L r e g + L c e n t e r n e s s + L m a s k + L m a s k i o u ,
where the classification loss L c l s is α -Balance focal loss defined in Reference [41], the regression loss L r e g is GIoU loss identical as in Reference [42], the centerness loss L c e n t e r n e s s and mask loss L m a s k are same as those in Reference [33]. In addition, this paper uses L 2 loss to calculate MaskIoU loss L m a s k i o u .

3. Dataset and Evaluation Metrics

3.1. Dataset Description

In this paper, we gain high-resolution remote sensing building semantic segmentation database data of Wuhan University (WHU building dataset, http://study.rsgis.whu.edu.cn/pages/download/building_dataset.html). The original remote sensing images in the database were from Christchurch, New Zealand, which cover 220,000 diverse buildings. After the downsampling, labeling and segmentation operations of the Jishunping team [43] of Wuhan University, more than 8000 images of 512-pixel × 512-pixel, 0.3 m spatial resolution were produced. In this paper, through removing the abnormal images in the building dataset manually and converting the semantic segmentation dataset to COCO instance segmentation task format by using the Suzuki [44] contours detection algorithm, we obtain 4268 images as training set data and 719 images as test set.

3.2. Evaluation Metrics

We adopt average precision (AP) and average detection time to quantitatively assess the performance of the instance segmentation method. A certain number of indexes are needed, namely, true positive (TP), false negative (FN), false positive (FP), and precision–recall curve (PRC). TP denotes the number of correct detections; FN denotes the number of missing detections; and FP denotes the number of mistaken detections. PRC is a curve drawn by the precision metric and the recall metric. The precision metric measures the proportion of correct detections to all detections. The recall metric measures the proportion of correct detections to all ground-truth boxes. The precision metric and recall metric are defined as,
P r e c i s i o n = T P T P + F P ,
R e c a l l = T P T P + F N .
AP—the AP metric computes the area under the PRC. A higher AP value indicates better performance, and vice versa. The AP used here includes AP of box detection A P b o x and AP of mask extraction A P m a s k . Besides, the A P b o x and A P m a s k of small, medium and large size objects are further refined. Among them, small-sized objects are objects with a pixel area of less than 32 2 . Medium-sized objects are objects with a pixel area greater than 32 2 but less than 96 2 . Large size objects are objects with a pixel area greater than 96 2 .

4. Results and Discussion

4.1. Parameter Setting Experiments

Table 1 shows the detailed hyperparameter settings. In the experiment, we set weight decay as 0.0001, the momentum as 0.9, and the pooler_scales as (0.125, 0.0625, 0.03125), then, we use ResNet101 and VoVNetV2-57 with different learning rates commit several experiments. Note that, we utilize the training set data described in Section 3 to fit the model when changing the backbone and learning rate; and we use test set to evaluate the different performances of models generated by different backbone and learning rates. The performances of different models on the test set are shown in Table 2.
In this paper, we consider the impact of different learning rates on model performance. As shown in Table 2, when using ResNet101 as the feature extraction network, the model performance is optimal when the learning rate is 0.005. And when using VoVNetV2-57 as the feature extraction network, the model performance is optimal when the learning rate is 0.001. Comparing the AP values for performance of two best-case models, we can find that the VoVNetV2-57 has significant advantages as a feature extraction network, especially when extracting small and medium-scale buildings.
Besides, we examine the impact of our improvements in this paper on model performance. Since our backbone is improved on VoVNetV2-57, we control the learning rate at 0.001 in the following experiments. The performances of our improved models on test set are shown in Table 3.
As can be seen from Table 3, when use optimized backbone without changing other parts of the model, the AP value(the second row in Table 3) of the obtained model on buildings detection and segmentation has been improved to a certain extent. Especially when extracting large buildings, the AP value increased significantly. When only use SCAG-Mask without changing other parts of the model. Compared with the AP value gained by original CenterMask (the first row in Table 3), the AP value of bounding box detection of small and medium-sized buildings has decreased. But due to our SCAG-Mask focus on spatial and channel attention guiding, the AP value of the building segmentation has been significantly improved. Compared with the results obtained by optimizing the backbone (the second row in Table 3), although the AP value acquired by using SCAG-Mask in the segmentation of medium and large buildings is significantly improved, the AP of bounding box detection reduces heavily. Thus, it seems that optimize the backbone only is better than only use SCAG-Mask due to its comprehensive performance improvement. At last, we synthetically use the improved backbone and SCAG-Mask. The obtained AP value is shown in the fourth row of Table 3. And we can see that the AP value for large building detection and the AP value for small, medium, and large building instance object segmentation are both significantly improved. Although compared with the backbone optimizing only (the second row in Table 3), the detection AP of small buildings and medium-sized buildings have slight decreases, but compared with other performance improvements, these slight decreases can be ignored. So the combination of backbone and SCAG-Mask is effective.
After the above experiments, here, we visualize and compare the building extraction results on the test set, which from the optimal model obtained by using ResNet101 as feature extraction network, the optimal model gained by applying VoVNetV2-57 as backbone, and the three models acquired by using the improved methods in our work, as Figure 4 shown. And we can find that the performances of the segmentation of target bounding box (Figure 4a), the prediction of dense buildings (Figure 4b), the identification of confusing object (Figure 4c) and occlusion buildings (Figure 4d) by synthetically using the improved VoVNetV2-57 and SCAG-Mask are better than the others, especially the use of ResNet101 and original VoVNetV2-57. It further illustrates the effectiveness of the network structure and the trained model used in this paper.

4.2. Comparison with State-of-the-Art Methods

This paper compares and analyzes the method effects of Mask R-CNN, Mask Scoring R-CNN, CenterMask and improved CenterMask on the same test set under the same experimental environment. Same as parameter setting experiments, we use the training set data described in Section 3 to fit the model when adopting different algorithms; and we use test set to evaluate the different performances of models under different methods. The corresponding AP values and average detection time of four methods are shown in Table 4. As can be seen from Table 4, CenterMask and improved CenterMask by not setting the anchor mechanism perform more efficiently than Mask R-CNN and Mask Scoring R-CNN which belong to two-stage instance segmentation method. And the average detection time is only 49.88 ms. In addition, the improved CenterMask used in this paper, while ensuring efficiency, demonstrates that it is not inferior to the performance of Mask R-CNN and Mask Scoring R-CNN. Especially in the extraction of medium and large scale buildings, it can even achieve higher AP than the two methods. Although the anchor mechanism is discarded, the AP of improved CenterMask is slightly lower than Mask R-CNN and Mask Scoring R-CNN when extracting small-scale buildings. However, in terms of comprehensive AP and average detection efficiency, improved CenterMask used in this paper still has great advantages.

4.3. Usability Analysis in Practical Application

In order to further illustrate the effectiveness of the method proposed in this paper, we take building extraction in China’s urban villages as example to verify the usability of our method in practical application. This paper collects the building samples in China’s urban villages from Google Earth imagery with spatial resolution of 0.11 m. To realize data augmentation, these samples are vertical and horizontal flipped, and 90 degrees, 180 degrees and 270 degrees counterclockwise rotated. Finally, by using professional labeling software, 2726 instance segmentation samples of China’s urban villages buildings are obtained. They are further divided into 2326 training samples and 400 test samples. The training samples are fed into the method proposed in this paper to fit a model suitable for the extraction of urban villages buildings. And the test samples are used for verifying the performance of the proposed method in the extraction of China’s urban villages buildings.
Figure 5 shows the extraction results of China’s urban villages buildings on test samples with proposed method in this paper. We can find out that despite the high density of buildings and narrow streets and lanes in urban villages, the method in this paper can still effectively extract buildings in China’s urban villages. In terms of quantitative indicators, the A P b o x of the model on the urban village buildings test set is 0.799, and the A P m a s k is 0.728. The precision rate of building extraction can be as high as 0.91 and the recall rate can be as high as 0.95 for single sample. This fully demonstrates that the improved anchor-free instance segmentation method proposed in this paper can achieve good extraction performance on China’s urban villages building samples. And the method can achieve real-time building extraction, the prediction of entire test samples only takes 12 s, which further proves the practicability of this method.

5. Conclusions

We have proposed an improved real-time anchor-free one-stage instance segmentation method and a more effective backbone network. By adding the SCAG-Mask to the anchor-free one stage instance detection, our improved CenterMask achieves state-of-the-art performance at real-time speed. Although Mask R-CNN and Mask Scoring R-CNN show better performances than our improved CenterMask on A P s b o x and A P s m a s k , we are still full of confidence in our improved CenterMask due to its well-balanced performance in terms of speed and accuracy. In addition, we take buildings extraction in China’s urban villages as example to verify the usability of our method in practical applications and get good extraction results and satisfactory speed. In the future, we will further improve the performance of the model in small object detection and segmentation. And some post-processing techniques may be explored and compared to obtain the best framework for building extraction.

Funding

This research was funded by the Beijing Municipal Science and Technology Project under grant No.Z191100001419002.

Conflicts of Interest

The authors declare no conflict of interest.

References

  1. Ding, Z.; Wang, X.; Li, Y.; Zhang, S. Study on Building Extraction from High-Resolution Images Using Mbi. Int. Arch. Photogramm. Remote Sens. Spat. Inf. Sci 2018, 42, 283–287. [Google Scholar] [CrossRef] [Green Version]
  2. Shinohara, T.; Xiu, H.; Matsuoka, M. FWNet: Semantic Segmentation for Full-Waveform LiDAR Data Using Deep Learning. Sensors 2020, 20, 3568. [Google Scholar] [CrossRef]
  3. Colaninno, N.; Roca, J.; Pfeffer, K. An automatic classification of urban texture: Form and compactness of morphological homogeneous structures in Barcelona. In Proceedings of the 51st Congress of the European Regional Science Association: New Challenges for European Regions and Urban Areas in a Globalised World, Barcelona, Spain, 30 August–3 September 2011. [Google Scholar]
  4. Hermosilla, T.; Palomar-Vázquez, J.; Balaguer-Beser, Á.; Balsa-Barreiro, J.; Ruiz, L.A. Using street based metrics to characterize urban typologies. Comput. Environ. Urban Syst. 2014, 44, 68–79. [Google Scholar] [CrossRef] [Green Version]
  5. Van de Voorde, T.; Jacquet, W.; Canters, F. Mapping form and function in urban areas: An approach based on urban metrics and continuous impervious surface data. Landsc. Urban Plan. 2011, 102, 143–155. [Google Scholar] [CrossRef]
  6. Huertas, A.; Nevatia, R. Detecting buildings in aerial images. Comput. Vision Graph. Image Process. 1988, 41, 131–152. [Google Scholar] [CrossRef]
  7. Irvin, R.B.; McKeown, D.M. Methods for exploiting the relationship between buildings and their shadows in aerial imagery. IEEE Trans. Syst. Man Cybern. 1989, 19, 1564–1575. [Google Scholar] [CrossRef] [Green Version]
  8. Inglada, J. Automatic recognition of man-made objects in high resolution optical remote sensing images by SVM classification of geometric image features. ISPRS J. Photogramm. Remote. Sens. 2007, 62, 236–248. [Google Scholar] [CrossRef]
  9. Meng, Y.; Peng, S. Object-oriented building extraction from high-resolution imagery based on fuzzy SVM. In Proceedings of the 2009 International Conference on Information Engineering and Computer Science, Wuhan, China, 19–20 December 2009; IEEE: Piscataway, NJ, USA, 2009; pp. 1–6. [Google Scholar]
  10. Awrangjeb, M.; Zhang, C.; Fraser, C.S. Automatic extraction of building roofs using LIDAR data and multispectral imagery. ISPRS J. Photogramm. Remote. Sens. 2013, 83, 1–18. [Google Scholar] [CrossRef] [Green Version]
  11. Awrangjeb, M.; Fraser, C.S. Automatic segmentation of raw LiDAR data for extraction of building roofs. Remote Sens. 2014, 6, 3716–3751. [Google Scholar] [CrossRef] [Green Version]
  12. Gilani, S.A.N.; Awrangjeb, M.; Lu, G. Segmentation of airborne point cloud data for automatic building roof extraction. Gisci. Remote Sens. 2018, 55, 63–89. [Google Scholar] [CrossRef] [Green Version]
  13. Gilani, S.A.N.; Awrangjeb, M.; Lu, G. An automatic building extraction and regularisation technique using lidar point cloud data and orthoimage. Remote Sens. 2016, 8, 258. [Google Scholar] [CrossRef] [Green Version]
  14. Ronneberger, O.; Fischer, P.; Brox, T. U-net: Convolutional networks for biomedical image segmentation. In International Conference on Medical Image Computing and Computer-Assisted Intervention; Springer: Berlin/Heidelberg, Germany, 2015; pp. 234–241. [Google Scholar]
  15. Badrinarayanan, V.; Kendall, A.; Cipolla, R. SegNet: A Deep Convolutional Encoder-Decoder Architecture for Image Segmentation. IEEE Trans. Pattern Anal. Mach. Intell. 2017, 39, 2481–2495. [Google Scholar] [CrossRef]
  16. Chen, L.C.; Papandreou, G.; Kokkinos, I.; Murphy, K.; Yuille, A.L. DeepLab: Semantic Image Segmentation with Deep Convolutional Nets, Atrous Convolution, and Fully Connected CRFs. IEEE Trans. Pattern Anal. Mach. Intell. 2018, 40, 834–848. [Google Scholar] [CrossRef]
  17. Xu, Y.; Wu, L.; Xie, Z.; Chen, Z. Building Extraction in Very High Resolution Remote Sensing Imagery Using Deep Learning and Guided Filters. Remote Sens. 2018, 10, 144. [Google Scholar] [CrossRef] [Green Version]
  18. Shrestha, S.; Vanneschi, L. Improved fully convolutional network with conditional random fields for building extraction. Remote Sens. 2018, 10, 1135. [Google Scholar] [CrossRef] [Green Version]
  19. Li, X.; Yao, X.; Fang, Y. Building-A-Nets: Robust Building Extraction from High-Resolution Remote Sensing Images with Adversarial Networks. IEEE J. Sel. Top. Appl. Earth Obs. Remote Sens. 2018, 11, 3680–3687. [Google Scholar] [CrossRef]
  20. He, K.; Gkioxari, G.; Dollar, P.; Girshick, R. Mask R-CNN. IEEE Trans. Pattern Anal. Mach. Intell. 2020, 42, 386–397. [Google Scholar] [CrossRef]
  21. Ren, S.; He, K.; Girshick, R.; Sun, J. Faster R-CNN: Towards Real-Time Object Detection with Region Proposal Networks. IEEE Trans. Pattern Anal. Mach. Intell. 2017, 39, 1137–1149. [Google Scholar] [CrossRef] [Green Version]
  22. Huang, Z.; Huang, L.; Gong, Y.; Huang, C.; Wang, X. Mask Scoring R-CNN. In Proceedings of the 2019 IEEE/CVF Conference on Computer Vision and Pattern Recognition (CVPR), Long Beach City, CA, USA, 16–20 June 2019; pp. 6409–6418. [Google Scholar]
  23. Cai, Z.; Vasconcelos, N. Cascade R-CNN: Delving Into High Quality Object Detection. In Proceedings of the 2018 IEEE/CVF Conference on Computer Vision and Pattern Recognition, Salt Lake City, UT, USA, 18–22 June 2018; pp. 6154–6162. [Google Scholar]
  24. Liu, S.; Qi, L.; Qin, H.; Shi, J.; Jia, J. Path Aggregation Network for Instance Segmentation. In Proceedings of the 2018 IEEE/CVF Conference on Computer Vision and Pattern Recognition, Salt Lake City, UT, USA, 18–23 June 2018; pp. 8759–8768. [Google Scholar]
  25. Li, Y.; Chen, Y.; Wang, N.; Zhang, Z.X. Scale-Aware Trident Networks for Object Detection. In Proceedings of the 2019 IEEE/CVF International Conference on Computer Vision (ICCV), Seoul, Korea, 27 October–2 November 2019; pp. 6053–6062. [Google Scholar]
  26. Liu, W.; Anguelov, D.; Erhan, D.; Szegedy, C.; Reed, S.E.; Fu, C.Y.; Berg, A.C. SSD: Single Shot MultiBox Detector. In European Conference on Computer Vision; Springer: Berlin/Heidelberg, Germany, 2016; pp. 21–37. [Google Scholar]
  27. Redmon, J.; Divvala, S.; Girshick, R.; Farhadi, A. You Only Look Once: Unified, Real-Time Object Detection. In Proceedings of the 2016 IEEE Conference on Computer Vision and Pattern Recognition (CVPR), Las Vegas, NV, USA, 27–30 June 2016; pp. 779–788. [Google Scholar]
  28. Bolya, D.; Zhou, C.; Xiao, F.; Lee, Y.J. YOLACT: Real-Time Instance Segmentation. In Proceedings of the 2019 IEEE/CVF International Conference on Computer Vision (ICCV), Seoul, Korea, 27 October–2 November 2019; pp. 9156–9165. [Google Scholar]
  29. Potlapally, A.; Chowdary, P.S.R.; Shekhar, S.R.; Mishra, N.; Madhuri, C.S.V.D.; Prasad, A. Instance Segmentation in Remote Sensing Imagery using Deep Convolutional Neural Networks. In Proceedings of the 2019 International Conference on contemporary Computing and Informatics (IC3I), Singapore, 12–14 December 2019; pp. 117–120. [Google Scholar]
  30. Ji, S.; Shen, Y.; Lu, M.; Zhang, Y. Building instance change detection from large-scale aerial images using convolutional neural networks and simulated samples. Remote Sens. 2019, 11, 1343. [Google Scholar] [CrossRef] [Green Version]
  31. Li, Q.; Mou, L.; Hua, Y.; Sun, Y.; Jin, P.; Shi, Y.; Zhu, X.X. Instance segmentation of buildings using keypoints. arXiv 2020, arXiv:2006.03858. [Google Scholar]
  32. Su, H.; Wei, S.; Liu, S.; Liang, J.; Wang, C.; Shi, J.; Zhang, X. HQ-ISNet: High-Quality Instance Segmentation for Remote Sensing Imagery. Remote Sens. 2020, 12, 989. [Google Scholar] [CrossRef] [Green Version]
  33. Tian, Z.; Shen, C.; Chen, H.; He, T. FCOS: Fully Convolutional One-Stage Object Detection. In Proceedings of the 2019 IEEE/CVF International Conference on Computer Vision (ICCV), Seoul, Korea, 27 October–2 November 2019; pp. 9626–9635. [Google Scholar]
  34. Duan, K.; Bai, S.; Xie, L.; Qi, H.; Huang, Q.; Tian, Q. CenterNet: Keypoint Triplets for Object Detection. In Proceedings of the 2019 IEEE/CVF International Conference on Computer Vision (ICCV), Seoul, Korea, 27 October–2 November 2019; pp. 6568–6577. [Google Scholar]
  35. Law, H.; Deng, J. CornerNet: Detecting Objects as Paired Keypoints. Int. J. Comput. Vis. 2020, 128, 642–656. [Google Scholar] [CrossRef] [Green Version]
  36. Chen, H.; Sun, K.; Tian, Z.; Shen, C.; Huang, Y.; Yan, Y. BlendMask: Top-Down Meets Bottom-Up for Instance Segmentation. In Proceedings of the CVPR 2020: Computer Vision and Pattern Recognition, Virtual, Seattle, WA, USA, 14–19 June 2020; pp. 8573–8581. [Google Scholar]
  37. Lee, Y.; Park, J. CenterMask: Real-Time Anchor-Free Instance Segmentation. In Proceedings of the CVPR 2020: Computer Vision and Pattern Recognition, Virtual, Seattle, WA, USA, 14–19 June 2020; pp. 13906–13915. [Google Scholar]
  38. Lin, T.Y.; Dollár, P.; Girshick, R.; He, K.; Hariharan, B.; Belongie, S. Feature pyramid networks for object detection. In Proceedings of the IEEE Conference on Computer Vision and Pattern Recognition, Honolulu, HI, USA, 21–26 July 2017; pp. 2117–2125. [Google Scholar]
  39. Lee, Y.; Hwang, J.W.; Lee, S.; Bae, Y.; Park, J. An energy and gpu-computation efficient backbone network for real-time object detection. In Proceedings of the IEEE Conference on Computer Vision and Pattern Recognition Workshops, Long Beach City, CA, USA, 16–20 June 2019. [Google Scholar]
  40. He, K.; Zhang, X.; Ren, S.; Sun, J. Deep residual learning for image recognition. In Proceedings of the IEEE conference on computer vision and pattern recognition, Las Vegas, NV, USA, 27–30 June 2016; pp. 770–778. [Google Scholar]
  41. Lin, T.Y.; Goyal, P.; Girshick, R.; He, K.; Dollar, P. Focal Loss for Dense Object Detection. IEEE Trans. Pattern Anal. Mach. Intell. 2020, 42, 318–327. [Google Scholar] [CrossRef] [PubMed] [Green Version]
  42. Rezatofighi, H.; Tsoi, N.; Gwak, J.; Sadeghian, A.; Reid, I.; Savarese, S. Generalized Intersection Over Union: A Metric and a Loss for Bounding Box Regression. In Proceedings of the 2019 IEEE/CVF Conference on Computer Vision and Pattern Recognition (CVPR), Long Beach, CA, USA, 15–20 June 2019; pp. 658–666. [Google Scholar]
  43. Ji, S.; Wei, S.; Lu, M. Fully Convolutional Networks for Multisource Building Extraction From an Open Aerial and Satellite Imagery Data Set. IEEE Trans. Geosci. Remote Sens. 2019, 57, 574–586. [Google Scholar] [CrossRef]
  44. Suzuki, S.; Abe, K. Topological Structural Analysis of Digitized Binary Images by Border Following. Graph. Model. Graph. Model. Image Process. Comput. Vis. Graph. Image Process. 1985, 30, 32–46. [Google Scholar] [CrossRef]
Figure 1. The network architecture of Improved CenterMask, where C3, C4, and C5 denote the feature maps of the backbone network, and P3 to P7 are the feature levels used for the final prediction. W, H separately represent the width and height of feature maps.
Remotesensing 12 02910 g001
Figure 2. The structure of feature extraction network, where Fgapavg is global average pooling, Fgapmax is global max pooling, WC is fully-connected layer. W, H, C separately represent the width, height, and the number of channels for feature maps.
Remotesensing 12 02910 g002
Figure 3. The structure of the spatial and channel attention-guided mask (SCAG-Mask), where Fgapavg and Fgapmax are global average pooling and global max pooling same as Figure 2, WC is fully-connected layer. W, H, C separately represent the width, height, and the number of channels for feature maps.
Remotesensing 12 02910 g003
Figure 4. Comparison of building extraction results on test set for five models. (a) Performance of segmentation for target bounding box; (b) Performance of dense buildings prediction; (c) Performance of confusing object identification; (d) Performance of occlusion buildings extraction.
Remotesensing 12 02910 g004
Figure 5. Building extraction results on building test samples in China’s urban villages.
Remotesensing 12 02910 g005
Table 1. Summarization of hyperparameters fixed in the paper.
HyperparametersSetting Details
No. of FILTERS 3 × 3 c o n v , 64
3 × 3 c o n v , 64
3 × 3 c o n v , 128
3 × 3 c o n v , 128 , × 5 , c o n c a t , & 1 × 1 c o n v , 256 × 1
3 × 3 c o n v , 160 , × 5 , c o n c a t , & 1 × 1 c o n v , 512 × 1
3 × 3 c o n v , 192 , × 5 , c o n c a t , & 1 × 1 c o n v , 768 × 4
3 × 3 c o n v , 224 , × 5 , c o n c a t , & 1 × 1 c o n v , 1024 × 3
BATCH SIZE8
EPOCHS200
WEIGHT DECAY0.0001
MOMENTUM0.9
WARMUP_FACTOR0.333
WARMUP_ITERS500
POOLER_ScALES(0.125, 0.0625, 0.03125)
POOLER_SAMPLING_RATIO2.0
POOLER_RESOLUTION14
FPN_STRIDES[8, 16, 32, 64, 128]
FCOS_CENTER_SAMPLE_POS_RADIUS1.5
FOCAL_LOSS_ALPHA0.25
FOCAL_LOSS_GAMMA2.0
Table 2. Comparison of average precision (AP) on the test set under different parameter configurations.
Feature Extraction NetworkLearning Rate AP box AP s box AP m box AP l box AP mask AP s mask AP m mask AP l mask
ResNet1010.010.64440.44830.81420.73440.60850.40090.77580.7672
ResNet1010.0050.65440.45520.82850.7470.61160.39720.78360.7725
ResNet1010.00010.6290.42870.80470.67410.59810.38840.76940.7311
VoVNetV2-570.00050.67730.48690.84360.72050.62720.42340.79330.7323
VoVNetV2-570.0010.67990.49150.84510.72080.62960.42740.79590.7437
Table 3. Comparison of AP on the test set under different improved models.
Model AP box AP s box AP m box AP l box AP mask AP s mask AP m mask AP l mask
CenterMask with VoVNetV2-570.67990.49150.84510.72080.62960.42740.79590.7437
CenterMask with improved VoVNetV2-57(ours)0.68470.49230.8460.73650.63070.42790.79690.7542
CenterMask with SCAG-Mask(ours)0.67780.4880.84340.72960.6310.42690.79850.7561
CenterMask with improved VoVNetV2-57+SCAG-Mask(ours)0.68410.4920.84440.73770.63420.43090.79920.7574
Table 4. Comparison of AP on the test set with state-of-the-art methods.
Method AP box AP s box AP m box AP l box AP mask AP s mask AP m mask AP l mask Average Detection Time (ms)GPU
Mask R-CNN0.65850.50490.7890.71210.63840.46630.7710.746869.49Xp
Mask scoring R-CNN0.66040.50580.78810.71240.64510.47050.78060.75672.83Xp
CenterMask0.67990.49150.84510.72080.62960.42740.79590.743749.88Xp
Improved CenterMask0.68410.4920.84440.73770.63420.43090.79920.757449.88Xp

