Surging Dynamics of Glaciers in the Hunza Valley under an Equilibrium Mass State since 1990

 ,
,  and
and
Abstract
:
1. Introduction
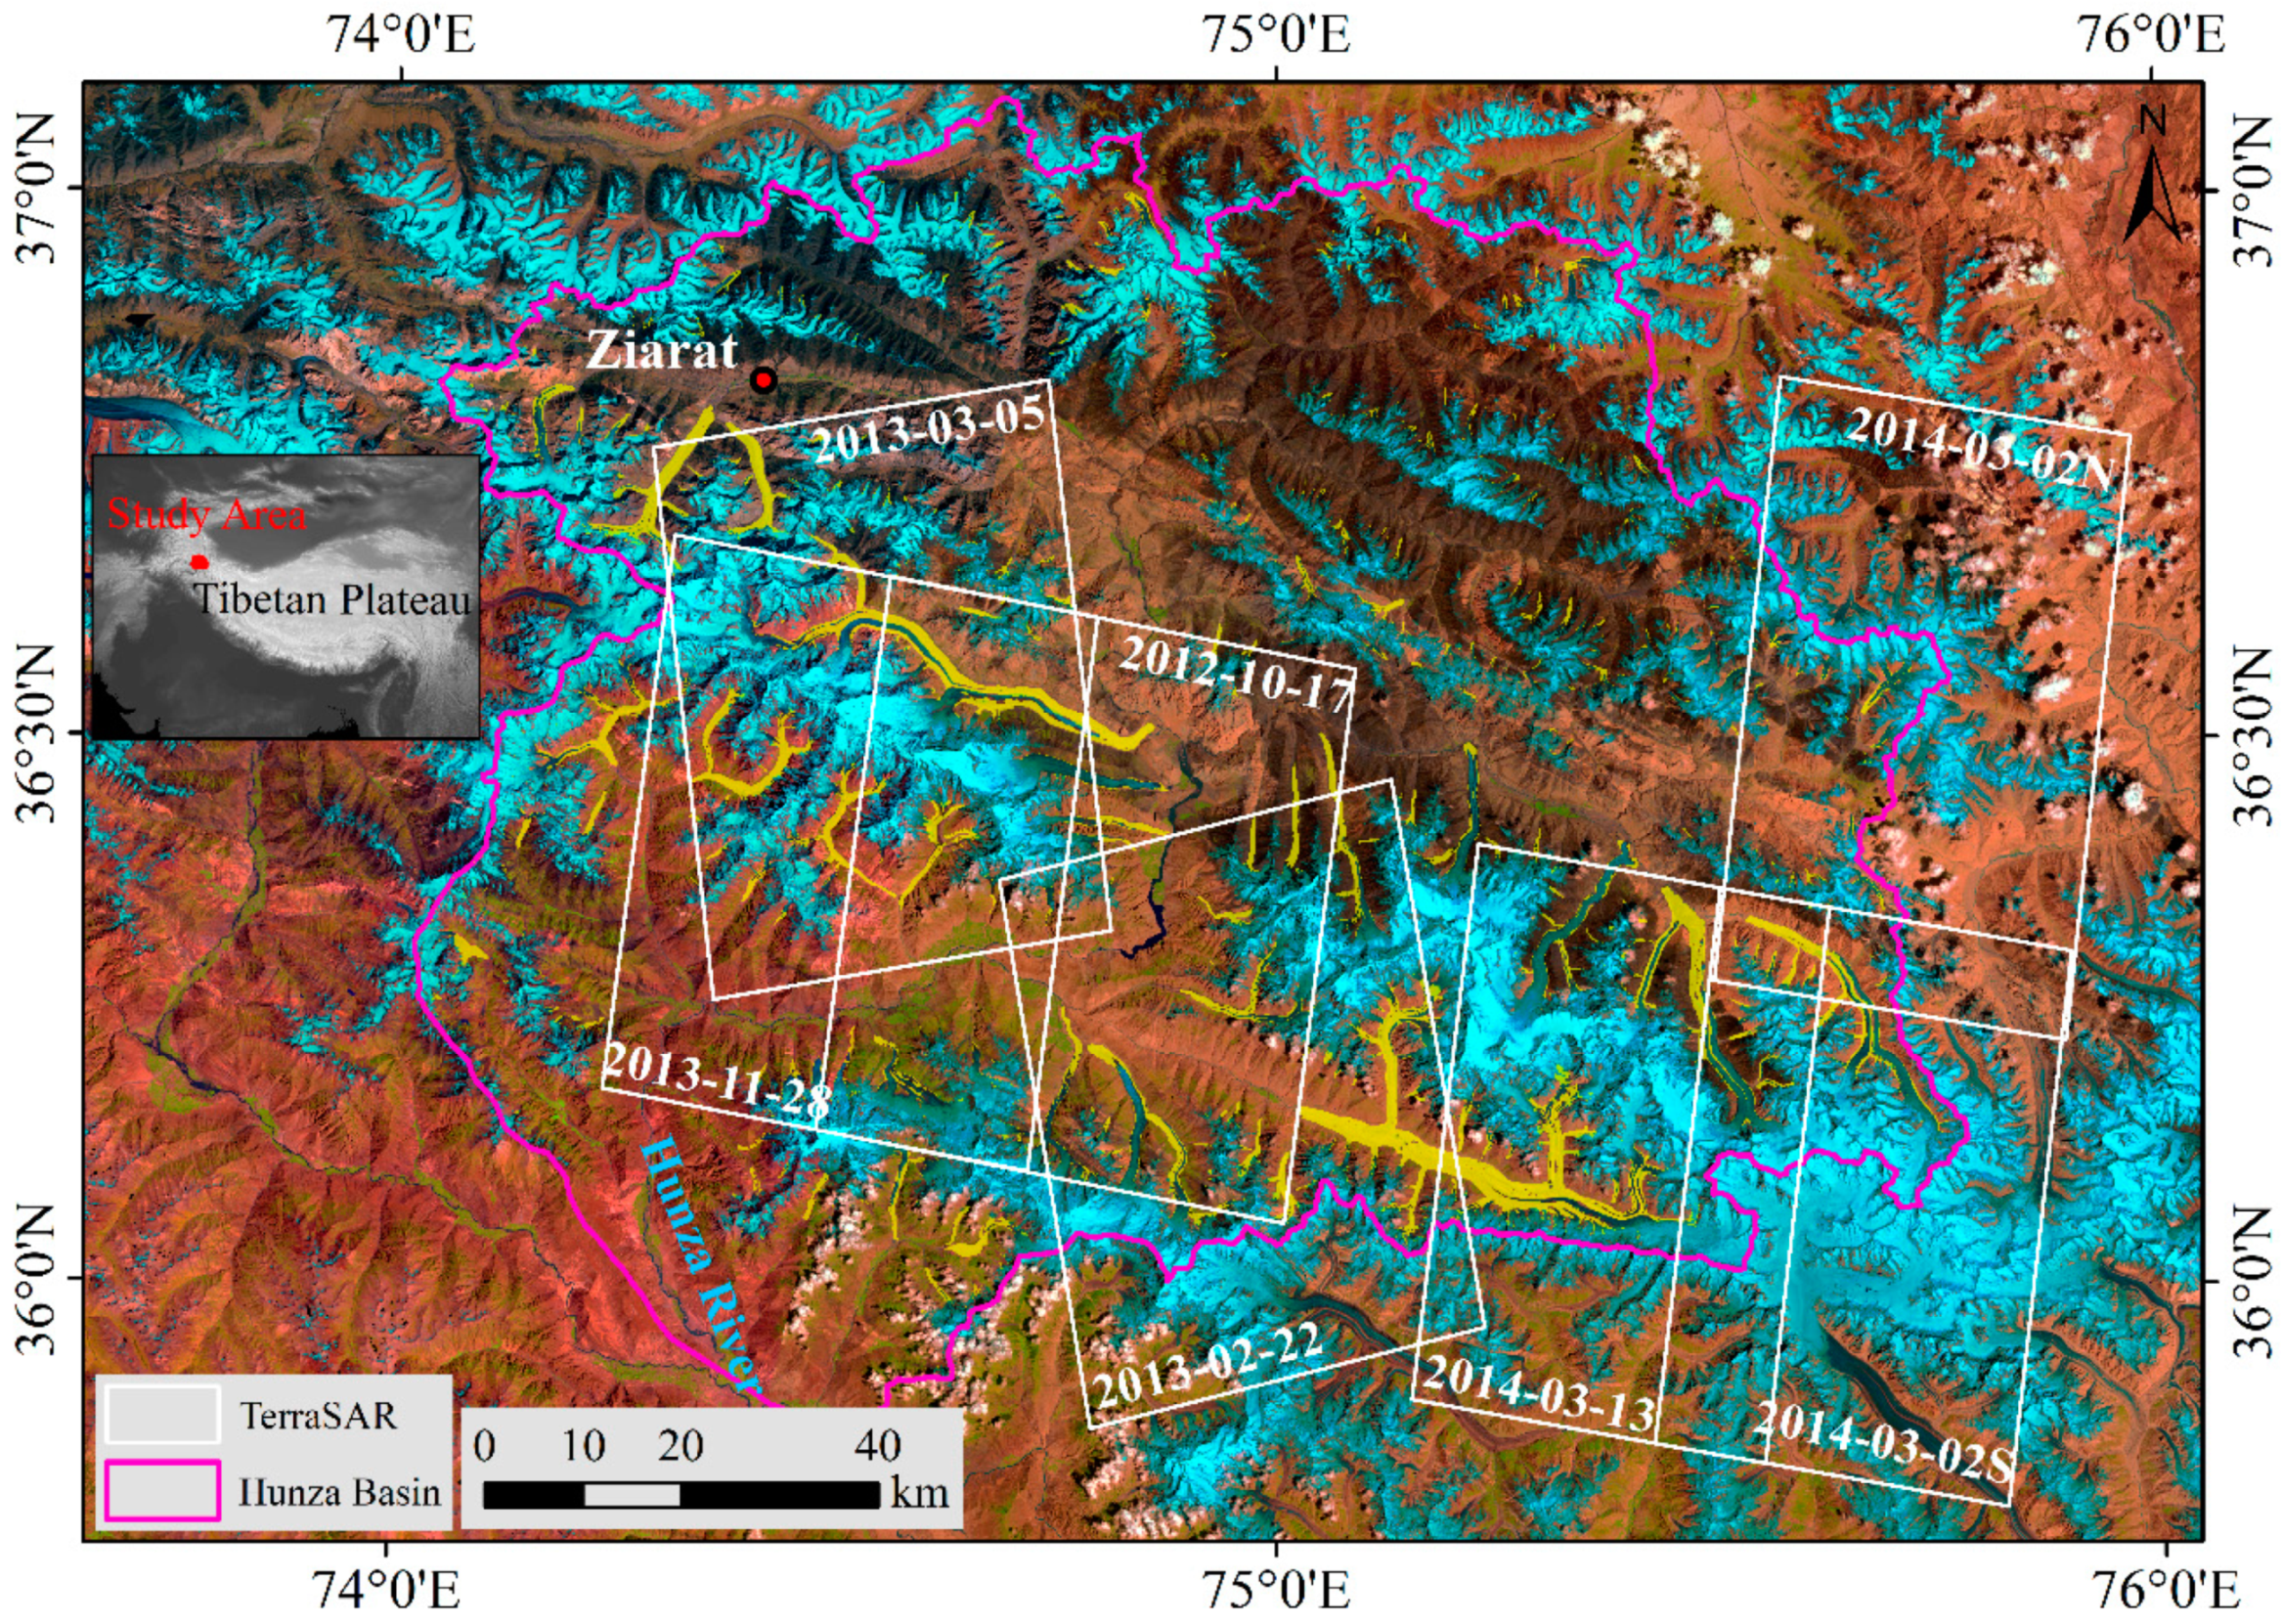
2. Study Area
3. Methods
3.1. Glacier Outlines
3.2. Glacier Height Changes
3.3. Glacier Surface Velocities
4. Results
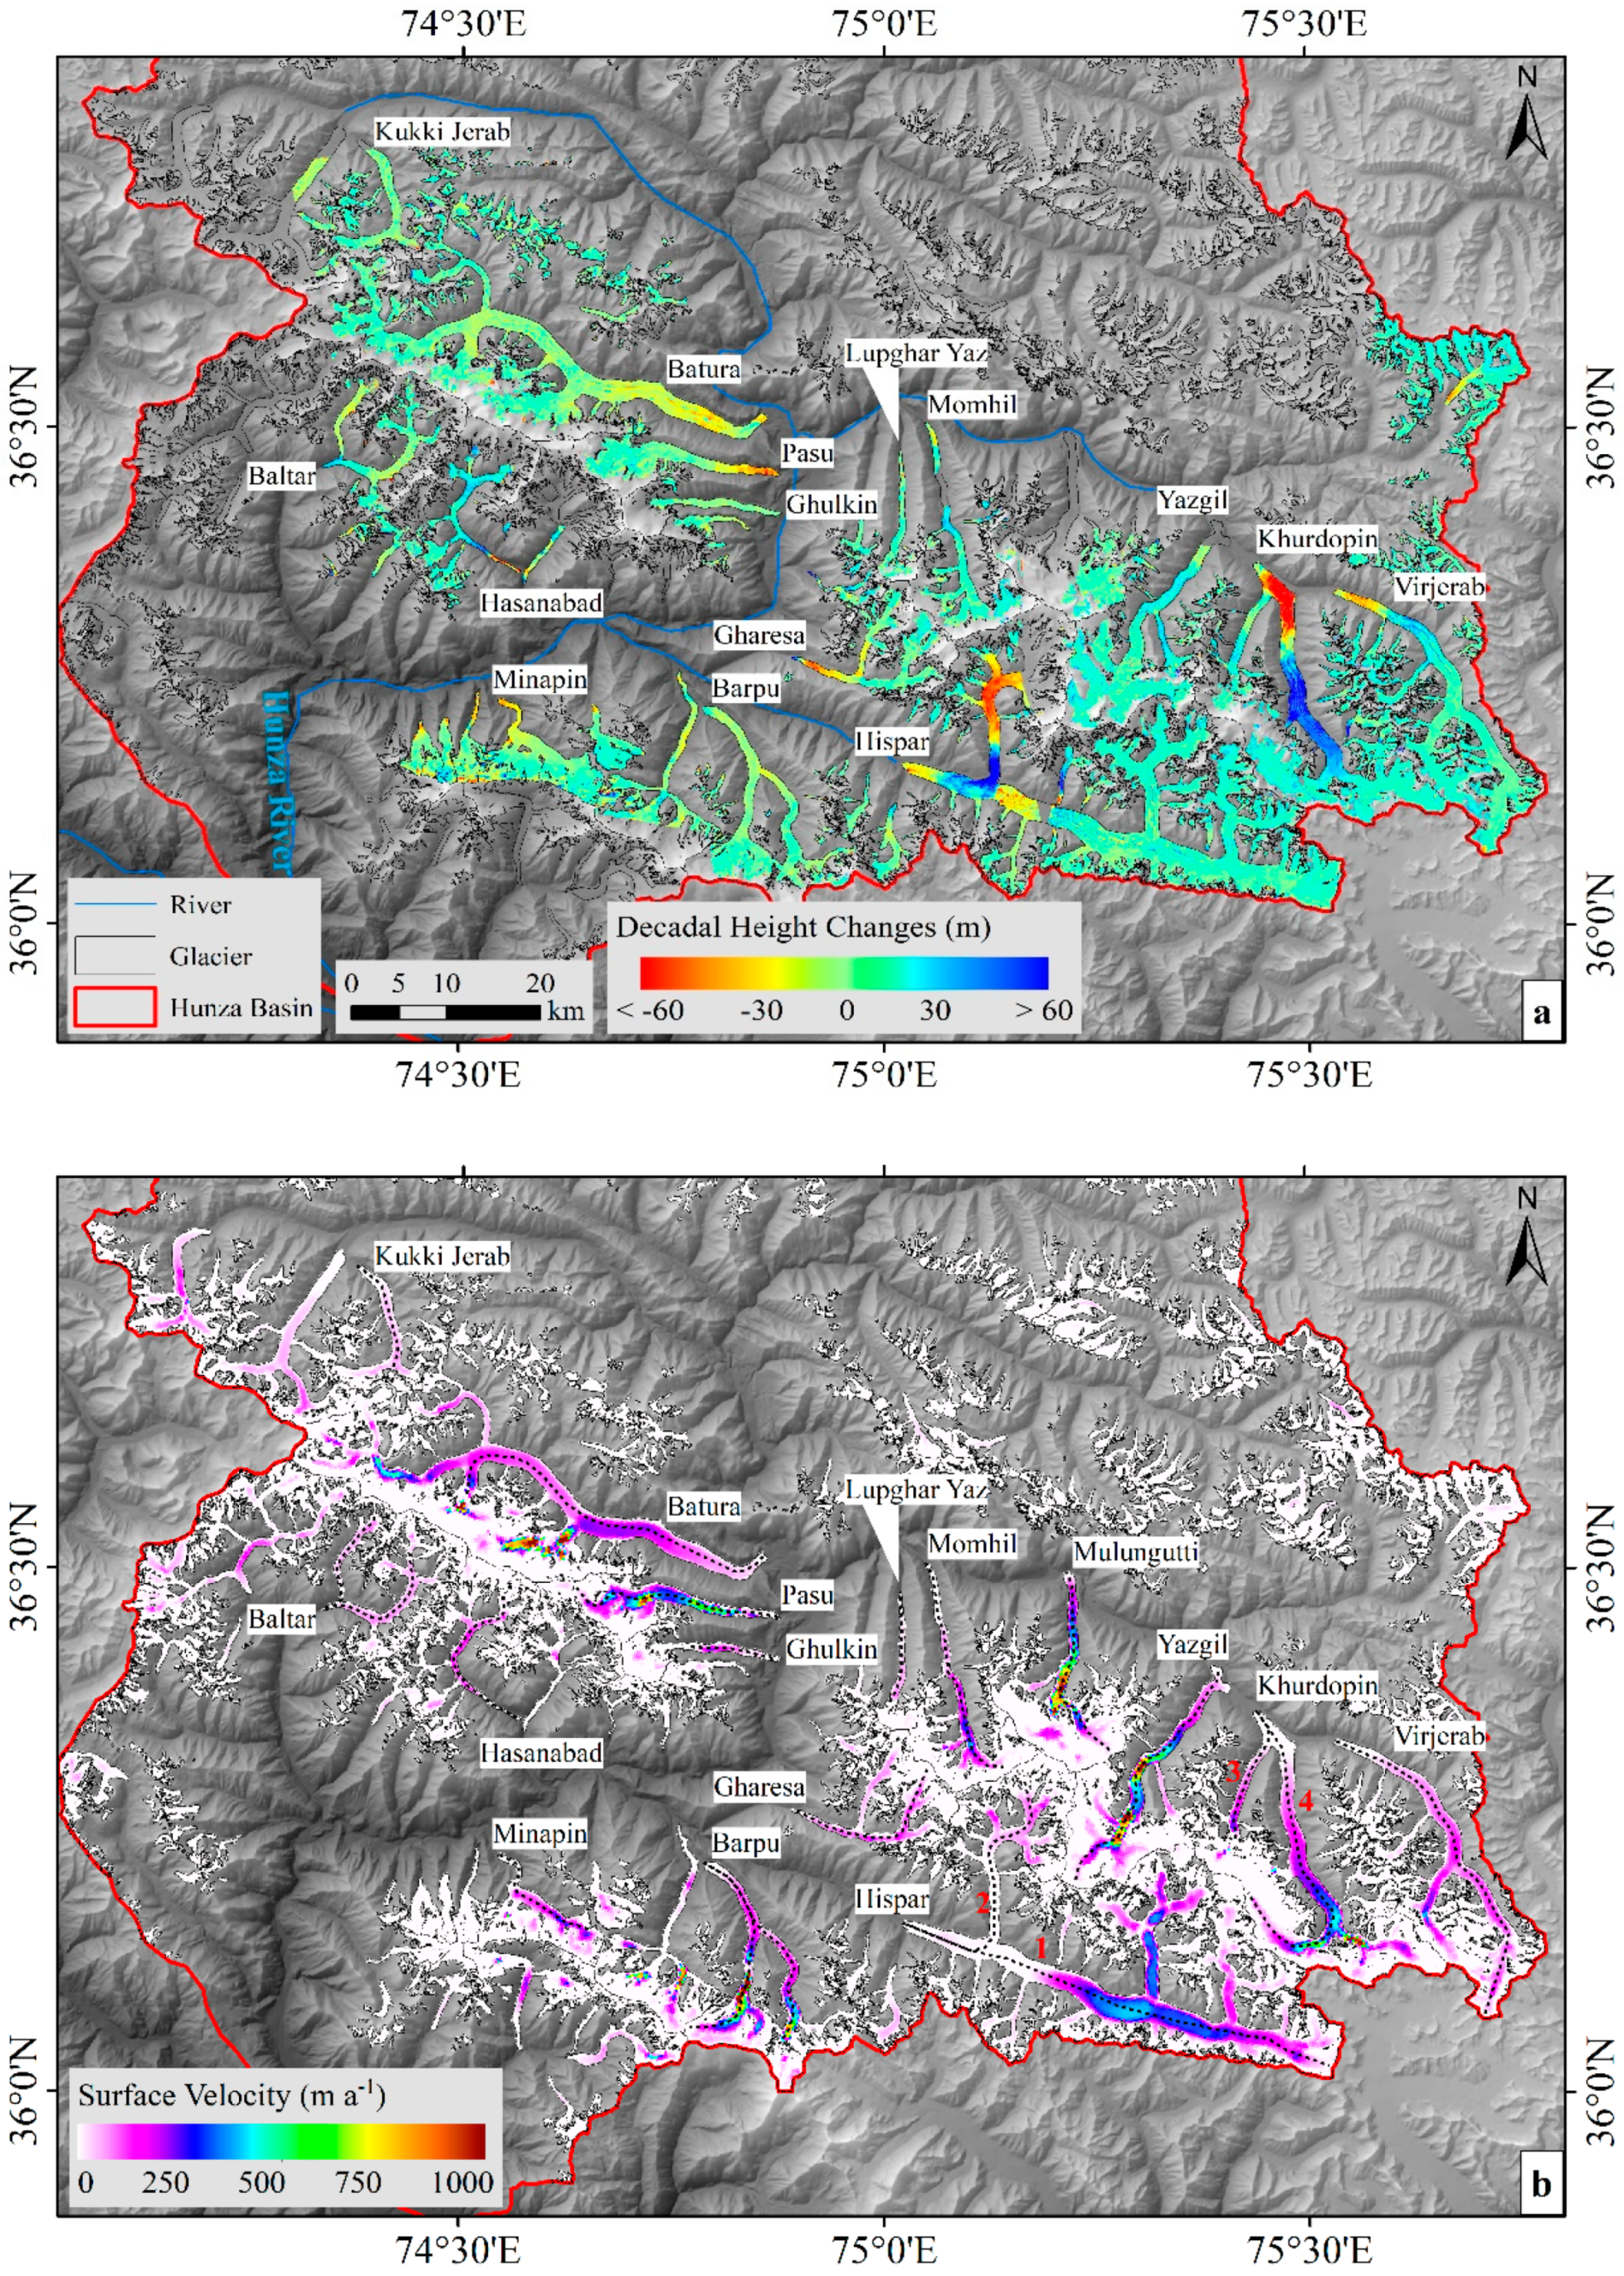
4.1. Mass Balance
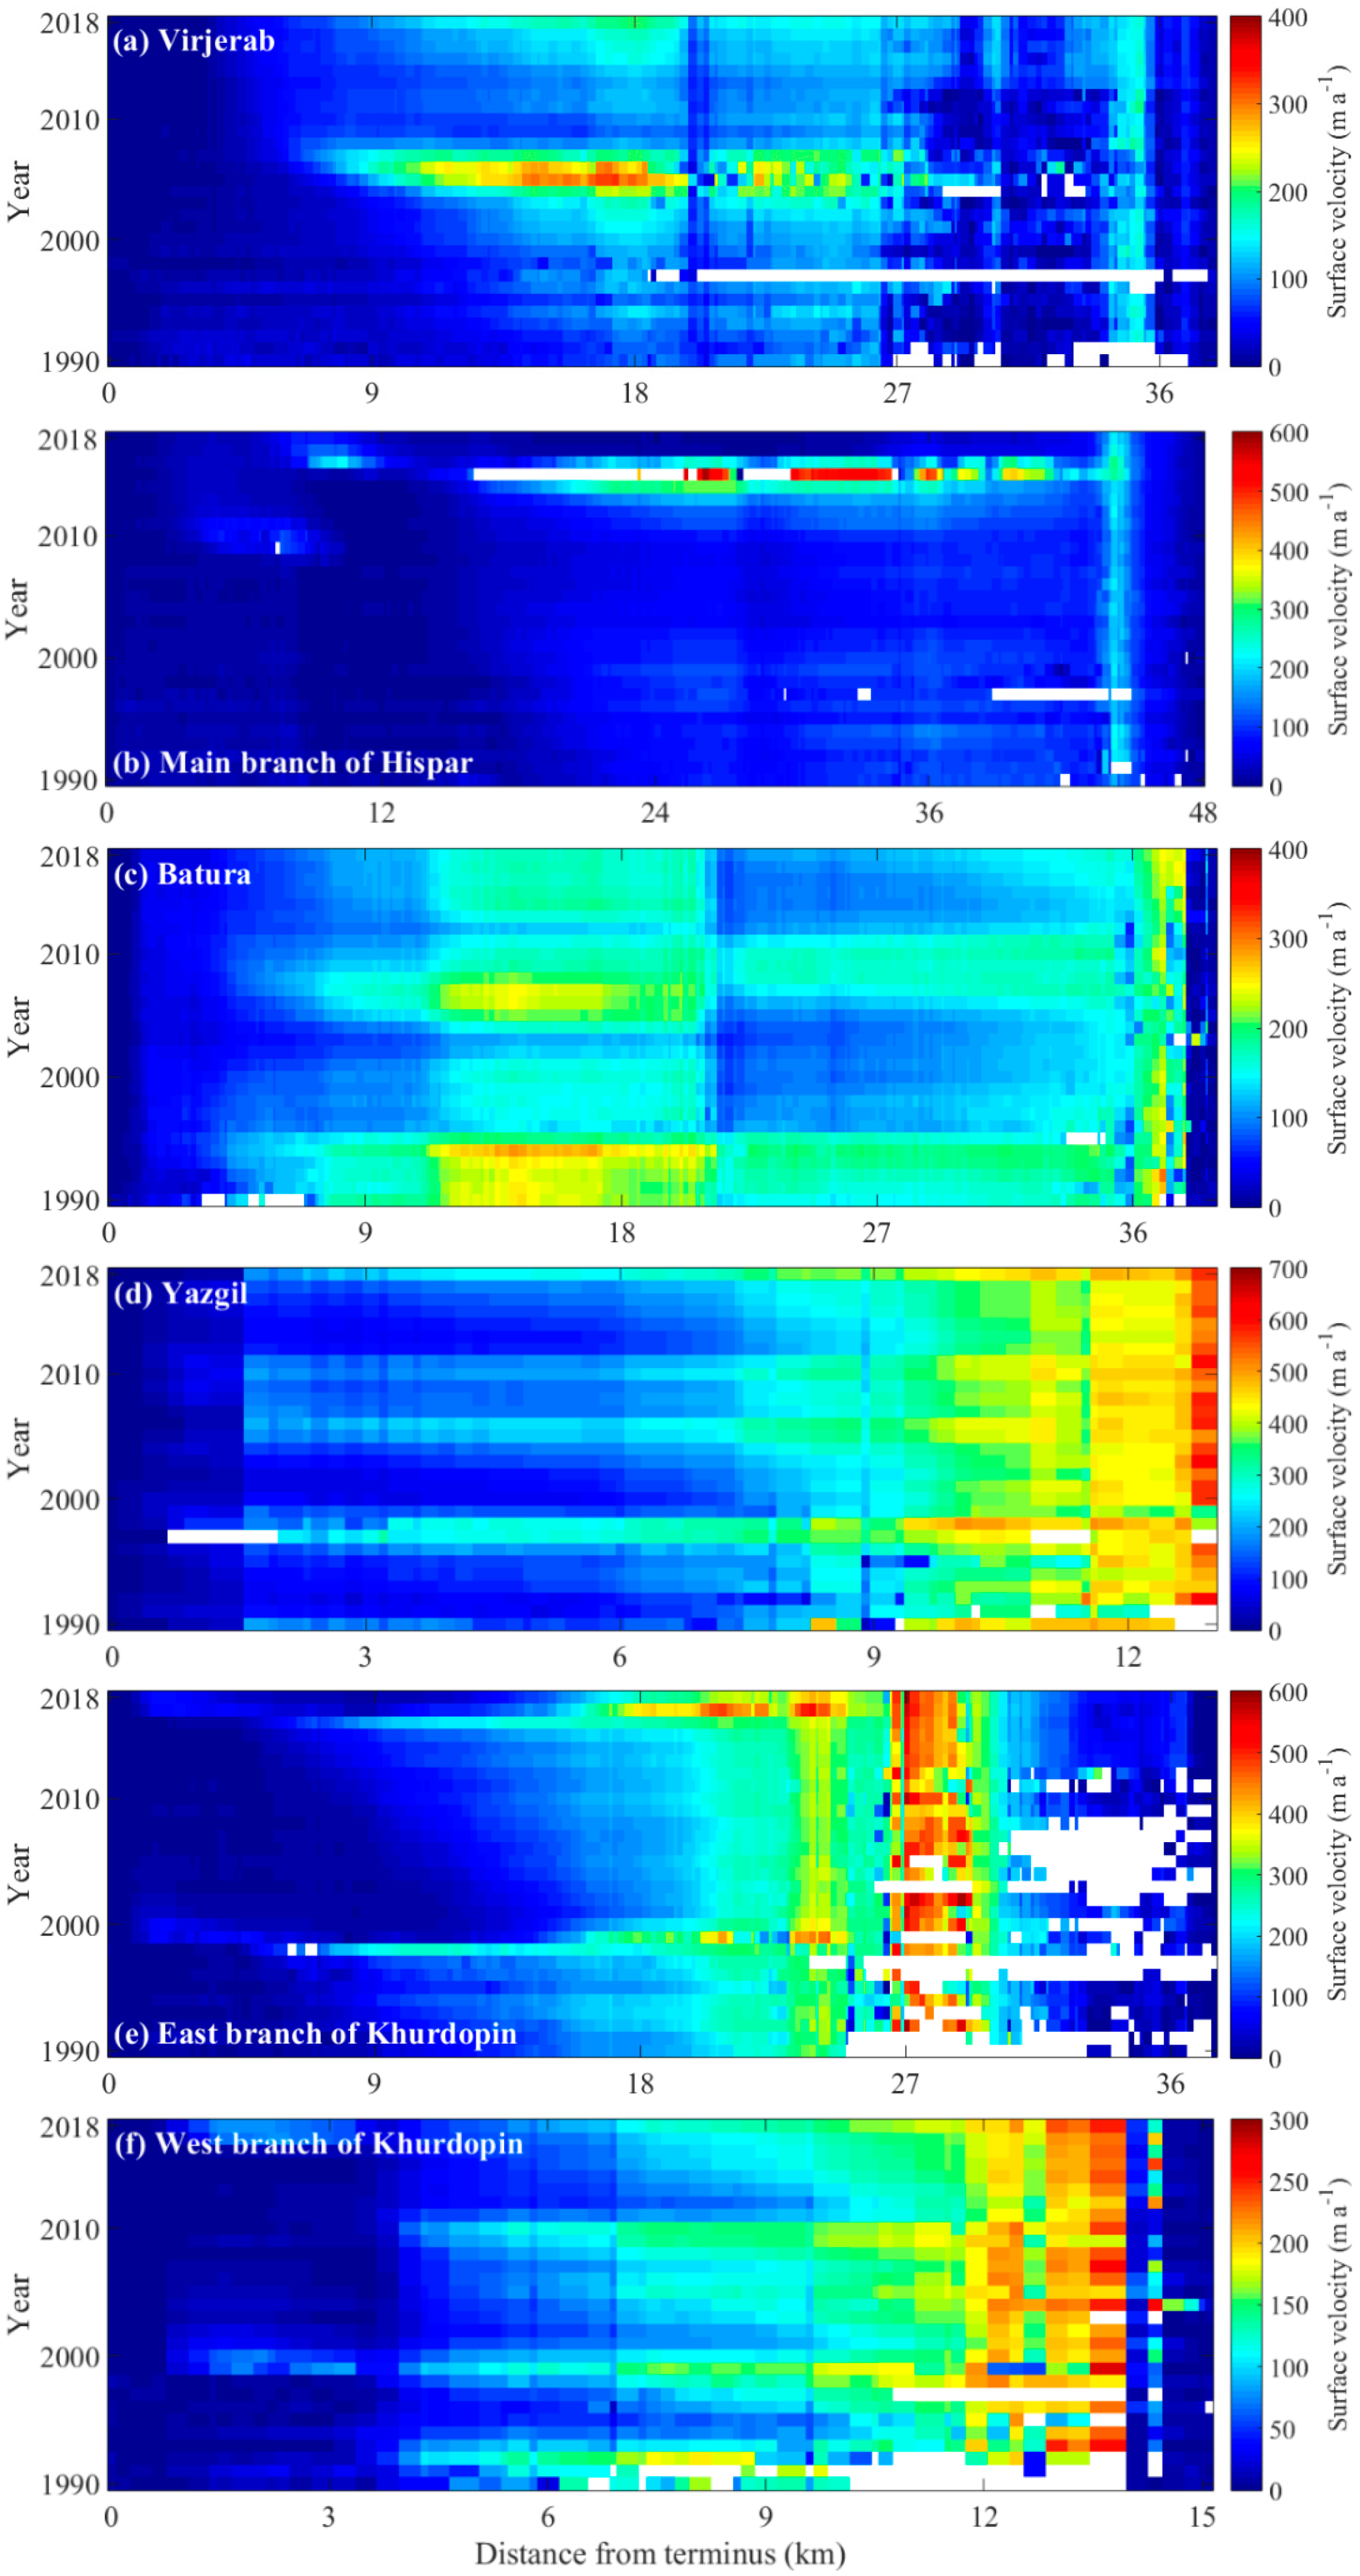
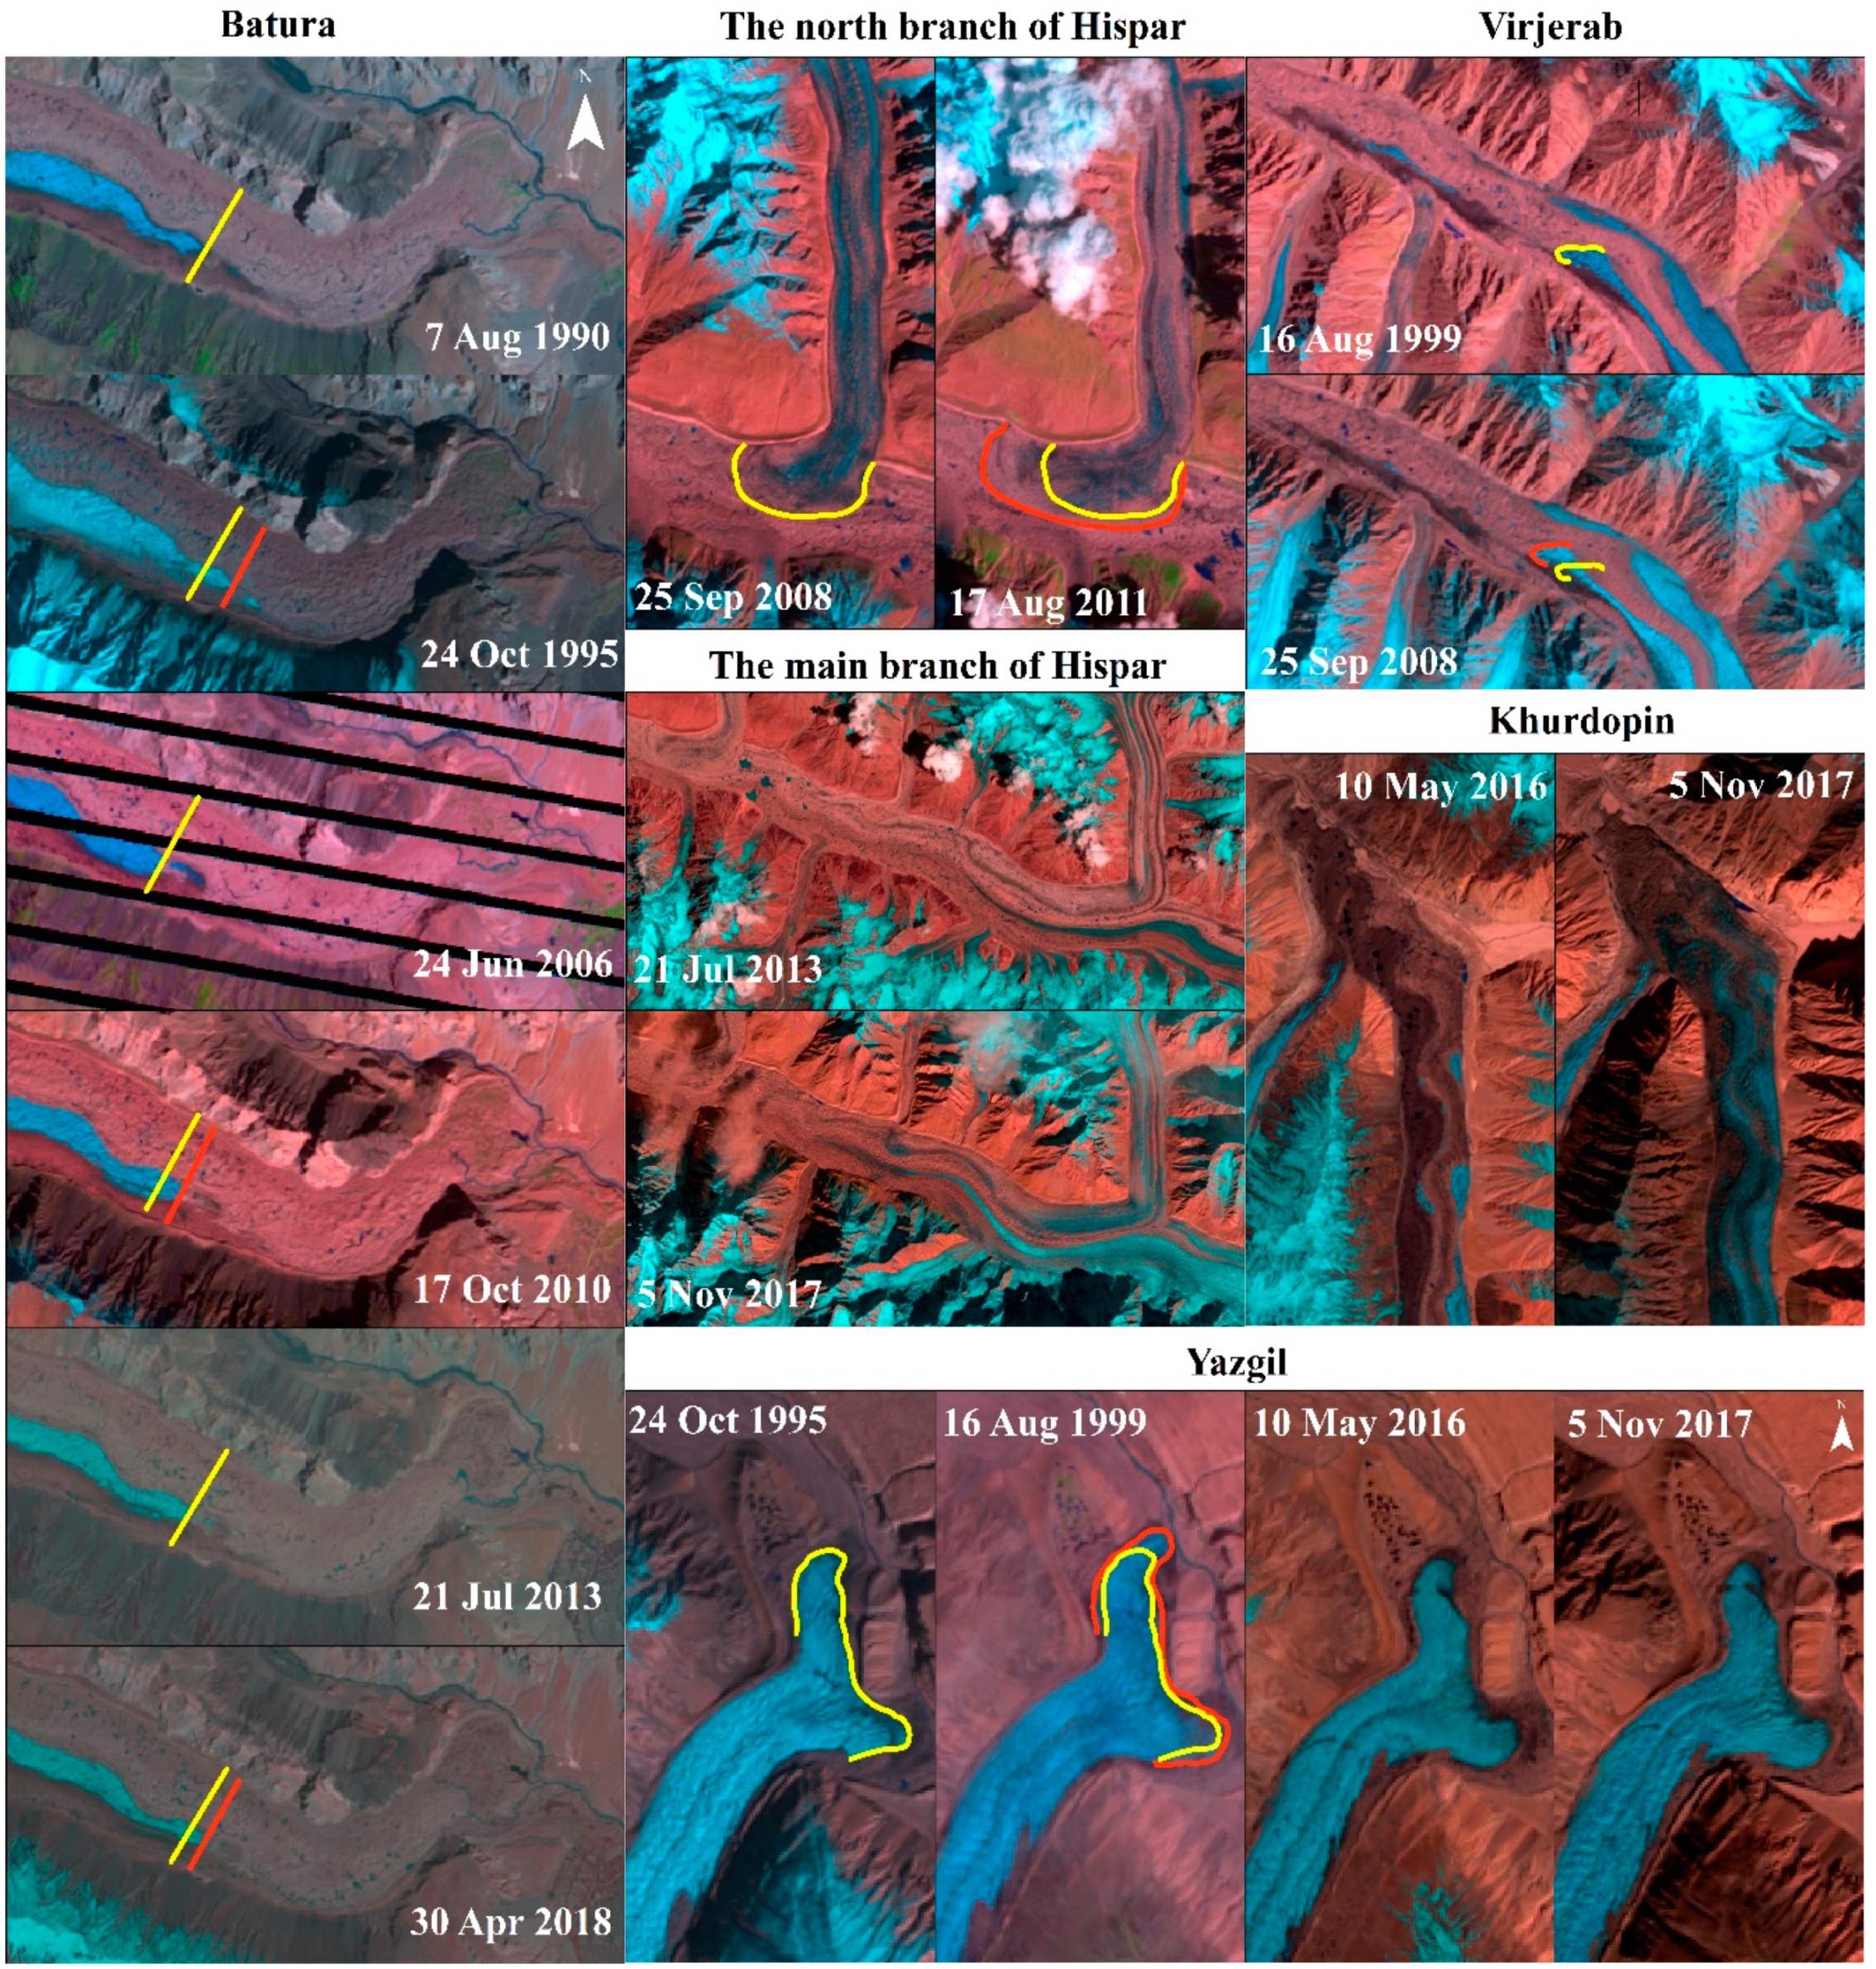
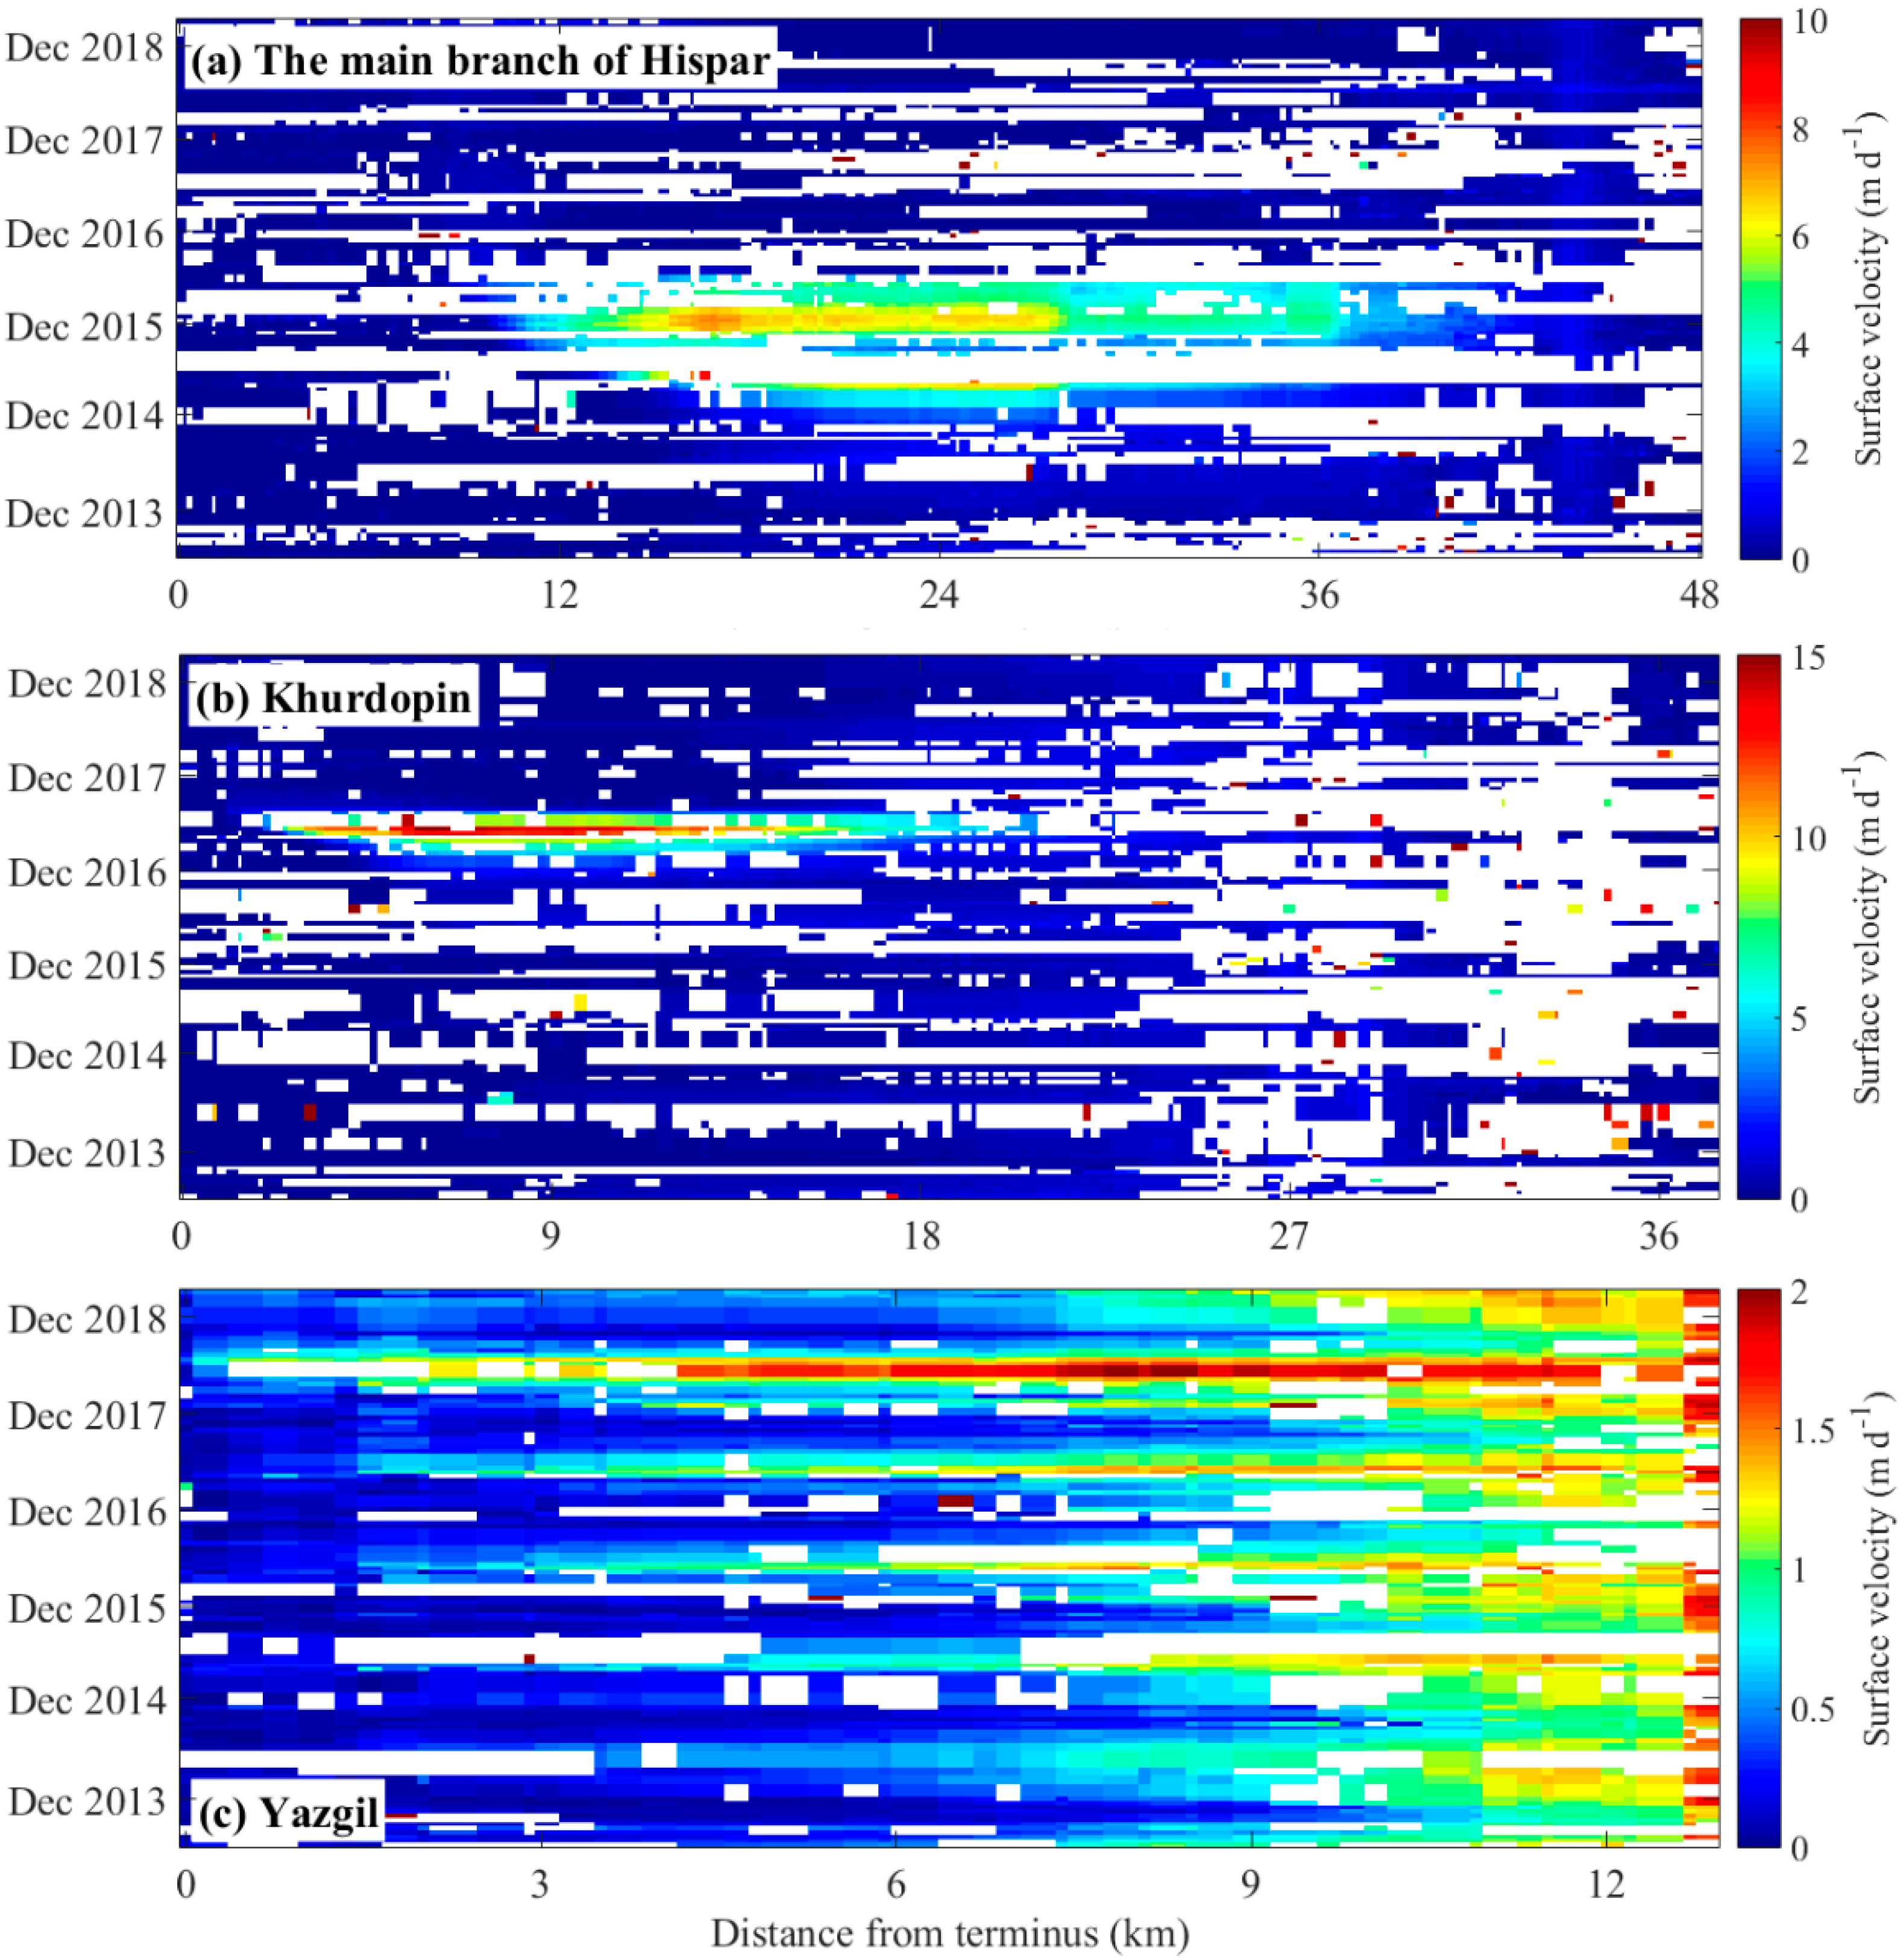
4.2. Surface Velocity
5. Discussion
5.1. Glacier Mass Balance
5.2. Glacier Surface Velocity
5.3. The Relationship between Mass Balance and Surface Velocity
5.4. Climatic Considerations
6. Conclusions
Author Contributions
Funding
Acknowledgments
Conflicts of Interest
References
- Immerzeel, W.W.; Lutz, A.F.; Andrade, M.; Bahl, A.; Biemans, H.; Bolch, T.; Hyde, S.; Brumby, S.; Davies, B.J.; Elmore, A.C.; et al. Importance and vulnerability of the world’s water towers. Nature 2020, 577, 364–369. [Google Scholar] [CrossRef] [PubMed]
- Yao, T.; Thompson, L.; Yang, W.; Yu, W.; Gao, Y.; Guo, X.; Yang, X.; Duan, K.; Zhao, H.; Xu, B.; et al. Different glacier status with atmospheric circulations in Tibetan Plateau and surroundings. Nat. Clim. Chang. 2012, 2, 663–667. [Google Scholar] [CrossRef]
- Gardner, A.; Moholdt, G.; Cogley, J.G.; Wouters, B.; Arendt, A.; Wahr, J.; Berthier, E.; Hock, R.; Pfeffer, W.T.; Kaser, G.; et al. A reconciled estimate of glacier contributions to sea level rise: 2003 to 2009. Science 2013, 340, 852–857. [Google Scholar] [CrossRef] [PubMed] [Green Version]
- Herreid, S.; Pellicciotti, F. The state of rock debris covering Earth’s glaciers. Nat. Geosci. 2020, 13, 621–627. [Google Scholar] [CrossRef]
- Kääb, A.; Leinss, S.; Gilbert, A.; Bühler, Y.; Gascoin, S.; Evans, S.G.; Bartelt, P.; Berthier, E.; Brun, F.; Chao, W.-A.; et al. Massive collapse of two glaciers in western Tibet in 2016 after surge-like instability. Nat. Geosci. 2018, 11, 114–120. [Google Scholar] [CrossRef] [Green Version]
- Shangguan, D.; Liu, S.; Ding, Y.; Guo, W.; Xu, B.; Xu, J.; Jiang, Z. Characterizing the May 2015 Karayaylak Glacier surge in the eastern Pamir Plateau using remote sensing. J. Glaciol. 2016, 62, 944–953. [Google Scholar] [CrossRef] [Green Version]
- Zhang, Z.; Liu, S.; Zhang, Y.; Wei, J.; Jiang, Z.; Kunpeng, W.U. Glacier variations at Aru Co in western Tibet from 1971 to 2016 derived from remote-sensing data. J. Glaciol. 2018, 64, 397–406. [Google Scholar] [CrossRef] [Green Version]
- Brun, F.; Berthier, E.; Wagnon, P.; Kaab, A.; Treichler, D. A spatially resolved estimate of High Mountain Asia glacier mass balances, 2000–2016. Nat. Geosci. 2017, 10, 668–673. [Google Scholar] [CrossRef]
- Gardelle, J.; Berthier, E.; Arnaud, Y.; Kaab, A. Region-wide glacier mass balances over the Pamir-Karakoram-Himalaya during 1999–2011. Cryosphere 2013, 7, 1885–1886. [Google Scholar] [CrossRef] [Green Version]
- Zhou, Y.; Li, Z.; Li, J.; Zhao, R.; Ding, X. Glacier mass balance in the Qinghai–Tibet Plateau and its surroundings from the mid-1970s to 2000 based on Hexagon KH-9 and SRTM DEMs. Remote Sens. Environ. 2018, 210, 96–112. [Google Scholar] [CrossRef]
- Scherler, D.; Bookhagen, B.; Strecker, M.R. Spatially variable response of Himalayan glaciers to climate change affected by debris cover. Nat. Geosci. 2011, 4, 156–159. [Google Scholar] [CrossRef]
- Wu, K.; Liu, S.; Jiang, Z.; Xu, J.; Wei, J.; Guo, W. Recent glacier mass balance and area changes in the Kangri Karpo Mountains from DEMs and glacier inventories. Cryosphere 2018, 12, 103–121. [Google Scholar] [CrossRef] [Green Version]
- Gardelle, J.; Berthier, E.; Arnaud, Y. Slight mass gain of Karakoram glaciers in the early twenty-first century. Nat. Geosci. 2012, 5, 322–325. [Google Scholar] [CrossRef]
- Quincey, D.J.; Braun, M.; Glasser, N.F.; Bishop, M.P.; Hewitt, K.; Luckman, A. Karakoram glacier surge dynamics. Geophys. Res. Lett. 2011, 38, 113–120. [Google Scholar] [CrossRef] [Green Version]
- Rowan, A.V.; Egholm, D.L.; Quincey, D.J.; Glasser, N.F. Modelling the feedbacks between mass balance, ice flow and debris transport to predict the response to climate change of debris-covered glaciers in the Himalaya. Earth Planet. Sci. Lett. 2015, 430, 427–438. [Google Scholar] [CrossRef] [Green Version]
- Cuffey, K.M.; Paterson, W.S.B. The Physics of Glaciers, 4th ed.; Butterworth-Heinemann: Burlington, MA, USA; Elsevier: Oxford, UK, 2010. [Google Scholar]
- Paul, F.; Bolch, T.; Kääb, A.; Nägler, T.; Nuth, C.; Scharrer, K.; Shepherd, A.; Strozzi, T.; Ticconi, F.; Bhambri, R.; et al. The glaciers climate change initiative: Methods for creating glacier area, elevation change and velocity products. Remote Sens. Environ. 2015, 162, 408–426. [Google Scholar] [CrossRef] [Green Version]
- Dehecq, A.; Gourmelen, N.; Gardner, A.; Brun, F.; Goldberg, D.; Nienow, P.W.; Berthier, E.; Vincent, C.; Wagnon, P.; Trouve, E. Twenty-first century glacier slowdown driven by mass loss in High Mountain Asia. Nat. Geosci. 2019, 12, 22–27. [Google Scholar] [CrossRef]
- Dehecq, A.; Gourmelen, N.; Trouve, E. Deriving large-scale glacier velocities from a complete satellite archive: Application to the Pamir–Karakoram–Himalaya. Remote Sens. Environ. 2015, 162, 55–66. [Google Scholar] [CrossRef] [Green Version]
- Quincey, D.J.; Glasser, N.F.; Cook, S.J.; Luckman, A. Heterogeneity in Karakoram glacier surges. J. Geophys. Res. Earth Surf. 2015, 120, 1288–1300. [Google Scholar] [CrossRef] [Green Version]
- Rankl, M.; Kienholz, C.; Braun, M. Glacier changes in the Karakoram region mapped by multimission satellite imagery. Cryosphere 2014, 8, 977–989. [Google Scholar] [CrossRef] [Green Version]
- Farinotti, D.; Immerzeel, W.W.; de Kok, R.J.; Quincey, D.J.; Dehecq, A. Manifestations and mechanisms of the Karakoram glacier Anomaly. Nat. Geosci. 2020, 13, 8–16. [Google Scholar] [CrossRef] [PubMed]
- Goudie, A. The geomorphology of the Hunza valley, Karakoram mountains, Pakistan. Int. Karakoram Proj. 1984, 2, 359–410. [Google Scholar]
- Qureshi, M.A.; Yi, C.L.; Xu, X.K.; Li, Y.K. Glacier status during the period 1973–2014 in the Hunza Basin, Western Karakoram. Quat. Int. 2017, 444, 125–136. [Google Scholar] [CrossRef]
- Immerzeel, W.W.; Pellicciotti, F.; Shrestha, A.B. Glaciers as a proxy to quantify the spatial distribution of precipitation in the Hunza basin. Mt. Res. Dev. 2012, 32, 30–39. [Google Scholar] [CrossRef]
- Young, G.; Hewitt, K. Hydrology research in the upper Indus basin, Karakoram Himalaya, Pakistan. IAHS Publ. 1990, 190, 139–152. [Google Scholar]
- Bookhagen, B.; Burbank, D.W. Toward a complete Himalayan hydrological budget: Spatiotemporal distribution of snowmelt and rainfall and their impact on river discharge. J. Geophys. Res. Earth Surf. 2010, 115, F03019. [Google Scholar] [CrossRef] [Green Version]
- Tahir, A.A.; Chevallier, P.; Arnaud, Y.; Ahmad, B. Snow cover dynamics and hydrological regime of the Hunza River basin, Karakoram Range, Northern Pakistan. Hydrol. Earth Syst. Sci. 2011, 15, 2275–2290. [Google Scholar] [CrossRef] [Green Version]
- Consortium, R. Randolph Glacier Inventory—A Dataset of Global Glacier Outlines: Version 6.0: Technical Report; Global Land Ice Measurements from Space: Boulder, CO, USA, 2017. [Google Scholar]
- Kääb, A.; Berthier, E.; Nuth, C.; Gardelle, J.; Arnaud, Y. Contrasting patterns of early twenty-first-century glacier mass change in the Himalayas. Nature 2012, 488, 495. [Google Scholar] [CrossRef]
- Hewitt, K. Tributary glacier surges: An exceptional concentration at Panmah Glacier, Karakoram Himalaya. J. Glaciol. 2007, 53, 181–188. [Google Scholar] [CrossRef] [Green Version]
- Rashid, I.; Abdullah, T.; Glasser, N.F.; Naz, H.; Romshoo, S.A. Surge of Hispar Glacier, Pakistan, between 2013 and 2017 detected from remote sensing observations. Geomorphology 2018, 303, 410–416. [Google Scholar] [CrossRef] [Green Version]
- Shah, A.; Ali, K.; Nizami, S.M.; Jan, I.U.; Hussain, I.; Begum, F. Risk assessment of Shishper Glacier, Hassanabad Hunza, North Pakistan. J. Himal. Earth Sci. 2019, 52, 1–11. [Google Scholar]
- Scherler, D.; Wulf, H.; Gorelick, N. Global Assessment of Supraglacial Debris-Cover Extents. Geophys. Res. Lett. 2018, 45, 11798–11805. [Google Scholar] [CrossRef] [Green Version]
- Housman, I.; Chastain, R.; Finco, M. An Evaluation of Forest Health Insect and Disease Survey Data and Satellite-Based Remote Sensing Forest Change Detection Methods: Case Studies in the United States. Remote Sens. 2018, 10, 1184. [Google Scholar] [CrossRef] [Green Version]
- Dozier, J. Spectral signature of alpine snow cover from the Landsat Thematic Mapper. Remote Sens. Environ. 1989, 28, 9–22. [Google Scholar] [CrossRef]
- Wu, K.-P.; Liu, S.-Y.; Guo, W.-Q.; Wei, J.-F.; Xu, J.-L.; Bao, W.-J.; Yao, X.-J. Glacier change in the western Nyainqentanglha Range, Tibetan Plateau using historical maps and Landsat imagery: 1970–2014. J. Mt. Sci. 2016, 13, 1358–1374. [Google Scholar] [CrossRef]
- Paul, F.; Bolch, T.; Briggs, K.; Kääb, A.; McMillan, M.; McNabb, R.W.; Nagler, T.; Nuth, C.; Rastner, P.; Strozzi, T.; et al. Error sources and guidelines for quality assessment of glacier area, elevation change, and velocity products derived from satellite data in the Glaciers_cci project. Remote Sens. Environ. 2017, 203, 256–275. [Google Scholar] [CrossRef] [Green Version]
- Guo, W.-Q.; Liu, S.-Y.; Xu, J.; Wu, L.; Shangguan, D.; Yao, X.; Wei, J.; Bao, W.; Yu, P.; Liu, Q.; et al. The second Chinese glacier inventory: Data, methods and results. J. Glaciol. 2015, 61, 357–372. [Google Scholar] [CrossRef] [Green Version]
- Krieger, G.; Moreira, A.; Fiedler, H.; Hajnsek, I. TanDEM-X: A Satellite Formation for High-Resolution SAR Interferometry. IEEE Trans. Geosci. Remote Sens. 2007, 45, 3317–3341. [Google Scholar] [CrossRef] [Green Version]
- Li, G.; Lin, H.; Ye, Q. Heterogeneous decadal glacier downwasting at the Mt. Everest (Qomolangma) from 2000 to~ 2012 based on multi-baseline bistatic SAR interferometry. Remote Sens. Environ. 2018, 206, 336–349. [Google Scholar] [CrossRef]
- Neckel, N.; Braun, A.; Kropáček, J.; Hochschild, V. Recent mass balance of the Purogangri Ice Cap, central Tibetan Plateau, by means of differential X-band SAR interferometry. Cryosphere 2013, 7, 1623–1633. [Google Scholar] [CrossRef] [Green Version]
- Wu, K.; Liu, S.; Jiang, Z.; Xu, J.; Wei, J. Glacier mass balance over the central Nyainqentanglha Range during recent decades derived from remote-sensing data. J. Glaciol. 2019, 65, 422–439. [Google Scholar] [CrossRef] [Green Version]
- Melanie, R.; Matthias, B. Glacier elevation and mass changes over the central Karakoram region estimated from TanDEM-X and SRTM/X-SAR digital elevation models. Ann. Glaciol. 2016, 51, 273–281. [Google Scholar]
- Goldstein, R.M.; Werner, C.L. Radar interferogram filtering for geophysical applications. Geophys. Res. Lett. 1998, 25, 4035–4038. [Google Scholar] [CrossRef] [Green Version]
- Lin, H.; Li, G.; Cuo, L.; Andrew, H.; Ye, Q. A decreasing glacier mass balance gradient from the edge of the Upper Tarim Basin to the Karakoram during 2000–2014. Sci. Rep. 2017, 7, 1–9. [Google Scholar] [CrossRef]
- Neckel, N.; Loibl, D.; Rankl, M. Recent slowdown and thinning of debris-covered glaciers in south-eastern Tibet. Earth Planet. Sci. Lett. 2017, 464, 95–102. [Google Scholar] [CrossRef] [Green Version]
- Rignot, E.; Echelmeyer, K.; Krabill, W. Penetration depth of interferometric synthetic-aperture radar signals in snow and ice. Geophys. Res. Lett. 2001, 28, 3501–3504. [Google Scholar] [CrossRef] [Green Version]
- Huss, M. Density assumptions for converting geodetic glacier volume change to mass change. Cryosphere 2013, 7, 877–887. [Google Scholar] [CrossRef] [Green Version]
- Gardner, A.S.; Fahnstock, M.; Scambos, T. ITS_LIVE Regional Glacier and Ice Sheet Surface Velocities; Data archived at National Snow and Ice Data Center, 2019. Available online: https://its-live.jpl.nasa.gov/ (accessed on 6 August 2020).
- Gardner, A.S.; Moholdt, G.; Scambos, T.; Fahnstock, M.; Ligtenberg, S.; van den Broeke, M.; Nilsson, J. Increased West Antarctic and unchanged East Antarctic ice discharge over the last 7 years. Cryosphere 2018, 12, 521–547. [Google Scholar] [CrossRef] [Green Version]
- Leprince, S.; Barbot, S.; Ayoub, F.; Avouac, J.-P. Automatic and Precise Orthorectification, Coregistration, and Subpixel Correlation of Satellite Images, Application to Ground Deformation Measurements. IEEE Trans. Geosci. Remote Sens. 2007, 45, 1529–1558. [Google Scholar] [CrossRef] [Green Version]
- Heid, T.; Kääb, A. Repeat optical satellite images reveal widespread and long term decrease in land-terminating glacier speeds. Cryosphere 2012, 6, 467–478. [Google Scholar] [CrossRef] [Green Version]
- Lv, M.; Guo, H.; Lu, X.; Liu, G.; Yan, S.; Ruan, Z.; Ding, Y.; Quincey, D.J. Characterizing the behaviour of surge-and non-surge-type glaciers in the Kingata Mountains, eastern Pamir, from 1999 to 2016. Cryosphere 2019, 13, 219–236. [Google Scholar] [CrossRef] [Green Version]
- Scherler, D.; Leprince, S.; Strecker, M.R. Glacier-surface velocities in alpine terrain from optical satellite imagery—Accuracy improvement and quality assessment. Remote Sens. Environ. 2008, 112, 3806–3819. [Google Scholar] [CrossRef]
- Reid, T.D.; Brock, B.W. Assessing ice-cliff backwasting and its contribution to total ablation of debris-covered Miage glacier, Mont Blanc massif, Italy. J. Glaciol. 2014, 60, 3–13. [Google Scholar] [CrossRef] [Green Version]
- Björnsson, H. Hydrological characteristics of the drainage system beneath a surging glacier. Nature 1998, 395, 771. [Google Scholar] [CrossRef]
- Raymond, C.F. How do glaciers surge? A review. J. Geophys. Res. Solid Earth 1987, 92, 9121–9134. [Google Scholar] [CrossRef]
- Clarke, G.K.C. Fast glacier flow: Ice streams, surging, and tidewater glaciers. J. Geophys. Res. Solid Earth 1987, 92, 8835–8841. [Google Scholar] [CrossRef]
- Benn, D.I.; Bolch, T.; Hands, K.; Gulley, J.; Luckman, A.; Nicholson, L.; Quincey, D.; Thompson, S.; Toumi, R.; Wiseman, S. Response of debris-covered glaciers in the Mount Everest region to recent warming, and implications for outburst flood hazards. Earth Sci. Rev. 2012, 114, 156–174. [Google Scholar] [CrossRef] [Green Version]
- Quincey, D.J.; Luckman, A.; Benn, D. Quantification of Everest region glacier velocities between 1992 and 2002, using satellite radar interferometry and feature tracking. J. Glaciol. 2009, 55, 596–606. [Google Scholar] [CrossRef] [Green Version]
- Fowler, H.; Archer, D. Conflicting signals of climatic change in the Upper Indus Basin. J. Clim. 2006, 19, 4276–4293. [Google Scholar] [CrossRef] [Green Version]
- Harris, I.; Jones, P.D.; Osborn, T.J.; Lister, D.H. Updated high-resolution grids of monthly climatic observations—The CRU TS3.10 Dataset. Int. J. Climatol. 2014, 34, 623–642. [Google Scholar] [CrossRef] [Green Version]
- IPCC. Climate Change 2013: The Physical Science Basis. Contribution of Working Group I to the Fifth Assessment Report of the Intergovernmental Panel on Climate Change; Cambridge University Press: Cambridge, UK; New York, NY, USA, 2013. [Google Scholar]


| Acquisition Date | Mission | Path/Row | Pixel Size (m) | Application |
|---|---|---|---|---|
| 11–22 February 2000 | SRTM C-band | - | 30 | Estimation of glacier elevation change |
| 24 July 2014 | Landsat OLI | 149/35 | 15 | Glacier identification for 2014 |
| 17 October 2012 22 February 2013 5 March 2013 28 November 2013 2 March 2014N 2 March 2014S 13 March 2014 | TSX/TDX | - | 12 | Estimation of glacier elevation change |
| March 2013–December 2018 | Landsat OLI | 149/35 | 15 | Estimation of glacier surface velocity |
| Acquisition Date | Orbit | Orbital Pass | Effective Perpendicular Baseline (m) | Master Satellite |
|---|---|---|---|---|
| 28 November 2013 | 113 | Descending | 161 | TSX |
| 17 October 2012 | 113 | Descending | 151 | TSX |
| 5 March 2013 | 7 | Ascending | 110 | TSX |
| 22 February 2013 | 7 | Ascending | 117 | TSX |
| 13 March 2014 | 151 | Descending | 155 | TSX |
| 2 March 2014N | 151 | Descending | 143 | TDX |
| 2 March 2014S | 151 | Descending | 143 | TDX |
| Region/Glacier Name | Glacier Area (km2) | Mean ΔH (m) | Mass Balance (m w.e. a−1) |
|---|---|---|---|
| Kukki Jerab | 41.1 | −1.58 ± 0.07 | −0.12 ± 0.02 |
| Batura * | 311.4 | −3.14 ± 0.07 | −0.24 ± 0.02 |
| Pasu | 62.1 | −1.98± 0.07 | −0.14 ± 0.02 |
| Ghulkin | 30.5 | −3.75 ± 0.07 | −0.27 ± 0.02 |
| Lupghar Yaz | 16.9 | −1.58± 0.07 | −0.11± 0.02 |
| Momhil | 73.2 | 1.81 ± 0.07 | 0.13 ± 0.02 |
| Yazgil * | 133.7 | 3.44 ± 0.07 | 0.24 ± 0.02 |
| Khurdopin * | 203.2 | 3.27 ± 0.07 | 0.23 ± 0.02 |
| Virjerab * | 167.3 | 1.20 ± 0.07 | 0.08 ± 0.02 |
| Hispar * | 495.3 | −0.27 ± 0.07 | −0.02 ± 0.02 |
| Gharesa * | 77.9 | −2.19 ± 0.07 | −0.16 ± 0.02 |
| Barpu | 105.0 | −2.64± 0.07 | −0.19± 0.02 |
| Minapin | 56.0 | −3.88 ± 0.07 | −0.27 ± 0.02 |
| Hasanabad * | 87.9 | 1.23 ± 0.07 | 0.09 ± 0.02 |
| Baltar | 91.1 | −0.92 ± 0.07 | −0.07 ± 0.02 |
| Surge glaciers | 1623.9 | −0.78 ± 0.07 | 0.06 ± 0.02 |
| Non-surge glaciers | 1254.3 | −0.40 ± 0.07 | −0.03 ± 0.02 |
| Debris-covered region | 514.0 | −5.39 ± 0.07 | −0.38 ± 0.02 |
| Clean-ice region | 2364.2 | 0.05 ± 0.07 | 0.01 ± 0.02 |
| Below 5100 m a.s.l. | 1342.7 | −3.01 ± 0.07 | −0.21 ± 0.02 |
| Above 5100 m a.s.l. | 1535.0 | 1.50 ± 0.07 | 0.11 ± 0.02 |
| Total | 2878.2 | −0.61 ± 0.07 | −0.04 ± 0.02 |
| Glacier Name | Area (km2) | Debris Cover (%) | Max/Min Elevation (m) | Median Elevation (m) | Max Length (km) | Mean Slope (Degree) | Mean Aspect (Degree) |
|---|---|---|---|---|---|---|---|
| Non-surging | |||||||
| Kukki Jerab | 41.1 | 39.1 | 6828/3597 | 4769 | 19.994 | 24.3 | 0 |
| Pasu | 62.1 | 2.9 | 7487/2578 | 5095 | 23.651 | 24.4 | 74 |
| Ghulkin | 30.5 | 17.9 | 7295/2556 | 5364 | 17.099 | 29.1 | 70 |
| Lupghar Yaz | 16.9 | 35.1 | 7157/3446 | 5175 | 15.288 | 25.9 | 360 |
| Momhil | 73.2 | 19.1 | 7506/2881 | 5630 | 30.252 | 29.3 | 7 |
| Mulungutti | 97.7 | 5.9 | 7799/2911 | 5664 | 23.889 | 26.9 | 8 |
| Barpu | 105.0 | 15.8 | 7432/2810 | 5093 | 29.588 | 22.3 | 4 |
| Minapin | 56.0 | 8.2 | 7178/2541 | 4346 | 18.834 | 26.7 | 359 |
| Baltar | 91.1 | 25.9 | 7688/3005 | 4898 | 20.516 | 31.2 | 246 |
| Surging | |||||||
| Batura * | 311.4 | 22.2 | 7725/2595 | 4932 | 59.662 | 25 | 63 |
| Yazgil * | 133.7 | 6.2 | 7709/3234 | 5910 | 31.403 | 24.4 | 34 |
| Khurdopin * | 203.2 | 16.0 | 7718/3314 | 5391 | 31.640 | 23.6 | 21 |
| Virjerab * | 167.3 | 16.3 | 6368/3592 | 5241 | 40.178 | 23.1 | 11 |
| Hispar * | 495.3 | 28.0 | 7794/3110 | 4854 | 54.453 | 23.3 | 252 |
| Gharesa * | 77.9 | 13.4 | 7523/3825 | 5542 | 21.541 | 28.7 | 241 |
| Hasanabad * | 87.9 | 17.7 | 7737/2626 | 5084 | 21.070 | 32.2 | 164 |
| Glacier Name | Evidence of Surge Events | Surge Initiating Year | Surge Terminating Year | Surge Duration |
|---|---|---|---|---|
| Batura | Clear acceleration and deceleration in velocity profiles; surface features show clear movement. | 1990 | 1995 | 5 |
| 2005 | 2010 | 5 | ||
| 2013 | 2018 | 5 | ||
| Yazgil | Clear acceleration and deceleration in velocity profiles; surface features show clear movement; looped moraines; terminus advanced during 1997–1998. | 1997 | 1998 | 2 |
| 2005 | 2006 | 2 | ||
| 2010 | 2011 | 2 | ||
| 2018 | ||||
| Khurdopin (east branch) | Clear acceleration and deceleration in velocity profiles; surface features show clear movement; looped moraines; disappearance of glacial ponds. | 1998 | 1999 | 2 |
| 2016 | 2018 | 3 | ||
| Khurdopin (west branch) | Clear acceleration and deceleration in velocity profiles; looped moraines. | 1990 | 1992 | 3 |
| 1998 | 2000 | 3 | ||
| 2008 | 2010 | 3 | ||
| 2017 | 2018 | 2 | ||
| Virjerab | Clear acceleration and deceleration in velocity profiles; surface features show clear movement. | 2004 | 2007 | 4 |
| 2018 | ||||
| Hispar (main branch) | Clear acceleration and deceleration in velocity profiles; surface features show clear movement; disappearance of glacial ponds. | 2014 | 2016 | 3 |
| Hispar (north branch) | Clear acceleration and deceleration in velocity profiles; surface features show clear movement; a clear surge front in satellite image. | 2009 | 2011 | 3 |
| Gharesa | Clear acceleration and deceleration in velocity profiles. | 1995 | 1997 | 3 |
| 2001 | 2003 | 3 | ||
| 2015 | 2015 | 1 | ||
| Hasanabad | Clear acceleration and deceleration in velocity profiles. | 1995 | 1997 | 3 |
| 2014 | 2016 | 3 |
© 2020 by the authors. Licensee MDPI, Basel, Switzerland. This article is an open access article distributed under the terms and conditions of the Creative Commons Attribution (CC BY) license (http://creativecommons.org/licenses/by/4.0/).
Share and Cite
Wu, K.; Liu, S.; Jiang, Z.; Zhu, Y.; Xie, F.; Gao, Y.; Yi, Y.; Tahir, A.A.; Muhammad, S. Surging Dynamics of Glaciers in the Hunza Valley under an Equilibrium Mass State since 1990. Remote Sens. 2020, 12, 2922. https://doi.org/10.3390/rs12182922
Wu K, Liu S, Jiang Z, Zhu Y, Xie F, Gao Y, Yi Y, Tahir AA, Muhammad S. Surging Dynamics of Glaciers in the Hunza Valley under an Equilibrium Mass State since 1990. Remote Sensing. 2020; 12(18):2922. https://doi.org/10.3390/rs12182922
Chicago/Turabian StyleWu, Kunpeng, Shiyin Liu, Zongli Jiang, Yu Zhu, Fuming Xie, Yongpeng Gao, Ying Yi, Adnan Ahmad Tahir, and Saifullah Muhammad. 2020. "Surging Dynamics of Glaciers in the Hunza Valley under an Equilibrium Mass State since 1990" Remote Sensing 12, no. 18: 2922. https://doi.org/10.3390/rs12182922