Article

Trends in Long-Term Drought Changes in the Mekong River Delta of Vietnam

1
Department of Physics, International University, VNU-HCM, Linh Trung Ward, Thu Duc District, Ho Chi Minh City 71308, Vietnam
2
Department of Geomatics Engineering, University of Technology, VNU-HCM, Ward 14, District 10, Ho Chi Minh City 72506, Vietnam
3
Department of Water Resource, ITC, University of Twente, Hengelosestraat 99, 7514 AE Enschede, The Netherlands
*
Author to whom correspondence should be addressed.
Remote Sens. 2020, 12(18), 2974; https://doi.org/10.3390/rs12182974
Submission received: 15 July 2020 / Revised: 3 September 2020 / Accepted: 7 September 2020 / Published: 12 September 2020

Abstract

:
In recent years, short droughts in the dry season have occurred more frequently and caused serious damages to agriculture and human living in the Mekong River Delta of Vietnam (MRD). The paper attempts to quantify the trends of drought changes in the dry seasons from 2001 to 2015 in the region, using daily MODIS MOD09GQ and MOD11A1 data products. Here, we exploit the Temperature Vegetation Dryness Index (TVDI) to assess levels of droughts. For each image-acquisition time, the TVDI image is computed, based on the Normalized Difference Vegetation Index (NDVI), derived from red and near infrared reflectance data, and the Land Surface Temperature (LST), derived from thermal infrared data. Subsequently, a spatiotemporal pattern of drought changes is estimated, based on mean TVDI values of the dry seasons during the observed period, by a linear regression. As a result, the state of drought in the dry seasons in the MRD has mostly been at light and moderate levels, occupying approximately 62% and 34% of the total area. Several sub-areas in the center have an increased trend of drought change, occupying approximately 12.5% of the total area, because impervious surface areas increase, e.g., the obvious land use change, from forest land and land for cultivation for perennial trees being strongly converted to built-up land for residence and public transportation. Meanwhile, several sub-areas in the coastal regions have a negative trend of drought change because water and absorbent surface areas increase, e.g., most of land for cultivation for perennial trees has been converted to aquaculture land. These cases usually occur in and surrounding forest and wet land, also occupying approximately 12.5% of the total area.

Graphical Abstract

1. Introduction

Drought is a natural phenomenon that seriously affects agricultural production and human living. Recently droughts occur in many countries or regions with significant impacts and increase in frequency, severity, and duration [1,2,3]. According to the National Oceanic and Atmospheric Administration (NOAA), global drought area reached its highest level in 2015 to 2016 during the last decades [2]. In the past, drought is driven by natural variation in seasonal or annual precipitation, so the risk of drought is expected to grow due to reduced precipitation and higher temperature [4]. In recent years, the severity of a drought event can be affected by human-induced climate change in combination with natural variations [4,5]. Additionally, increased heating from global warming is considered to set droughts occurring quicker and more intense [4,5,6]. Therefore, monitoring and assessing drought events is an actual challenge worldwide.
The American Meteorological Society (1997) categorizes drought in four types: meteorological, agricultural, hydrological, and socio-economic [7,8,9,10]. The first three types deal with ways to measure drought as a physical phenomenon while the last deals with drought through the effects of water shortage to socio-economic systems. During the late 20th century and the early 21st century, a number of different drought indices were developed in fields of meteorology, hydrology, agriculture, remote sensing, and water resources management [8,9,10,11]. These indices include the Standardized Precipitation Index (SPI), the Standardized Precipitation Evapotranspiration Index (SPEI), the Reconnaissance Drought Index (RDI), the Palmer Drought Severity Index (PDSI), etc., which can be computed by in situ measurements from meteorological ground stations; and the Vegetation Condition Index (VCI), the Temperature Condition Index (TCI), the Vegetation Health Index (VHI), etc., which can be derived from optical and thermal satellite images. In addition, hydrologic drought indices were also defined, e.g., the Surface Water Supply Index (SWSI), the Standardized Water Level Index (SWI), the Streamflow Drought Index (SDI), etc., which can be derived from available historical records of reservoir storage, streamflow, snow pack, and precipitation [9,10,11,12,13]. The in-situ measurement is the most accurate method for drought monitoring, but it is at high cost and it is difficult to set up a ground station network to cover a remote and large area. Meanwhile remote sensing-based drought indices, derived from daily global satellite datasets of precipitation, surface temperature and vegetation, are more effective for areal drought monitoring and assessment [14]. For example, a significant negative relationship between Normalized Difference Vegetation Index (NDVI) and Land Surface Temperature (LST) was found and a new index for drought monitoring was developed, called the Vegetation Supply Water Index (VSWI) [15,16]. The NDVI-LST space has been used to study drought cases with full vegetation cover and different evapotranspiration conditions [17,18]. Another comprehensive drought index, called the Temperature Vegetation Dryness Index (TVDI), can be calculated relatively simple and fast based on NDVI from red and near infrared band images and LST from thermal band images [19]. As a result, by exploiting available NOAA/AVHRR, Terra & Aqua/MODIS, Landsat, and Sentinel-3 satellite data as well as optical and thermal high-resolution airborne data, TVDI has been employed in many researches in drought monitoring in agriculture [20,21,22,23,24], assessing drought impacts on ecosystems [25,26,27], and estimating surface moisture [28,29,30,31,32,33,34,35]. Nevertheless, TVDI is usually used in comparatively small regions. Therefore, for vast, complicated climate and terrain regions, TVDI is improved or modified by the difference between LST in the day and night, the relationship between vegetation index and evapotranspiration, or the representative of surface moisture content [36,37,38,39]. Moreover, TVDI is employed in the analysis of temporal-spatial pattern of drought effectively [40,41,42].
This paper focuses on a trend analysis of long-term drought changes in the dry season from 2001 to 2015 in the Mekong River Delta (MRD) of Vietnam, using TVDIs derived from daily MODIS data products. The dry season in the MRD annually occurs from December to consecutive April, but in this study the data collection is from 1 January to 30 April. This region is the lowest part of the Mekong River Basin, as shown in Figure 1. The MRD has a fairly flat terrain and a complex channel network. Annually, the region produces about 50% of the total amount of food in Vietnam and ensures food security and livelihoods for approximately 70% of the region’s population [43]. Additionally, agricultural products of the MRD are also exported to the international market. However, during the last decades, drought events have occurred more frequently and seriously in the dry seasons and caused varying degrees of damage to agriculture, fisheries, and the livelihoods of people in the region, especially the severe drought in 2015–2016 [44,45,46]. Moreover, by using climate models on meteorological historical data and future projections, a widespread increase in droughts in the Lower Mekong River Basin, including the MRD, has been predicted [47,48,49]. This study aims to derive a spatial pattern and temporal distribution of drought changes in the MRD in the dry seasons between 2001 and 2015. The result is expected to provide important information for drought warning and irrigation scheduling in the region.

2. Materials and Methods

In this section, we firstly introduce the study area, the MRD. Secondly, we describe MODIS input data, including MOD09GQ and MOD021KM products. Then, we conduct a data processing to compute TVDI values. Finally, a trend analysis of TVDI changes in the dry seasons between 2001 and 2015 are estimated for exploring drought changes in the MRD.

2.1. Study Area

The MRD is located in the southwestern part of Vietnam and is the ending part of the Mekong River Basin, as shown in Figure 1. It borders to Cambodia in the north and northwest, Gulf of Thailand in the west and southwest, and the South China Sea in the east and southeast. It occupies the total area of 40,816 km2 [43]. Except for a mountainous area in the north, consisting of seven discontinuous mountains with the highest 705 m peak above sea level and the slope of more than 25 degrees, belonging to the two Tinh Bien and Tri Ton districts of the An Giang Province, the region has rather flat terrain and is at low altitude above sea level.
The climate in the MRD is tropical, hot, and humid, and dominated by the Asian monsoons. According to General Statistics Office of Vietnam [43], its mean daily temperature is variable through the year from 24 °C to 29 °C, while in a year the highest temperature is about 36.3 °C and the lowest is in the order of 18.0 °C. The sunshine hours range from about 2000 to 2500 h per year, occurring much more frequently in the dry season than in the wet season. The MRD has an annual rainfall of more than 2000 mm, but heavy showers regularly occur during the wet season. For example, at the Ca Mau meteorological station from 2002 to 2015, the monthly averages of air temperature, sunshine hour, and precipitation are about 27.3 °C, 210 h, and 40 mm in the dry season, respectively, while those are about 27.8 °C, 155 h, and 300 mm in the wet season [43]. Additionally, a no or very low precipitation between January and March normally occurs over the MRD, also see Section 4.1 for an analysis of precipitation at the Can Tho and Dong Thap meteorological stations. Therefore, the significant character of the MRD is that drought and salinity intrusion normally appear in the dry season while flooding mostly occurs in the wet season. Nevertheless, it has a naturally suitable condition for agricultural cultivation and aquaculture, with approximately 26,000 km2 of the total area as agricultural production land, corresponding to 65% of the total area of the region. The main water sources of irrigation are from the channel network and rainfall. Annually, it has contributed up to 55% of total production of paddy and 70% of total production of aquaculture. Therefore, the MRD plays an important role in the agricultural sector and food security of Vietnam.

2.2. Data Preparation

Main data used to compute TVDI are derived from the MOD09GQ and MOD021KM data products. The USGS provide these data products free of charge. MOD09GQ provides MODIS band 1–2 daily surface reflectance at 250 m resolution [50,51], where band1 covers a spectral range of 0.62–0.67 μm and band2 of 0.84–0.87 μm. These reflective data are used to compute NDVI. MOD021KM provides MODIS band 31–32 daily thermal emission at 1 km resolution [52,53]. These emissive data are used to compute LST. The observed period is in the dry season, from January to April, between 2001 and 2015. To cover the MRD, we need two scenes at the locations of ‘h28v07’ and ‘h28v08’. The couples of the two scenes were captured nearly at the same time. The images are referenced to the sinusoidal datum and stored in the hdf format. In this study, the collected data include 315 image couples in case of less than 10% of cloud cover during the observed period. Accordingly, the two scenes of image are merged to cover the whole region. Then, bands 1, 2, 31, and 32 are combined to store into one file. Moreover, the image dataset is converted to the WGS84 geographic coordinate system from the Sinusoidal datum. Eventually, the images are clipped keeping interior to the boundary of the MRD.

2.3. Data Processing
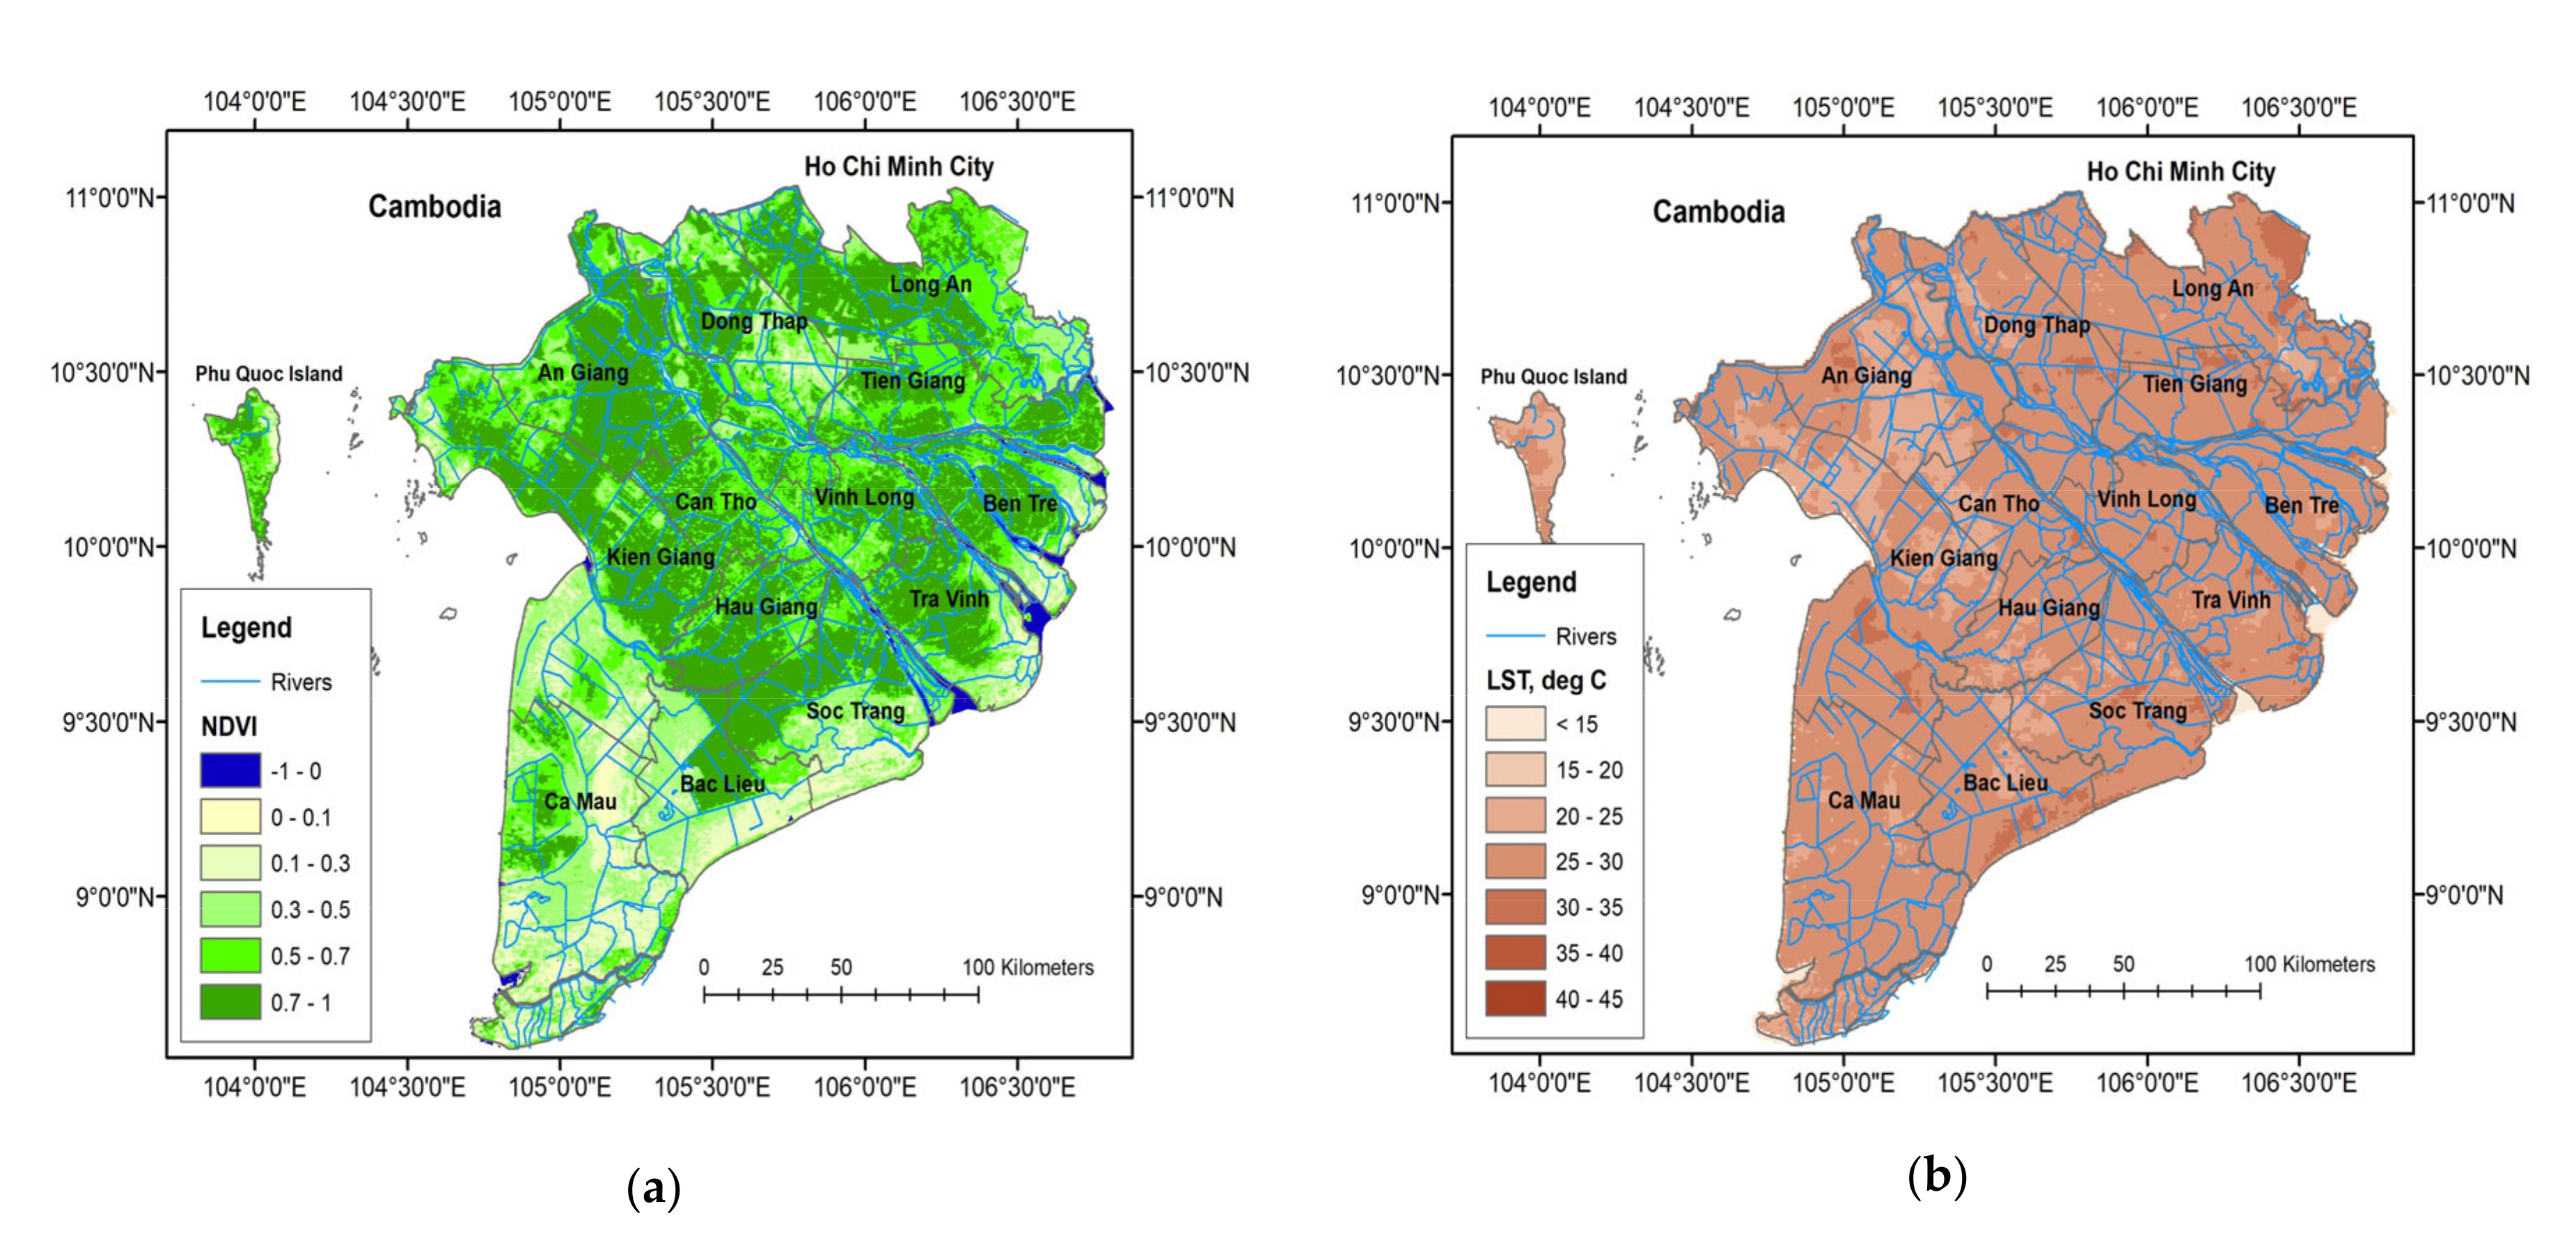
In this section, we describe the processing of the MODIS data to estimate the spatiotemporal trend of TVDI changes in the dry season between 2001 and 2015. For each image acquisition time, NDVI and LST are determined. Then, TVDI images are calculated based on NDVI and LST. Subsequently, a mean TVDI image is obtained for each dry season. Finally, for each pixel a temporal trend of TVDI changes in time series is estimated, using a linear regression. The resultant image is expected to be representative for the spatial pattern and temporal distribution of drought changes in the MRD in the dry season during the observed period.

2.3.1. NDVI

Based on Red and NIR reflective bands, NDVI is determined as in Equation (1). Here, ρ R e d and ρ N I R are representative for the MDO09QG band 1 and 2 surface reflectance values respectively. Then, the NDVI image is reconstructed at the 1 km spatial resolution by the bi-linear interpolation. Figure 2a shows NDVI derived from the data on 12 February, 2015.
N D V I = ρ N I R ρ R e d ρ N I R + ρ R e d .

2.3.2. LST

LST (K) is computed following Equation (2), based on the algorithm developed by Price (1984), and confirmed by Vazquez et al. (1997) [54,55]. Here, T 31 , T 32 (K) are the brightness temperatures obtained from band 31, band 32, respectively, and, ε 31 , ε 32 are the surface emissivity coefficients in band 31, band 32, respectively. In addition, the surface emissivity is calculated from NDVI, as Equations (4) and (5), apply the algorithm developed by Cihlar et al. (1997) [56]. Then, LST (°C) is determined following Equation (6). Additionally, LST anomalies out of a range from 15 to 45 (°C) are removed, conforming to the tropical weather in the study area. Figure 2b shows LST (°C) derived from the data on 12 February, 2015.
L S T = T 31 + 1.8 T 31 T 32 + 48 1 ε 75 Δ ε ,
ε = ε 31 + ε 32 2 ,
Δ ε = ε 31 ε 32 = 0.01019 + 0.01344 l n N D V I ,
ε 31 = 0.9897 + 0.029 l n N D V I ,
L S T º C = L S T K 273.15 .
The brightness temperature T b detected by a thermal sensor is determined by Planck’s Equation (7).
T b = h c / k λ ln 2 π h c 2 λ 5 L λ + 1   = K 2 ln K 1 L λ + 1   ,
where, L λ ( W m 2 s r 1 μ m 1 ) is the spectral radiation, h = 6.62 × 10 34   (Js) is Planck’s constant, c = 3 × 10 8 ( m s 1 ) is the speed of light, k = 1.38 × 10 23 J K 1 is Boltzmann’s constant, and λ μ m is the central wavelength. K 1 and K 2 ( W m 2 s r 1 μ m 1 ) are calibration coefficients, for band31: K 1 = 730.01, K 2 = 1305.84, and band32: K 1 = 474.99, K 2 = 1198.29 [57].

2.3.3. TVDI

Sandholt et al. (2002) proposed an index, called TVDI, to monitor drought levels based on LST and NDVI [19]. The levels of drought were related to evapotranspiration, soil moisture (or LST), and vegetation coverage. LST will be smallest at surfaces corresponding to maximum evaporation due to saturated water, while it will increase to maximum at minimum evaporative surfaces due to very dry surfaces (with or without vegetation). Subsequently, TVDI is determined by Equation (8). Here, LST (°C) is the land surface temperature at the observed pixel. L S T m a x and L S T m i n depend on the NDVI value at the observed pixel, as Equations (9) and (10), corresponding to the temperatures at the dry edge and the wet edge, respectively. The parameters (a, b) and (c, d) are constant for each image acquisition time.
T V D I = L S T L S T m i n L S T m a x L S T m i n ,
L S T m a x = a + b * N D V I ,
L S T m i n = c + d * N D V I .
For estimation of the parameters (a, b), and (c, d), the linear regression was applied [58]. Firstly, the NDVI image was divided into 20 classes from 0 to 1 values with an interval of 0.05. For each NDVI class, a dataset of the LST values at the corresponding pixels was collected. Then, the maximum values L S T m a x were chosen and the corresponding NDVI values N D V I m a x were determined, for an example see Table 1. Similarly, the minimum values L S T m i n and N D V I m i n were chosen. Subsequently, the fitting lines were estimated from the datasets of ( L S T m a x , N D V I m a x ) and ( L S T m i n , N D V I m i n ), using the linear regression, as presented in the red line and blue line, see Figure 3. They are representative for the dry edge and the wet edge at the image acquisition time. Finally, the parameters (a, b) and (c, d) were derived from these two lines, for example equaling to (-11.5399, 37.9475) and (−0.2788, 22.3359) on 12 February, 2015, respectively.
According to Equation (8), Figure 4 shows the TVDI image in the MRD on 12 February, 2015. Here, TVDI values are classified to five levels, consisting of ranges from 0 to 0.2, 0.2 to 0.4, 0.4 to 0.6, 0.6 to 0.8, and 0.8 to 1, which are representative of drought levels such as wet, normal, light, moderate, and high, respectively [28,29].

2.3.4. Mean TVDI

For each dry season, mean and standard deviation (StdDev) images of TVDI are computed. For each pixel, the mean TVDI equals an average of at least six TVDI values, corresponding to at least six image acquisition times per season. Subsequently, the standard deviation TVDI is computed. For example, Table 2 shows statistics of TVDI variations at the pixel of (10°06’N, 105°59’E), located at the Vinh Long Province. It consists of a number of TVDI images, mean and standard deviation of TVDI values for each dry season. As a result, this location shows a variation at moderate and high levels of drought in the dry season during the observed period.

2.3.5. Temporal Trends of the Mean TVDI Values

For each pixel, a temporal trend of the mean TVDI values between 2001 and 2015 is determined, using Equation (11), by the linear regression [58]. The trend is estimated if there are at least six mean TVDI values or seasons available between 2001 and 2015. The rate v of the trend is obtained by solving Equation (12) and the root mean square error (RMSE), as standard deviation of residuals, is also computed, as Equations (13) and (14).
y = Ax ,
x ^ = A T A 1 A T y ,
R M S E = i = 1 i = n e i ^ 2 n ,
e ^ = y A x ^ ,
where,
y = T D V I 1 ¯ T D V I n ¯ T : the vector of the mean TVDI values per season.
x = x 0 v : the vector of parameters of the linear trend, offset x 0 and rate v .
A = 1 1 t 1 t n T : the design matrix, in which t i denotes the ith season.
RMSE: the root mean square error (RMSE), as standard deviation of residuals.
e ^ : the least-square residual vector.
Figure 5 shows the temporal distribution of the mean TVDI values at the sampled pixel during the observed period. The result indicates that the location has an increase of drought change at a rate of +0.013 per year with RMSE of 0.05. Accordingly, a spatiotemporal pattern of drought changes in the dry season between 2001 and 2015 is estimated for the entire MRD.

3. Results

3.1. The Mean TVDI Images

For each dry season, the mean TVDI image is computed and classified into the five levels of drought, and the total area of each drought level is determined in the entire MRD. Figure 6 presents the mean TVDI images in the dry season from 2001 to 2015. Most of areas present light and moderate levels of drought, corresponding to yellow and orange colors. A few of red small areas show a high level of drought appearing in urban and industrial areas. Inversely, light blue and blue areas appear in forest or wetland areas.
In details, Table 3 and Figure 7 present percentages of areas of drought levels in the MRD in the dry seasons during the observed period. The total area of the wet level occupies nearly zero percentage while the total area of the high level of drought varies from 1% to 2%. Obviously, the total area of the light and moderate levels mostly occurs in a range from 96% to 98%, occupying approximately 62% and 35%, respectively. Here, the area is calculated by the sum of the total pixels of the 1 × 1 km size.

3.2. The Spatiotemporal Pattern of Drought Changes

The spatiotemporal pattern of drought changes in the MRD in the dry season between 2001 and 2015 is shown in Figure 8a, in which each pixel presents a temporal trend of the mean TVDI values. Each pixel is classified into one of seven colored groups, based on its rate v of drought change, corresponding to the slope of the trend. Table 4 presents the total area of the seven v groups of drought change in the entire MRD. Accordingly, the total area of the pixels in green occupies 75% of the study area, meaning unchanged levels of drought. The pixels in blue-tone, occupying the total area of about 12.5%, present a negative trend of drought change. These areas can be wetter, occurring in forest, agricultural cultivation, and aquaculture. Most of them are in the border of the MRD, adjacent to the sea, including provinces Kien Giang, Tra Vinh, Soc Trang, and Bac Lieu. On the other hand, the red-tone pixels, also occupying the total area of about 12.5%, show a positive trend of drought change. Most of the areas with an increased trend appear in the center of the RMD, including provinces Dong Thap, Vinh Long, Can Tho, and Hau Giang. This means that these areas are prone to increased drought.
Figure 8b shows the TVDI estimation map in 2001, in which each pixel is derived from the variable x in Equation (11). Subsequently, most of the region presents light and moderate drought. Nevertheless, their sub-areas have different trends of drought change. For example, Long An shows both light and moderate levels of drought, estimated in the 2001 dry season, and has mostly kept the levels of drought, occupying about 84% of the total area, during the observed period.
Table 4 indicates that sub-areas in Dong Thap, Vinh Long, Can Tho, and Hau Giang have an increased trend of drought change more the rest, occupying an area percentage of 30%, 45%, 29%, and 33%, respectively. Inversely, the sub-areas having a decreased trend are those in Bac Lieu, Kien Giang, Soc Trang, and Tra Vinh, with an area percentage of 27%, 28%, 23%, and 27%, respectively.

4. Discussions

4.1. An Increase in Duration of the Dry Season

The climate of the MRD is tropical and dictated by two distinct seasons: the dry and wet seasons. The cool, dry air masses from north-eastern directions make the MRD much drier from January to March, which causes short droughts occurring sparsely over the entire region for two or three weeks. Meanwhile, due to the southwest Monsoon, the MRD mostly has more frequent and heavy rains from May to October, and then flooding usually occurs for a few weeks [59]. The average annual rainfall ranges from approximately 1000 to 2400 mm, and regularly decreases from southeast to northwest, e.g., approximately 2250 mm, 1600 mm, and 1490 mm at the meteorological stations in Ca Mau, Can Tho, and Dong Thap, respectively [43]. Due to reduction in rainfall and increase in hot weather duration during the dry seasons, the short droughts have become longer, denser, and more serious. Annually, a zero or very low rainfall period is normally experienced between January and March, but the average monthly rainfall of approximately 13 mm occurs sparsely over the MRD, as derived from the rainfall data at the meteorological stations in Can Tho and Dong Thap (data source: Vietnam Center of Hydro-Meteorological Data), see Figure 9. The increase in dry season duration is mostly caused by a rainfall shortage occurring in last December or April or both. For example, recently severe droughts in the MRD from 2002 to 2004 and 2015 to2016 were reported [44,59].
Based on the two monthly rainfall datasets at the Can Tho and the Dong Thap, the three-month SPI values through the end of March from 1985 to 2018 were determined, by applying the Standardized Precipitation Index Tool [60]. As a result, the SPI-3 values vary in a range from approximately −1.5 to 2.0, as presented in Figure 10. Accordingly, after the 1987 serious short drought, the MRD mostly experienced a normal state in the dry season with the SPI-3 range of (−1.0, +1.0), meaning no anomaly of drought or normal rainfall during the 10-year period. Nevertheless, positive and negative anomalies of drought have appeared extremely and alternatively since 2000, meaning that the precipitation regime is very dry or very wet, corresponding to the SPI-3 values of less than −1.5 or more than 1.5, respectively. For instance, short droughts occurred in 2002 and 2015 over the widespread MRD, corresponding to the SPI-3 of −1.5 at the Can Tho and −1.0 at the Dong Thap.
Table 5 shows a comparison between the TVDI and SPI-3 indicators at the meteorological stations in Can Tho and Dong Thap during the observed period. The SPI-3 values present a large variation of drought anomalies from negative to positive while the TVDI values mostly illustrate moderate levels of drought, also see Figure 11. Typically, the SPI-3 indicator through the end of March only depends on accumulated rainfall in the dry season, from January to March, and the long-term rainfall from 1985 to 2018. Meanwhile, the TVDI indicator is affected by land cover characteristics and surface temperature, or evapotranspiration, during the dry season. Subsequently, the TVDI and SPI-3 values strongly indicate moderate and severe droughts when rainfall shortages appear, e.g., from 2002 to 2003, and 2014 to 2015.

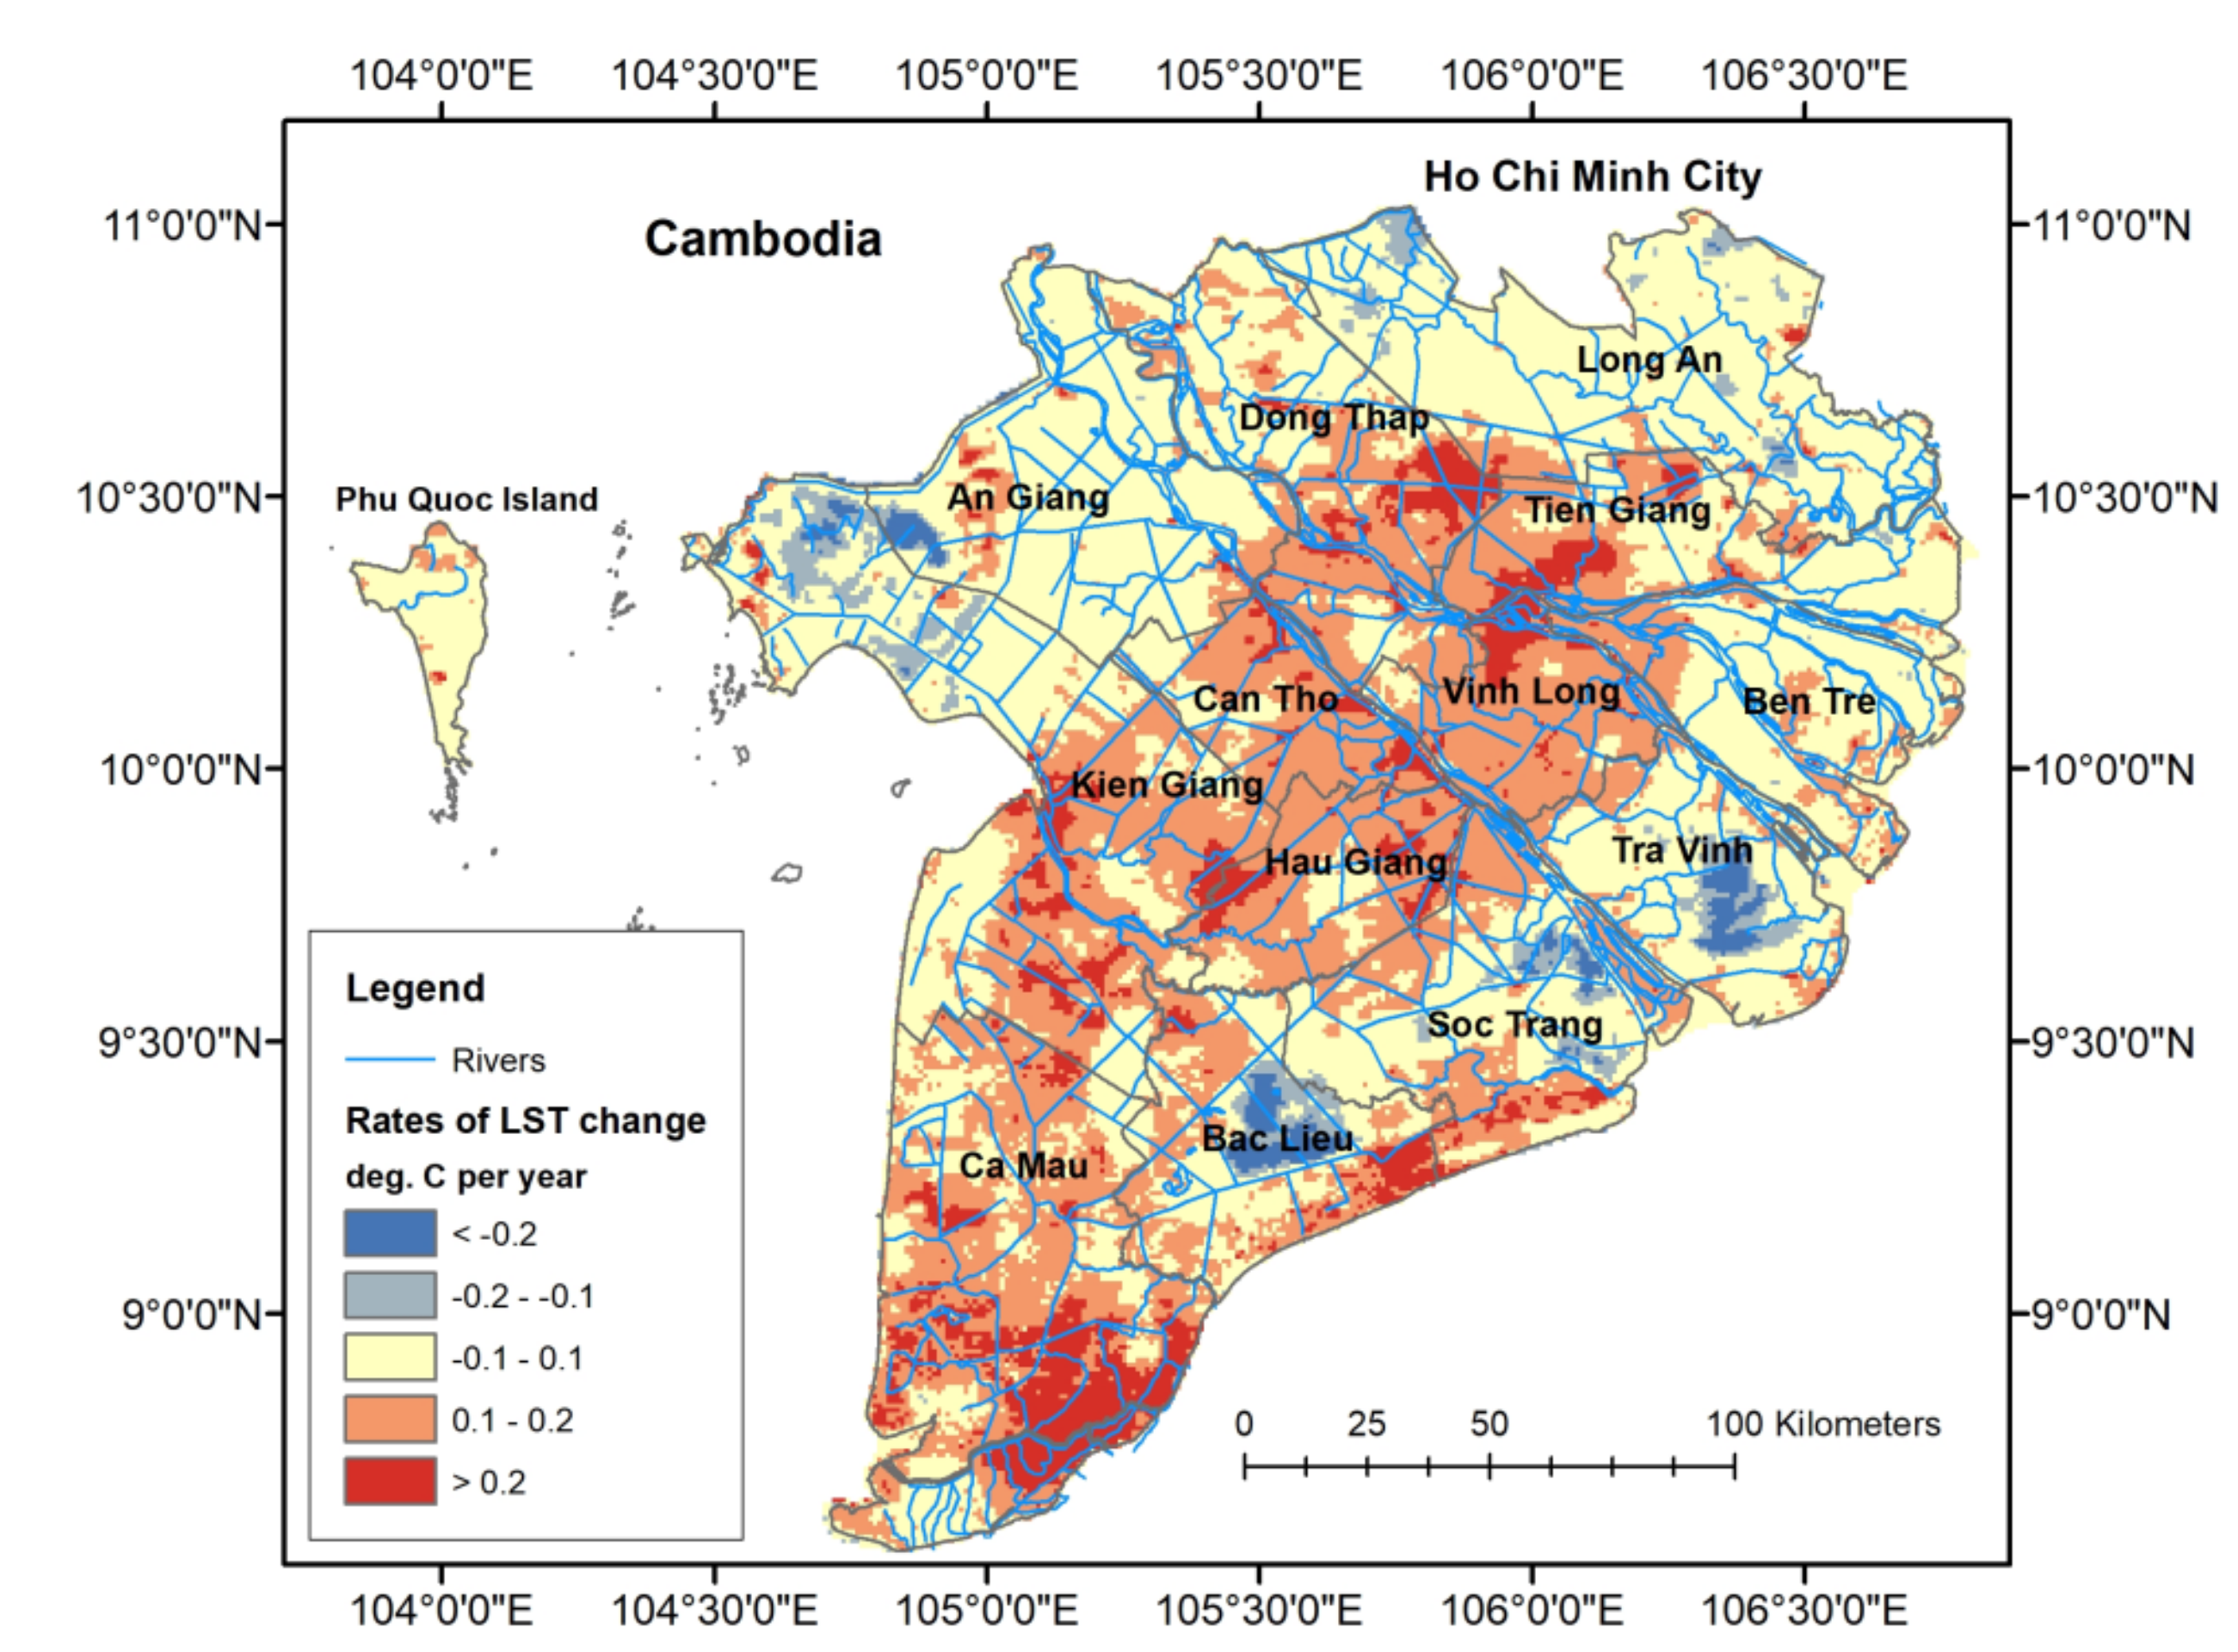
4.2. Spatiotemporal Pattern of LST Changes

Similarly, based on the dataset of the LST images, a spatiotemporal pattern of LST changes in the MRD in the dry seasons is estimated, by the linear regression, as shown in Figure 12. It means that for each pixel, a temporal trend of LST change is determined and its rate of LST change is described as the slope of a fitting line estimated from LST values in time-series. Each pixel is classified into one of five colored groups, based on its rate of the LST changes. As shown in Table 6, the total area of the pixels in yellow occupies about 50% of the study area, meaning that LST are mostly unchanged. The pixels in blue-tone, occupying the total area of about 5%, present a negative trend of the LST changes, while the pixels in red-tone, also occupying the total area of about 45%, show a positive trend of the LST changes. In general, LST in the MRD increases at an average rate of +0.1 °C per year in the dry season between 2000 and 2015. Subsequently, the pattern of LST changes in the MRD is positively correlated to the spatiotemporal pattern of drought changes during the observed period.

4.3. Drought Level Change vs. Land Use Change

Based on land use maps in the Southern Vietnam, investigated and created by the provincial governments every five years, Table 7 presents a summary of main land use areas belonging to the MRD in 2000 and 2015 [61]. Subsequently, the provinces, including Dong Thap, Vinh Long, Can Tho, and Hau Giang, have an obvious change in land use, as forest and land for cultivation of perennial trees decreased by 16.9, 83.6, and 86.0 km2 while built-up land for residence and public transportation increased by 52.6, 49.3, and 82.0 km2, respectively. Inversely, there were also obvious land use change in the maritime provinces, e.g., Tra Vinh, Bac Lieu, Ca Mau, and Kien Giang, in the following three ways. Firstly, paddy land and land for cultivation of annual crops were converted to land for cultivation of perennial trees or aquaculture land. Secondly, forest land and/or land for cultivation of perennial trees were converted to aquaculture land nearby the coastal areas. Thirdly, mangrove forests were planted along most of the coastal areas. Changes in forest land are obviously recognized in the forest maps in the MRD in 2005 and 2015, as shown in Figure 13 [62].
Additionally, Pham et al. (2016) confirmed that agricultural land decreased, including land for cultivation of paddy and annual crops, perennial trees, and forest, while non-agricultural land increased, including residential land, land for construction, and land for public purposes, between 2005 and 2014 [62]. As a result, the two land use maps in the MRD were derived from the Landsat-7 scene on 20 January, 2005 and the Landsat-8 scene on 21 January, 2014, as presented in Figure 14. Then, the total areas of land use types were computed, as shown in Table 8. Accordingly, land for cultivation of paddy and annual crop, colored in yellow, occupying 54% of the total area in 2014, decreased by ~1000 km2. Land for cultivation for perennial trees, most of fruits, colored in light orange, occupying 18.8%, decreased by ~1400 km2. Forest land, colored in green, only occupying 3.1%, decreased by ~625 km2, mostly occured in Long An, and Dong Thap. Inversely, the others, colored in gray, occupying 12.6%, including urban and rural residential land, land for construction of offices, industrial parks, and public transports, strongly increased by ~3000 km2, clearly appeared in Long An, Tien Giang, Dong Thap, An Giang, Vinh Long, Can Tho, and Hau Giang.
In summary, the sub-areas in the central region have a positive trend of drought change due to an increase of imperious surface, i.e., land for cultivation of perennial trees and forest have been converted to built-up land for residence and public transportation. Meanwhile, the sub-areas along the coastal region have a negative trend of drought change due to an increase of water and vegetated surface, e.g., mangrove and aquaculture land.

5. Conclusions

We have presented a state-of-the-art analysis of drought occurring in the MRD in the dry season from 2001 to 2015. In this case, the TVDI indicator is exploited to assess drought levels, using the daily MODIS data products. The spatiotemporal pattern of drought changes in the MRD during the observed period is estimated based on the mean TVDI images, using the linear regression. The result indicates that approximately 62% of the study area is at light level of drought while 34% are at moderate level in the dry season. Subsequently, approximately 12.5% of the total area have an increased trend of drought change, indicative of becoming drier, mostly occurring in the central sub-regions. Inversely, also approximately 12.5% of the total area are shown by negative trends of drought change, becoming wetter, appearing in several sub-areas in the maritime provinces. The results are expected to provide important information for the sustainable water resource management and planning in the MRD.

Author Contributions

V.H.P. performed the computations and wrote the manuscript; V.T.D. prepared NDVI and LST datasets; Z.S. supervised the study, revised the manuscript and provided comments and suggestions. All authors have read and agreed to the published version of the manuscript

Funding

This research received no external funding.

Acknowledgments

We are grateful to Vietnam Center of Hydro-Meteorological Data for providing the two rainfall datasets in Can Tho and Dong Thap.

Conflicts of Interest

The authors declare no conflict of interest.

References

  1. Spinoni, J.; Barbosa, P.; De Jager, A.; McCormick, N.; Naumann, G.; Vogt, J.V.; Magni, D.; Masante, D.; Mazzeschi, M. A new global database of meteorological drought events from 1951 to 2016. J. Hydrol. Reg. Stud. 2019, 22, 100593. [Google Scholar] [CrossRef]
  2. Blunden, J.; Arndt, D.S.; Hartfield, G. State of the Climate in 2017. Bull. Amer. Meteor. Soc. 2018, 99, S36–S37. [Google Scholar] [CrossRef]
  3. Alimullah Miyan, M. Droughts in Asian Least Developed Countries: Vulnerability and sustainability. Weather. Clim. Extrem. 2015, 7, 8–23. [Google Scholar] [CrossRef] [Green Version]
  4. Wehner, M.F.; Arnold, J.R.; Knutson, T.; Kunkel, K.E.; LeGrande, A.N. Droughts, floods, and wildfires. In Climate Science Special Report: Fourth National Climate Assessment; U.S. Global Change Research Program: Washington, DC, USA, 2017; Volume 1, pp. 231–256. [Google Scholar] [CrossRef] [Green Version]
  5. Trenberth, K.; Dai, A.; van der Schrier, G.; Jones, P.D.; Barichivich, J.; Briffa, K.R.; Sheffield, J. Global warming and changes in drought. Nat. Clim. Change. 2014, 4, 17–22. [Google Scholar] [CrossRef]
  6. Xu, L.; Chen, N.; Zhang, X. Global drought trends under 1.5 and 2 °C warming. Int. J. Climatol. 2018, 39, 2375–2385. [Google Scholar] [CrossRef]
  7. National Drought Mitigation Center, USA. Types of Drought. Available online: https://drought.unl.edu/Education/DroughtIn-depth/TypesofDrought.aspx (accessed on 22 April 2019).
  8. Heim, R.R. A review of twentieth-century drought indices used in the United States. Bull. Am. Meteorol. Soc. 2002, 83, 1149–1166. [Google Scholar] [CrossRef] [Green Version]
  9. Mishra, A.K.; Singh, V.P. A review of drought concepts. J. Hydrol. 2010, 391, 202–216. [Google Scholar] [CrossRef]
  10. Niemeyer, S. New drought indices. Options Méditerr. Seri A 2008, 80, 267–274. [Google Scholar]
  11. Zargar, A.; Sadiq, R.; Naser, B.; Khan, F.I. A review of drought indices. Environ. Rev. 2011, 19, 333–349. [Google Scholar] [CrossRef]
  12. Shafer, B.A.; Dezman, L.E. Development of a Surface Water Supply Index (SWSI) to Assess the Severity of Drought Conditions in Snowpack Runoff Areas. In Proceedings of the Western Snow Conference, Colorado State University, Fort Collins, CO, USA, 19–23 April 1982; pp. 164–175. [Google Scholar]
  13. Nalbantis, I.; Tsakiris, G. Assessment of hydrological drought revisited. Water Resour. Manag. 2009, 23, 881–897. [Google Scholar] [CrossRef]
  14. Su, Z.; He, Y.; Dong, X.; Wang, L. Drought monitoring and assessment using remote sensing. In Remote Sensing of Hydrological Extremes; Venkat Lakshmi; Springer: Cham, Switzerland, 2017; pp. 151–172. [Google Scholar]
  15. Carlson, T.N.; Gillies, R.R.; Perry, E.M. A Method to Make Use of Thermal Infrared Temperature and NDVI measurements to Infer Surface Soil Water. Remote Sens. Rev. 1994, 9, 161–173. [Google Scholar] [CrossRef]
  16. Carlson, T.N.; Capehart, W.J.; Gillies, R.R. A New Look at the Simplified Method for Remote-Sensing of Daily Evapotranspiration. Remote Sens. Environ. 1995, 54, 161–167. [Google Scholar] [CrossRef]
  17. Goetz, S.J. Multi-Sensor Analysis of NDVI, Surface Temperature and Biophysical Variables at a Mixed Grassland Site. Int. J. Remote Sens. 1997, 18, 71–94. [Google Scholar] [CrossRef]
  18. Gillies, R.R.; Kustas, W.P.; Humes, K.S. A Verification of the ‘Triangle’ Method for Obtaining Surface Soil Water Content and Energy Fluxes from Remote Measurements of the Normalized Difference Vegetation Index (NDVI) and Surface Radiant Temperature. Int. J. Remote Sens. 1997, 18, 3145–3166. [Google Scholar] [CrossRef]
  19. Sandholt, I.; Rasmussen, K.; Anderson, J. A simple interpretation of the surface temperature/vegetation index space for assessment of the surface moisture status. Remote Sens. Environ. 2002, 79, 213–224. [Google Scholar] [CrossRef]
  20. Bayarjargal, Y.; Karnieli, A.; Bayasgalan, M.; Khudulmur, S.; Gandush, C.; Tucker, C.J. A comparative study of NOAA-AVHRR derived drought indices using change vector analysis. Remote Sens. Environ. 2006, 105, 9–22. [Google Scholar] [CrossRef]
  21. Sun, H. Two-Stage Trapezoid: A New Interpretation of the Land Surface Temperature and Fractional Vegetation Coverage Space. IEEE J. Sel. Top. Appl. Earth Obs. Remote Sens. 2016, 9, 336–346. [Google Scholar] [CrossRef]
  22. Bai, J.; Yu, Y.; Liping, D. Comparison between TVDI and CWSI for drought monitoring in the Guanzhong Plain, China. J. Integr. Agric. 2017, 16, 389–397. [Google Scholar] [CrossRef] [Green Version]
  23. Gao, Z.; Gao, W.; Chang, N. Integrating temperature vegetation dryness index (TVDI) and regional water stress index (RWSI) for drought assessment with the aid of LANDSAT TM/ETM+ images. J. Appl. Gerontol. 2011, 13, 495–503. [Google Scholar] [CrossRef]
  24. Hu, X.; Ren, H.; Tansey, K.; Zheng, Y.; Ghent, D.; Liu, X.; Yan, L. Agricultural drought monitoring using European Space Agency Sentinel 3A land surface temperature and normalized difference vegetation index imageries. Agr. For. Meteorol. 2019, 279, 107707. [Google Scholar] [CrossRef]
  25. Li, C.; Li, H. Study on winter wheat drought monitoring by TVDI in Hebei Province, Proc. SPIE 6298. In Remote Sensing and Modeling of Ecosystems for Sustainability III; International Society for Optics and Photonics: Bellingham, WA, USA, 2006; p. 62981U. [Google Scholar] [CrossRef]
  26. Liu, Y.; Yue, H. The Temperature Vegetation Dryness Index (TVDI) Based on Bi-Parabolic NDVI-Ts Space and Gradient-Based Structural Similarity (GSSIM) for Long-Term Drought Assessment across Shaanxi Province, China (2000–2016). Remote Sens. 2018, 10, 959. [Google Scholar] [CrossRef] [Green Version]
  27. Zou, J.; Ding, J.; Welp, M.; Huang, S.; Liu, B. Assessing the Response of Ecosystem Water Use Efficiency to Drought During and after Drought Events across Central Asia. Sensors 2020, 20, 581. [Google Scholar] [CrossRef] [Green Version]
  28. Wang, C.; Qi, S.; Niu, Z.; Wang, J. Evaluating soil moisture status in China using the temperature–vegetation dryness index (TVDI). Can. J. Remote Sens. 2004, 30, 671–679. [Google Scholar] [CrossRef]
  29. Liu, Y.; Wu, L.; Yue, H. Biparabolic NDVI-Ts Space and Soil Moisture Remote Sensing in an Arid and Semi-arid Area. Can. J. Remote Sens. 2015, 41, 159–169. [Google Scholar] [CrossRef]
  30. Patel, N.R.; Anapashsha, R.; Kiumar, S.; Saha, S.K.; Dadhwal, V.K. Assessing potential of MODIS derived temperature/vegetation condition index (TVDI) to infer soil moisture status. Int. J. Remote Sens. 2009, 30, 23–39. [Google Scholar] [CrossRef]
  31. Wu, C.; Cao, G.; Chen, K.; E, C.Y.; Mao, Y.; Zhao, S.; Wang, Q.; Su, X.; Wei, Y. Remotely sensed estimation and mapping of soil moisture by eliminating the effect of vegetation cover. J. Integr. Agric. 2019, 18, 316–327. [Google Scholar] [CrossRef]
  32. Fan, L.; Xiao, Q.; Wen, J.; Liu, Q.; Tang, Y.; You, D.; Wang, H.; Gong, Z.; Li, X. Evaluation of the Airborne CASI/TASI Ts-VI Space Method for Estimating Near-Surface Soil Moisture. Remote Sens. 2015, 7, 3114–3137. [Google Scholar] [CrossRef] [Green Version]
  33. Chen, S.; Wen, Z.; Jiang, H.; Zhao, Q.; Zhang, X.; Chen, Y. Temperature Vegetation Dryness Index Estimation of Soil Moisture under Different Tree Species. Sustainability 2015, 7, 11401–11417. [Google Scholar] [CrossRef] [Green Version]
  34. Li, B.; Ti, C.; Zhao, Y.; Yan, X. Estimating Soil Moisture with Landsat Data and Its Application in Extracting the Spatial Distribution of Winter Flooded Paddies. Remote Sens. 2016, 8, 38. [Google Scholar] [CrossRef] [Green Version]
  35. Schirmbeck, L.W.; Fontana, D.C.; Schirmbeck, J.; Mengue, V.P. Understanding TVDI as an index that expresses soil moisture. J. Human Reprod. Sci. 2017, 7, 82–90. [Google Scholar]
  36. Kimura, R. Estimation of moisture availability over the Liudaogou river basin of the Loess Plateau using new indices with surface temperature. J. Arid. Environ. 2007, 70, 237–252. [Google Scholar] [CrossRef]
  37. Zhao, S.; Cong, D.; He, K.; Yang, H.; Qin, Z. Spatial-Temporal Variation of Drought in China from 1982 to 2010 Based on a modified Temperature Vegetation Drought Index (mTVDI). Sci. Rep. 2017, 7, 17473. [Google Scholar] [CrossRef]
  38. Du, L.; Song, N.; Liu, K.; Hou, J.; Hu, Y.; Zhu, Y.; Wang, X.; Wang, L.; Guo, Y. Comparison of Two Simulation Methods of the Temperature Vegetation Dryness Index (TVDI) for Drought Monitoring in Semi-Arid Regions of China. Remote Sens. 2017, 9, 177. [Google Scholar] [CrossRef] [Green Version]
  39. Zhu, W.; Lv, A.; Jia, S.; Sun, L. Development and evaluation of the MTVDI for soil moisture monitoring. J. Geophys. Res. Atmos. 2017, 122, 5533–5555. [Google Scholar] [CrossRef] [Green Version]
  40. Son, N.T.; Chen, C.F.; Chen, C.R.; Chang, L.Y.; Minh, V.Q. Monitoring agricultural drought in the lower Mekong basin using MODIS NDVI and land surface temperature data. Int. J. Appl. Earth Obs. 2012, 18, 417–427. [Google Scholar] [CrossRef]
  41. Liang, L.; Zhao, S.; Qin, Z.; He, K.; Chen, C.; Luo, Y.; Zhou, X. Drought Change Trend Using MODIS TVDI and Its Relationship with Climate Factors in China from 2001 to 2010. J. Integr. Agric. 2014, 13, 1501–1508. [Google Scholar] [CrossRef]
  42. Han, Y.; Li, Z.; Huang, C.; Zhou, Y.; Zong, S.; Hao, T.; Niu, H.; Yao, H. Monitoring Droughts in the Greater Changbai Mountains Using Multiple Remote Sensing-Based Drought Indices. Remote Sens. 2020, 12, 530. [Google Scholar] [CrossRef] [Green Version]
  43. General Statistics Office of Vietnam. Available online: http://www.gso.gov.vn/Default_en.aspx?tabid=491 (accessed on 22 April 2019).
  44. UNDRMT: UN Disaster Risk Management Team Secretariat. Viet Nam Consolidated Report on Drought and Saltwater Intrusion Reporting Period: October 2015—9 March 2016. United Nations in Vietnam. 2016. Available online: https://reliefweb.int/sites/reliefweb.int/files/resources/Vietnam%20Consolidated%20Report%20on%20Drought%202015-2016-Final_11%20Mar%202016.pdf (accessed on 22 April 2019).
  45. CGIAR Research Program on Climate Change, Agriculture and Food Security—Southeast Asia (CCAFS SEA). Assessment report: The drought and salinity intrusion in the mekong river delta of Vietnam.; CGIAR Research Program on Climate Change, Agriculture and Food Security (CCAFS): Hanoi, Vietnam, 2016. [Google Scholar]
  46. Grosjean, G.; Monteils, F.; Hamilton, S.D.; Blaustein-Rejto, D.; Gatto, M.; Talsma, T.; Bourgoin, C.; Sebastian, L.S.; Catacutan, D.; Mulia, R.; et al. Increasing Resilience to Droughts in Vietnam; The Role of Forests, Agroforests and Climate Smart Agriculture. CCAFS-CIAT-UN-REDD Position Paper n. 1; International Center for Tropical Agriculture (CIAT); CCAFS, UN, REDD: Cali, Colombia, 2016. [Google Scholar]
  47. Thilakarathne, M.; Sridhar, V. Characterization of future drought conditions in the Lower Mekong River Basin. Weather Clim. Extrem. 2017, 17, 47–58. [Google Scholar] [CrossRef]
  48. Mekong River Commission. Mekong Climate Change Adaptation Strategy and Action Plan. Vientiane: Mekong River Commission. 2018. Available online: http://www.mrcmekong.org/assets/Publications/MASAP-book-28-Aug18.pdf (accessed on 22 April 2019).
  49. Mekong River Commission. Drought Management Strategy for the Lower Mekong Basin 2020–2025. Vientiane: Mekong River Commission. 2019. Available online: http://www.mrcmekong.org/assets/Publications/MRC-DMS-2020–2025-Fourth-draft-V3-v2.0-_formatted.pdf (accessed on 22 April 2019).
  50. MODIS Surface Reflectance User’s Guide. Available online: http://modis-sr.ltdri.org/guide/MOD09_UserGuide_v1.4.pdf (accessed on 22 April 2019).
  51. MOD09GQ—MODIS/Terra Surface Reflectance Daily L2G Global 250 m SIN Grid. Available online: https://ladsweb.modaps.eosdis.nasa.gov/missions-and-measurements/products/land-surface-reflectance/MOD09GQ/ (accessed on 22 April 2019).
  52. MODIS Level 1B Product User’s Guide. Available online: https://mcst.gsfc.nasa.gov/sites/default/files/file_attachments/M1054E_PUG_2017_0901_V6.2.2_Terra_V6.2.1_Aqua.pdf (accessed on 22 April 2019).
  53. MOD21 MODIS/Terra Land Surface Temperature/3-Band Emissivity 5-Min L2 1 km V006. Available online: https://lpdaac.usgs.gov/products/mod21v006/ (accessed on 22 April 2019).
  54. Price, J.C. Land surface temperature measurements from the split window channel of the NOAA 7 Advanced Very High Resolution Radiometer. J. Geophys. Res. 1984, 89, 7231–7237. [Google Scholar] [CrossRef]
  55. Vazquez, D.P.; Reyes, F.J.O.; Arboledas, L.A. A comparative study of algorithms for estimating land surface temperature from AVHRR data. Remote Sens. Environ. 1997, 62, 215–222. [Google Scholar] [CrossRef]
  56. Cihlar, J.; Ly, H.; Li, Z.; Chen, J.; Pokrant, H.; Hung, F. Multi-temporal, Multi-channel AVHRR data sets for land biosphere studies—Artifacts and corrections. Remote Sens. Environ. 1997, 60, 35–57. [Google Scholar] [CrossRef]
  57. Hong, S.; Hendrickx, J.M.H.; Borchers, B. Effect of Scaling Transfer between Evapotranspiration Maps Derived from LandSat 7 and MODIS Images. Proceedings of Targets and Backgrounds XI: Characterization and Representation Vol. 5811, Defense and Security, Orlando, Florida, USA, 28 March–1 April 2005. [Google Scholar] [CrossRef]
  58. Teunissen, P.J.G. Adjustment Theory: An Introduction; VSSD: Delft, The Netherlands, 2003; pp. 39–60. [Google Scholar]
  59. MRC Mekong-HYCOS Project. The Mekong Hydrological Cycle Observing System Mekong-HYCOS, A Hydrological Information System in the Mekong River Basin: Project Document. WMO. 2008. Available online: https://library.wmo.int/doc_num.php?explnum_id=4698 (accessed on 22 April 2019).
  60. National Drought Mitigation Center. Standardized Precipitation Index. Available online: https://drought.unl.edu/droughtmonitoring/SPI.aspx (accessed on 22 April 2019).
  61. Tran, T.B. The Integrated System of Remote Sensing, GIS and Mathematical Model for Assessing Climate Change in Southern Vietnam; Technical Report of the ĐT.NCCB-ĐHƯD.2012-G/3 Project; Ho Chi Minh City Institute of Resources Geography, Vietnam Academy of Science and Technology: Ho Chi Minh City, Vietnam, 2016. (In Vietnamese) [Google Scholar]
  62. Pham, T.M.T. Using VNREDSat-1 Satellite Data and Similar Imagery to Monitor Agricultural Land in the Mekong River Delta of Vietnam for Socio-Economic Development and Climate Change Adaptation. Technical Report of the VT/UD-04/13–15 Project; Ho Chi Minh City Institute of Resources Geography, Vietnam Academy of Science and Technology: Ho Chi Minh City, Vietnam, 2016. (In Vietnamese) [Google Scholar]
Figure 1. (a) The Mekong Basin map (Source: MRC, 2001) and (b) the Mekong River Delta (MRD) of Vietnam superimposed with the meteorological station (M. Stations) layer.
Remotesensing 12 02974 g001
Figure 2. (a) NDVI and (b) LST (°C) in the Vietnamese Mekong River Delta on 12 February, 2015.
Remotesensing 12 02974 g002
Figure 3. The fitting lines red and blue, representative for the dry edge and the wet edge in the MRD on 12 February, 2015.
Remotesensing 12 02974 g003
Figure 4. The TVDI image in the MRD, derived from the MODIS surface reflectance and emissive bands on 12 February, 2015.
Remotesensing 12 02974 g004
Figure 5. The temporal trend of the TVDI changes at the sampled location during the observed period.
Remotesensing 12 02974 g005
Figure 6. The mean TVDI images in the MRD in the dry season from 2001 to 2015.
Remotesensing 12 02974 g006
Figure 7. A chart of areas of the TVDI levels in the MRD in the dry season from 2001 to 2015.
Remotesensing 12 02974 g007
Figure 8. The spatiotemporal pattern of drought change in the MRD in the dry seasons between 2001 and 2015, in which (a) rates of TVDI change, v , and (b) the TVDI estimation in 2001, superimposed by the contours of rates of drought change.
Remotesensing 12 02974 g008aRemotesensing 12 02974 g008b
Figure 9. The distributions of monthly rainfall from the meteorological stations at the locations of (a) (10°02’N, 105°46’E) in Can Tho, and (b) (10°28’N, 105°38’E) in Dong Thap, from January 1985 to December 2018.
Remotesensing 12 02974 g009
Figure 10. The distributions of the SPI-3 values through the end of March derived from the monthly rainfall data from the meteorological stations in (a) Can Tho and (b) Dong Thap.
Remotesensing 12 02974 g010
Figure 11. The scattering of the TVDI values (X-axis) and the SPI-3 values (Y-axis) in the dry season from 2001 to 2015 at the meteorological stations in (a) Can Tho and (b) Dong Thap.
Remotesensing 12 02974 g011
Figure 12. The spatiotemporal pattern of LST changes in the MRD in the dry season between 2001 and 2015.
Remotesensing 12 02974 g012
Figure 13. The distribution of forest types, including mangrove forest, melaleuca forest, and land forest in the MRD (a) in 2005 and (b) in 2015 [61].
Remotesensing 12 02974 g013
Figure 14. The land-use maps derived from (a) the Landsat-7 scene on 20 January, 2005, and (b) the Landsat -8 scene on 21 January, 2014 [62].
Remotesensing 12 02974 g014
Table 1. The datasets of ( L S T m a x , N D V I m a x ) and ( L S T m i n , N D V I m i n ) determined from the LST and NDVI images on 12 February, 2015.
NDVI Class L S T m a x N D V I m a x L S T m i n N D V I m i n
0–0.0541.850.0024.810.05
0.05–0.1033.610.0622.470.08
0.10–0.1533.700.1222.310.11
0.15– 0.2031.990.1722.550.20
0.20–0.2535.410.2422.090.23
0.25–0.3035.280.2822.680.27
0.30–0.3534.540.3421.850.32
0.35–0.4034.330.3822.380.36
0.40–0.4534.810.4421.810.42
0.45–0.5033.790.4721.640.46
0.50–0.5534.230.5322.400.51
0.55–0.6032.650.5818.840.59
0.60–0.6532.990.6219.820.61
0.65–0.7030.870.6519.800.66
0.70–0.7529.450.7122.130.71
0.75–0.8031.220.7622.550.78
0.80–0.8527.020.8123.850.81
0.85–0.9026.150.8523.680.88
0.90–0.9524.230.9024.230.90
0.95–1.00----
Table 2. The mean and StdDev of TVDI at the sampled location at the Vinh Long Province in the dry season from 2001 to 2015.
YearNo. of ImagesMean TVDIStdDev TVDI
200170.720.13
2002270.580.19
2003160.620.20
2004230.670.21
2005340.630.21
2006150.620.15
2007230.690.17
2008170.710.21
2009100.750.20
2010110.630.14
2011130.780.10
2012100.750.23
2013140.860.11
2014140.830.13
2015100.730.15
Table 3. Percentages of areas of the TVDI levels in the MRD in the dry seasons from 2001 to 2015.
YearWetNormalLightModerateHigh
20010.01%0.65%62.90%35.97%0.48%
20020.00%1.53%74.50%23.17%0.80%
20030.00%0.09%60.51%38.84%0.56%
20040.01%0.52%51.01%47.60%0.87%
20050.00%1.87%82.10%16.01%0.02%
20060.01%1.60%79.29%19.01%0.09%
20070.00%13.30%67.66%18.28%0.77%
20080.00%0.31%53.76%45.74%0.18%
20090.01%1.16%43.84%53.94%1.05%
20100.00%0.99%69.04%29.35%0.61%
20110.01%0.64%57.07%40.73%1.55%
20120.01%0.39%49.75%49.56%0.30%
20130.02%0.70%66.93%30.95%1.40%
20140.00%2.27%60.83%35.33%1.56%
20150.19%7.29%76.25%15.03%1.25%
Average0.02%2.45%62.08%34.60%0.85%
Table 4. The total area of the rates v of drought change in the MRD in the dry season between 2001 and 2015.
v <−0.02−0.02–−0.01−0.01–−0.005−0.005–0.0050.005–0.010.01–0.02>0.02Total Area (km2)
An Giang3910918728573212903542
Bac Lieu935926717089002351
Ben Tre010432158260612478
Ca Mau04974981179905270
Can Tho00010143388501437
Hau Giang00723509309703383
Dong Thap001610065326401617
Long An07472552991932306314
Kien Giang153272230861852004546
Soc Trang21955702294244303307
Tien Giang3116417735255702433
Tra Vinh3215430165271002371
Vinh Long02285158710621549
Total area (km2)5717133197307124414505340600
Percentage0.14%4.22%7.87%75.64%10.87%1.24%0.01%100.00%
Table 5. The comparison of the TVDI and SPI-3 indicators in the dry season from 2001 to 2015 at the meteorological stations in Can Tho and Dong Thap, where R-3 (mm) is the accumulated rainfall from January to March.
YearCan ThoDong Thap
R-3 (mm)SPI-3TVDIR-3 (mm)SPI-3TVDI
2001113.11.350.5958.90.700.64
20020−1.570.700−1.050.64
20030.5−1.240.681.6−0.790.70
200432.50.290.730−1.050.69
20054.8−0.660.640.2−0.980.59
2006119.41.410.6863.60.760.68
200798.31.200.721081.240.66
200825.80.140.77108.70.350.67
200998.71.110.79891.050.83
201015.3−0.150.75310.250.73
2011105.71.280.8290.81.070.74
2012151.41.680.8132.30.270.79
201318.8−0.040.7112.1−0.230.76
20141.4−1.030.821.4−0.810.78
20150−1.570.800−0.850.73
Table 6. The areas of rates of LST changes in the MRD in the dry season between 2001 and 2015.
Rates of LST Change Per Year≤−0.2−0.2–−0.1−0.1–0.10.1–0.2>+0.2Total Area (km2)
An Giang74512959414443542
Ben Tre3131668646232351
Bac Lieu1901979769291862478
Ca Mau051486258311965270
Can Tho002949551881437
Dong Thap02146515593583383
Hau Giang0025211292361617
Kien Giang45413330521204316314
Long An122723870361334546
Soc Trang60216164812561283307
Tien Giang01412669092442433
Tra Vinh150219161637972371
Vinh Long0012212052211549
Total area (km2)53414012092614445329440600
Percentage (%)1.323.4551.5435.588.11100.00
Table 7. A summary of main land use areas in the Vietnamese Mekong River Delta, computed from the land use maps in 2000 and 2015 [61].
Land Use in 2000 (km2)Land Use in 2015 (km2)
ProvincePaddy, Annual CropsPerennial TreesForestResidentPaddy, Annual CropsPerennial TreesForestResident
An Giang5172.2286.7106.815.75479.5364.281.656.3
Bac Lieu2194.2222.511.13.31487.320.38.83.2
Ben Tre731.81214.235.27.4545.51141.555.828.5
Ca Mau2095.1288.5857.28.4905.182.3731.619.3
Can Tho4050.0565.620.920.51992.6244.70.091.3
Hau Giang (*)----2037.3427.70.011.1
Dong Thap5148.0322.7118.37.85036.3345.0113.060.4
Long An5111.8939.0319.315.05554.11030.8234.3168.9
Kien Giang5621.11287.0387.515.66667.5431.1362.158.5
Soc trang3492.1819.177.312.33209.4848.992.99.3
Tien Giang1997.91,038.761.717.71864.31025.427.277.7
Tra Vinh2138.6485.710.93.72020.9431.631.55.6
Vinh Long1832.6374.10.011.41249.1457.70.060.8
(*) Hau Giang Province was established in 2004, by separation from the Can Tho province.
Table 8. A summary of land use areas in 2005 and 2014 derived from Landsat-7 scene on 20 January, 2005 and Lansat-8 scene on 21 January, 2014 [62].
Area of Land-Use Types (km2)In 2005In 2014
Paddy land, land for cultivation of annual crops16,127.115,105.9
Land for cultivation of perennial trees6686.85262.2
Aquaculture land1885.02110.3
Forest land1492.6866.2
Water surface1201.61084.1
Others573.43537.7
Total27,966.427,966.4

