Article

An Airport Knowledge-Based Method for Accurate Change Analysis of Airport Runways in VHR Remote Sensing Images

Key Laboratory of Environmental Change and Natural Disaster of Ministry of Education, Faculty of Geographical Science, Beijing Normal University, Beijing 100875, China
*
Author to whom correspondence should be addressed.
Remote Sens. 2020, 12(19), 3163; https://doi.org/10.3390/rs12193163
Submission received: 1 September 2020 / Revised: 25 September 2020 / Accepted: 25 September 2020 / Published: 26 September 2020
(This article belongs to the Section Remote Sensing Image Processing)

Abstract

:
Due to the complexity of airport background and runway structure, the performances of most runway extraction methods are limited. Furthermore, at present, the military fields attach greater importance to semantic changes of some objects in the airport, but few studies have been done on this subject. To address these issues, this paper proposes an accurate runway change analysis method, which comprises two stages: airport runway extraction and runway change analysis. For the former stage, some airport knowledge, such as chevron markings and runway edge markings, are first applied in combination with multiple features of runways to improve the accuracy. In addition, the proposed method can accomplish airport runway extraction automatically. For the latter, semantic information and vector results of runway changes can be obtained simultaneously by comparing bi-temporal runway extraction results. In six test images with about 0.5-m spatial resolution, the average completeness of runway extraction is nearly 100%, and the average quality is nearly 89%. In addition, the final experiment using two sets of bi-temporal very high-resolution (VHR) images of runway changes demonstrated that semantic results obtained by our method are consistent with the real situation and the final accuracy is over 80%. Overall, the airport knowledge, especially chevron markings for runways and runway edge markings, are critical to runway recognition/detection, and multiple features of runways, such as shape and parallel line features, can further improve the completeness and accuracy of runway extraction. Finally, a small step has been taken in the study of runway semantic changes, which cannot be accomplished by change detection alone.

Graphical Abstract

1. Introduction

Due to its significance in both civil and military fields, the airport has gained increased attention in recent years [1,2] and methods for detecting and extracting airports have been widely developed, such as methods based on visual saliency [3,4,5,6,7,8] and methods based on deep learning [2,9,10,11]. Meanwhile, runways play a fundamental role among the facilities of an airport and are considered to be the most important feature in airport detection [3,12]. However, the vector or raster data of runways are difficult to obtain, because these data are managed mainly by government sectors or military institutions. In addition, the overall accuracy on runway detection and extraction were limited in existing research. Furthermore, with the construction, reconstruction, and expansion of airports around the world, major changes have taken place in airports, such as the construction and movement of runways, the construction of terminal buildings and aprons, and so on. Although these changes, especially semantic changes of runways, can support decision for relevant departments, the research on airport runway change analysis was rarely explored, because the accuracy of some existing change detection methods [13,14] was not very high and these methods mainly focused on changes of general objects, such as forest into farmland, rather than finer changes within a typical object.
On the one hand, the increasing availability of very high-resolution (VHR) optical satellite images provides an opportunity to characterize and identify location and spatial information of runways in an airport more clearly but brings in more complex background information, including taxiways and aprons, road, and farmland. Naturally, these background objects with similar characteristics to the runway bring great challenges to runway detection and extraction. This paper divides the research in runway detection and extraction into three categories: based on basic characteristics of runways such as line feature [15], texture feature [12,16], etc.; based on airport knowledge [17]; and based on computer vision and deep learning methods [18]. Generally, the first type of method is the most commonly used method in runway detection and extraction, because these basic features are most prominent in high resolution images. However, this method may lead to a high false detection/extraction rate due to insufficient knowledge of airport. In recent years, deep learning methods have been widely applied in various fields, such as aircraft detection, runway extraction, and so on. Although the accuracy of runway detection/extraction is increased, further improvements of this method are usually limited by the lack of publicly enormous and various VHR runway datasets and time-consuming manual marking of runway data samples.
On the other hand, the method of change detection using remote sensing (RS) data exerts great influence in detecting changes on the Earth’s surface and has been applied in many fields [19], especially the field of land use/land cover (LULC) change [20,21]. Furthermore, change detection has made great progress from using traditional methods, such as Markov Random Field (MRF) [13], Conditional Random Field (CRF) [22], Level Set [23], Random Forest (RF) [14,24], and other methods [25], to using deep learning methods [26,27]. However, detecting airport runway changes is not easy because: (1) there is a lack of public RS datasets of runway changes; (2) the complex background of airport runways, such as farmland, rivers, terminal buildings, aprons, etc., makes it difficult to identify runway changes from various changes; and (3) change detection methods may perform not well in the case where movements of airport runway ends change, but the location and orientation of runways are almost unchanged.
Therefore, to obtain accurate results of airport runway changes, the main idea and contribution of this paper can be summarized from three aspects: (1) building a systematic airport knowledge base to understand spatial definition, characteristics, and change types of runways; (2) proposing an accurate runway extraction method using multiple techniques and algorithms, such as saliency analysis, line segment detection, grayscale template matching of the chevron markings, runway edge line grouping, and so on; and (3) obtaining semantic information and vector results of runway changes by implementing runway change analysis according to runway extraction results of bi-temporal airport images. Eventually, six VHR airport images with different background objects and runway structures were selected to test the effectiveness and accuracy of runway extraction, and two sets of airport images taken at different times were used to validate the final accuracy of our method.
The rest of this paper is organized as follows. In Section 2, we first introduce the airport knowledge base, then the proposed methods of runway extraction and runway change analysis are introduced in detail, and, finally, datasets and evaluation metrics are illustrated explicitly. The parameters used in experiments, experimental results and comparison with state-of-the-arts are presented in Section 3. Key and difficult points about our method and some limitations are discussed in Section 4. We conclude the paper with some important findings and our future work in Section 5.

2. Materials and Methods

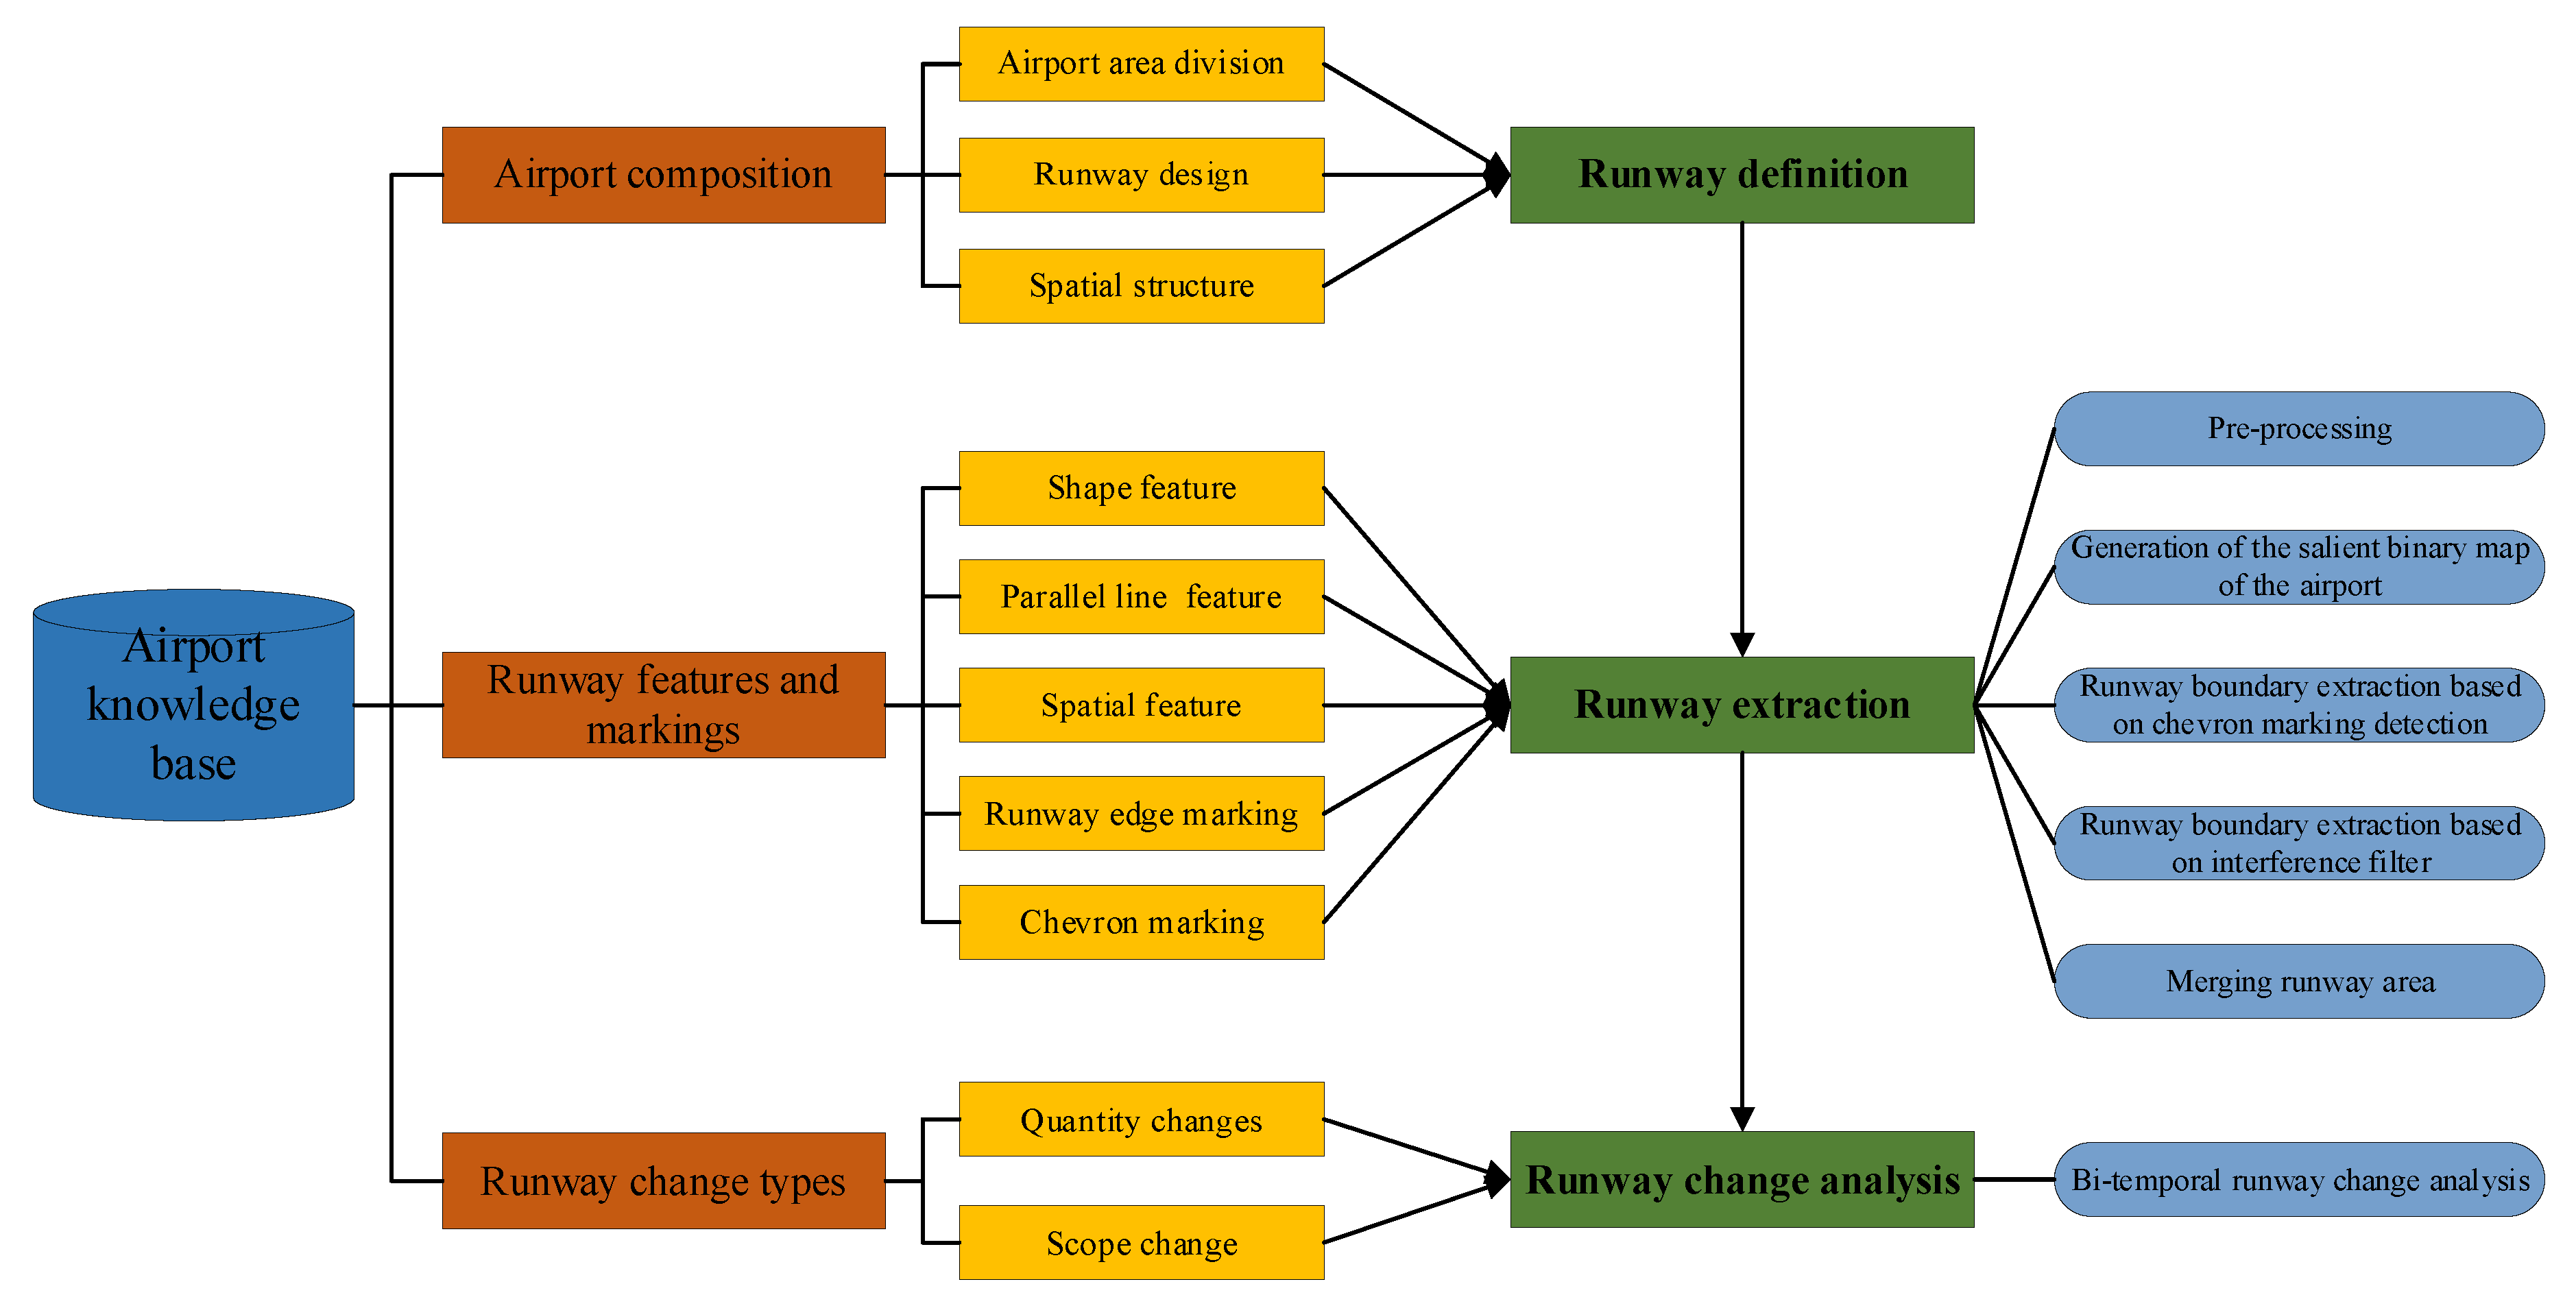
2.1. The Airport Knowledge Base

The airport knowledge base mainly consists of airport composition, runway features and markings, and change types of airport runway. Airport area division, runway design, and the spatial structure between the runway and other airport parts are included in airport composition to better understand runway definition. Moreover, to improve the accuracy of runway extraction, some important runway features and markings are summarized, and runway change types matched with real situation are also included in the airport knowledge base to obtain the vector results and semantic information of runway changes. Finally, the main steps of runway extraction and runway change analysis are presented to help understand the methodology of this study. The overall structure of the airport knowledge base is illustrated in Figure 1.

2.1.1. Airport Composition

Normally, the airport consists of the flight area, the terminal area, and the ground transportation area. The flight area is the area of aircraft activity and composed of the air part and the ground part; the former refers to the airspace of the airport, while the latter includes runways, taxiways, aprons, boarding gates, and facilities and venues used to provide aircraft maintenance and air traffic control services. The terminal area consisting of terminal buildings and boarding aprons combines ground traffic with air traffic, and the ground transportation area includes special highways, subways, rail transportation lines from the urban area to the airport, parking lots, and so on.
According to the airport design specification in USA [28], the runway is a rectangular area on the land airport that has been trimmed for aircraft landing and departures. In general, the runway should be long enough to offer aircraft operation for take-off, landing, accelerating, and so on. For runway ends, approach and departure surfaces should remain clear of obstacles, including aircraft, and runway markings are necessary, in order to prevent aircraft operational restrictions. In addition, the primary runway should be oriented in the direction of the prevailing wind, and the number of runways should be sufficient to meet air traffic demands and it may be also affected by the need to overcome environment impacts or minimize the effects of adverse wind conditions. Complying with the wind vector diagram, directions of runways are valued between 0 and 180 degrees with an interval of 10 degrees.
Furthermore, there exists a certain spatial structure between runways and other components of the airport. Firstly, one or more runways are constructed in the airport, and one side of the runway is the taxiway, which is connected with the runway by taxiway intersections. Secondly, the runway is separated from the terminal building and the parking apron by a certain vertical distance (between 150 and 200 m) and they are connected by taxiways.

2.1.2. Runway Features and Runway Markings

The runway is the most salient object in high-resolution remote sensing images. To extract runways from these images automatically or semi-automatically, some runway features can be utilized, such as line feature, shape feature, spatial feature, as summarized in Table 1 according to airport design standards.
In the light of runway surface marking scheme [29], the runway is painted with different surface markings to provide instruction for aircraft operations, Figure 2 and Table 1 illustrate eight important surface markings for airport runways. Importantly, runway start is flexible, because the runway threshold marking identifies the end of runway when the runway displaced threshold marking exists not. On the contrary, the place of disappearance of runway edge marking represents the start of runway when the runway edge marking is located in the displaced area. Moreover, in reality, except the chevron marking for runways is yellow, the rest runway markings are white. Meanwhile, the direction of all runway markings is consistent with the runway orientation.

2.1.3. Runway Change Types

Airport runway changes can be divided into two categories: changes in the quantity and changes in the scope of runways because of runway increase and runway decrease. The quantity changes of runways mainly refer to changes of runway position, and the other one indicates that runways extend or shorten while the location of runways is almost unchanged.

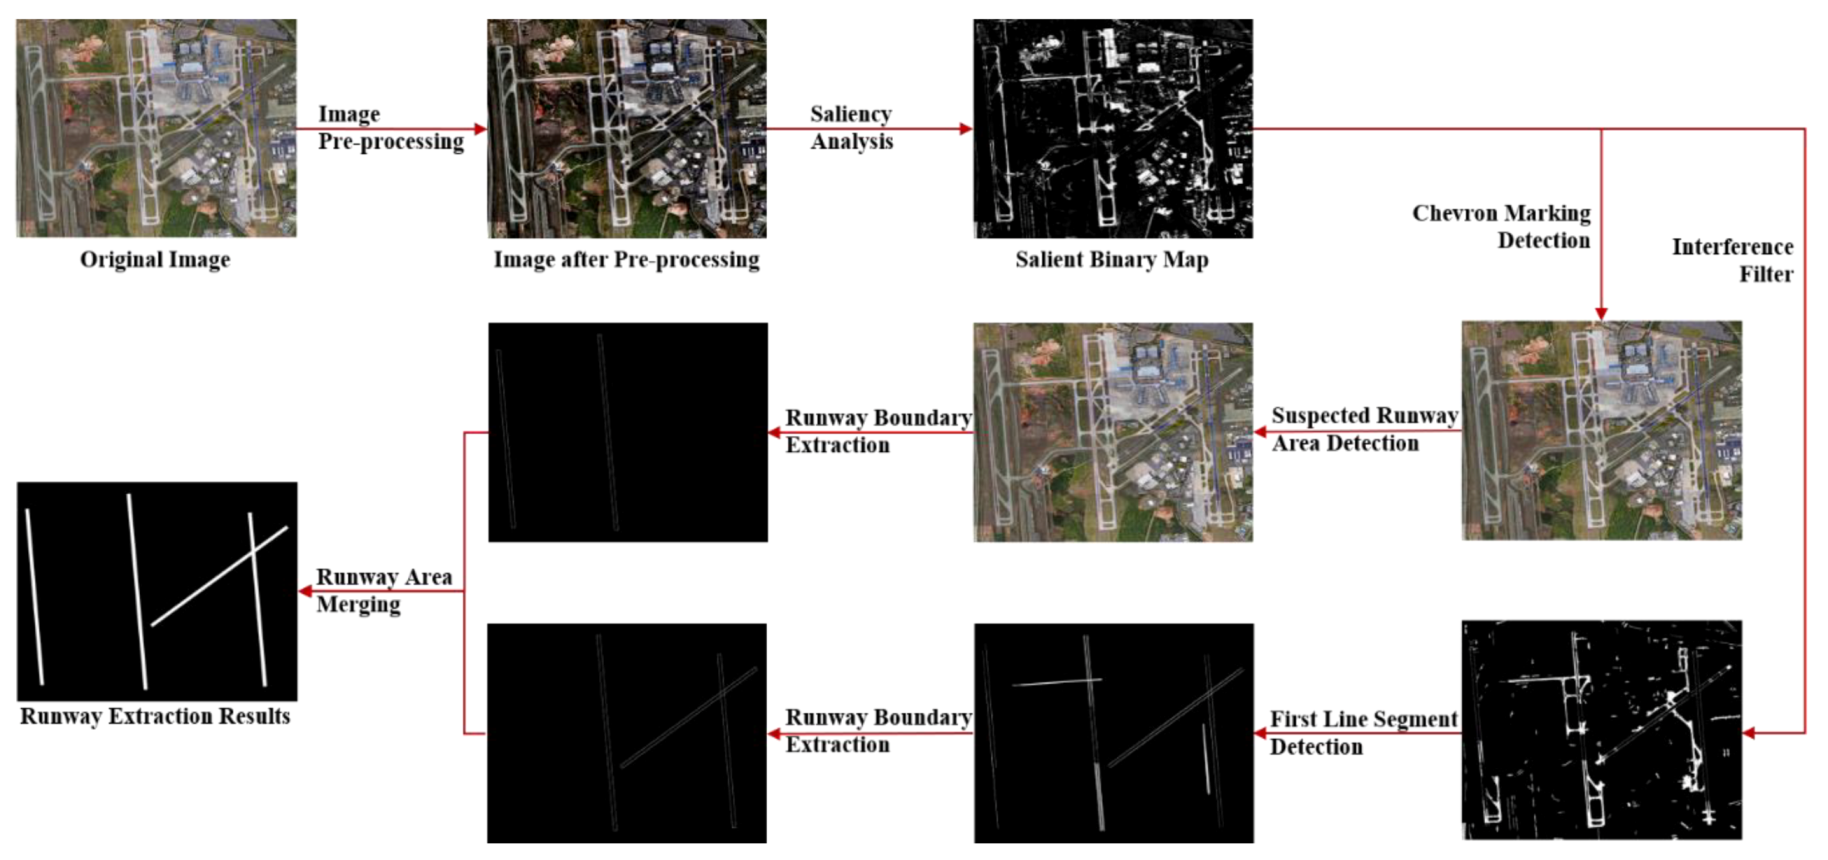
2.2. Runway Extraction

As the most important part of our method, runway extraction mainly involves three basic techniques (Figure 3): visual saliency analysis, grayscale template matching and line segment detection. To extract airport runways more accurately, shape features of runways and parallel line segment grouping are also employed.

2.2.1. Pre-Processing

Affected by the shooting time and shooting angle, the overall brightness of VHR remote sensing image may be high, which can cause runway markings to be inconspicuous and affect subsequent runway detection and extraction. To make runway markings more salient, brightness equalization and brightness adjustment of images are conducted before saliency calculation. To be more specific, a contrast limited adaptive histogram equalization (CLAHE) method is adopted for the brightness histogram of the HLS color space of the airport image, and the brightness adjustment is completed by using the gamma adjustment method.

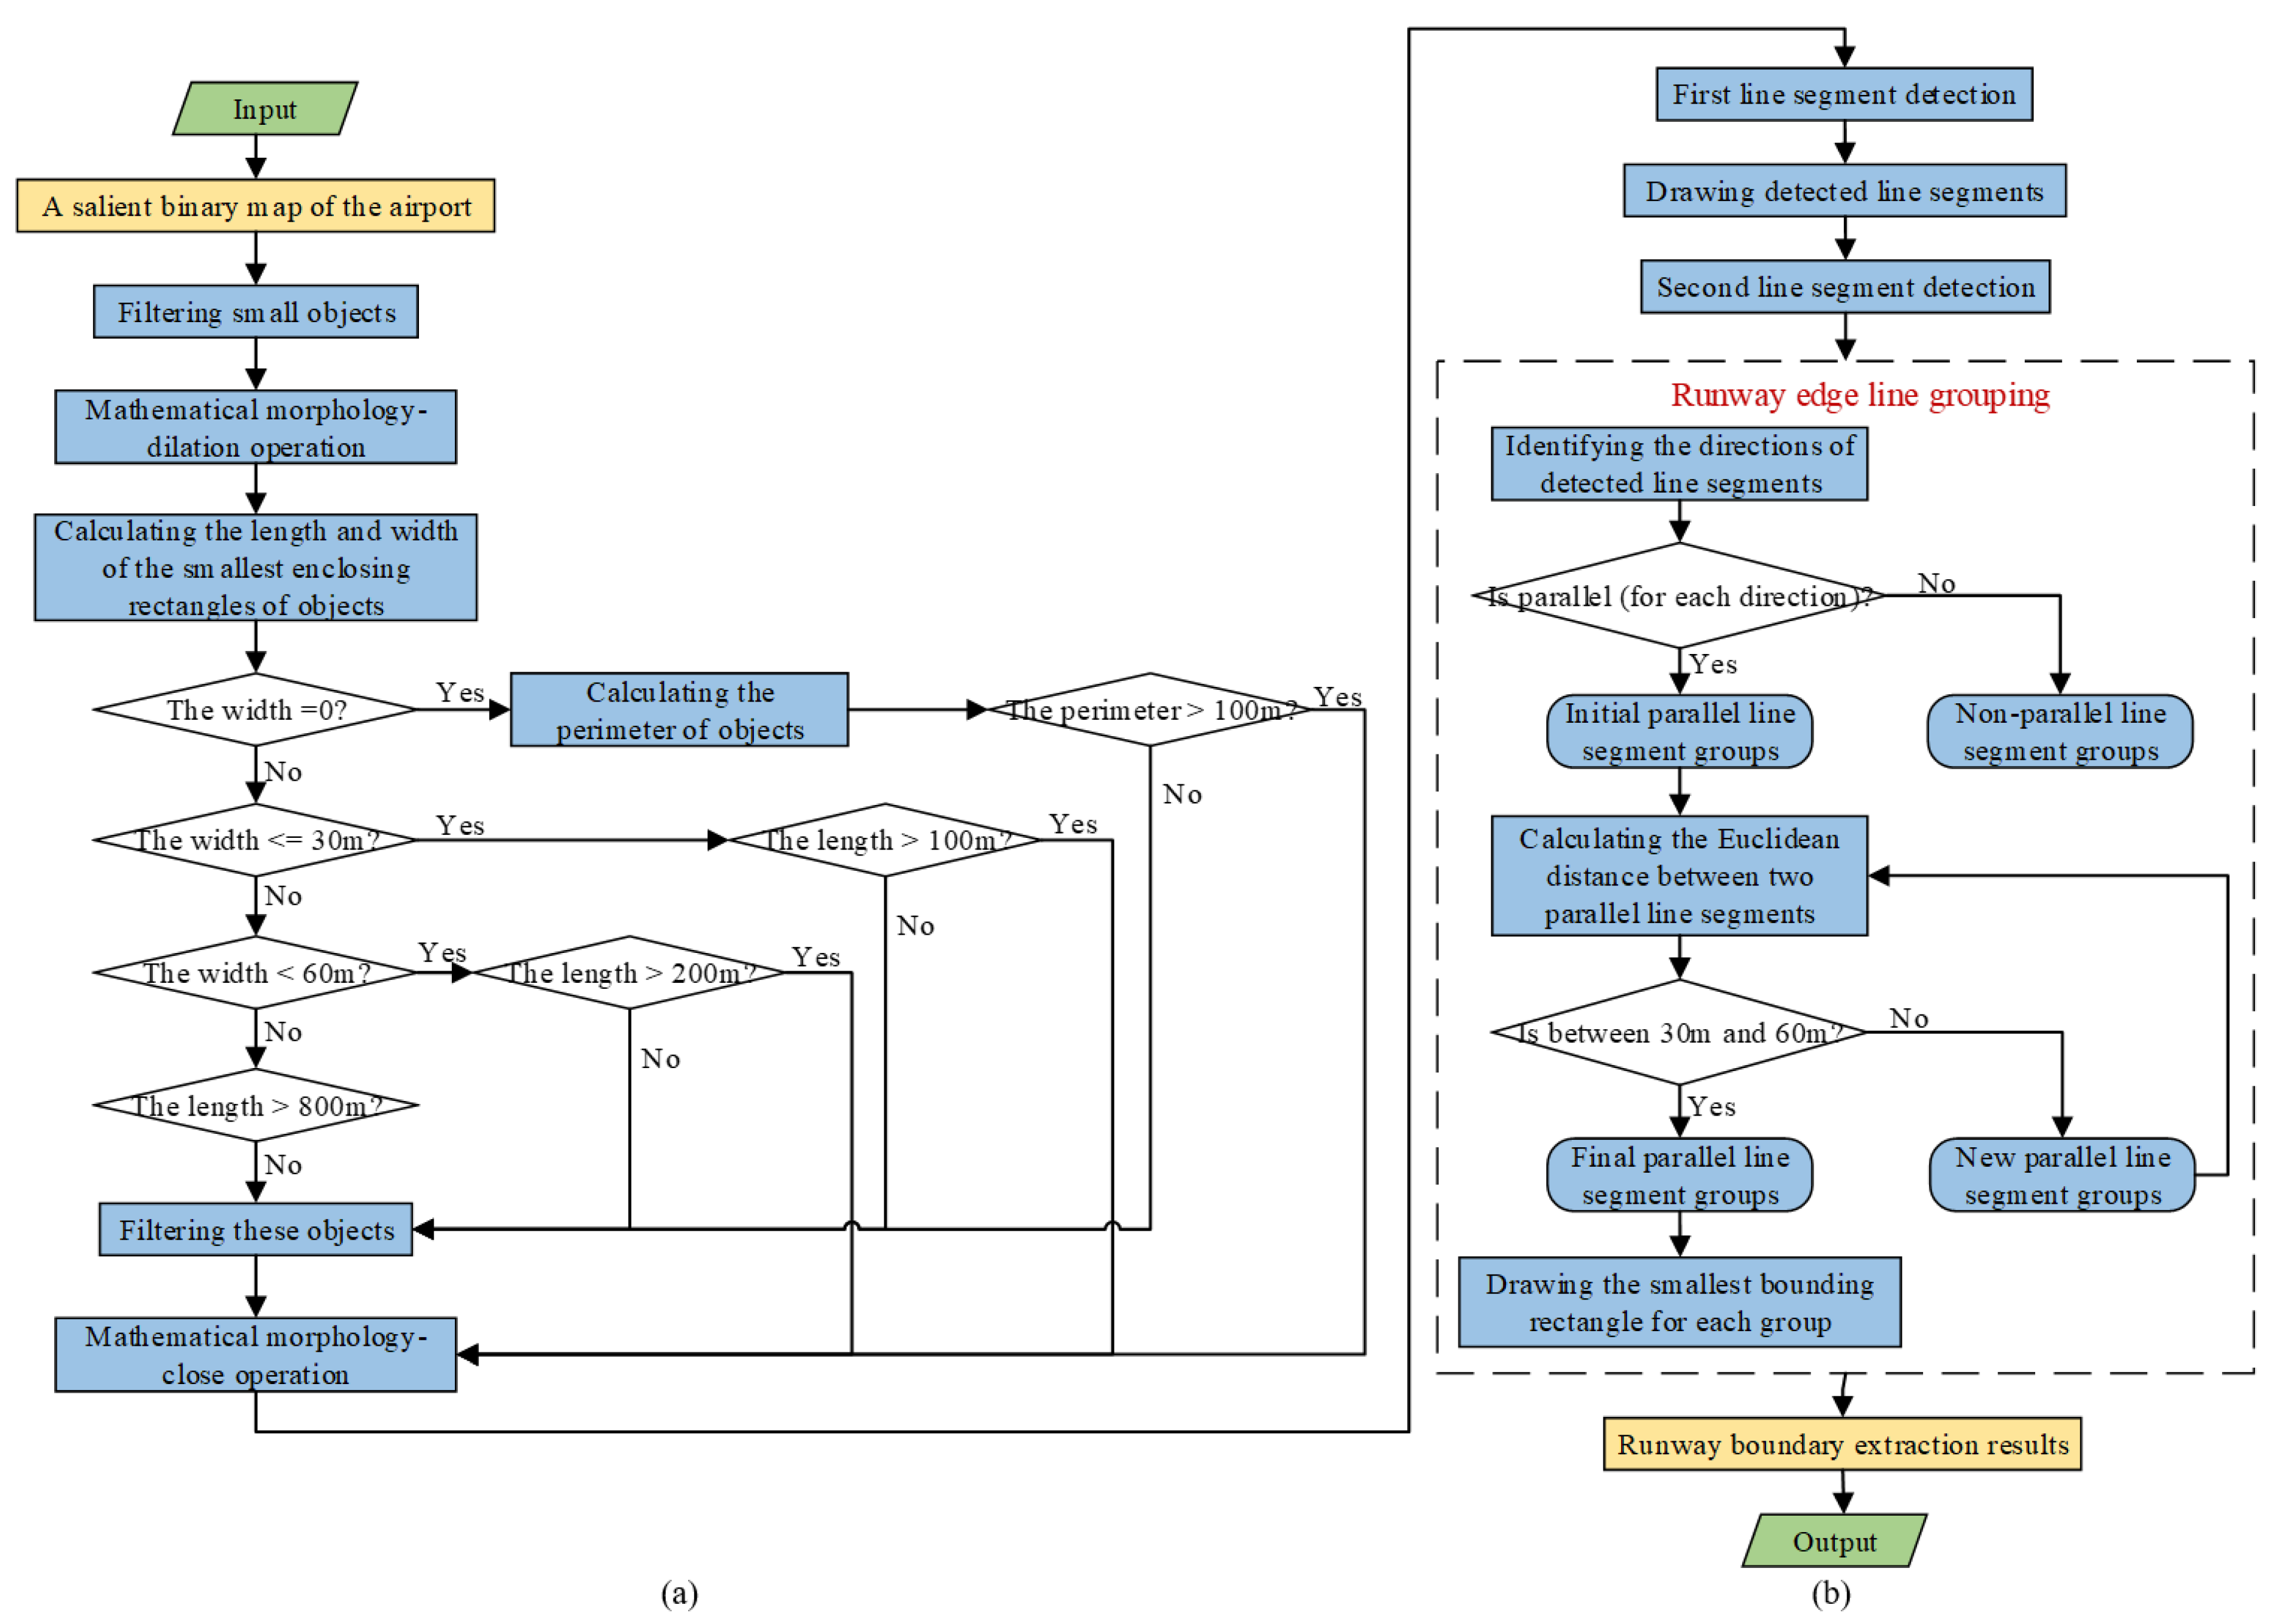
2.2.2. Generation of the Salient Binary Map of the Airport

The frequency-tuned (FT) saliency detection model [30] is an efficient saliency calculation method based on frequency domain analysis. It not only can effectively detect salient objects in the image, but also has a fast rate in saliency calculation. However, the FT method usually attaches great importance to low-frequency information of images and ignores high-frequency information, namely edge and detail information of images. It may cause grayscale information of runway markings in the airport image to be incomplete if the FT method is applied directly to generate the saliency map of airports. Thus, the process of Gaussian filter is removed when calculating the saliency of the airport image and the calculation method of the saliency of each pixel in the airport image is illustrated in Equation (1). After that, the saliency map of airports can be obtained by normalization of the saliency of all pixels.
S ( p )   = I μ I c ( p )
where I μ is the mean pixel value of the airport image in the CIELAB color space, I c ( p ) is the corresponding image pixel vector value of the CIELAB color space of the same image, and ‖ ‖ is the L 2 norm, namely the Euclidean distance.
Finally, the Otsu threshold segmentation method is adopted after the generated salient map, because the Otsu method is very useful and efficient for distinguishable images between the target and the background.

2.2.3. Runway Boundary Extraction Based on Chevron Marking Detection

The chevron marking has significant grayscale characteristic in the salient binary map of the airport, and the width of the marking is similar to the width of runways, equal to 30, 45, or 60 m. Moreover, the number of chevron stripes is at least 2, and the spacing between two chevron stripes is fixed, about 15 or 30 m. Thus, grayscale template matching was incorporated to detect the chevron marking for runways. Furthermore, the Mean-shift clustering algorithm was applied to make the results of grayscale template matching of chevron markings more accurate. The whole process of the chevron marking detection is illustrated in Figure 4.
The first step is to make grayscale templates of the chevron marking (Figure 5). Specifically, the clear and complete chevron markings with different width and different spacing between two chevron stripes, were selected and clipped from VHR remote sensing images of the airport, and then each grayscale template of the chevron marking was made by gray processing and Otsu threshold segmentation. Given that inappropriate sizes of grayscale templates may cause subsequent template matching to fail, templates and salient binary maps of airports should come from the original airport images with same spatial resolution and should be scaled at the same scale. To avoid repetition of grayscale templates of the same size in different directions, the templates were uniformly saved horizontally to the right. Some common grayscale templates of the chevron marking were prepared, as shown in Figure 5.
Secondly, in order of the width of the chevron marking and spacing from largest to smallest, slide the template in the salient binary image of the airport, respectively, and finally stop changing templates until the current template matching succeeds or all fail. Here, the template matching method is slightly adjusted based on normalized cross-correlation coefficient (NCC), where T ( x , y ) and S ( x + m , y + n ) denote the gray level at a pixel in the sliding window and the salient binary image of the airport and μ ( T ) is the mean gray value in the sliding window centered on the pixel ( x , y ) . μ ( S ) is the mean gray value of the corresponding area of the sliding window in the salient binary image of the airport. Equation (2) illustrates the basic definition of the NCC method. For two adjustments: (1) during template matching, rotate the template from 0° to 355° with a rotation interval of 5°; and (2) the sliding window is the smallest positive bounding rectangle after the template is rotated by a certain angle, and the sliding size of the sliding window in the horizontal and vertical directions is adjusted to 0.1*(the length/width of the sliding window) in order to increase the accuracy and speed of template matching.
N C C ( m , n )   =   x y ( T ( x , y ) μ ( T ) ) ( S ( x + m , y + n ) μ ( S ) ) / x y ( T ( x , y ) μ ( T ) ) 2 x y ( S ( x + m , y + n ) μ ( S ) ) 2
Lastly, the Mean-Shift clustering algorithm [31] is applied to cluster the center points of the template matching results, so as to remove duplicate template matching results and achieve precise matching of grayscale templates of the chevron marking. To speed up the clustering of sample points, the initial kernel position is not the position of all sample points, but the discrete positions of the sample points, where the sample points are classified on a grid whose roughness corresponds to the bandwidth. The sample point nearest to the clustering center is assigned to the center point of final matching of grayscale templates by calculating the Euclidean distance from the center of each cluster to each sample point of the cluster, because the clustering point obtained by the Mean-Shift clustering algorithm is the mean of all samples belonging to the cluster, rather than the real sample point. For convenience of subsequent runway boundary extraction, the template matching results was marked by using bounding boxes, and the template position information was recorded, including the center-point coordinates of the template and the rotation angle of the initial template.
On the other hand, line segment detection is indispensable in the process of runway boundary extraction. To make full use of the direction information obtained in the chevron marking detection and detect more line segments with short gap, the Probabilistic Hough Transform algorithm [32] was utilized. Generally, the algorithm consists of the following steps: (1) Check the input image and end if it is empty. (2) Randomly select edge points from the input image and update the accumulator. (3) Delete the selected edge point from the input image. (4) Check whether the peak value of the accumulator space calculated by the new edge point is higher than the threshold; if not, go back to Step (1). (5) Search line segments along the channel referred by the peak value in the accumulator space and find that longest line segment is either continuous or the gap between line segments does not exceed a given threshold. (6) Delete the component pixels of line segments on the input image. (7) “Cancel voting” for all pixels of the previously voted line segment in the accumulator space. (8) If the length of the line segment is greater than the minimum length threshold of the line segment, it is also added to the output result. (9) Go back to Step (1). Notably, there are at least three thresholds that we need to set when using the Probabilistic Hough Transform algorithm: the threshold of the number of points composing a line segment in the accumulator space, the minimum length threshold of the line segment, and the maximum gap threshold between line segments.
In the first stage of runway boundary extraction, the suspected runway area was detected based on the results of chevron marking detection and spatial feature of the chevron marking, such as axial symmetry and spatial distance feature. More precisely, if two bounding boxes of the results of chevron marking detection are axisymmetric and the Euclidean distance between two boxes is longer than 800 m, then the rectangle whose centerline is the connecting line between the center points of two bounding boxes and whose width is set to 80 m is marked as the suspected runway area.
In the second stage, before line segments were detected by Probabilistic Hough Transform, small objects whose area is less than 10 pixels was removed to reduce interference of small objects around the runway edge. The relationship between the direction of line segment detection θ and the direction of template matching of the chevron marking θ is illustrated in Equation (3). Next, if the two end points of the detected line segment are located in the suspected runway area, then the runway boundary can be obtained by using the smallest bounding rectangle to enclose the detected line segments. The sample graph of the process of runway boundary extraction is shown in Figure 6.
θ   =   { π 2 θ ,             θ ϵ [ 0 ,   π 2 ) 3 π 2 θ ,           θ ϵ [ π 2 , 3 π 2 ) 5 π 2 θ ,               θ ϵ [ 3 π 2 , 2 π )
where the vertex of the upper left corner of the airport image is the origin, horizontal to the right is the positive direction of the x-axis, and vertical downward is the positive direction of the y-axis. θ denotes the rotation angle of the chevron marking template from the positive direction of the x-axis. θ represents the angle between the perpendicular from the origin to the line segment in the accumulator space and the positive direction of the x-axis.

2.2.4. Runway Boundary Extraction Based on Interference Filter

Lack of the suspected runway area as the spatial reference of runways, the shape feature of runway was combined with line segment detection based on the Probabilistic Hough Transform algorithm to identify the runway edge. Moreover, the parallel line feature of runway edges was utilized to improve the accuracy of runway boundary extraction. The implementation process of runway boundary extraction based on interference filter is presented in Figure 7.
The first step was interference filter, which consisted of rough filtering using the area threshold and math morphological processing, fine filtering based on the specific conditions, and fine adjustment using math morphological processing again. Taking the salient binary map of the airport (about 0.5 m spatial resolution) as an instance, firstly, filtering small objects whose area is less than 50 pixels, and then the math morphologic and dilation calculations of a 3 × 3 square kernel were adopted to make runway edge markings more complete and salient. Secondly, further filtering was completed and objects remained if they satisfied any of the following conditions: (1) the perimeter of line segment is more than 100 m; (2) the width of the smallest enclosing rectangles of objects is no more than 30 m and the length of that is more than 100 m; (3) the width is between 30 and 60 m and the length is more than 200 m; and (4) the width is more than 60 m and the length is more than 800 m. Those objects not meeting all of the above conditions were considered as interference to be filtered. Lastly, the math morphologic and close calculations of the same size kernel as the first time were applied to connect small gaps of runway edges.
The second step was runway boundary extraction. For the rest objects after interference filter, the Probabilistic Hough Transform algorithm was applied twice to detect line segments of runway edges and runway boundary extraction was completed based on runway edge line grouping. Notably, runway edge line grouping here also utilized the spatial distance feature of runway edges other than parallel feature. For the directions of detected line segments, if the difference value of them was within 0.05 radian, then the mean of these directions would be saved as the suspected runway orientation. According to each direction of suspected runways, all line segments approximately parallel to it were grouped as the initial parallel line segment group. Moreover, for all line segments in new parallel line segment groups, the Euclidean distance between two of them was calculated, and line segments were classified into final parallel line segment groups if the distance was between 30 and 60 m, and the rest were again grouped into new parallel line segment groups. Otherwise, the iteration ended when none of line segments in new parallel segment groups could be divided into the final parallel line segment group or the new parallel line segment group was empty.

2.2.5. Merging Runway Area

To improve the completeness of runway extraction, both results of runway boundary extraction were merged. Given that the results of two runway boundary extractions might overlap and the confidence of runway boundary extraction results based on chevron marking detection was higher, it was determined whether the runway boundary extraction results based on interference filter should be added by calculating IOU (which is referred to Intersection over Union; more specifically, it is Intersection of the true bounding box and the predicted bounding box of an object over Union of that, and widely applied in object detection based on deep learning) of two runway boundary from different runway boundary extraction results and the Euclidean distance between center points of them. The calculation method of IOU in this text is illustrated by Equation (4). For each runway boundary in the latter runway boundary extraction, if the value of IOU was within 0.005 and 0.05, or the value was equal to 0 but the distance was longer than 120 m, then the runway boundary was merged. To illustrate the process of merging runway boundary more clear, the example is presented in Figure 8. Eventually, the 8-neighbor flood inundation and filling algorithm was used to fill the interior of all runway boundaries after merging runway boundary, and runway extraction was finished. For convenience of subsequent change analysis of runways, the binary map of runway extraction was converted to the shapefile using ArcMap software.
I O U   =       I n t e r s e c t i o n   o f   each   r u n w a y   b o u n d a r y   o b t a i n e d   i n   t w o   r u n w a y   b o u n d a r y   e x t r a c t i o n   U n i o n   o f each   r u n w a y   b o u n d a r y   o b t a i n e d   i n   t w o   r u n w a y   b o u n d a r y   e x t r a c t i o n

2.3. Runway Change Analysis

According to runway change types, the results of bi-temporal runway extraction were comparatively analyzed to obtain the vector results and semantic information of runway changes (Figure 9).
Firstly, runway changes could be determined by calculating IOU of runway extraction results of temporal airport images. Next, to further determine runway change types, the overlap rate of runway increase and runway reduction was calculated, defined by Equations (5) and (6). The semantic information of runway changes was obtained. For example, the number of runways was considered to change if the overlap rate was larger than the corresponding threshold; otherwise, the scope of runways changed. Furthermore, the vector result of runway increases or runway decreases referred to the difference between the intersection of two-temporal runway extraction and runway extraction results in the new or old phase.
O v e r l a p   r a t e   ( i n c r e a s e )   =   R u n w a y   e x t r a c t i o n   r e s u l t s ( n e w ) I n t e r s e c t i o n R u n w a y   e x t r a c t i o n   r e s u l t s ( n e w )
O v e r l a p   r a t e   ( r e d u c t i o n )   =   R u n w a y   e x t r a c t i o n   r e s u l t s ( o l d ) I n t e r s e c t i o n R u n w a y   e x t r a c t i o n   r e s u l t s ( o l d )

2.4. Datasets and Evaluation Metrics

2.4.1. Datasets

In this study, multiple experimental areas were selected to test the effectiveness and accuracy of the proposed runway change analysis method. Experimental datasets downloaded from Google Earth, with a spatial resolution of about 0.5 m, consisted of two parts: six test images of airports for runway extraction and two sets of test images of airport for runway change analysis, as shown in Figure 10, Figure 11 and Figure 12.
In all test data, the airport represented by Image 7 is a military airport, the airports of Images 1, 3, 6, and 8 are military–civilian airports, and the rest are civil airports. Another important reason these experimental areas were selected is due to consideration of geographical diversity, such as rivers, farmland, road networks, buildings, and so on, and complexity of runway structure, including single runway (Image 1), parallel runway (Images 2–8), V-shaped runway (Image 5), and X-shaped runway (Image 6). Runway extraction may lead to false extraction or missed extraction of airport runways because those background objects appear similar to runways in terms of shape feature and the complexity of runway structure interferes the shape of the runway itself, such as the length-width ratio. For runway change analysis, two sets of test data with different change types of runways were selected and, in Okinawa Naha Airport images, a new runway was being built but had not been completed to present high sensitivity of the proposed method.

2.4.2. Evaluation Metrics

The performance of the proposed runway extraction and runway change analysis methods was evaluated by quantitatively comparing with the ground truth data in terms of completeness (the ratio of true projection to ground truth), correctness (the ratio of true projection to total projection), and quality (the ratio of true projection to the sum of ground truth and false projection) defined as follows:
Completeness   =   T P T P + F N
Correctness   =   T P T P + F P
Quality   =   T P T P + F P + F N
where TP and FP represent the total number of pixels in the area of runway extraction or runway change analysis results that are consistent and inconsistent with the ground truth data, respectively, and FN is the sum of all pixels in the area of ground truth data that are unmatched with runway extraction or runway change analysis results. The ground truth data were obtained from manual digitization and rasterization of all test images by the software ArcMap 10.3.

3. Results

3.1. Experimental Parameters

Due to the large size of airport images, the salient binary map of the airport was downscaled to about 1 m spatial resolution to improve the speed of subsequent runway extraction. To get more accurate results of runway extraction, the similarity threshold T for grayscale template matching of the chevron marking for runways in Section 2.2.3 and length thresholds L1 and L2 for line segment detection based on Probabilistic Hough Transform in Section 2.2.4 needed to be tuned in this study. Image size and parameters used in each airport image are shown in Table 2.
The similarity threshold T decides the effect of the chevron marking detection and the direction of line segment detection in subsequent runway boundary extraction. A relatively small value of T can detect more chevron markings which indicate the position and orientation of runways, but it may detect more false chevron markings and reduce the accuracy of runway extraction. However, a larger value of T may lead to missed detection of chevron markings and missed extraction of runways eventually. Generally, for better effects of template matching of chevron marking, the threshold T was no less than 0.4. As for length thresholds L1 and L2, they can both adjust the minimum length of detected line segments and assisting line segment connection with other fixed thresholds, such as the minimum threshold (100) of collinear points in the accumulating space and the maximum threshold of the gap between two line segments. In some airports, the runway edge marking is not complete and continuous, so the maximum threshold of the gap in two line segment detection was set to 75 and 25 m, respectively. Furthermore, the length threshold L1 was set to 200 m to detect more line segments of runway edges and connected those interrupted line segments. However, the smaller value of L1 may detect line segments of background objects with line feature; thus, in general, the length threshold L1 was set to 400 m. The length threshold L2 aimed to detect more complete runway edge lines, so L2 was set to be 800 m, which is the minimum length of airport runways. In a few cases, such as Images 3, 6, and 7, background objects have salient line feature and shape feature similar to that of runways, so L2 was set to 1200 m, the minimum length of common airport runways.

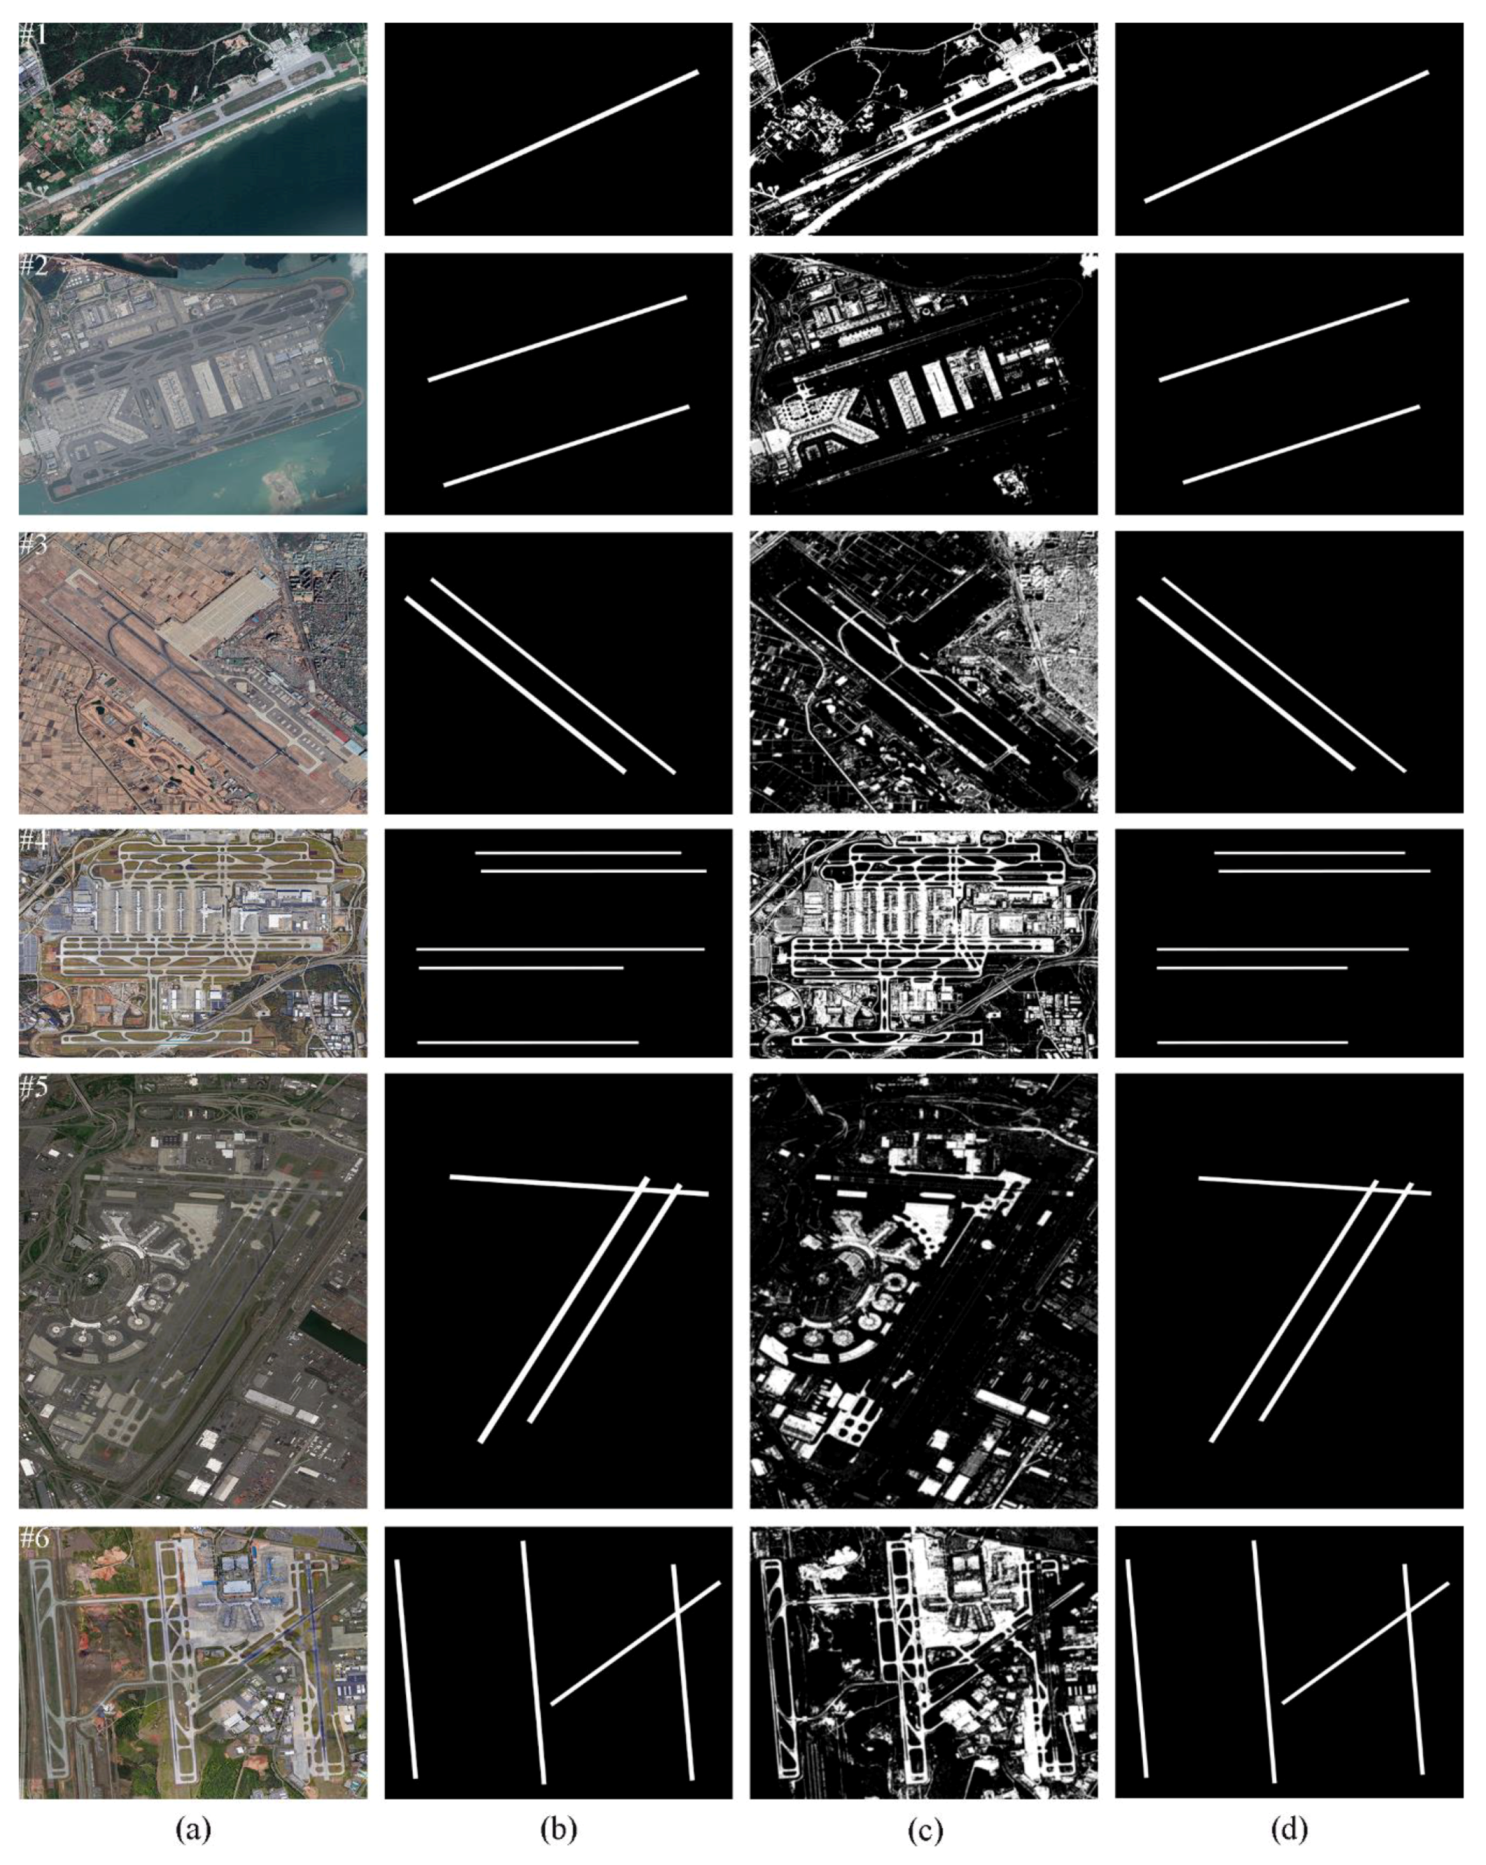
3.2. Experimental Results and Comparison with State-of-the-Arts

In this study, all experiments were implemented by Python 3.5.6 on a notebook computer with Intel Core i7-8550U 1.80GHz CPU, 8G RAM, and Windows 10 operating system. To validate the performance of the proposed method on a variety of test images, we divide the runway change analysis experiment into two parts, namely Experiments I and II. The former mainly focused on the accuracy and efficiency of the proposed runway extraction method, and the latter attached more importance to the advantages of our runway change analysis method over common change detection methods.

3.2.1. Experiment I

The results of the proposed runway extraction method for Test Data 1–6, comparison results, and ground truth data are illustrated in Figure 10. The quantitative results and the computing time of the proposed method and state-of-the-art method [15] for each test image are respectively given in Table 3, Table 4 and Table 5.
From chevron marking detection results in Figure 10a, most of chevron markings for runways are detected accurately although some are missed, such as Image 6, and some are matched imperfectly, such as Images 4 and 5. The reason for missed detection may be the absence of corresponding grayscale templates of chevron markings, whereas the mismatching is largely due to the existence of the interference surrounding chevron markings or geometric distortion in the test image. Fortunately, the proposed runway extraction method is robust and runway boundaries can be still extracted even if chevron marking detection results are not fully consistent with the positions of real chevron markings. Furthermore, thanks to runway boundary extraction based on interference filter, airport runways are extracted more completely in the condition of missed detection of chevron markings.
In general, the completeness of our proposed method is very high, although part of runway shoulders and stopways for runways are also extracted. In Images 2, 3, and 6, the quality of runway extraction is above 90%, while the correctness of the proposed method for Images 1, 4, and 5 is not as good as that of previously mentioned images. In particular, for Images 3 and 5, their quality is the highest at 92.9% and the lowest at 78.8%, respectively, as shown in Table 3. The main reason that the proposed method in Images 1 and 5 behaves not well is due to the mathematical morphological processing in runway boundary extraction based on interference filter, which makes extracted runway boundary wider than real runway boundary. For Image 4, the smallest gap of line segment detection in runway boundary extraction based on chevron marking detection is larger than the spacing between two chevron marking stripes; thus, part of stopways painted with chevron markings are extracted.
Compared with the state-of-the-art method [15], which aims at airport runway extraction from high-resolution images based on line-finder level set evolution, the correctness of our method is much higher and our method is more effective and robust. As can be seen in Figure 7c, many non-runway objects, such as taxiways, boarding aprons, terminal buildings, and so on, are also extracted. Moreover, except for Images 1, 4, and 6, the completeness of runway extraction in other images is very low due to the low brightness of runway areas or the great brightness difference between runway areas and surrounding areas. Thus, runway extraction using only one or two features of runways is impractical and not robust.
Furthermore, as can be seen in Table 5, the computing efficiency of our method is higher than that of state-of-the-art method [15], although the size of test images is very large. The main reason that the computing performance of [15] is not good is because time complexity of the methods based on level set evolution is nonlinear, and it is also affected by the image brightness or image grayscale which are distributed uncertainly. In addition, comparatively, our method is more automatic because using the method [15] may require manual assistance to find runway edge lines which are initial contour curve for level set evolution. Nevertheless, our method can be further improved because a large amount of computing time is spent on chevron marking detection based on grayscale template matching which can be replaced by deep learning methods.
Overall, the proposed method performs well, despite the challenging environmental conditions. Quantitative evaluation in Table 3 shows that the average completeness of the proposed method for all test images is nearly 100%, while the average correctness and average quality are both nearly 89%. The computing time in Table 5 shows that the overall efficiency is high although our method can be improved.

3.2.2. Experiment II

The results of the proposed runway change analysis method for Images 7 and 8 are illustrated in Figure 11 and Figure 12. To validate the effectiveness of our method, comparison results obtained by change detection method based on level set [23], object-based change vector analysis (OCVA), visual saliency and random forest [24], and ground truth data of runway changes obtained by manual vectorization are also presented in Figure 11 and Figure 12. The quantitative results of the proposed method and state-of-the-art methods are, respectively, given in Table 6 and Table 7. Furthermore, semantic results of runway change were obtained by our method, that is, the number of runways in Images 7 decreased, while the quantity of runways in Images 8 increased.
As can be seen in Figure 11 and Figure 12, the runway extraction results and runway change analysis results are matched with the real situation, and the overall quality of the proposed runway change analysis method is quite high, as shown in Table 6. Comparatively, change detection results are inaccurate and ambiguous. For example, some false changes, such as river and parking apron, and missed changes, such as runway, were detected for Images 7 and 8. The reason for this might be because universal change detection methods are difficult to be applied to all RS images with different ground objects. In particular, change detection for VHR images may need shape feature, spatial feature, or expert knowledge of objects to obtain more accurate results. Additionally, the most important is that change detection results no matter using which comparison method are absence of semantic information, namely the increase or decrease of finer objects, such as runway, rather than airport.
In other words, our method has good performance not only in runway extraction but also in runway change analysis. The average accuracy of our method reaches 87.7%, while state-of-the-art methods perform poorly.

4. Discussion

As far as runway extraction is concerned, the complicated background objects and runway structure in test images actually impose great challenges for runway extraction. For example, as shown in Images 1–4, the boundary between water and land in Image 1, taxiways and parking aprons in Images 2 and 4, and terraced fields in Image 3 can detect many line segments in line segment detection, which may lead to false runway boundary extraction. Thus, our method extracted runway boundaries largely based on chevron marking detection, which is introduced into runway extraction for the first time and can also be applied to runway detection or runway identification. Moreover, complex runway structures, such as Images 5 and 6, can easily cause incomplete extraction of runways because these structures interfere with shape feature of a runway itself. Apart from this, due to the difference in the shooting angle of satellite images or some other reasons, there exists geometric distortion in runway markings, which leads to runway edge markings slightly curved or chevron markings for runways inconsistent with their templates, and eventually some runways may be extracted unsuccessfully. Nevertheless, the runway edge marking helps to identify the runway ends in some cases where chevron markings for runways are absent or detected unsuccessfully. Therefore, runway boundary extraction based on interference filter in our method is essential and indispensable for runway extraction, but, meanwhile, the risk of false extraction of runways becomes higher. This is why merging runway area is necessary in runway extraction.
For runway change analysis, the overall results of our method are credible because the semantic results of runway change analysis are in line with the truth, and the overall accuracy of vector results is over 80%, while it is difficult for common change detection methods to make it. However, one disadvantage for our method is the lower speed of runway change analysis, because our method is based on runway extraction and runway extraction from bi-temporal airport images is time-consuming, which can be further improved by detecting chevron markings of airport runways using deep learning method.

5. Conclusions

In this paper, from the perspective of airport knowledge, we propose a novel airport runway change analysis method to overcome accuracy limitations of runway extraction caused by the complexity of airport background and runway structure, and semantic ambiguity and accuracy limitations of runway changes caused by change detection methods. In our method, we first introduce the runway markings and combine the shape features of runways, such as length/width limitation of runways, with parallel line feature to extract runways. Furthermore, runway change analysis was implemented based on IOU of runway extraction results of bi-temporal airport images and overlap rate of runway increase or decrease defined by us. The two experimental results demonstrate that the proposed runway extraction method has good performance with the average accuracy of nearly 89%, and more accurate runway change results with semantic information were obtained by our method, compared with traditional change detection methods, such as Level set, OCVA, RF, and so on. Most importantly, we found that the chevron marking for runways is critical to identify the spatial position and orientation of runways, and the runway edge marking and multiple features of runways could be as supplementary information to extract accurate runway boundary, which are also foundations for accurate runway change analysis.
In our future work, we will focus on detecting chevron markings by using deep learning methods, such as DRN [33], to improve the speed of runway extraction. Meanwhile, the process of runway boundary extraction based on interference filter can be omitted because the accuracy of chevron marking detection will be higher and runway boundary extraction will be achieved based on detection results of either chevron marking of runway ends. In addition, at present, we can only acquire qualitative results of runway changes by our method; thus, a more accurate runway change analysis method to obtain specific quantity changes of runways is also in future consideration. Finally, we will expand the airport knowledge base, such as features of terminal buildings, which can be combined with object-based image analysis methods [34], to detect damages of airport facilities after disaster or conduct pre-disaster and post-disaster change analysis of airport objects.

Author Contributions

Conceptualization, W.D.; methodology, W.D.; validation, W.D.; resources, W.D.; writing—original draft preparation, W.D.; writing—review and editing, J.W. and W.D.; supervision, J.W.; and funding acquisition, J.W. All authors have read and agreed to the published version of the manuscript.

Funding

This research was funded by National Key Research and Development Program of China, grant number 2018YFC1508903, and the National Natural Science Foundation of China, grant numbers 41571492 and 41907395.

Acknowledgments

We are grateful to the three anonymous reviewers for providing comments and suggestions that greatly improved the article.

Conflicts of Interest

The authors declare no conflict of interest.

References

  1. Xiao, Z.; Gong, Y.; Long, Y.; Li, D.; Wang, X.; Liu, H. Airport Detection Based on a Multiscale Fusion Feature for Optical Remote Sensing Images. IEEE Geosci. Remote Sens. Lett. 2017, 14, 1469–1473. [Google Scholar] [CrossRef]
  2. Zeng, F.; Cheng, L.; Li, N.; Xia, N.; Ma, L.; Zhou, X.; Li, M. A Hierarchical Airport Detection Method Using Spatial Analysis and Deep Learning. Remote Sens. 2019, 11, 2204. [Google Scholar] [CrossRef] [Green Version]
  3. Wang, X.; Lv, Q.; Wang, B.; Zhang, L. Airport Detection in Remote Sensing Images: A Method Based on Saliency Map. Cogn. Neurodyn. 2012, 7, 143–154. [Google Scholar] [CrossRef] [PubMed] [Green Version]
  4. Zhao, D.; Ma, Y.; Jiang, Z.; Shi, Z. Multiresolution Airport Detection via Hierarchical Reinforcement Learning Saliency Model. IEEE J. Sel. Top. Appl. Earth Obs. Remote Sens. 2017, 10, 2855–2866. [Google Scholar] [CrossRef]
  5. Zhang, L.; Zhang, Y. Airport Detection and Aircraft Recognition Based on Two-Layer Saliency Model in High Spatial Resolution Remote-Sensing Images. IEEE J. Sel. Top. Appl. Earth Obs. Remote Sens. 2016, 10, 1511–1524. [Google Scholar] [CrossRef]
  6. Wang, S.; Zhang, L. Airport Detection Based on Superpixel Segmentation and Saliency Analysis for Remote Sensing Images. Int. Geosci. Remote Sens. Symp. (IGARSS) 2018, 2018, 2511–2514. [Google Scholar] [CrossRef]
  7. Zhang, Q.; Zhang, L.; Shi, W.; Liu, Y. Airport Extraction via Complementary Saliency Analysis and Saliency-Oriented Active Contour Model. IEEE Geosci. Remote Sens. Lett. 2018, 15, 1085–1089. [Google Scholar] [CrossRef]
  8. Liu, N.; Cao, Z.; Cui, Z.; Pi, Y.; Dang, S. Multi-Layer Abstraction Saliency for Airport Detection in SAR Images. IEEE Trans. Geosci. Remote Sens. 2019, 57, 9820–9831. [Google Scholar] [CrossRef]
  9. Chen, F.; Ren, R.; Van De Voorde, T.; Xu, W.; Zhou, G.; Zhou, Y. Fast Automatic Airport Detection in Remote Sensing Images Using Convolutional Neural Networks. Remote Sens. 2018, 10, 443. [Google Scholar] [CrossRef] [Green Version]
  10. Xu, Y.; Zhu, M.; Li, S.; Feng, H.; Ma, S.; Che, J. End-to-End Airport Detection in Remote Sensing Images Combining Cascade Region Proposal Networks and Multi-Threshold Detection Networks. Remote Sens. 2018, 10, 1516. [Google Scholar] [CrossRef] [Green Version]
  11. Li, S.; Xu, Y.; Zhu, M.; Ma, S.; Tang, H. Remote Sensing Airport Detection Based on End-to-End Deep Transferable Convolutional Neural Networks. IEEE Geosci. Remote Sens. Lett. 2019, 16, 1640–1644. [Google Scholar] [CrossRef]
  12. Zhang, Z.; Zou, C.; Han, P.; Lu, X. A Runway Detection Method Based on Classification Using Optimized Polarimetric Features and HOG Features for PolSAR Images. IEEE Access 2020, 8, 49160–49168. [Google Scholar] [CrossRef]
  13. Liu, D.; Song, K.; Townshend, J.R.; Gong, P. Using Local Transition Probability Models in Markov Random Fields for Forest Change Detection. Remote Sens. Environ. 2008, 112, 2222–2231. [Google Scholar] [CrossRef]
  14. Seo, D.K.; Kim, Y.; Eo, Y.; Park, W.; Park, H. Generation of Radiometric, Phenological Normalized Image Based on Random Forest Regression for Change Detection. Remote Sens. 2017, 9, 1163. [Google Scholar] [CrossRef] [Green Version]
  15. Li, Z.; Liu, Z.; Shi, W. Semiautomatic Airport Runway Extraction Using a Line-Finder-Aided Level Set Evolution. IEEE J. Sel. Top. Appl. Earth Obs. Remote Sens. 2014, 7, 4738–4749. [Google Scholar] [CrossRef]
  16. Aytekin, Ö.; Zongur, U.; Halici, U. Texture-Based Airport Runway Detection. IEEE Geosci. Remote Sens. Lett. 2012, 10, 471–475. [Google Scholar] [CrossRef]
  17. Wu, W.; Xia, R.; Xiang, W.; Hui, B.; Chang, Z.; Liu, Y.; Zhang, Y. Recognition of Airport Runways in FLIR Images Based on Knowledge. IEEE Geosci. Remote Sens. Lett. 2014, 11, 1534–1538. [Google Scholar] [CrossRef]
  18. Liu, C.; Cheng, I.; Basu, A. Real-Time Runway Detection for Infrared Aerial Image Using Synthetic Vision and an ROI Based Level Set Method. Remote Sens. 2018, 10, 1544. [Google Scholar] [CrossRef] [Green Version]
  19. Shi, W.; Zhang, M.; Zhang, R.; Chen, S.; Zhan, Z. Change Detection Based on Artificial Intelligence: State-of-the-Art and Challenges. Remote Sens. 2020, 12, 1688. [Google Scholar] [CrossRef]
  20. Lv, Z.; Shi, W.; Zhou, X.; Benediktsson, J.A. Semi-Automatic System for Land Cover Change Detection Using Bi-Temporal Remote Sensing Images. Remote Sens. 2017, 9, 1112. [Google Scholar] [CrossRef] [Green Version]
  21. Lv, Z.; Liu, T.; Wan, Y.; Benediktsson, J.A.; Zhang, X. Post-Processing Approach for Refining Raw Land Cover Change Detection of Very High-Resolution Remote Sensing Images. Remote Sens. 2018, 10, 472. [Google Scholar] [CrossRef] [Green Version]
  22. Zhou, L.; Cao, G.; Li, Y.; Shang, Y. Change Detection Based on Conditional Random Field with Region Connection Constraints in High-Resolution Remote Sensing Images. IEEE J. Sel. Top. Appl. Earth Obs. Remote Sens. 2016, 9, 3478–3488. [Google Scholar] [CrossRef]
  23. Hao, M.; Shi, W.; Zhang, H.; Li, C. Unsupervised Change Detection with Expectation-Maximization-Based Level Set. IEEE Geosci. Remote Sens. Lett. 2013, 11, 210–214. [Google Scholar] [CrossRef]
  24. Feng, W.; Sui, H.; Chen, X. Saliency-Guided Change Detection of Remotely Sensed Images Using Random Forest. ISPRS Int. Arch. Photogramm. Remote Sens. Spat. Inf. Sci. 2018, 42, 341–348. [Google Scholar] [CrossRef] [Green Version]
  25. Im, J.; Jensen, J.R. A Change Detection Model Based on Neighborhood Correlation Image Analysis and Decision Tree Classification. Remote Sens. Environ. 2005, 99, 326–340. [Google Scholar] [CrossRef]
  26. Liu, J.; Gong, M.; Qin, A.K.; Tan, K.C. Bipartite Differential Neural Network for Unsupervised Image Change Detection. IEEE Trans. Neural Netw. Learn. Syst. 2020, 31, 876–890. [Google Scholar] [CrossRef]
  27. Hou, B.; Liu, Q.; Wang, H.; Wang, Y. From W-Net to CDGAN: Bitemporal Change Detection via Deep Learning Techniques. IEEE Trans. Geosci. Remote Sens. 2020, 58, 1790–1802. [Google Scholar] [CrossRef] [Green Version]
  28. U.S. Department of Transportation. Federal Aviation Administration. “Airport Design.” Aviation 1 (AC 150/5300-13A): 1–322. 2014. Available online: https://www.faa.gov/documentLibrary/media/Advisory_Circular/150-5300-13A-chg1-interactive-201907.pdf (accessed on 20 July 2020).
  29. U.S. Department of Transportation. Federal Aviation Administration. “Standards for Airport Markings”. (AC 150/5340-1M): 1–171. 2019. Available online: https://www.faa.gov/documentLibrary/media/Advisory_Circular/150-5340-1M.pdf (accessed on 20 July 2020).
  30. Achanta, R.; Hemami, S.; Estrada, F.; Susstrunk, S. Frequency-Tuned Salient Region Detection. In Proceedings of the 2009 IEEE Computer Society Conference on Computer Vision and Pattern Recognition Workshops, CVPR Workshops, Miami Beach, FL, USA, 20–26 June 2009; pp. 1597–1604. [Google Scholar] [CrossRef] [Green Version]
  31. Comaniciu, D.; Meer, P. Mean Shift: A Robust Approach toward Feature Space Analysis. IEEE Trans. Pattern Anal. Mach. Intell. 2002, 24, 603–619. [Google Scholar] [CrossRef] [Green Version]
  32. Matas, J.; Galambos, C.; Kittler, J. Robust Detection of Lines Using the Progressive Probabilistic Hough Transform. Comput. Vis. Image Underst. 2000, 78, 119–137. [Google Scholar] [CrossRef]
  33. Pan, X.; Ren, Y.; Sheng, K.; Dong, W.; Yuan, H.; Guo, X.; Ma, C.; Xu, C. Dynamic Refinement Network for Oriented and Densely Packed Object Detection. In Proceedings of the 2020 IEEE/CVF Conference on Computer Vision and Pattern Recognition (CVPR), Seattle, WA, USA, 16–18 June 2020. [Google Scholar] [CrossRef]
  34. Janalipour, M.; Mohammadzadeh, A. Building Damage Detection Using Object-Based Image Analysis and ANFIS from High-Resolution Image (Case Study: BAM Earthquake, Iran). IEEE J. Sel. Top. Appl. Earth Obs. Remote Sens. 2015, 9, 1937–1945. [Google Scholar] [CrossRef]
Figure 1. Overview graph of the main components of the airport knowledge base.
Remotesensing 12 03163 g001
Figure 2. Airport runway surface markings: (a) a typical example in VHR remote sensing images of the Hong Kong International Airport; and (b) the corresponding design drawing of runway markings.
Remotesensing 12 03163 g002
Figure 3. The framework of the proposed runway extraction method.
Remotesensing 12 03163 g003
Figure 4. The process graph of the chevron marking detection: the four images from bottom to top are the original airport image, the salient binary map of the airport, the results of template matching of chevron markings, and the final results of the chevron marking detection, respectively.
Remotesensing 12 03163 g004
Figure 5. Grayscale templates of the chevron marking.
Remotesensing 12 03163 g005
Figure 6. The sample graph of the process of runway boundary extraction under the reference of the suspected runway area: (a) the original airport image marked with the suspected runway area (red rectangles); (b) line segment detection results using the Probabilistic Hough Transform algorithm (all directions); (c) line segment detection results in the suspected runway area; and (d) runway boundary extraction results based on our method.
Remotesensing 12 03163 g006
Figure 7. The implementation process of runway boundary extraction based on interference filter: (a) the procedure of interference filter; and (b) the procedure of runway boundary extraction.
Remotesensing 12 03163 g007
Figure 8. The example of merging runway boundary: (a) runway boundary extraction results based on chevron marking detection; (b) runway boundary extraction results based on interference filter; and (c) the final results of merging both runway boundaries.
Remotesensing 12 03163 g008
Figure 9. The flowchart of the proposed runway change analysis algorithm.
Remotesensing 12 03163 g009
Figure 10. Six VHR satellite images of airports. (a) Original images with chevron marking detection results marked with red bounding boxes: Image 1 (Kinmen Shang-Yi Airport, China), Image 2 (Hong Kong International Airport, China), Image 3 (Gimpo International Airport, Korea), Image 4 (Hartsfield-Jackson Atlanta International Airport, USA), Image 5 (Newark Liberty International Airport, USA), and Image 6 (Charlotte-Douglas International Airport, USA). (b) The final binary results of runway extraction using our method. (c) The runway extraction results using the method [15]. (d) Ground truth data of runways.
Remotesensing 12 03163 g010
Figure 11. Test Data 7 (Osan Air Base, Korea): (a) original image taken in 2016; (b) original image taken in 2019; (c) the results of old-temporal test image using our proposed runway extraction method; (d) the results of new-temporal test image using our proposed runway extraction method; (e) the results of runway reduction using our proposed runway change analysis method; (f) the results of runway increase using our proposed runway change analysis method; (g) change detection results based on [23]; (h) change detection results based on OCVA; (i) change detection results based on [24]; and (j) ground truths of runway changes.
Remotesensing 12 03163 g011
Figure 12. Test Data 8 (Okinawa Naha Airport, Japan): (a) original image taken in 2017. (b) original image taken in 2019; (c) the results of old-temporal test image using our proposed runway extraction method; (d) the results of new-temporal test image using our proposed runway extraction method; (e) the results of runway reduction using our proposed runway change analysis method; (f) the results of runway increase using our proposed runway change analysis method; (g) change detection results based on [23]; (h) change detection results based on OCVA; (i) change detection results based on [24]; and (j) ground truths of runway changes.
Remotesensing 12 03163 g012
Table 1. Characteristics of different airport runway features and markings.
Types of Features or MarkingsCharacteristics
Shape featureThe overall shape is rectangular, runway length is generally 800–4000 m, runway width is generally 30–60 m, and the length-width ratio is greater than 30.
Parallel line featureRunway edges consist of two parallel lines.
Spatial featureWhen the airfield code is 1, 2, 3, or 4, the minimum distance of the center line of two parallel runways is no less than 120, 150, and 210 m, respectively.
Structural featureGenerally, four structural types of runways are presented: single runway, parallel runway, V-shaped runway, and X-shaped runway.
Chevron markingIt is located on the blast pad and stopway that are aligned with and contiguous to the runway end, and dimensionally, the width of the chevron marking is no less than runway width and the length is no less than 45 m to allow for at least two chevron stripes. Moreover, inclined angle of chevron stripes is fixed, namely 90 degrees.
Runway displaced threshold markingThe arrow marking (arrowheads with and without arrow shafts) performs three possible functions, that is, two cases for displaced thresholds and one case for a runway threshold with an aligned taxiway.
Runway threshold bar markingIt is an elongated rectangular bar that is located perpendicular to the runway centerline and on the landing portion of the runway. The marking extends between the runway edges or between the runway edge markings.
Runway threshold markingIt consists of a pattern of longitudinal stripes of uniform dimensions spaced symmetrically about the runway centerline, and the number of longitudinal stripes and their spacing is determined by the runway width: 16 stripes indicate that the runway width is 60 m, 12 stripes indicate that it is 45 m, and 8 stripes indicate that it is 30 m.
Runway touchdown zone markingIt consists of symmetrically arranged pairs of rectangular bars in groups of one, two, and three along the runway centerline, and the number of rectangular bars in each marking is related to the available landing distance.
Runway aiming point markingIt consists of two conspicuous rectangular markings and is located symmetrically on each side of the runway centerline.
Runway centerline markingIt consists of a line of uniformly spaced stripes and gaps and of uniform width. The marking identifies the physical center of the runway width and provides alignment guidance to pilots during take-off and landing operations.
Runway edge markingIt consists of two parallel stripes, one placed along each edge of the usable runway with the outer edge of each stripe approximately on the edge of the paved useable runway. The marking extends the full length of the runway, except for precision runways which lack a threshold bar marking.
Table 2. Parameters used by template matching and line segment detection.
Test ImagesImage Size (pixels)Similarity ThresholdFirst Length Threshold (meters)Second Length Threshold (meters)
16056   ×   37120.58001200
28688   ×   65280.5400800
37696   ×   62240.42001200
410,064   ×   65760.5400800
56752   ×   81320.5400800
67328   ×   57280.54001200
77768   ×   32640.44001200
88336   ×   48000.5200800
Table 3. Quantitative evaluation of the proposed airport runway extraction method.
Test ImagesCompletenessCorrectnessQuality
11.00.8890.889
20.9990.9210.921
30.9990.9300.929
41.00.8730.873
50.9980.7890.788
60.9970.9300.927
Average0.9990.8890.888
Table 4. Quantitative evaluation of state-of-the-art method [15].
Test ImagesCompletenessCorrectnessQuality
11.00.2590.259
20.00100
30.1730.0790.057
41.00.1080.108
50.0740.0160.013
60.8730.0400.040
Table 5. The computing time of our method and state-of-the-art method [15].
Test ImagesOur(s)[15] (s)
121.4674.43
259.02167.58
351.29141.69
4114.57232.27
583.85178.70
658.70128.30
Table 6. Quantitative evaluation of the proposed runway change analysis method.
Test ImagesCompletenessCorrectnessQuality
71.00.8310.831
81.00.9230.923
Average1.00.8770.877
Table 7. Quantitative evaluation of state-of-the-art methods.
Test ImagesC ([23])C (OCVA)C ([24])A ([23])A (OCVA)A ([24])
70.2341.00.0070.0580.0530.002
80.7311.00.8120.0690.0770.200
Note: “C” refers to Completeness, “A” refers to “Accuracy” or “Correctness”.

