1. Introduction
Earth’s natural processes and the relationships between soil-vegetation and the atmosphere components of the Earth system are topics of great importance for numerous disciplines covering a range of practical applications and research [
1,
2,
3,
4]. The need for accurate information on parameters characterizing the environment of the Earth system is even more acute today, in light of increased pressure due to climate change and global challenges linked to global food and water security [
5]. Recent climate projections, for example, suggest that the Mediterranean will be subject to severe climate change, including increased temperatures and reduced precipitation [
6]. In this context, the accurate monitoring of parameters such as evaporative fraction (i.e., the ratio of instantaneous latent heat flux (LE) to net radiation (Rn)) and surface soil moisture (SSM) is of high priority. Both are essential environmental parameters which play instrumental roles in numerous physical processes, and thereby affect the climate directly or indirectly [
7,
8,
9]. Thus, being able to accurately estimate their changes in both the time and spatial domains is undoubtedly of prime interest for many applications in numerous disciplines [
10,
11].
Earth Observation (EO) has experienced rapid growth over recent decades, providing a pathway towards acquiring both EF and SSM at variable geographical scales with temporally consistent coverage. A wealth of techniques have been proposed exploiting EO data acquired from across the electromagnetic spectrum to retrieve these parameters (e.g., see reviews by [
8,
12]. Thermal Infrared (TIR) remote sensing, despite its requirement for clear sky conditions, has been the preferred option for both EF and SSM retrievals to date because of its fine resolution in the spatial and temporal domains [
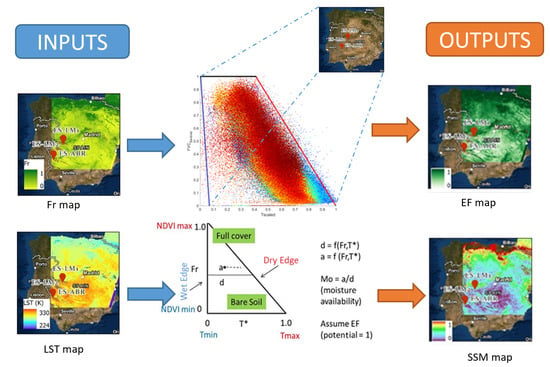
13]. A specific group of TIR-based approaches that rely on the physical relationships implied by EO-derived scatterplots in which the surface temperature (Ts) is plotted versus the vegetation index (VI) have shown potential in this respect. Assuming conditions of full variability in vegetation cover in EO-based imagery, a scatterplot is generated with a triangular (or trapezoidal) shape. The emergence of this shape results from the reduced sensitivity that Ts has on water content over areas covered by vegetation in comparison to bare soil areas. A detailed description of the Ts/VI feature space and of the biophysical properties included within it can be found in [
14].
Several researchers have already demonstrated how EF and SSM can be derived from the Ts/VI feature space utilizing a range of EO data (e.g., [
15,
16,
17,
18,
19,
20,
21,
22,
23]. The promising potential of Ts/VI techniques is evidenced in the fact that variants are being, or have been, considered by different Space Agencies in the development of operational EO-based products [
24,
25,
26]. A group of these techniques has already demonstrated its ability to provide operational service SSM maps over Spain at 1 km pixel size based on data from the SMOS satellite, integrating the SMOS brightness temperature values within a multiple regression model, together with Ts and VI obtained from the MODIS data [
27].
Recently [
28] proposed a new technique for estimating both SSM and EF from the Ts/VI domain, named “simplified triangle”. This approach has a major advantage in comparison to other Ts/VI techniques, in that it is based on only a few calculations and does not require for its implementation a mathematical model to simulate physical processes or ancillary data; therefore, it can be easily implemented almost anywhere in the world. As the technique is easy to use and only depends on EO data, it is a prime candidate for operational use. Nevertheless, more research is required to evaluate its performance in different ecosystems and environmental conditions globally, particularly regarding the use of EO data from new satellites such as those from Sentinel-3.
The authors of [
29] demonstrated the use of the “simplified” triangle approach coupled with crop prediction and climatological water balance models to predict soybean yield using MODIS data. Yet, to our knowledge, this technique using ESA’s Sentinels-3 has not yet been implemented. Sentinel-3 provides EO data at a range of resolutions in the spatial, temporal and spectral domains. Thus, such satellite observations may serve in many potential applications [
30,
31].
On this basis, the present research study aims at exploring the ability of the “simplified triangle”, used synergistically with Sentinel-3 data, to predict the spatio-temporal variability of both EF and SSM. To our knowledge, in that respect, this is the first study of its kind. The technique was assessed in two regions in Spain for which validated collocated ground observations from the FLUXNET global in situ monitoring network were available. The next section provides a description of the study area;
Section 3 outlines the methods,
Section 4 the key results and
Section 5 discusses the obtained results.
5. Discussion
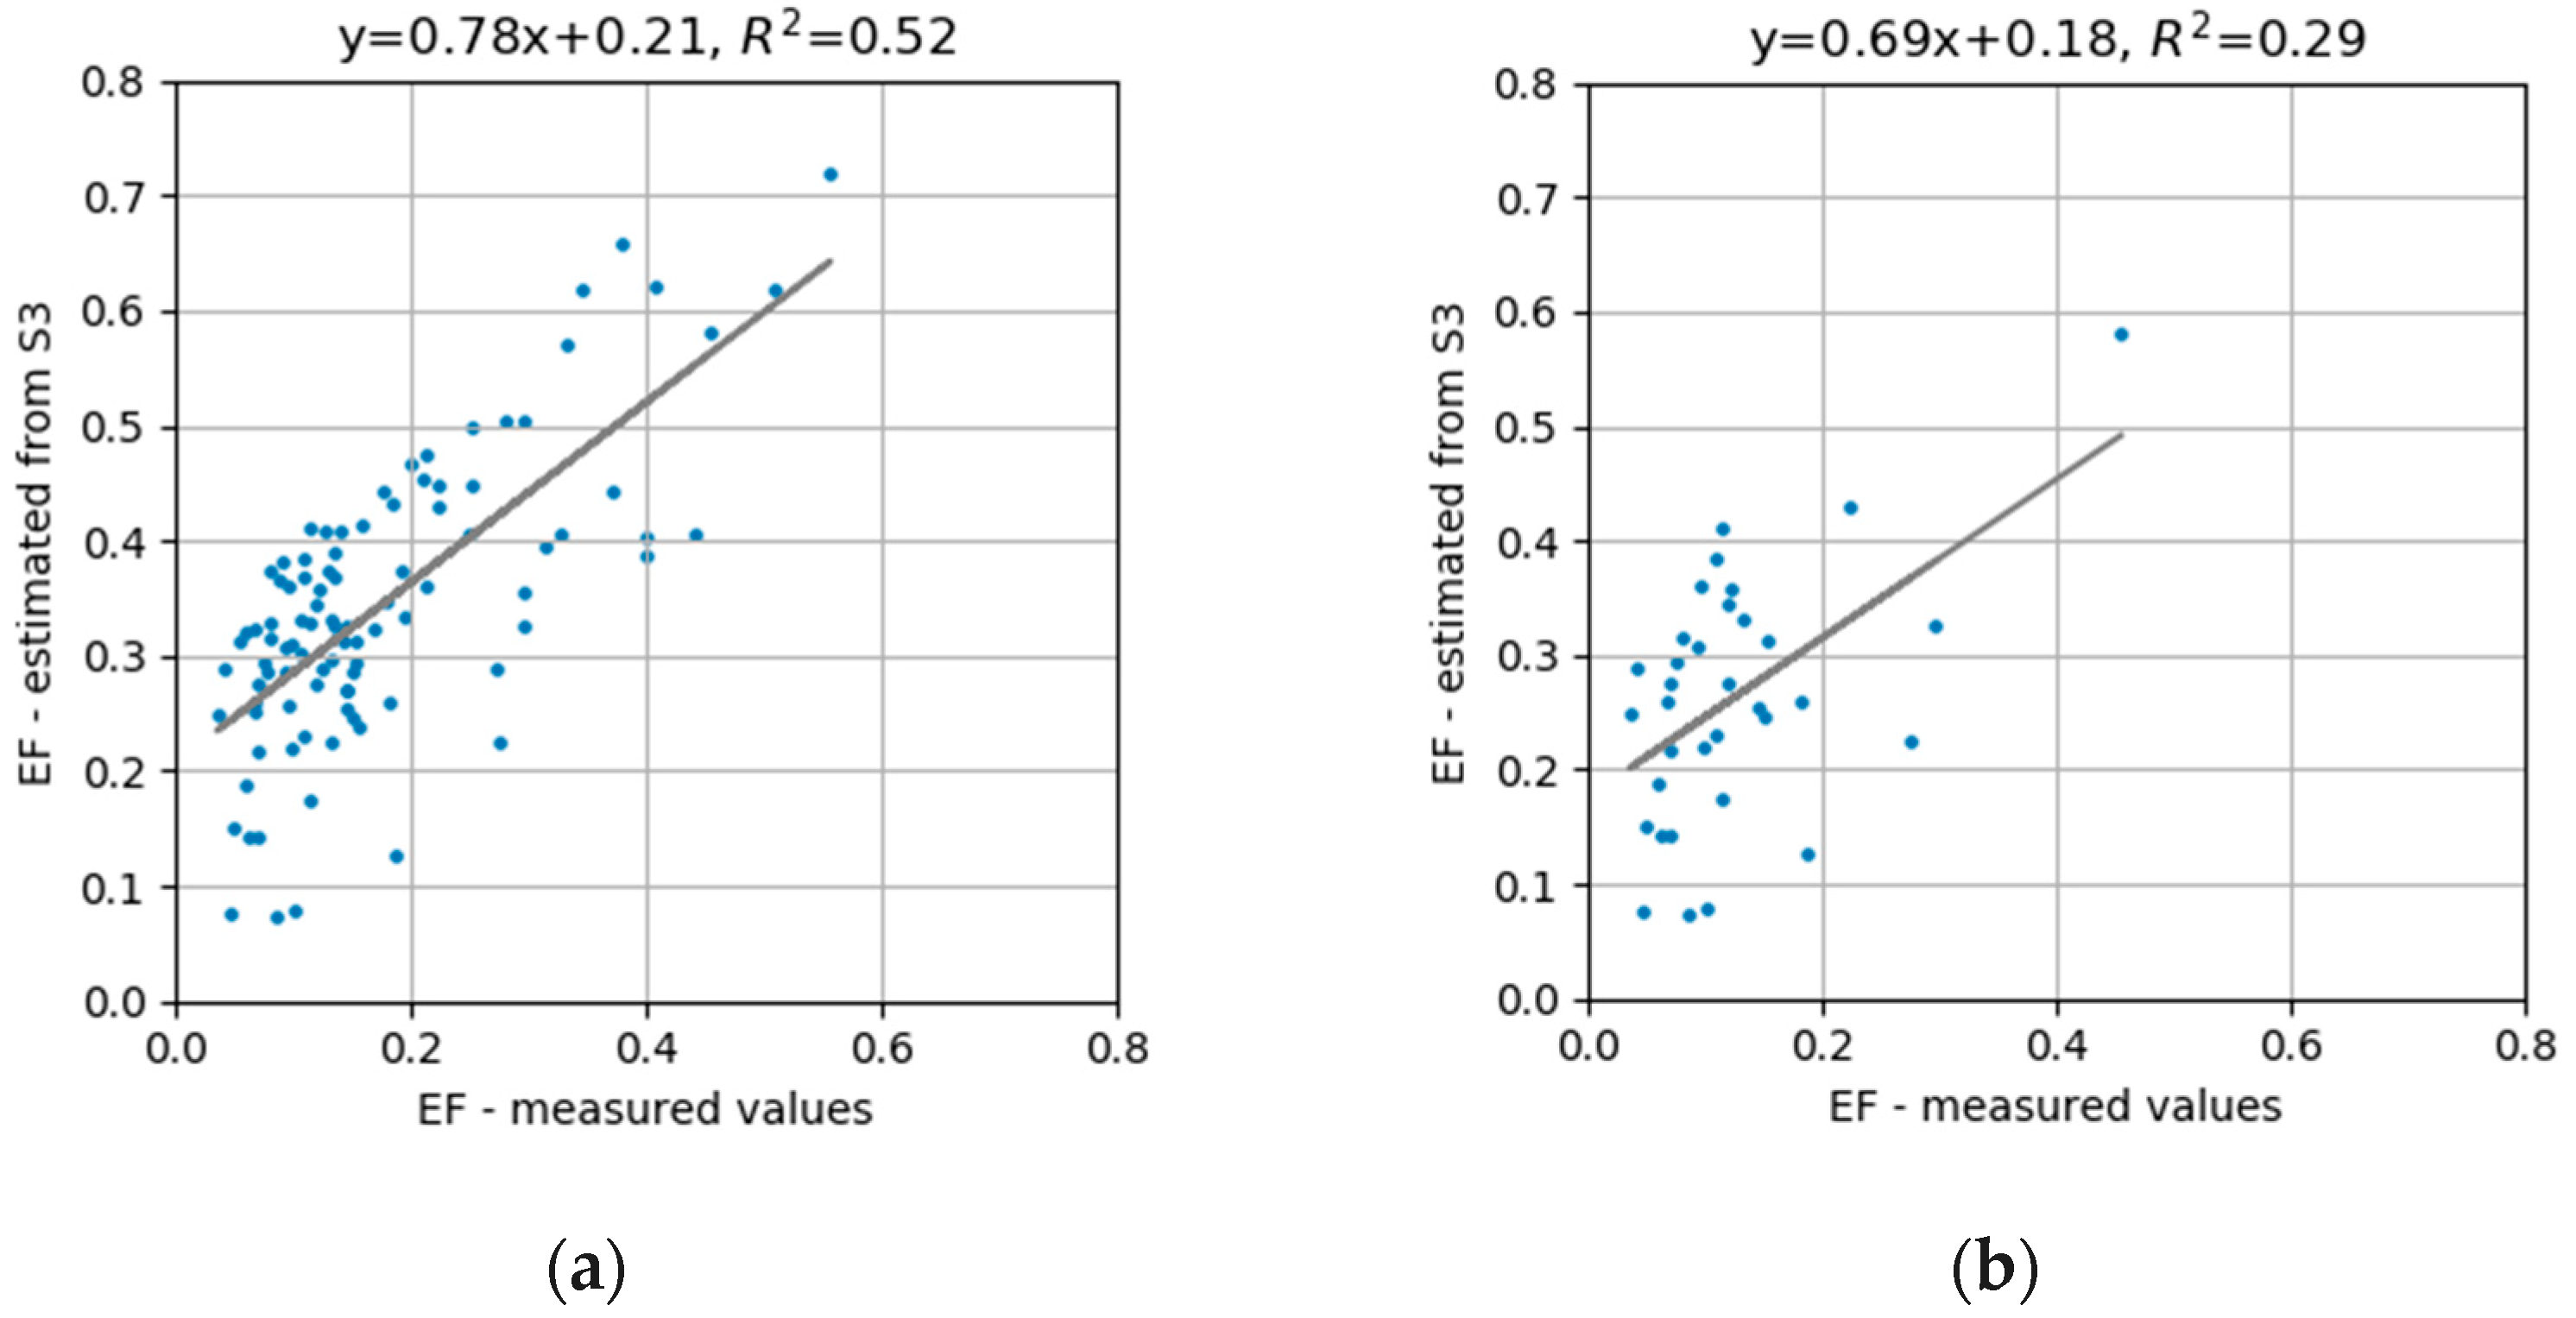
The present research comprised a robust investigation of the “simplified triangle” method for deriving spatially explicit estimates of Evaporative Fraction (EF) and Surface Soil Moisture when the latter used recent Sentinel-3 EO data. The study focused on selected experimental sites located in Spain, representative of a typical Mediterranean savannah ecosystem. For example, a comparison of all the data (including all dates and sites) showed a low RSME for EF (0.191) and SSM (0.012 cm
3 cm
−3) and good correlation coefficients (
R), i.e., 0.721 and 0.577 respectively. Similar or better results were obtained in the individual site-specific comparisons. These findings are encouraging and, as a whole, corroborate the technique’s ability to provide spatial estimates of the parameters it has been developed to predict over the study area. This was verified using data from heterogeneous and arid/semi-arid experimental sites during the study period. The results reported herein cannot be directly compared with other those of studies, since the proposed technique is new. Yet, the reported RMSE and
R values are comparable to those in other studies which retrieved EF and SSM using TIR-based techniques [
6,
13,
16,
23,
43,
46,
47].
Deviation between the estimated EF and SSM and the corresponding in situ data could be due to several influencing factors. One possible such factor might be the accuracy with which Fr and Ts/Tkin retrievals are derived, since these are the only input parameters required for the implementation of the technique. Errors introduced in the estimation of those parameters could potentially impact prediction ability [
48]. In this regard, validations of the Sentinels-3 LST product indicate that the accuracy in Ts retrieval is on the order of 1.5–2.5 K [
9]. However, validation studies of the Fr product do not yet exist, to our knowledge. The error contribution of Ts is not expected to be significant, since this parameter is scaled [
28,
40]. Yet, in the present study, Fr was obtained directly from the Sentinel-3 product and was not computed using the NDVI-based approach, as outlined by [
28] in the “simplified triangle” description. This may influence the retrieval accuracy of the predicted parameters which, to our knowledge, is yet to be investigated.
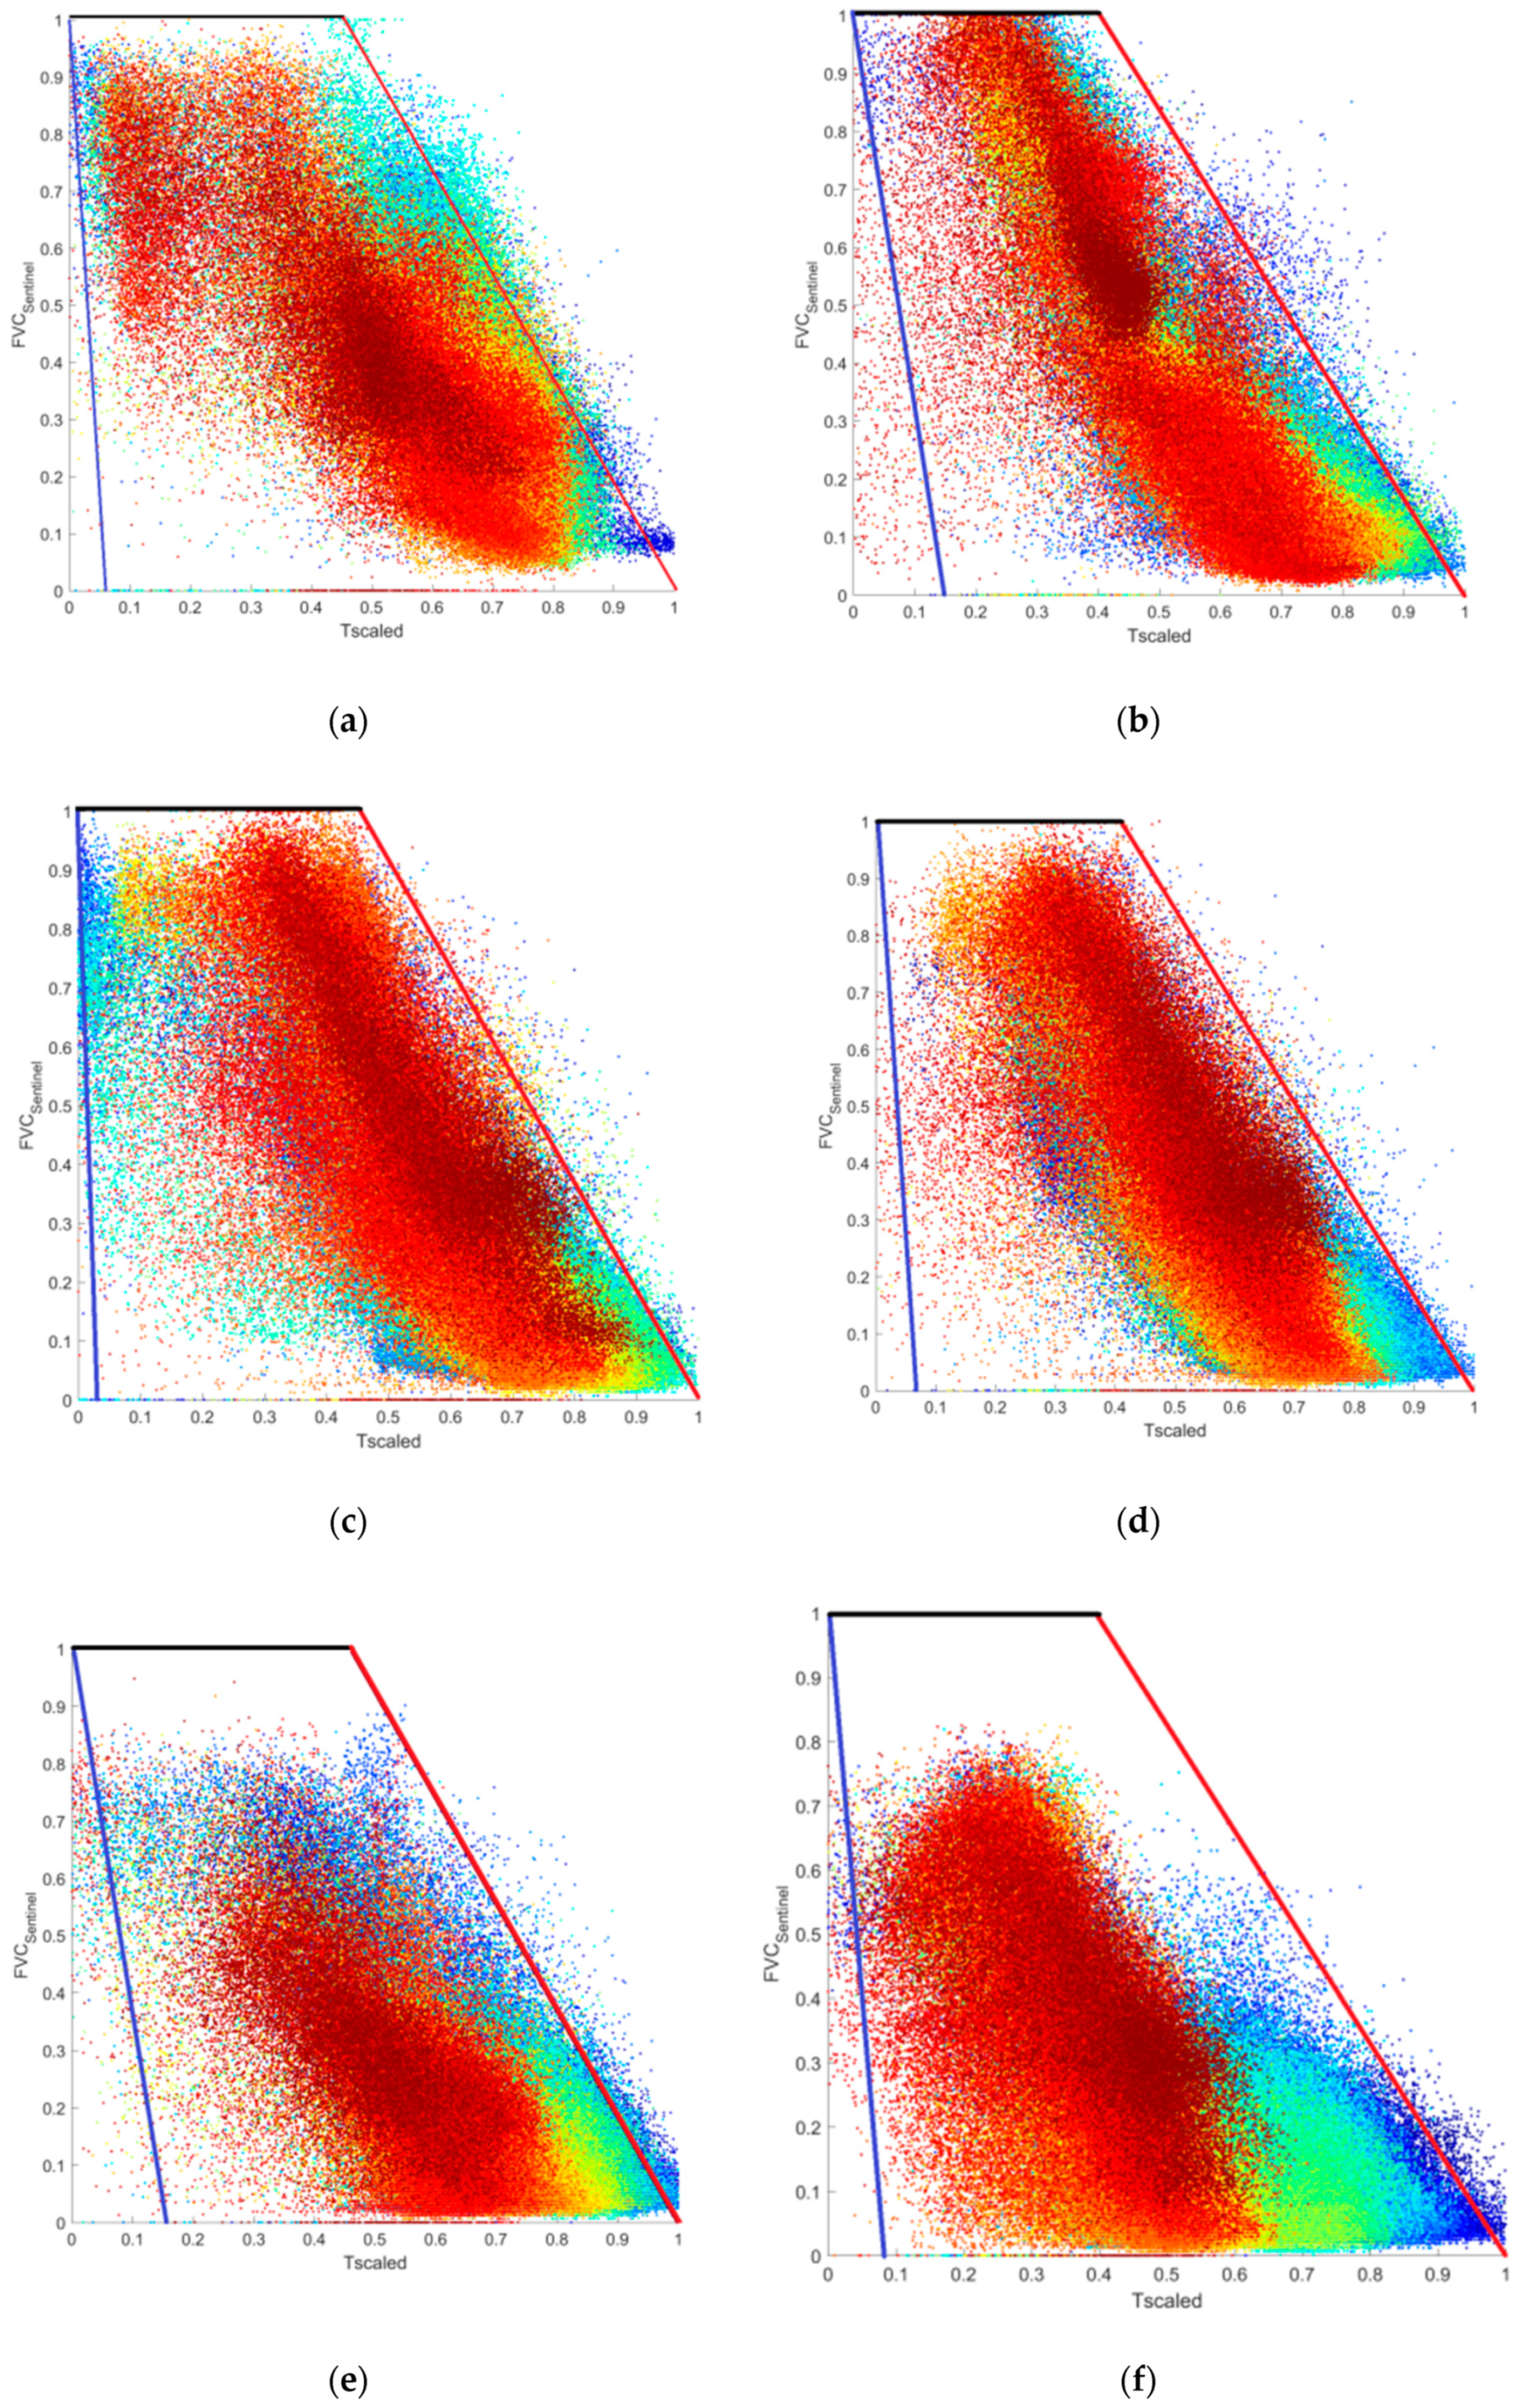
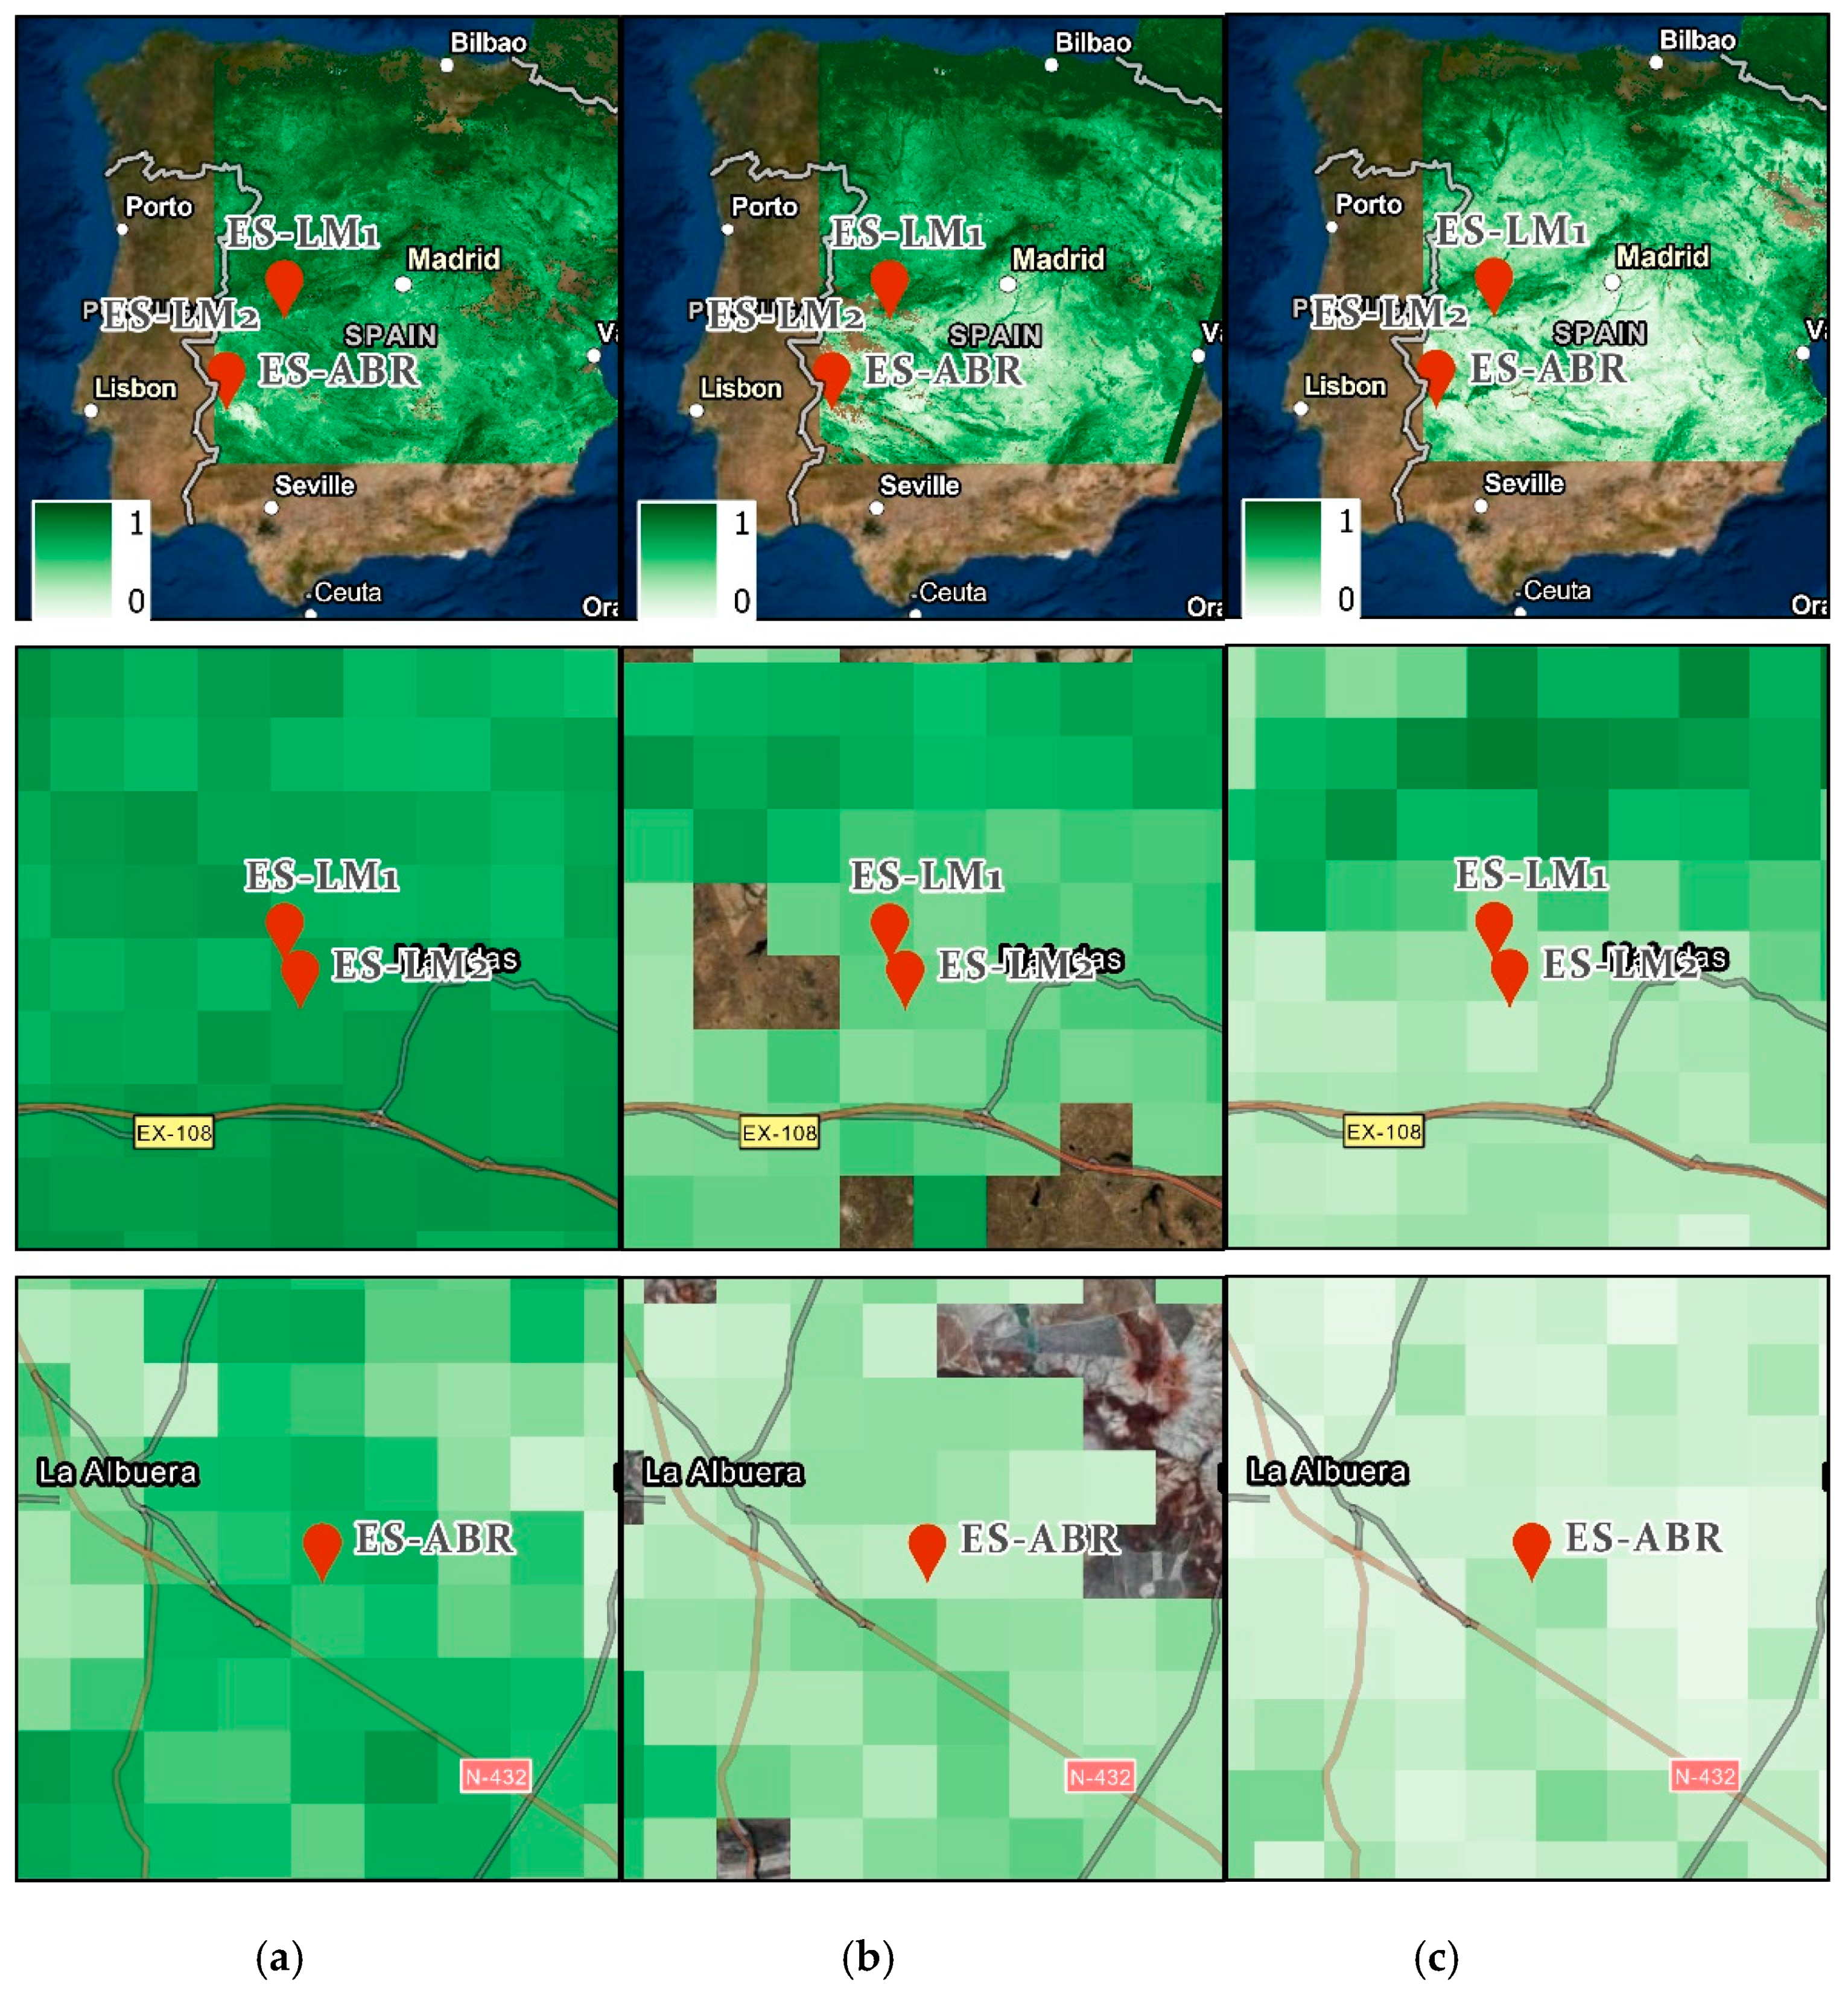
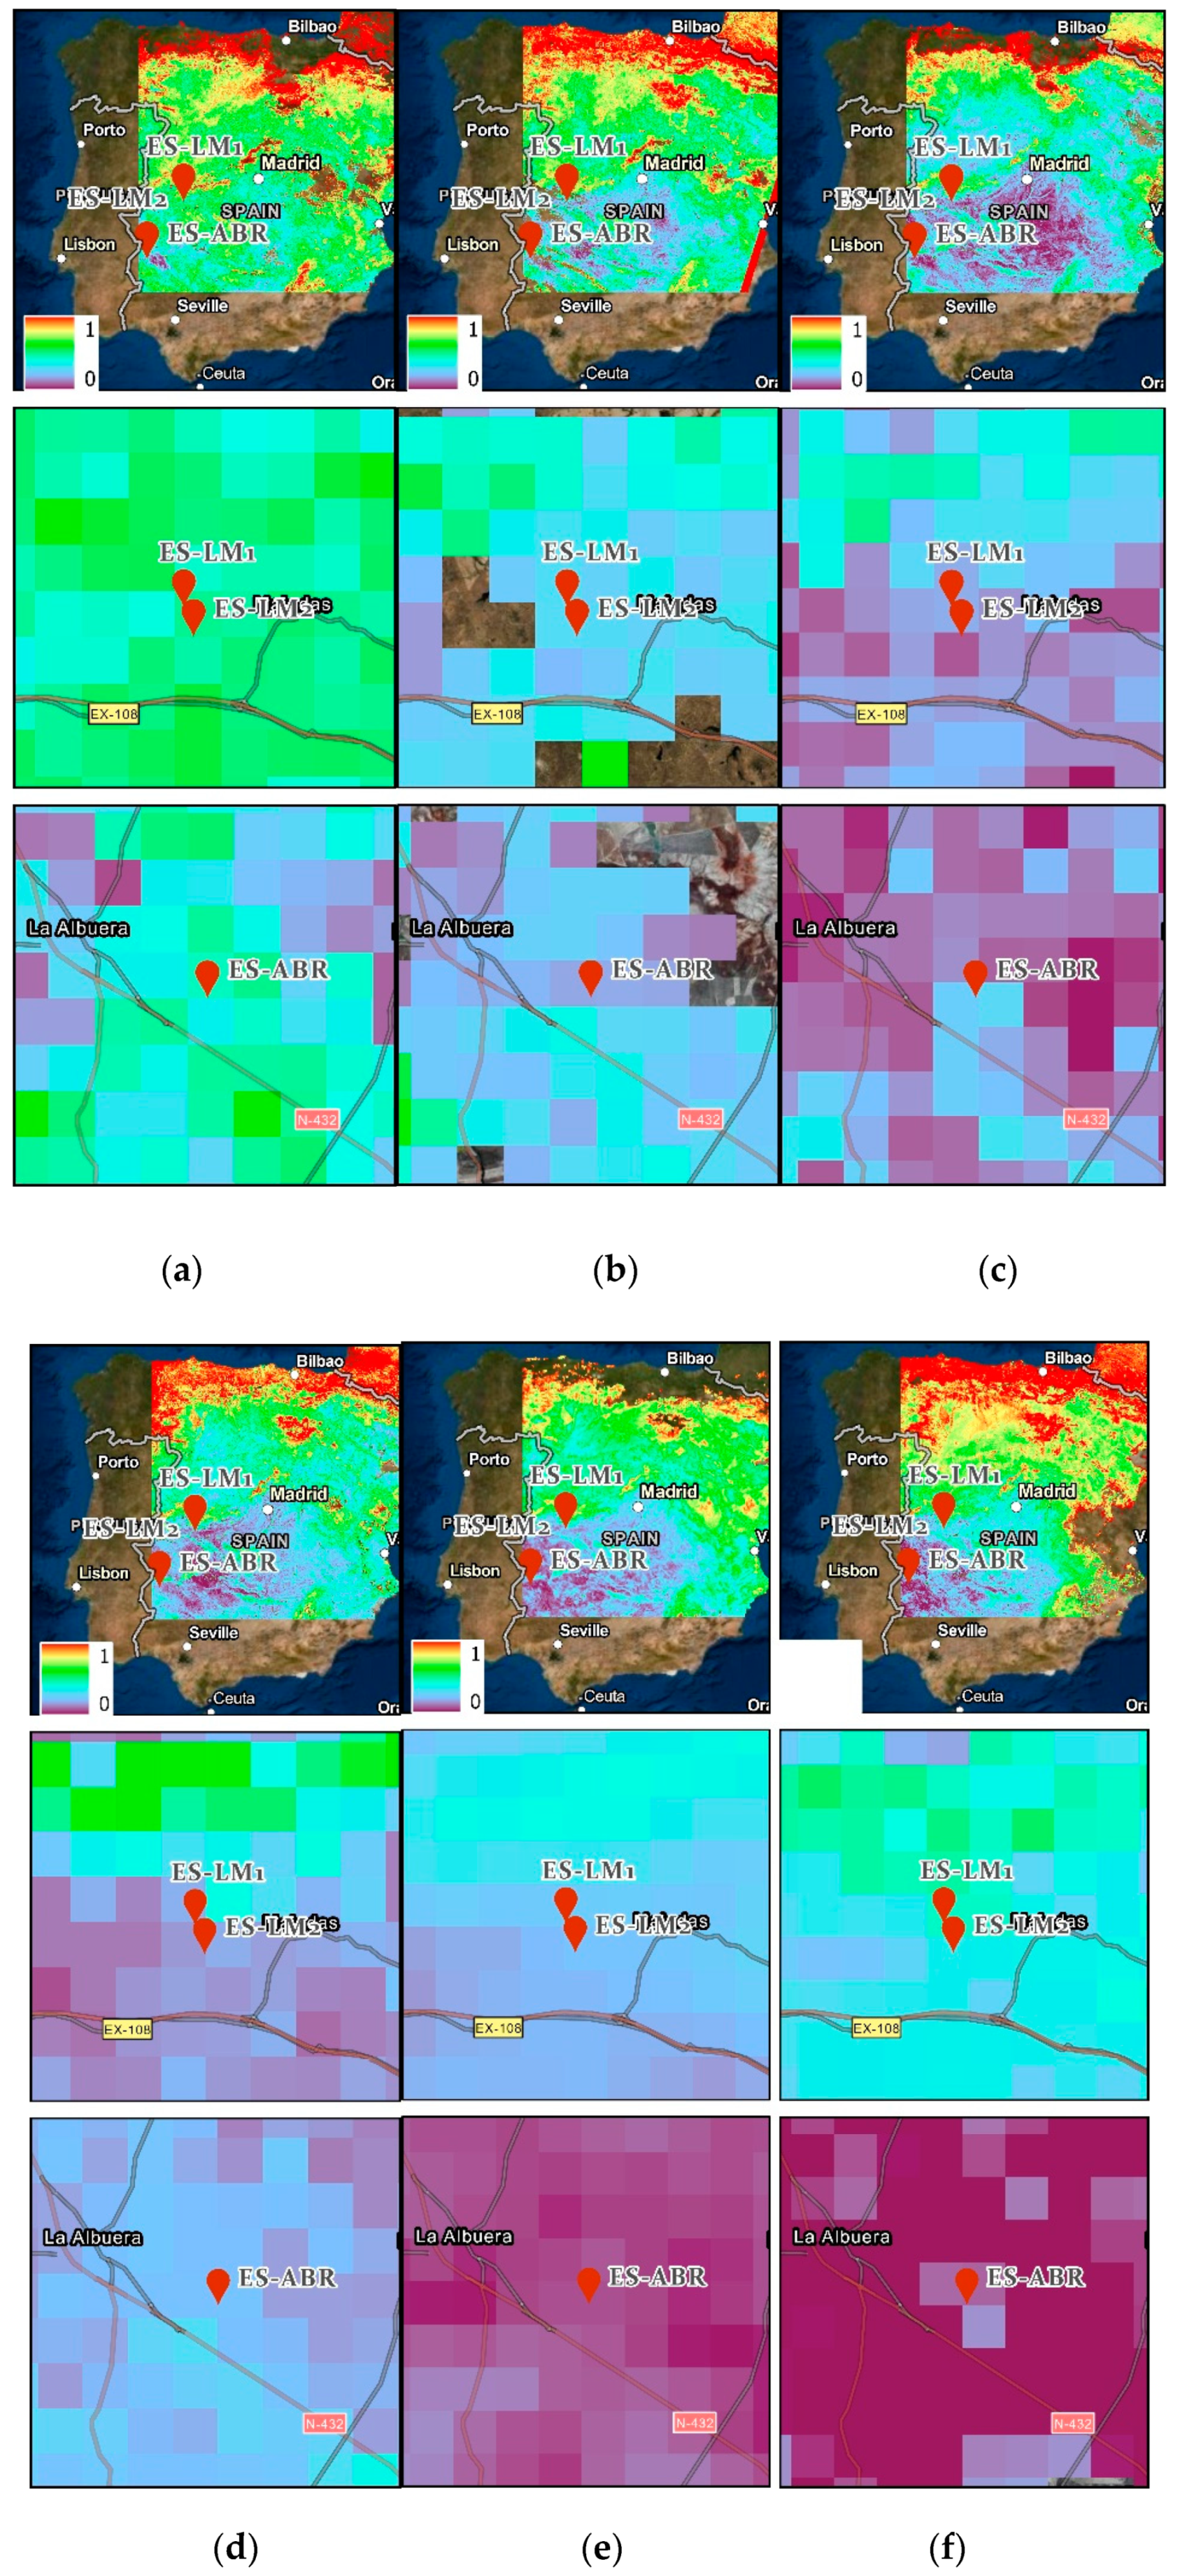
Figure 9 illustrates the influence of the Fr prediction method on the scatterplot. This illustrates how different the scatterplot shape will be when Fr is predicted by three different methods. In addition, the same figure illustrates the difference map between the Sentinel-3 and NDVI-scaled derived Fr, together with the corresponding histogram. Evidently, there is considerable diversity in the scatterplots shown as a result of the differences of the Fr maps given as inputs. We expect that this will have an impact on the subsequent steps of the implementation of the “simplified triangle” technique.
A further factor might be related to the assumption made by the “simplified triangle” of a linear relationship between Ts/VI and the predicted parameters (both EF and Mo). This assumption perhaps oversimplifies the relationship linking the variables embedded in the Ts/VI domain [
14,
49] Furthermore, uncertainties in the predictions of both EF and Mo may be introduced due to user-dependent subjectivity in the computation of the theoretical dry edge [
50].
In addition, the large scale differences in spatial resolution between the CarboEurope point measurements (on the order of 5 × 5 m) and the Sentinel-3 pixel (on the order of 1 × 1 km) direct validation of both EF and SSM is subject to some degree of uncertainty. This spatial variation cannot be precisely conveyed by means of point data validation [
51]. This issue can potentially create a poor horizontal and vertical mismatch between the EO data and the ground measurements, affecting the comparisons of EF and SSM [
52]. For example, satellite-derived SSM predictions could be responding to the skin soil layer water content. The latter is significantly shallower than the ground measurement minimum resolution (which is at a 0–5 cm average surface layer). Effective soil depth estimates for EO-based predictions of SSM are a highly contested issue [
20]. The authors of [
53] found that at a soil depth of 0–5 cm, external conditions such as wind speed have an effect on the soil surface wetness, which may introduce uncertainties in SM retrievals. The authors of [
54] found that fairly satisfactory SSM at the bare soil top surface layer can be obtained from EO sensors (i.e., at depths of 5 cm and 15 cm) or in areas where vegetation cover is low. The authors of [
55] stated that SSM retrievals using optical EO data are effective at 10-cm soil depth. Recently [
56] compared Mo derived from the “simplified triangle” with surface soil water measured at 5-cm and 15-cm depths for a study site in India. They reported the best agreement on bare soil pixels or pixels with low Fr, and also at soil depths of 5 cm.
Another factor that could potentially account for the deviations between predictions and observations for both EF and SSM is the temporal mismatch which exists between these values. The ground observations which formed our reference dataset were obtained on the same day as the Sentinel-3 overpass, but they were not measured at the precise satellite overpass time. Nonetheless, this factor is expected to have a negligible influence on the validation carried out herein, as the ground measurements were linearly interpolated, an approach which has also been adopted elsewhere [
48,
57], in an attempt to address the issue of the exact time mismatch.
A further factor may be related to the accuracy and precision of the instruments. This might be more prominent in the flux measurements coming from the eddy covariance system, which is used to compute EF from the instantaneous fluxes of LE and Rn. Various studies have demonstrated that measurement errors in instantaneous LE flux under certain circumstances (such as terrain features) can be in the order of as much as 20–30%, whereas for Rn measurements, uncertainty of 10% can often be assumed [
58]. Furthermore, for EF in particular, the passage of clouds can lead to abrupt changes, since it lowers the levels of shortwave radiation (Rg) and the available energy reaching at the Earth’s surface, causing EF to increase slightly. For example, [
59] suggested that a 20% decrease in available energy caused by an increase in low-level clouds from 0–50 % coverage might result in a 5% increase in EF. These are some possible reasons for the systematic overestimations of EF obtained from the satellite data (refer to
Figure 6,
Table 4). Other possible reasons may be related to the limitations of the technique itself.
The implementation of the “simplified “triangle” presents certain limitations, namely: (1) It requires an image with a sufficiently large number of pixels, and with values covering the whole spectrum of soil moisture concentration and Fr range. Furthermore, surfaces which are relatively “wet”, i.e., which evaporate at a given rate, or “dry”, i.e., where nearly no evapotranspiration is occurring, are necessary; (2) Like other Ts/VI methods, it depends on optical and TIR remote-sensing observations, and as such, its use is restricted to clear-sky conditions; (3) Implementation of the technique may be prone to human-induced errors, e.g., due to subjectivity in warm- and cold-edge selection, which often introduces additional uncertainty. This is an issue that also challenges many other Ts/VI methods (e.g., refer to the discussion by [
9,
16,
48]).
Nonetheless, the “simplified “triangle” implementation with the Sentinel-3 presents several advantages. First, it is based on globally available satellite data which are available at no cost. Second, the technique is simple and robust in its implementation and it does not require significant computational resources when applied to small scale studies. A further advantage is its reliance on just a few inputs which are generally easily computed from EO sensors. The method is able to provide reasonably accurate predictions, even in highly fragmented environments and dynamically changing landscapes such as the Mediterranean savannah ecosystems included in our experimental setup. Finally, the implementation steps are robust and adaptable to other locations; additionally, the method can be adjusted for integration with other available EO data. These characteristics could potentially make this technique a good candidate for operational development on a global scale.
The technique performed well for our study area and investigated time period. However, further investigation is required to establish its general applicability. More research is required to assess the extent to which it can be applied to monitoring EF and SSM on a long-term basis, also other ecosystem conditions/regions and with different EO data (e.g., Landsat, MODIS, Seviri). In addition, a detailed sensitivity analysis of the method will allow us to properly assess the effect of Fr and Ts errors on the accuracy of the predictions. These two steps will help to extend our understanding of the capabilities of the “simplified triangle” technique and further establish its robustness and the accuracy of its predictions [
60]. Furthermore, the approach of defining the wet and dry edges, as required to apply the technique, should be further scrutinized, removing any doubt of user subjectivity (e.g., by fully automating the process computationally). Last but not least, a method is required to allow estimations of EF and SSM to be made under all weather conditions; a promising avenue in this regard could be the synergetic use of microwave data with optical and TIR EO data [
48]. This issue in other Ts/VI approaches also requiring the determination of the cold and warm edges has already been explored in many studies. Yet, some issues remain (e.g., see [
50]. All the above are topics of key importance to be taken up in future studies.


