Article

Comparison of Conventional Change Detection Methodologies Using High-Resolution Imagery to Find Forest Damage Caused by Typhoons

1
Graduate School of Agriculture, Hokkaido University, Sapporo, Hokkaido 060-8587, Japan
2
Department of Environmental and Symbiotic Science, Rakuno Gakuen University, Ebetsu 069-8501, Japan
*
Author to whom correspondence should be addressed.
Remote Sens. 2020, 12(19), 3242; https://doi.org/10.3390/rs12193242
Submission received: 18 August 2020 / Revised: 30 September 2020 / Accepted: 2 October 2020 / Published: 6 October 2020
(This article belongs to the Special Issue Feature Paper Special Issue on Forest Remote Sensing)

Abstract

:
The number of intense tropical cyclones is expected to increase in the future, causing severe damage to forest ecosystems. Remote sensing plays an important role in detecting changes in land cover caused by these tropical storms. Remote sensing techniques have been widely used in different phases of disaster risk management because they can deliver information rapidly to the concerned parties. Although remote sensing technology is already available, an examination of appropriate methods based on the type of disaster is still missing. Our goal is to compare the suitability of three different conventional classification methods for fast and easy change detection analysis using high-spatial-resolution and high-temporal-resolution remote sensing imagery to identify areas with windthrow and landslides caused by typhoons. In August 2016, four typhoons hit Hokkaido, the northern island of Japan, creating large areas of windthrow and landslides. We compared the normalized difference vegetation index (NDVI) filtering method, the spectral angle mapper (SAM) method, and the support vector machine (SVM) method to identify windthrow and landslides in two different study areas in southwestern Hokkaido. These methodologies were evaluated using PlanetScope data with a resolution of 3 m/px and validated with reference data based on Worldview2 data with a very high resolution of 0.46 m/px. The results showed that all three methods, when applied to high-spatial-resolution imagery, can deliver sufficient results for windthrow and landslide detection. In particular, the SAM method performed better at windthrow detection, and the NDVI filtering method performed better at landslide detection.

Graphical Abstract

1. Introduction

Typhoons are the main natural hazard affecting forest ecosystems in eastern Asia [1], and strong winds and heavy rains make forests vulnerable to damage [2,3]. Although projections under the Intergovernmental Panel on Climate Change (IPCC) A1B scenario show that there will be a decrease in the number of tropical cyclones globally due to climate change, the frequency of intense tropical cyclones is expected to increase by the end of the twenty-first century [4], leading to an increase in windthrow and landslide disturbances affecting forest ecosystems.
Remote sensing is a technology that is widely used in different phases of disaster risk management [5,6] and rapidly delivers information to support planners, scientists, and decision-makers [7,8]. One of the ways to obtain information on land cover change caused by natural disasters using remotely sensed data is through visual interpretation of satellite data by manual digitalization of patches of change, which can be time-consuming and ambiguous in terms of the necessary criteria, especially when large areas are disturbed [9,10]. Therefore, the automatic classification of remotely sensed data is more suitable for identifying land cover changes, with some caveats, such as the limited pattern recognition ability compared to that of the human brain [11]. Apart from an automatic classification process, the input data are of extreme importance for change detection analysis. If the temporal resolution is low, it may not be possible to check the effects of certain natural disturbances on land cover [12]. In contrast, higher-spatial-resolution images also reduce the occurrence of mixels [13], improving the identification of damages in the final result.
The remote sensing community has also contributed to the rapid evolution of this application by developing more accurate and efficient change detection techniques, such as deep learning using very-high-resolution images [14], unmanned aerial vehicles for mapping [15], and postclassification methods to improve accuracy [16]. Although all these technologies are available, an examination of appropriate methods based on the type of disaster for fast and reliable land cover change detection is still missing [17]. Additionally, the evolution of remote sensing has made this technology accessible to a broader range of end-users [18,19], which do not necessarily have sufficient skill levels to apply complex algorithms for change detection.
In 2016, four typhoons hit the island of Hokkaido, Japan, damaging a total of 9,000 ha of forest and triggering two major types of damage: windthrow and landslides [20]. Images taken from before and after the arrival of typhoons are used to compare the suitability of three different conventional change detection methodologies to identify windthrow and landslide damage: the normalized difference vegetation index (NDVI) filtering method, the spectral angle mapper (SAM) method, and the support vector machine (SVM) method. This study selected PlanetScope imagery with high spatial and temporal resolutions to ensure the reliability of the change detection analysis [21].
The methodologies were chosen based on their relative operational simplicity, fast processing, and satisfactory results in previous studies. The NDVI filtering method presented by Tsai [22] was used to preliminarily identify landslides and was able to effectively detect landslides in combination with change vector analysis. For windthrow detection, the SAM classifier was considered fast and relatively easy to apply, yielding satisfactory results in combination with multivariate alteration detection postprocessing [17]. The SVM method, although more sophisticated than the other methods, is implemented as part of the Google Earth Engine platform, which makes it easy to apply, and using cloud computing delivers fast results [23].
Therefore, our goal in this study is to compare the suitability of these three different conventional remote sensing methods when used separately for fast and easy change detection analysis, taking advantage of high-spatial-resolution and high-temporal-resolution imagery to identify windthrow and landslide areas resulting from typhoons.

2. Materials and Methods

2.1. Typhoons and The Study Area

In August 2016, four typhoons hit Hokkaido, the northernmost island of Japan: Chanthu (No. 7, making landfall on 17 August), Mindulle (No. 9, making landfall on 23 August), Lionrock (No. 10, passing very close to the study area on 30 to 31 August), and Kompasu (No. 11, making landfall on 21 August). The wind reached speeds up to 45.5 m/s and was accompanied by heavy rain [24] for 15 successive days, producing two major types of damage: windthrow and landslides [20]. In this study, we focused on the detection of the windthrow and landslides present immediately after all four typhoons had crossed the island of Hokkaido by 31 August 2016.
This study was conducted at two different study sites in the southeastern part of Hokkaido. According to the local authorities, the outskirts of Setana town suffered from windthrow and landslide damage caused by the typhoons. We defined the first study site, Setana North (42°31’N, 139°58’E), for windthrow detection and the second study site, Setana South (42°22’N, 139°58’E), for landslide detection. Both study sites covered an area of approximately 150 km2 (Figure 1). Both regions included flat plains and steep mountains varying from 0 m to 1300 m in elevation and were covered by natural forests of Fagus crenata Blume, Betula ermanii Cham., and Acer pictum Thunb. and plantation forests of Abies sachalinensis (F. Schmidt) Mast. and Larix kaempferi (Lamb.) Carrière.

2.2. Remote Sensing Dataset

For windthrow and landslide detection, pre and posttyphoon PlanetScope Analytic Product images were acquired [25]. PlanetScope is a satellite constellation consisting of approximately 120 microsatellites delivering a near-daily temporal resolution. The images have a high spatial resolution of 3 m per pixel, which is suitable according to a field survey performed prior to the study, in four different spectral bands: blue (455–515 nm), green (500–590 nm), red (590–670 nm), and near-infrared (780–860 nm).
The PlanetScope Analytic Product offers orthorectified images from which distortions caused by terrain and perspective effects on the ground have been removed, thereby restoring the geometry of a vertical shot, and data that have been radiometrically calibrated, which produces a surface reflectance product.
For both test sites, we used pretyphoon images acquired on 27 August 2016, 3 days before the Lionrock typhoon hit, and posttyphoon images acquired on 21 September 2016, 21 days after the typhoons hit. The images from each date were mosaicked, and the urban areas and agricultural fields were masked using forest data provided by the Japanese Ministry of Land Infrastructure Transport and Tourism [26] that were adjusted to match the PlanetScope imagery. For cloud masking, we considered the unusable data mask (udm) file included alongside the PlanetScope Analytic Product, which provides information on unusable data, such as those affected by clouds. The mask did not cover all clouds nor cloud shadows, and with the study area being relatively small, we additionally manually masked the clouds and cloud shadows through visual interpretation of the data.
The input for the SAM and SVM classification methods was a composite image created by layer stacking the pre and posttyphoon mosaics. We layer-stacked the eight bands of the image in the following order: 1. blue (posttyphoon), 2. green (posttyphoon), 3. red (posttyphoon), 4. near-infrared (posttyphoon), 5. blue (pretyphoon), 6. green (pretyphoon), 7. red (pretyphoon), and 8. near-infrared (pretyphoon). This step was essential for identifying only the changes that occurred between the two dates by constituting a land cover change spectral signature. For the NDVI filtering method, the input data were the NDVI values of the pre- and posttyphoon mosaics.
Additionally, RGB WorldView2 images from 20 August 2017, which were the closest images available from Digital Globe after the typhoons hit, were used to support the digitalization of training samples for the SAM and SVM classification methods. We visually defined the classes of each point for accuracy assessment, as we explain later. This dataset was selected due to its very high spatial resolution of 0.46 m/px, enabling the visual interpretation of the area [27].

2.3. Windthrow and Landslide Detection

To detect windthrow and landslides in each test site, we used three different classification methods: the NDVI filtering method, SAM method, and SVM method (Figure 2).

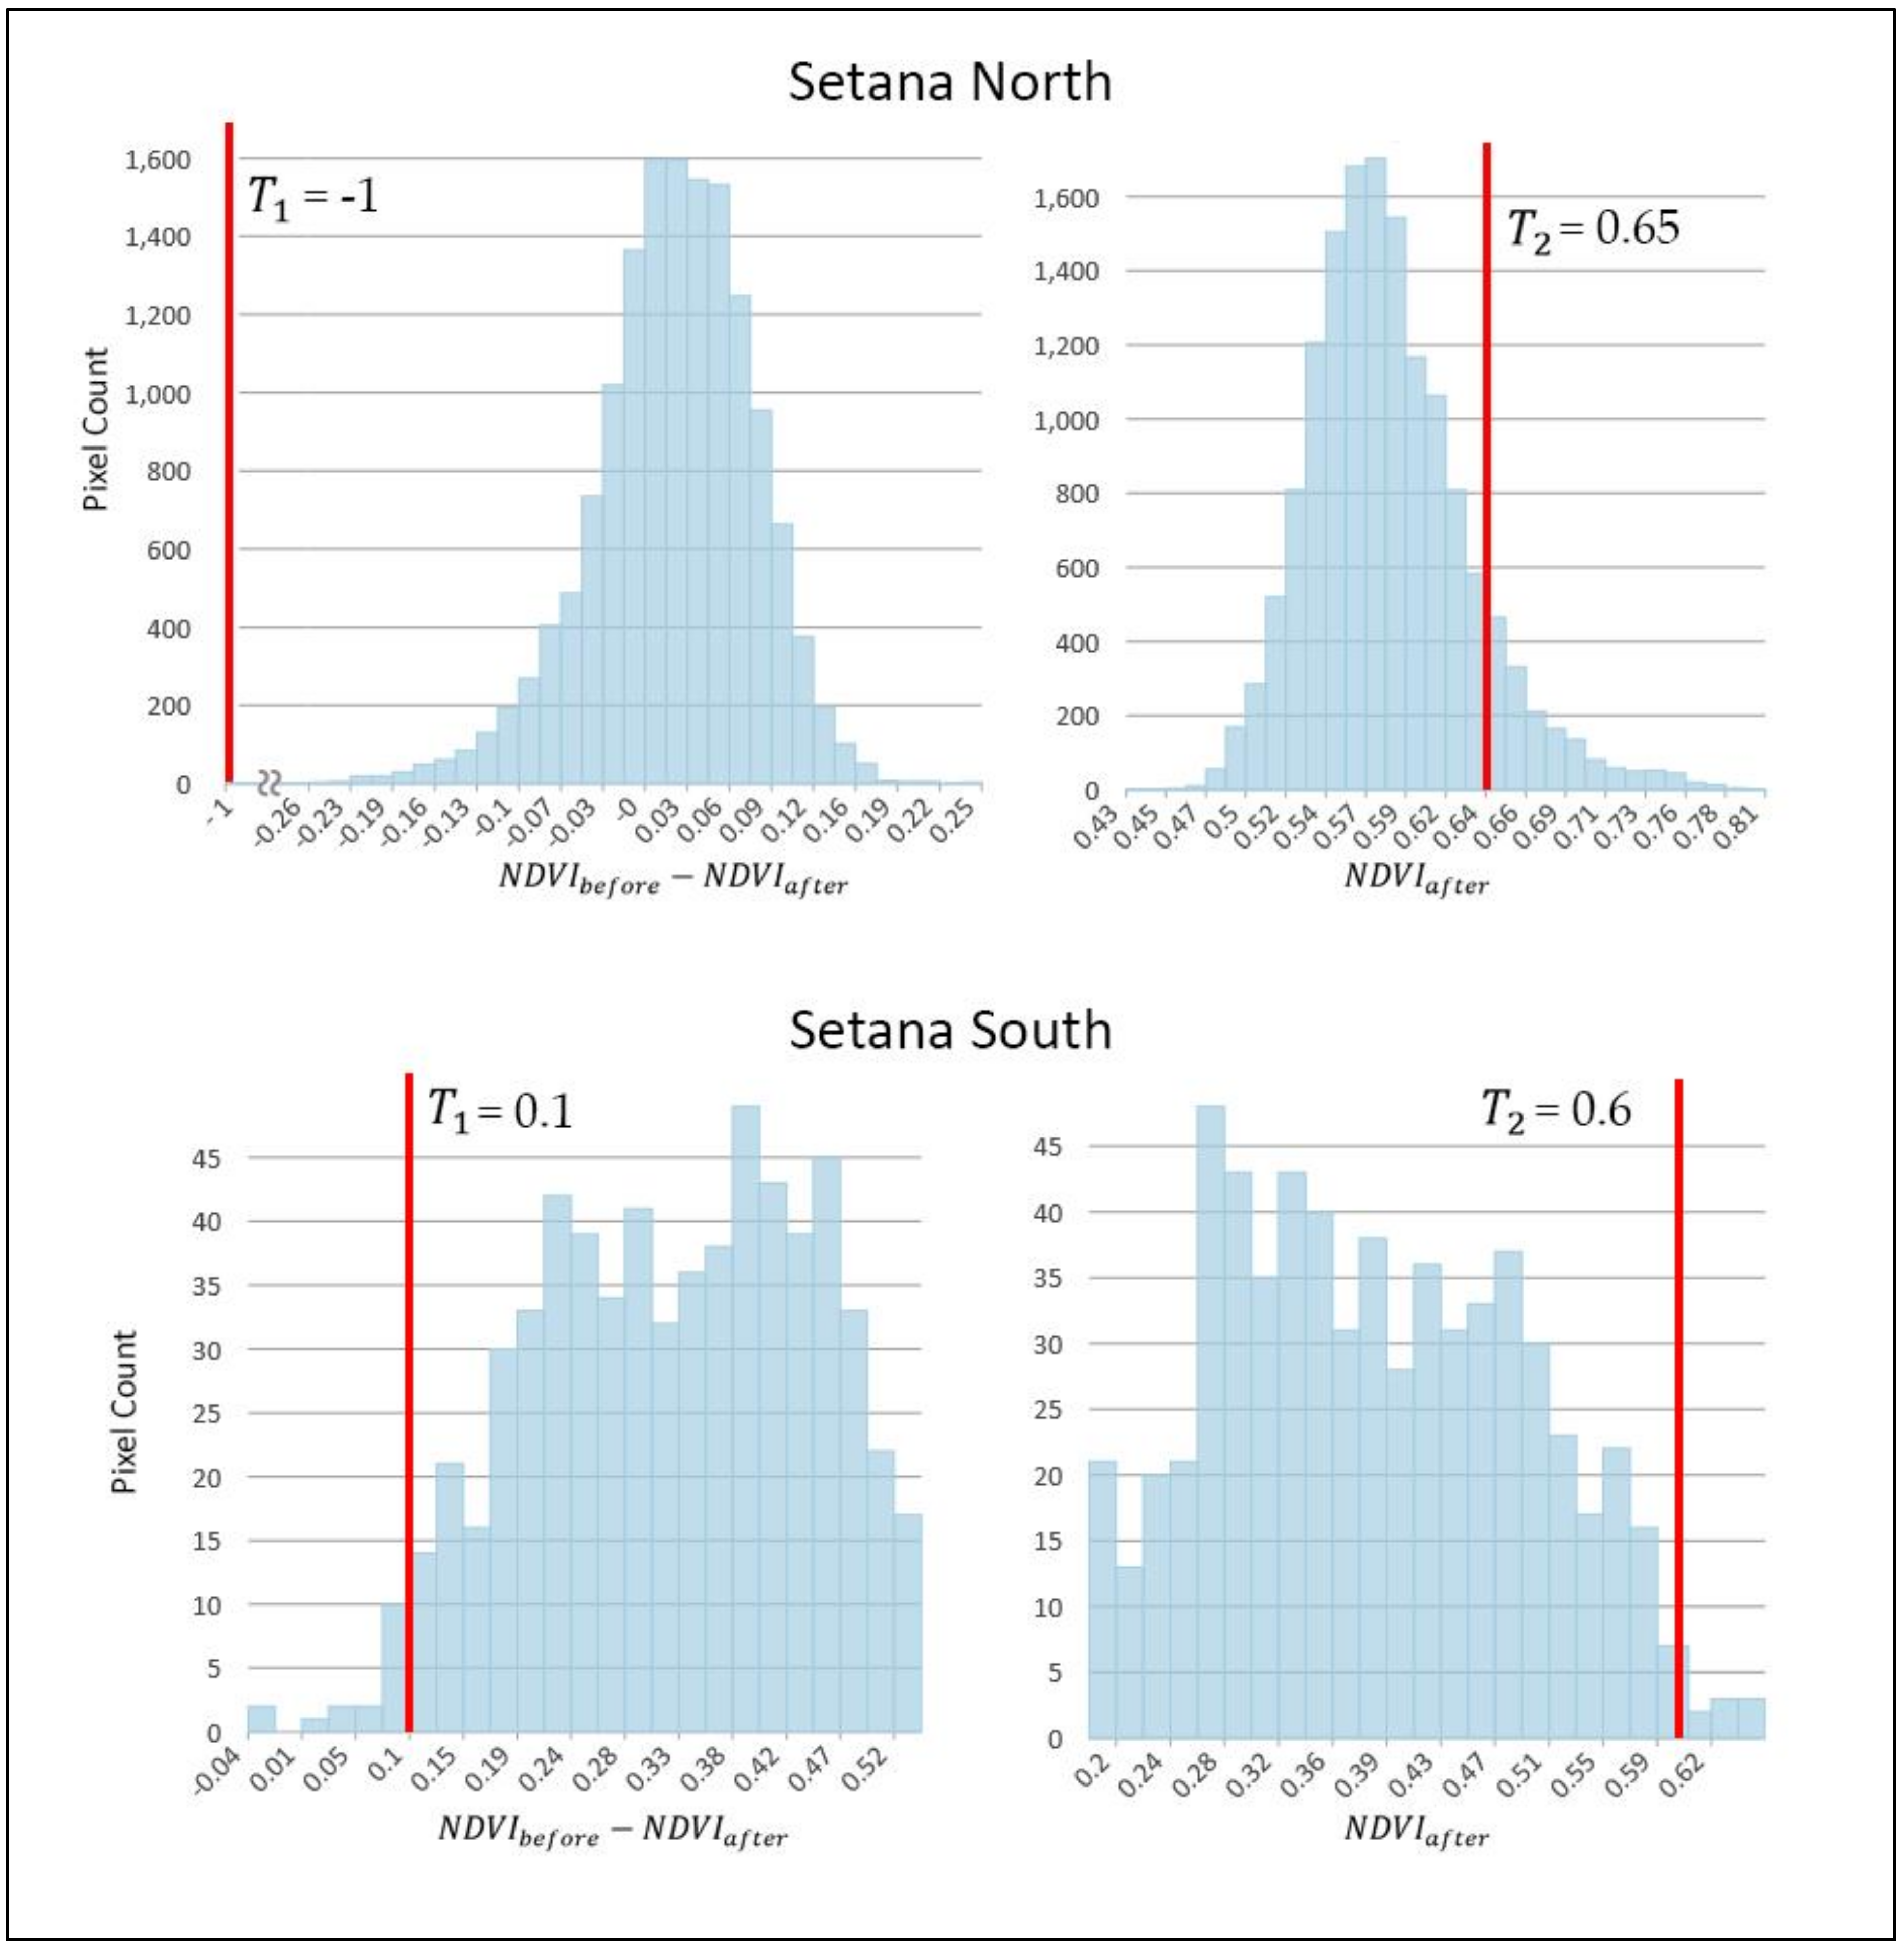
2.3.1. Normalized Difference Vegetation Index Filtering Method

The NDVI is an effective index used to measure the type and amount of vegetation by measuring the difference between near-infrared and red bands, with values ranging between –1 and 1. This index was first presented by Rouse et al. [28].
The NDVI filtering method for landslide detection shown by Tsai [22] identifies landslides through the NDVI thresholds T 1 and T 2 using the NDVI filtering rule (Equation (1)).
N D V I b e f o r e N D V I a f t e r   >   =   T 1 ^   N D V I a f t e r < =   T 2
where:
N D V I b e f o r e   = NDVI values obtained from the pretyphoon mosaic;
N D V I a f t e r     = NDVI values obtained from the posttyphoon mosaic;
T 1 and T 2   = Threshold value.
To perform the NDVI filtering method, we used the Map Algebra Function of the Spatial Analyst Package in ArcGIS 10.7, where threshold values were defined based on the NDVI values calculated from the pre and posttyphoon images. Histograms of known damaged areas were created to support the choice of threshold values along with the visual interpretation of the classified result. The threshold values for Setana North were defined as T 1   = −1 and T 2   = 0.65, and those for Setana South were defined as T 1   = 0.1 and T 2   = 0.6 (Figure 3).

2.3.2. Spectral Angle Mapper Method

The SAM method is a spectral classification method that considers an n-dimensional angle to match the pixel to a reference spectral signature. It calculates the angle between the spectral signature of an image and the spectral signature of a training sample by treating them as vectors.
This technique is insensitive to illumination and albedo effects when used on radiometrically calibrated data. The angle θ was defined by Kruse [29] (Equation (2)):
θ x , y   =   cos 1 i   =   1 n x i y i i   =   1 n x i 2 1 2     i   =   1 n y i 2 1 2
where:
x = spectral signature vector of each pixel from the image;
y = spectral signature vector of the training sample;
n = number of bands.
The pixel matches the class that has the smallest angle (Equation (3)):
x C k θ x , y k < θ x , y j k j   a n d   θ x , y k < T   (
where:
C k = class   k ;
y k   = spectral signature of class k ; y j   = spectral signature of class   j   ;
T = threshold to exclude pixels greater than this value.
The SAM method was performed using the Semi-Automatic Classification Plugin [30] in QGIS 3.10 [31]. Based on composite layer stacked images used as input, training samples were defined by digitized polygons in known damaged areas and checked using the pre and posttyphoon PlanetScope data accompanied by the Worldview2 imagery, and the threshold T was defined.
To determine the optimal numbers of training samples and threshold values for windthrow and landslide detection, we tested different numbers of training samples (1, 2, 4, 8, and 16) and different threshold values (1, 4, 7, 10, 13, and 16) and compared the overall accuracies of all combinations (Figure 4).
The criteria used to define the optimal values for classification were the highest overall accuracy, using the fewest training samples, and visual interpretation of the final classification result. For windthrow detection in Setana North, the number of selected training samples was 2, with a threshold set at 7 (overall accuracy: 92.5%). Visual interpretation of the classified map revealed some scattered false-positive misclassifications (the classified map defined the area as damaged, but the reference map showed a nondamaged area), so the size and location of the training samples were empirically adjusted to improve classification.
For landslide detection in Setana South, 8 training samples with the threshold value set at 7 delivered the highest overall accuracy (93.5%); however, visual interpretation of the classification map revealed a large number of scattered false-positive misclassifications. Then, we selected the combination of 4 training samples with a threshold set at 7 (overall accuracy, 93%), which presented a better balance among the number of training samples, overall accuracy, and overall shape of the final map.

2.3.3. Support Vector Machine Method

The SVM is a classifier that separates different classes by a hyperplane in an n-dimensional space. Support vectors are data points near the hyperplane that influence the position and orientation of the hyperplane, trying to maximize the margin of the classifier [32].
The SVM model can handle outliers by creating a soft margin on the classifier; in other words, the SVM allows a certain number of misclassifications to keep the margin as wide as possible so that other points can be classified correctly.
In this study, the SVM method was applied using the Google Earth Engine platform [23]. The stacked and masked composite mosaics were uploaded to the platform, and classification was performed using the SVM classifier with the linear kernel type due to its relatively simple implementation and fast performance [33].
Training samples were created by digitizing polygons in the damaged area, and the cost parameter, which defines the margin of the hyperplane, was set to the default value of 1 to deliver the best results in both study areas. We applied the value after confirming that low values, such as 10−5, reduced the overall accuracy of the final result.
For Setana North, two training samples for windthrow areas (1.0234 ha and 0.4005 ha), two training samples for nonwindthrow areas (2.6990 ha and 0.9608 ha), and one training sample for water (5.1028 ha) were selected. The water class was posteriorly merged with the nonwindthrow class. In Setana South, we selected two training samples for landslides (0.01843 ha and 0.03507 ha) and two training samples for nonlandslide areas (9.9478 ha and 26.4685 ha).
The code for classification is provided in Google Earth Engine (Supplementary information S1 and S2).

2.4. Assessment

Accuracy assessment permits the quantitative analysis of the product of a classifier algorithm through an error matrix, which is a tabular layout that shows the performance of a classifier where each row of the matrix represents the predicted class while the columns represent the actual class (or vice versa). The error matrix can deliver different assessment values, including overall accuracy, user accuracy, producer accuracy, and kappa values [34,35].
To generate stratified random points for assessing the accuracy of each classified map with each standard error, we used the AcATaMA plugin [36] for QGIS 3.10, with 100 random points for each class (damage and no damage) from the SVM method classified map, totaling 200 points for each study site. This sampling method was found to be appropriate for simple two-class classification [7,37,38].
Then, each random point was visually interpreted, and the land cover class was defined by visually interpreting the pre- and posttyphoon PlanetScope images with the very-high-spatial-resolution WorldView2 images to generate error matrices for each classified map. This process was also performed to define the optimal values for the SAM method.
The error matrices reflected the trend of misclassification in the form of producer accuracy and user accuracy and estimated accuracy in the form of the overall accuracy and kappa values. We analyzed the misclassification trend among the classification methods, especially for the false-positive points of misclassification. We visually identified the land cover type of each point and compared the spectral signatures based on the land cover type to the points that were correctly classified as windthrow or a landslide.

3. Results

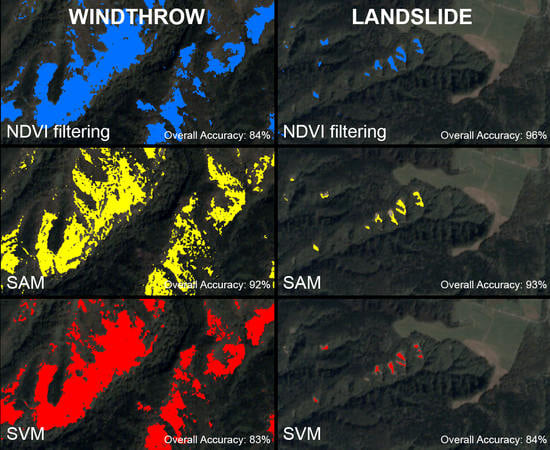
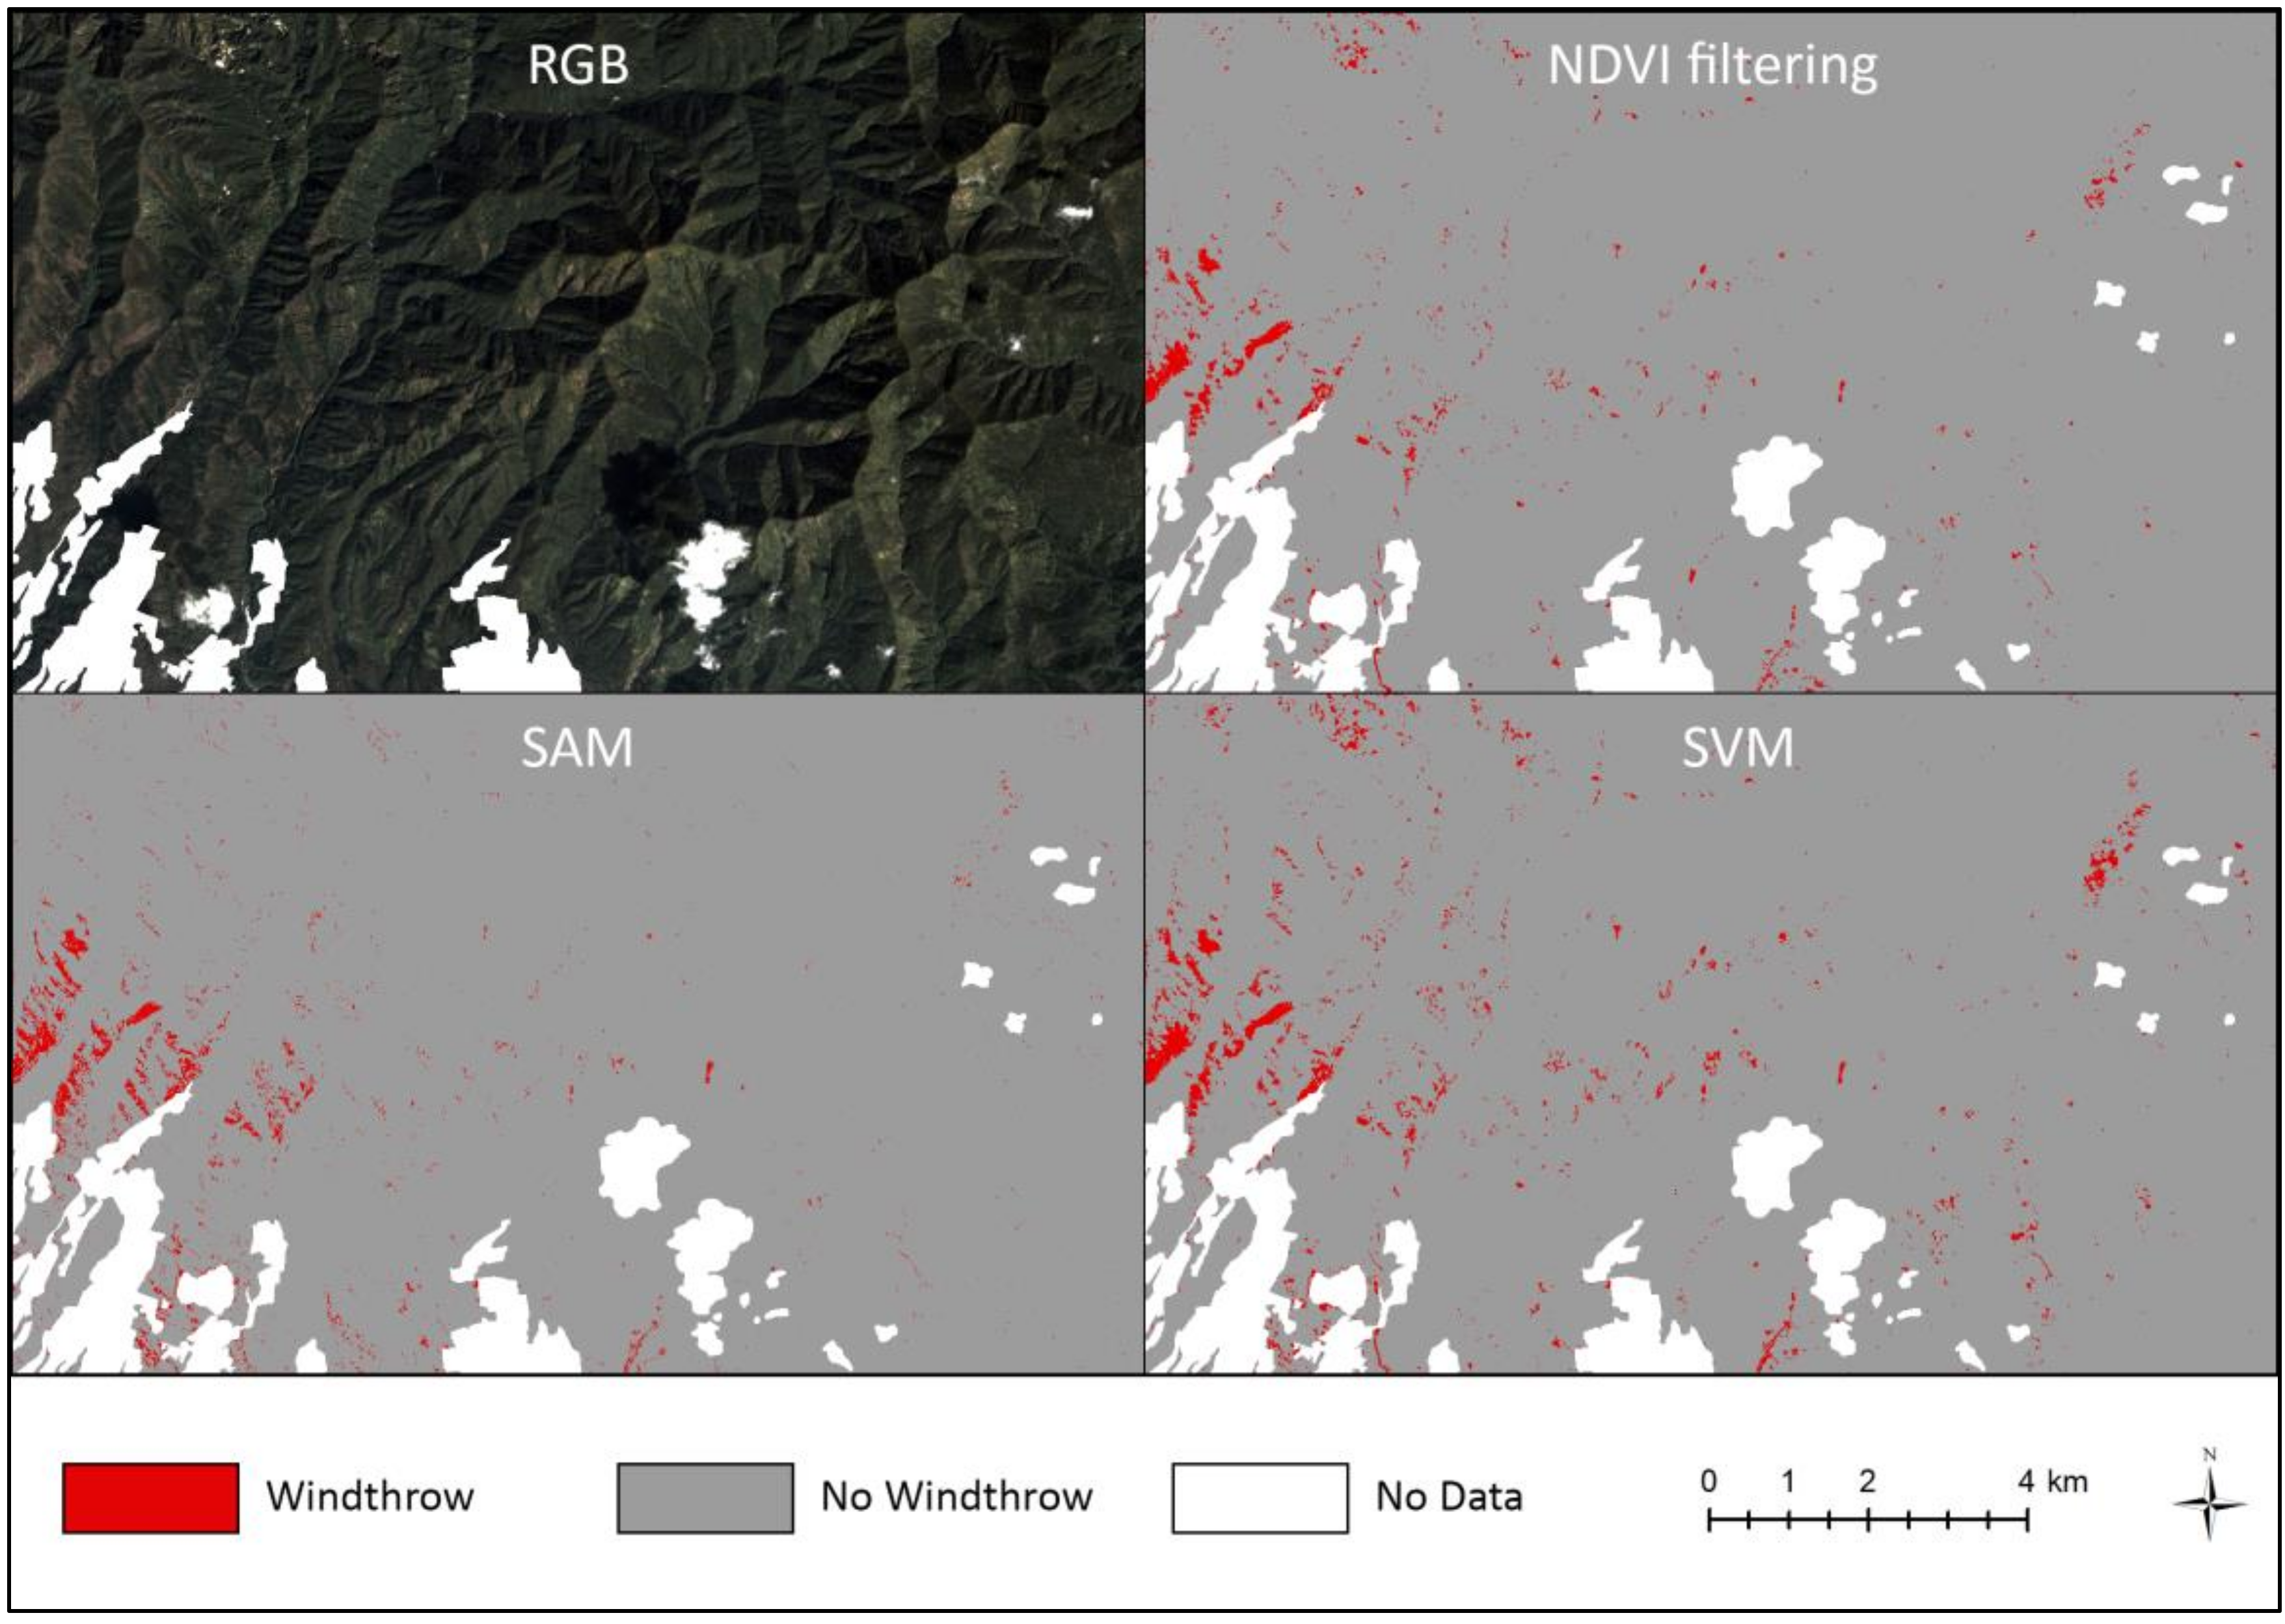
3.1. Windthrow Detection

For all three classification methods, the damage was concentrated on the western side of the Setana North study area (Figure 5). In a comparison of damage area, the SVM method classified 312.8 ha of windthrow, while the NDVI filtering method and SAM method classified 234.0 ha and 203.3 ha, respectively (Table 1).
Based on the overall accuracy in the error matrices, the SAM method was superior (overall accuracy of 92.0% with a standard error of 0.0234, followed by the other two methods’ overall accuracies: 84.0% for the NDVI filtering method with a standard error of 0.0159 and 83.0% for the SVM method with a standard error of 0.0098). The kappa values of the SVM and NDVI filtering methods were over 0.65, which was considered a “substantial level of agreement”, while the SAM method had a value of 0.82, which was considered an “almost perfect level of agreement” [39]. Despite the highest overall accuracy, the SAM method presented the lowest producer accuracy value for damaged areas (82.4% : 56/68), while the NDVI filtering method and the SVM method presented higher numbers (95.6% : 65/68 and 98.5% : 67/68, respectively). The lowest producer accuracy for the SAM method reflected the largest number of false-negative points (the classified map defined the area as not damaged, but the reference map showed that the area was damaged). On the other hand, the SAM method delivered the highest user accuracy of damaged areas (93.3% : 56/60), elevating its overall accuracy.
In terms of false positives, the SAM method misclassified only 4 points (forest areas), while the NDVI filtering method and the SVM method misclassified 29 and 33 points, respectively, especially in grassland areas (Table 2). The misclassification from both methods occurred basically at the same points. The spectral signatures between all misclassified points and windthrow area (Figure 6) presented similar shapes. The variation in each band of the misclassified points was wider than the variation in the windthrow area, mainly in the near-infrared bands (B4 and B8).

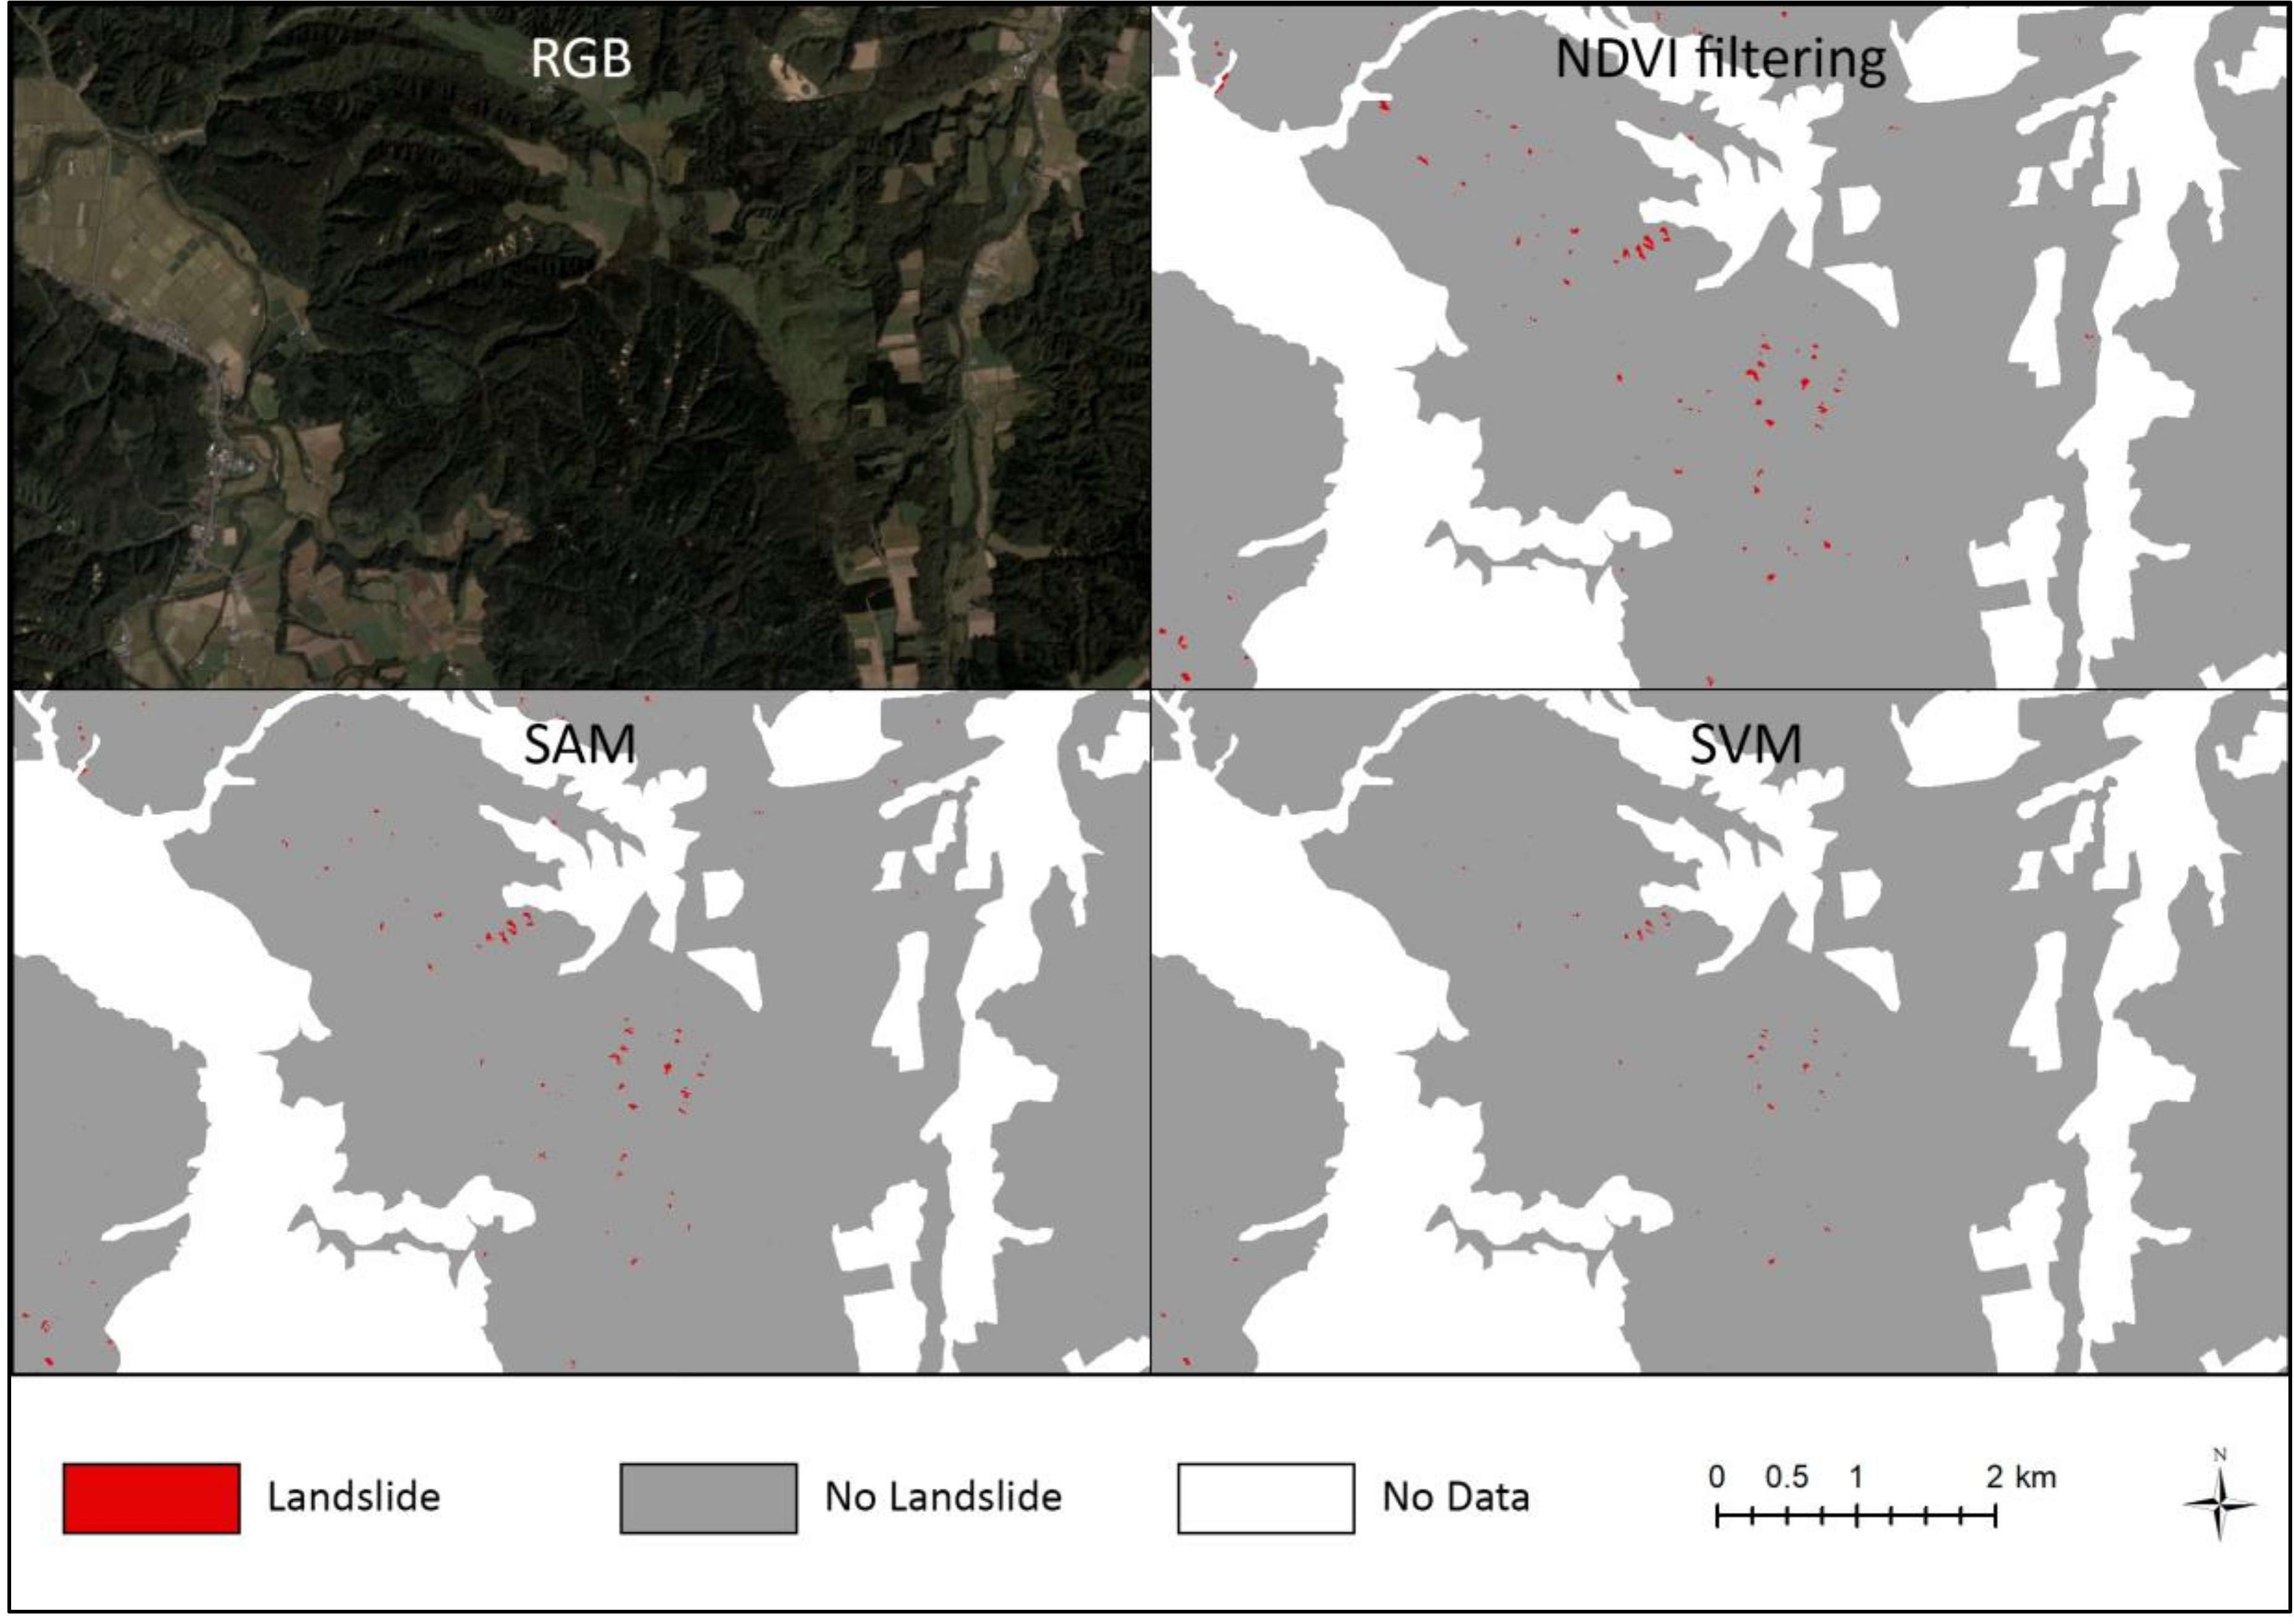
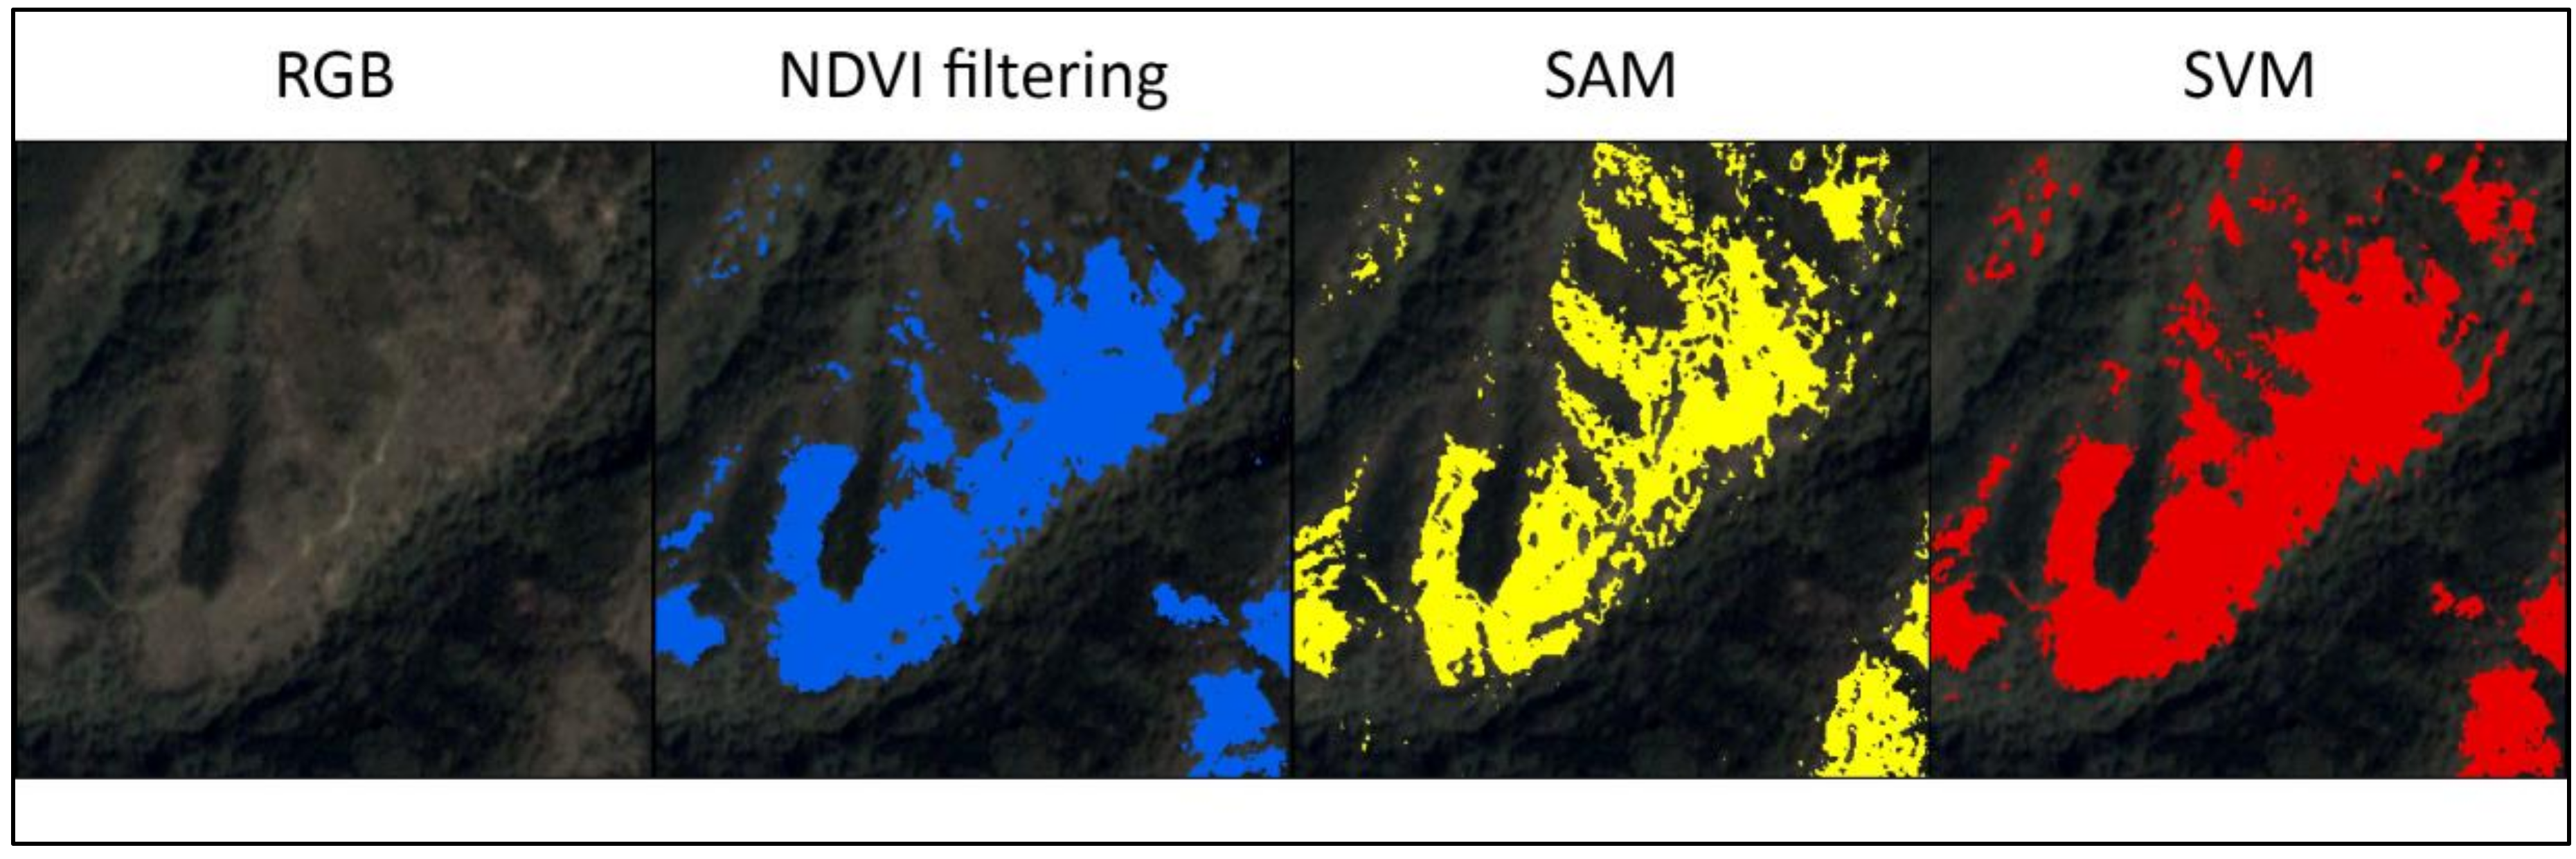
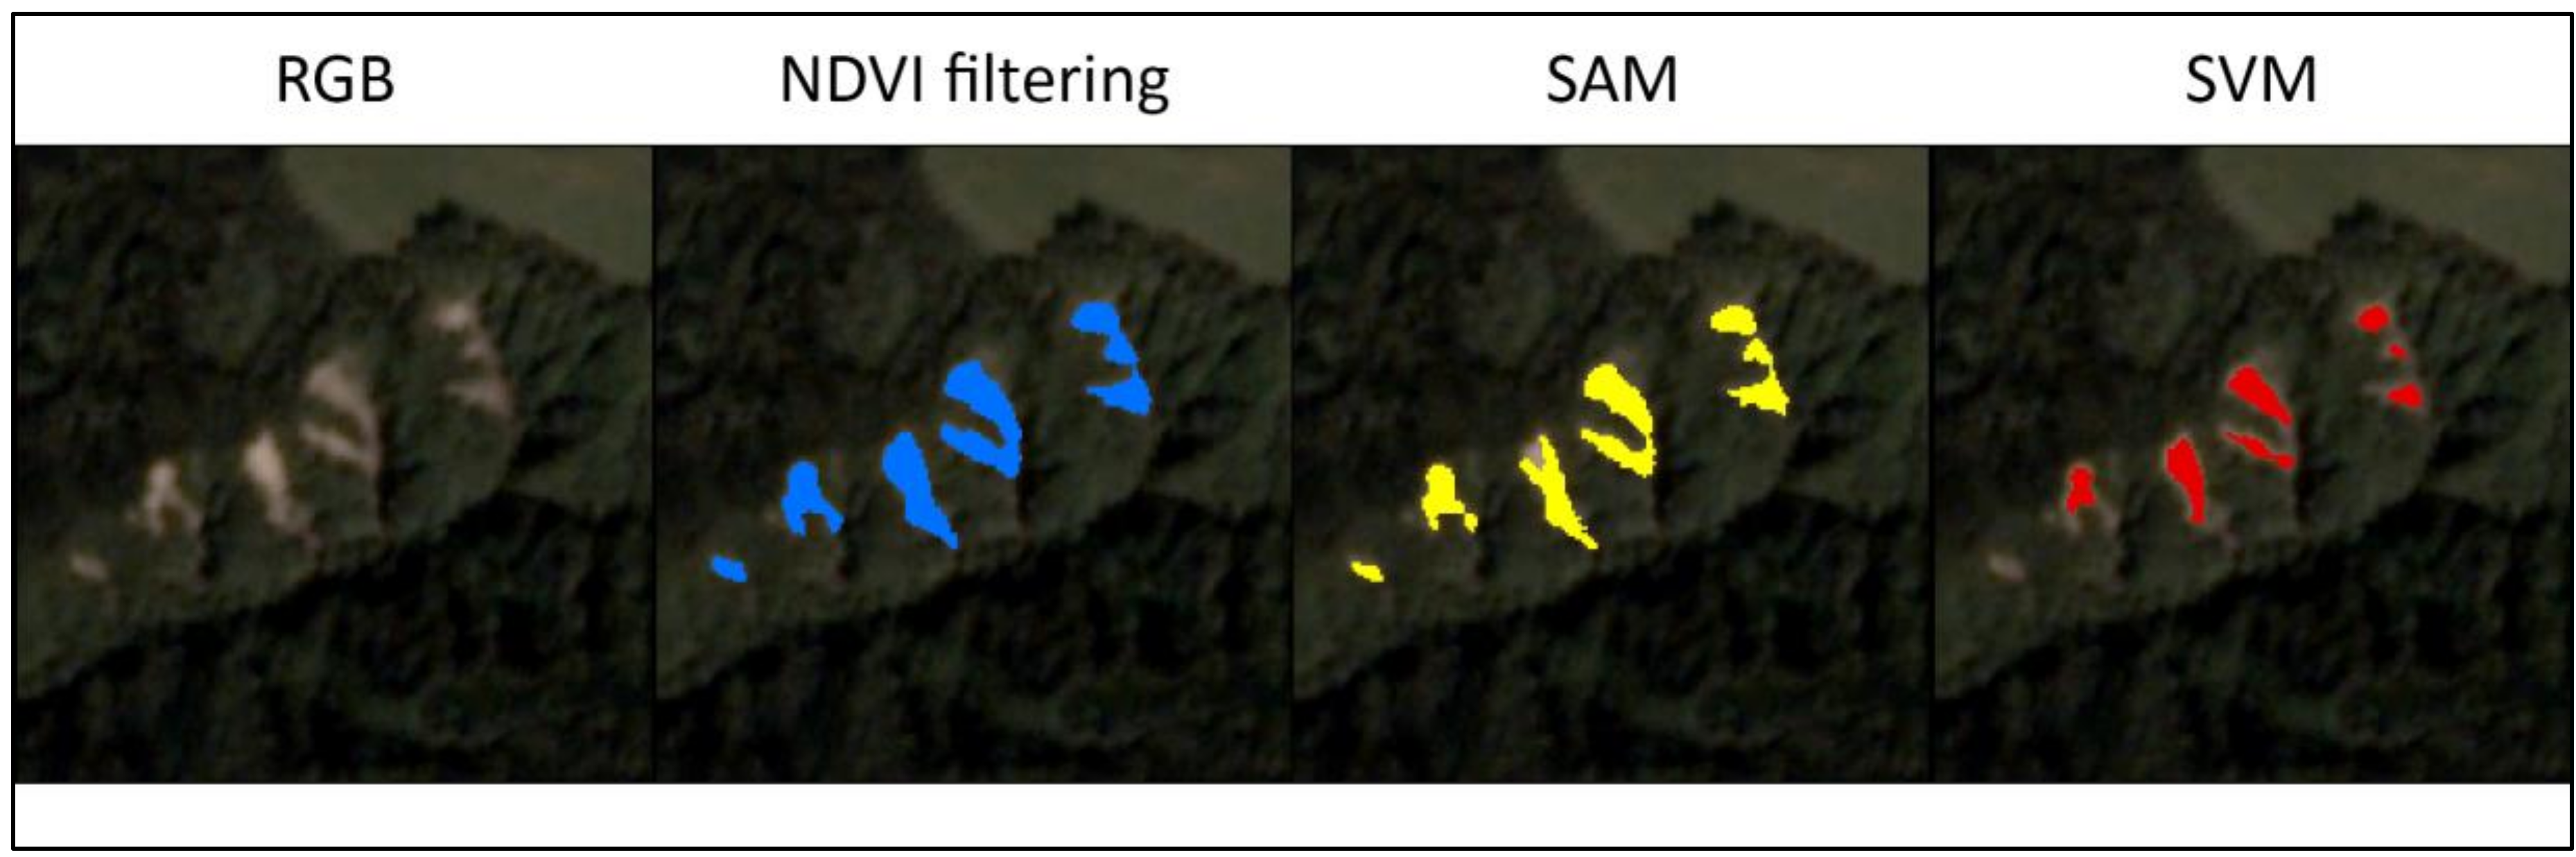
3.2. Landslide Detection

The largest number of landslides was identified in the west-central portion of the Setana South study area (Figure 7). The NDVI filtering method identified 22.0 ha of landslides, while the SAM method and SVM method identified 17.6 ha and 4.7 ha, respectively (Table 3).
The NDVI filtering method was significantly superior, with an overall accuracy of 96.0% and a standard error of 0.008. The producer accuracy and the user accuracy of the damaged areas also had values over 90% (Table 3).
The SAM method had the second best results (93.0% overall accuracy with a standard error of 0.0198), while the SVM method had the lowest overall accuracy of 84.0% with a standard error of 0.0099. The SAM method presented a lower producer accuracy percentage in damaged areas (90.0% : 63/70), while the SVM and NDVI filtering methods had a value of 98.6% (69/70).
The NDVI filtering method had the best results in all aspects, with an overall accuracy of 96.0%, a producer accuracy of 98.6%, and a user accuracy of 90.8%.
The lowest producer accuracy for the SAM method reflected the largest number of false-negative points. In contrast, compared to the SVM method, the SAM method had a higher user accuracy (90.0% : 63/70), and the SVM method had the lowest accuracy (69.0% : 69/100). The kappa values of the NDVI filtering method (0.91) and the SAM method (0.85) reflected an “almost perfect level of agreement”, followed by that of the SVM method (0.66), which represented a “substantial level of agreement”.
In terms of false-positive points, visual interpretation of the random assessment points with WorldView2 imagery revealed that misclassification occurred in bare areas (Table 4); the total number of points misclassified by the SVM method was 31, while the total number of points misclassified by the NDVI filtering method and the SAM method was only 7 (and they were the same points). The bare areas mainly included old landslide areas that occurred before the typhoon event.
The reflectance of the correctly classified points was slightly higher than that of the misclassified points, and the variation in the spectral signature of the posttyphoon points was larger than that of the misclassified points (Figure 8). Band B4 (near-infrared) presented higher values for landslides than for misclassified points, generating a slight difference in the spectral signatures between them.

4. Discussion

We detected the area damaged by windthrow and landslides after the typhoons hit with PlanetScope data. The posttyphoon images were collected 21 days after the typhoons hit, and no cloud-free images were available during these 21 days. The high temporal resolution of the PlanetScope data increased the chances of obtaining cloud-free images. Although these data have a relatively low spectral resolution of only four bands, the results showed that they were suitable for detecting windthrow and landslides using the chosen methodologies.

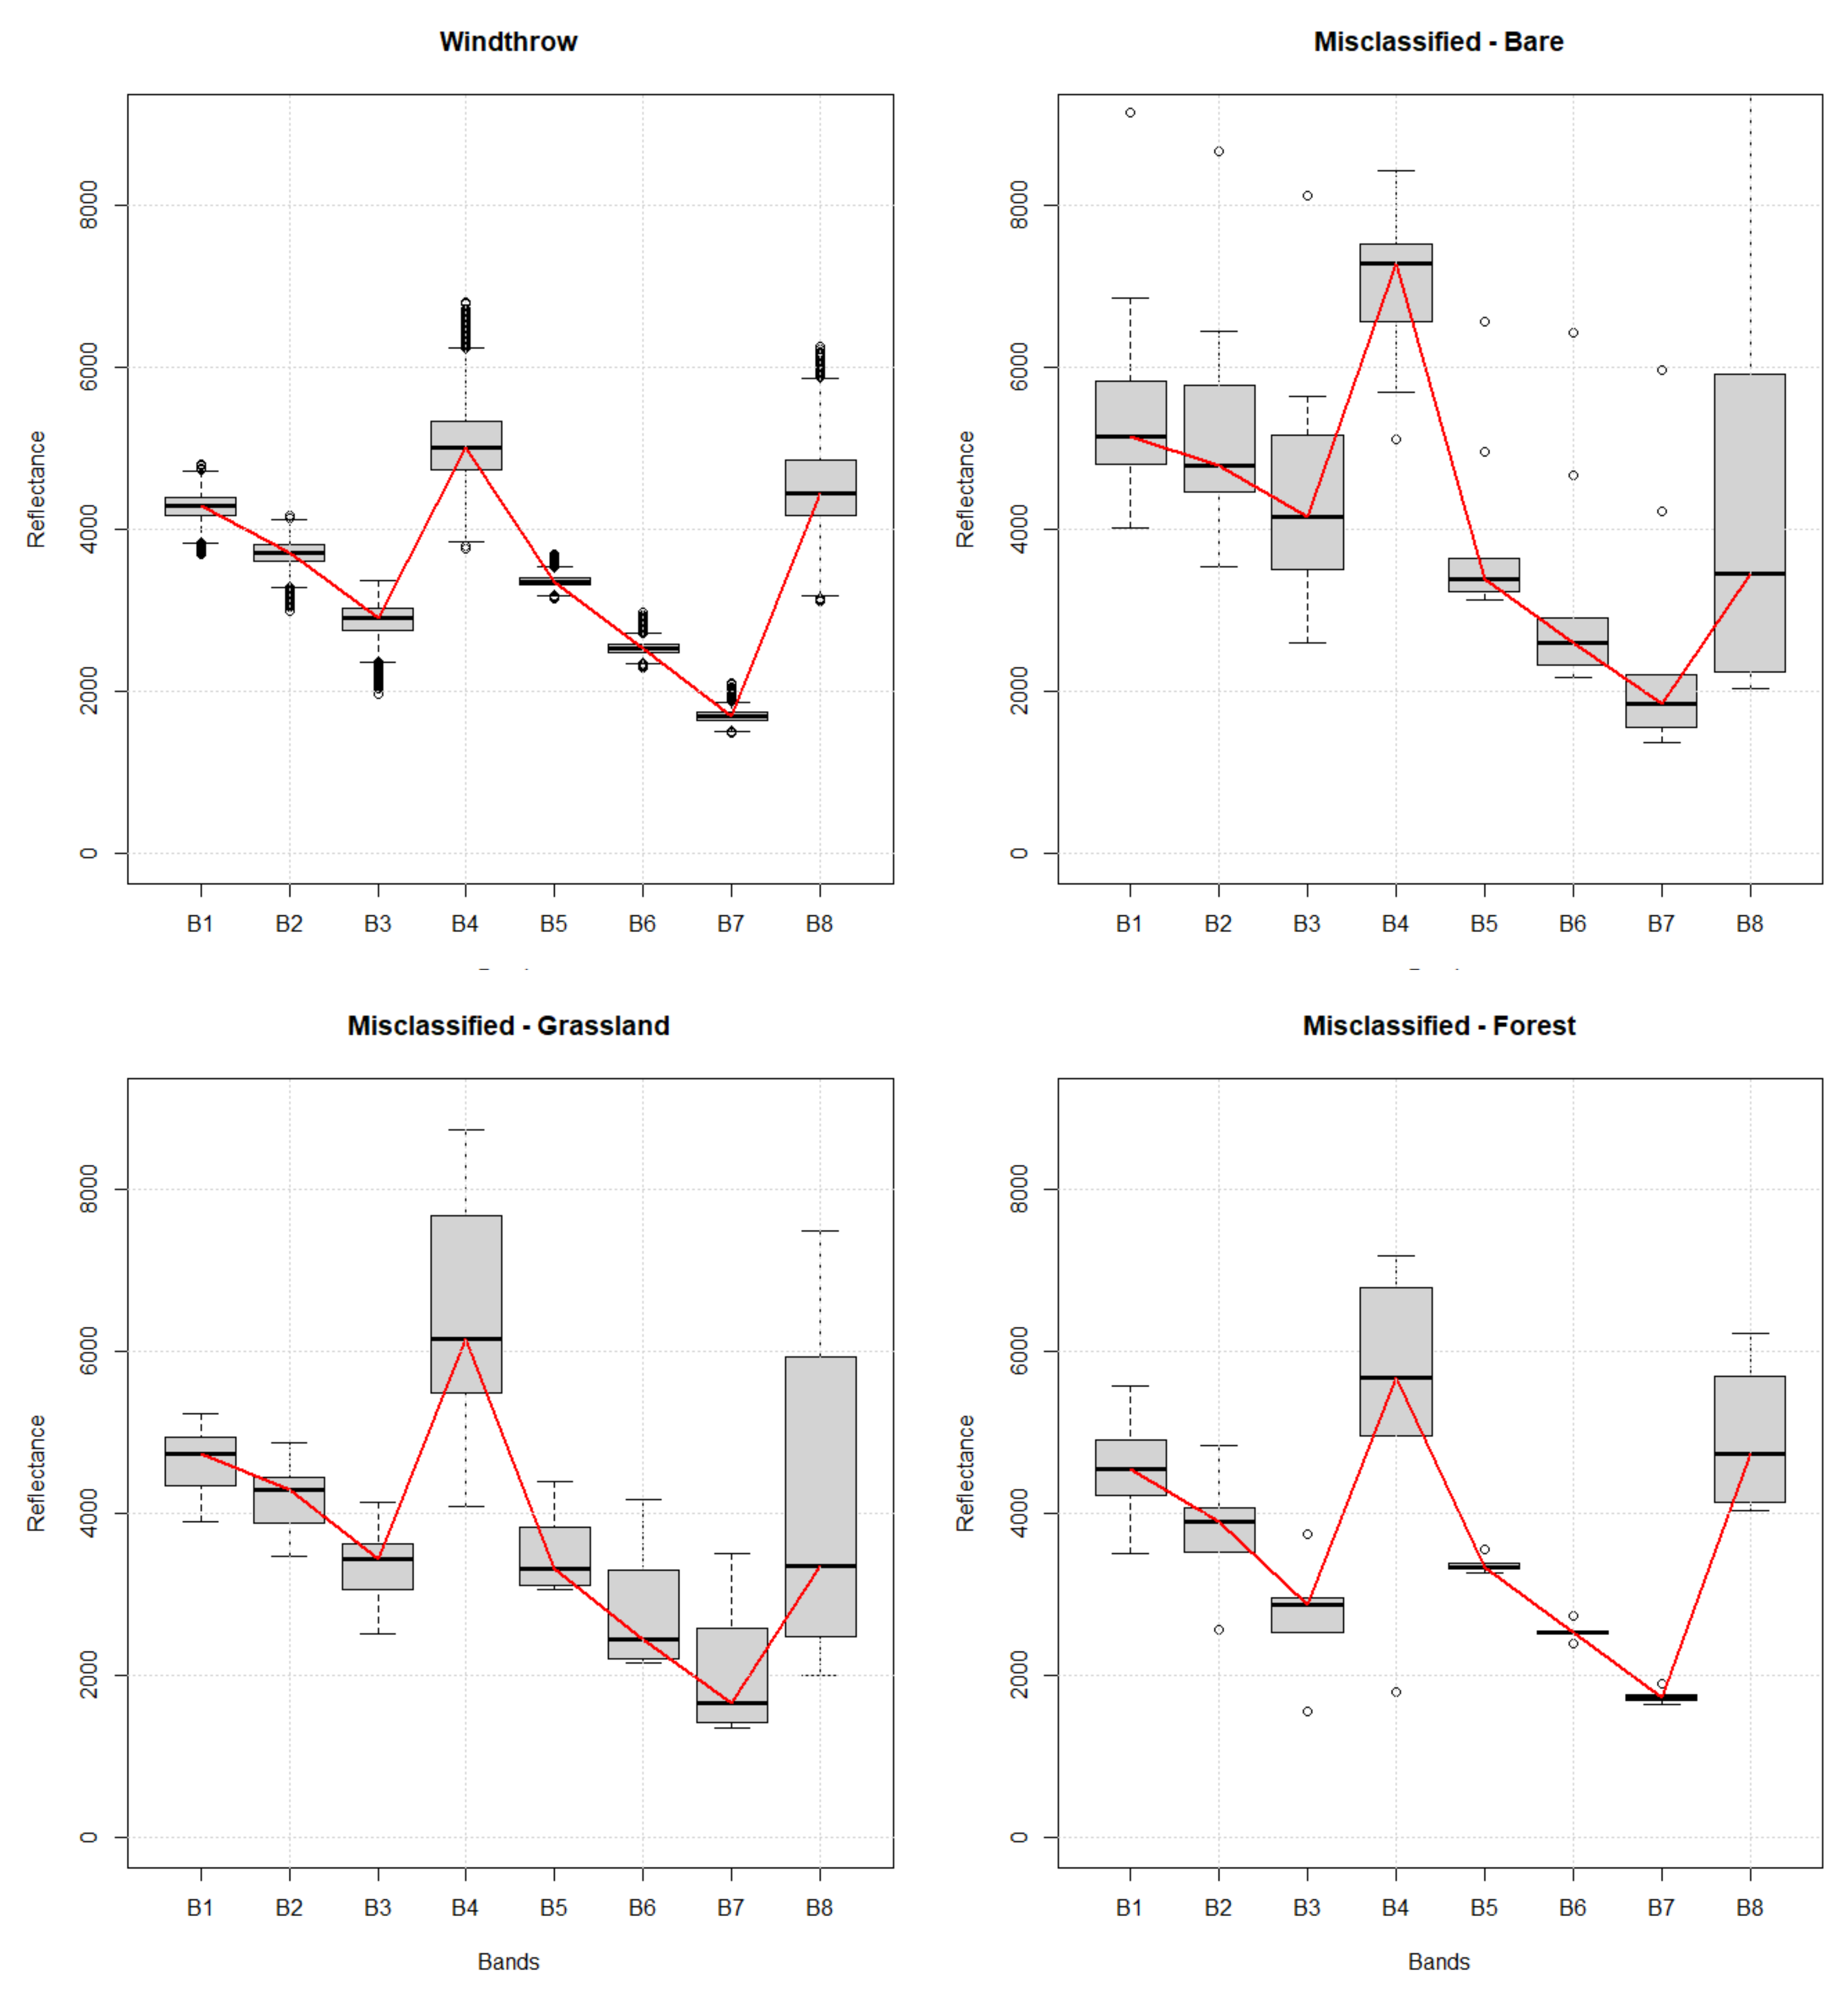
4.1. Windthrow Detection

For windthrow detection, the SVM method classified 312.0 ha of windthrow, 78.0 ha more than the NDVI filtering method and 109.0 ha more than the SAM method. According to visual interpretation of each classified map, the SVM method and the NDVI filtering method classified windthrow in less detail than the SAM method. The SAM method could differentiate some parts of the road crossing the windthrow area, while the NDVI filtering method and the SVM method classified the whole area as windthrow, increasing the total area classified as being damaged (Figure 9). All three methods identified the main area of damage on the western side of the Setana North study area. The differences in damage size occurred in areas on the northern and eastern sides of the study area and were also scattered in small areas throughout the study area, and these differences were generated by misclassification (Figure 5).
Misclassification occurred with all three methods but occurred at a larger proportion with the NDVI filtering method and the SVM method. Even though the placement of the misclassified points was almost the same for the NDVI filtering method and the SVM method, the hypotheses for misclassification by the two methods were different. Windthrow areas usually consist of tree foliage, trunks, roots, and soil; the energy reflected from those areas has a similar spectral signature to forest, grassland, and bare area classes (Figure 6). The broad reflectance variation in each band from the misclassified points increased the complexity of windthrow detection for the SVM method, which in this study used the linear kernel type, limiting the performance of the algorithm even with different cost values. SVMs are not optimized for noisy data, which are commonly found in remotely sensed datasets [40]. On the other hand, the NDVI filtering method is based only on NDVI values; as vegetation remained on the site, the values obtained by the NDVI filtering method could be similar to the values of grasslands and bare areas that had some amount of vegetation. The difference between the pre- and posttyphoon NDVI values (Equation (1)) did not contribute to the detection of windthrow, and the final classification was based only on the value of the threshold T 2 . For the detection of windthrow in Setana North, the SAM method had the highest overall accuracy (92%) and kappa value (0.82) when using two training samples and a threshold value set at 7 due to its ability to compare spectral similarity between the image and the reference training sample [41]. The threshold value also helped improve the classification results by not classifying pixels if the spectral angle distance was greater than the T value [30] and eliminating classification noise throughout the area by limiting the angle distance.

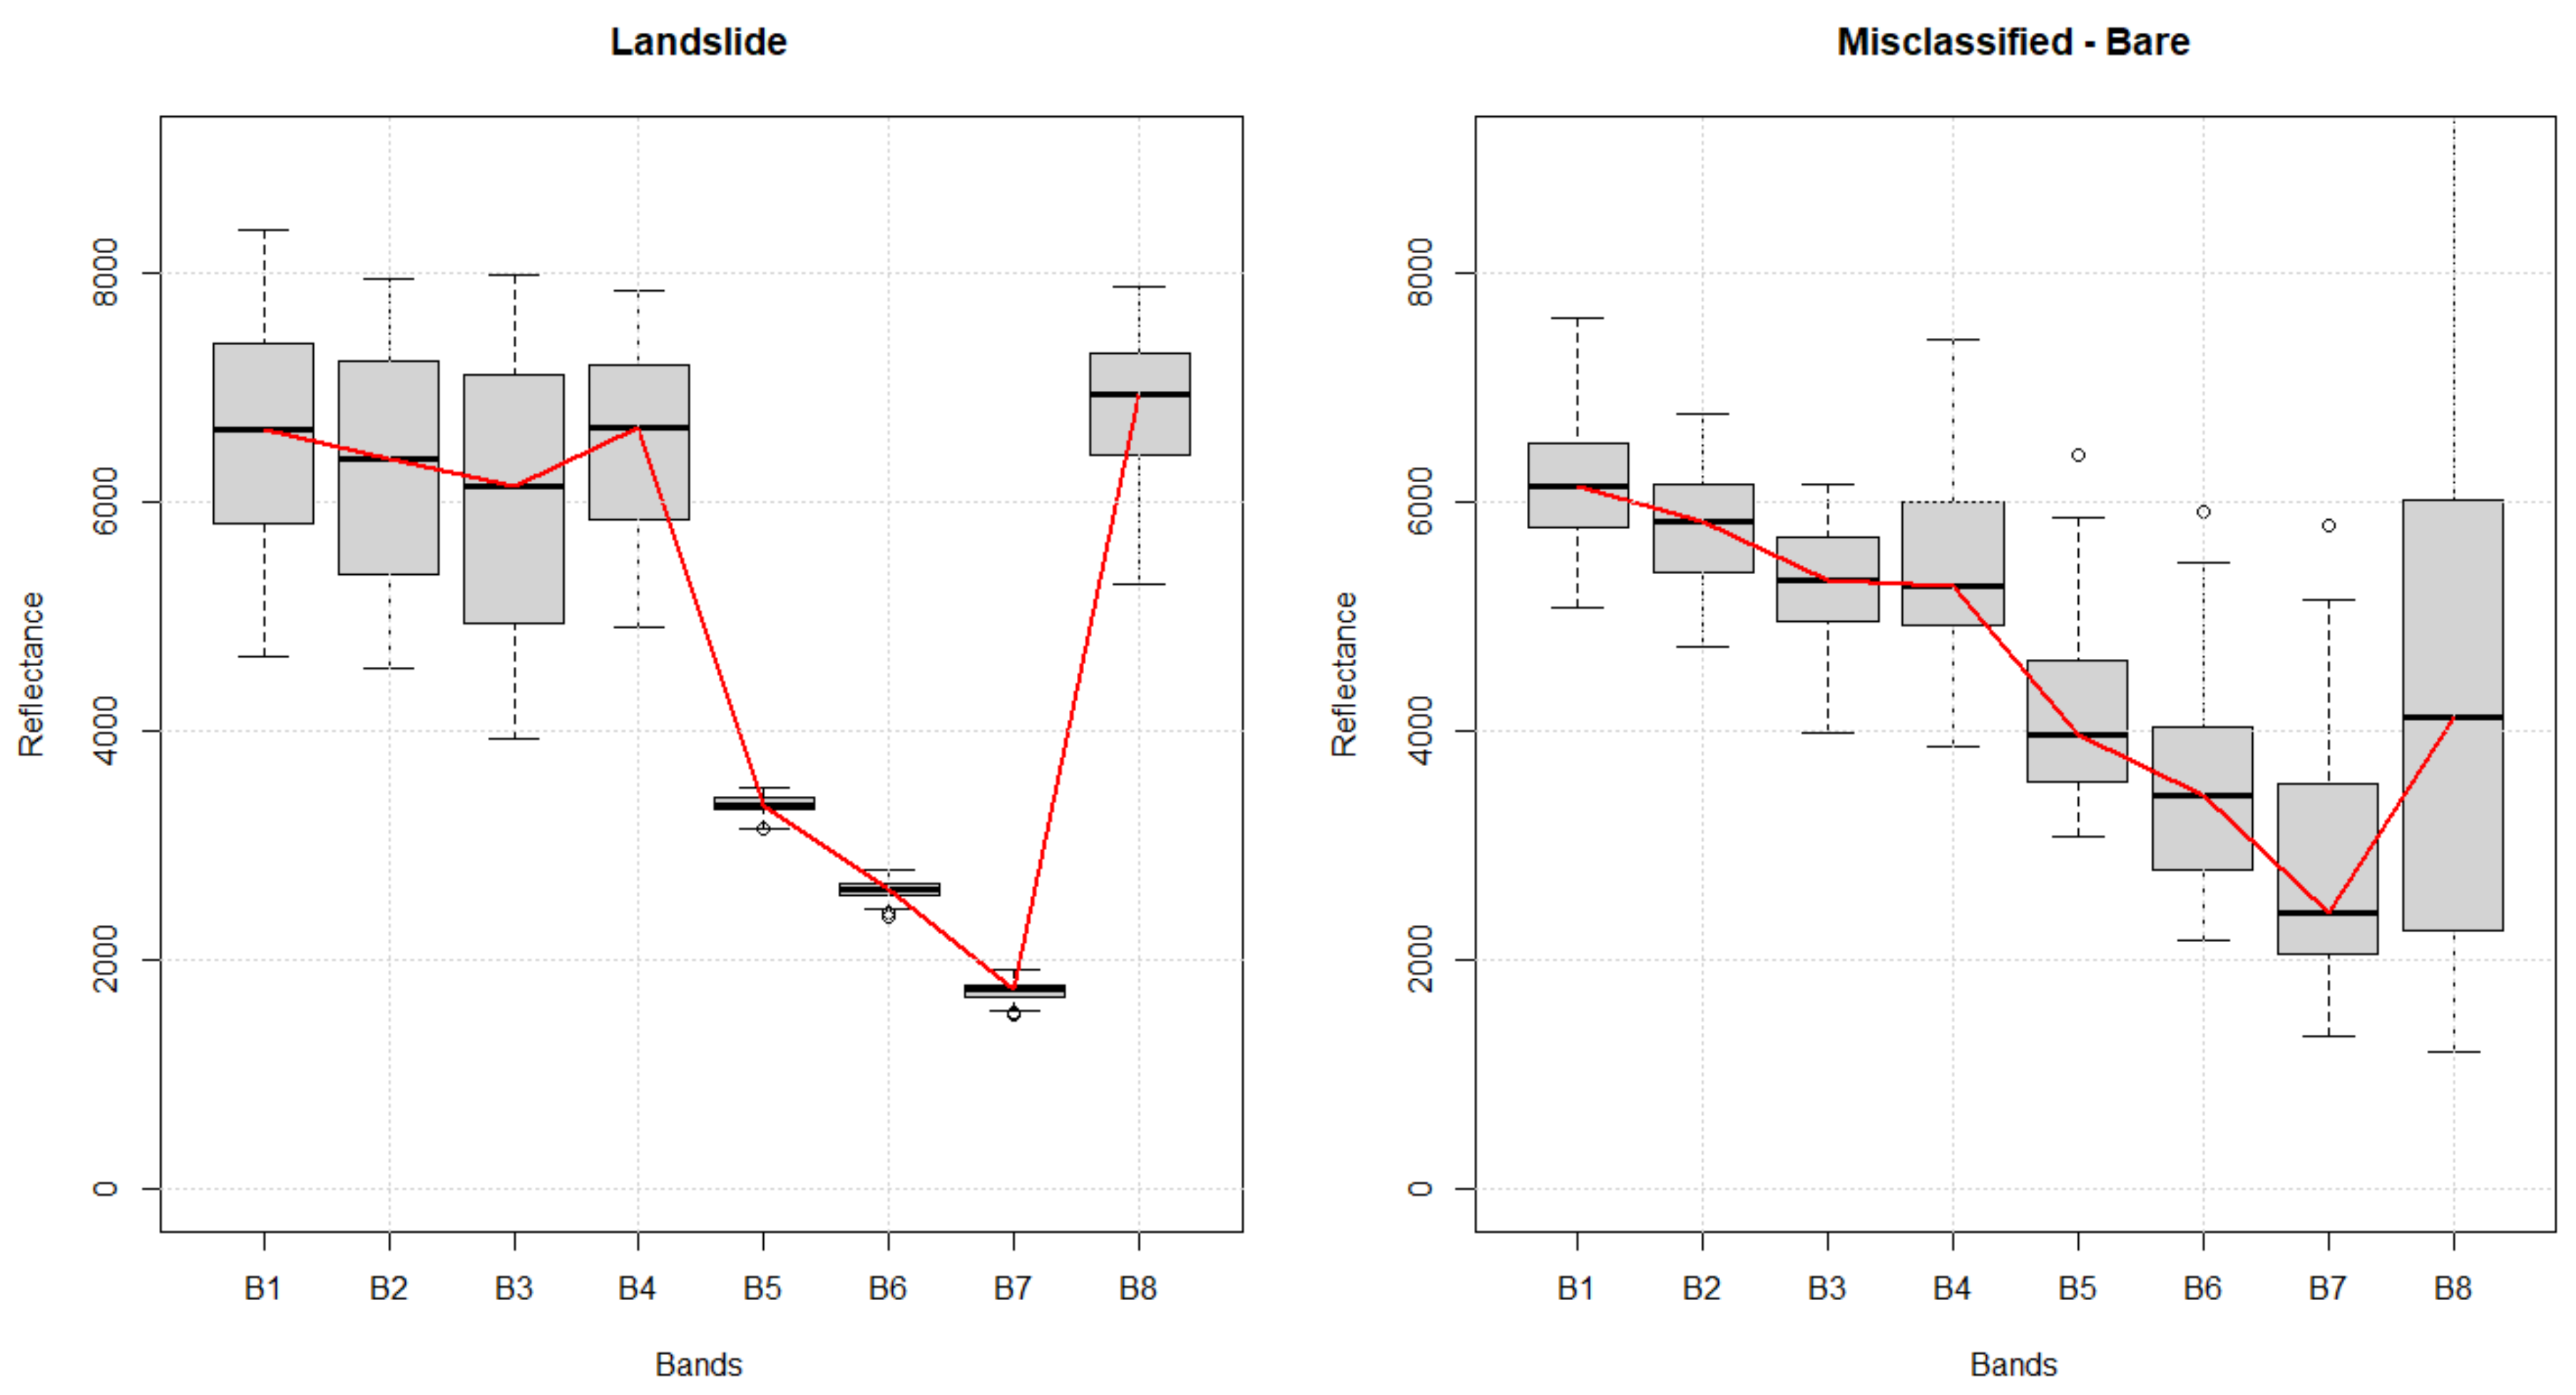
4.2. Landslide Detection

For landslide detection in Setana South, the visual interpretation showed that the NDVI filtering method classified the whole landslide area, while the other two methods did not (Figure 10). In contrast to windthrow, landslides usually remove all vegetation, facilitating detection based on NDVI values. Even though the majority of vegetation was removed, the spectral signature of landslides of the reference training samples showed small amounts of remnant vegetation in those areas. Therefore, the SAM method could not correctly classify the areas where the spectral signature showed no vegetation, in turn classifying areas of actual landslides as nonlandslide areas. Although the SVM method could classify the areas with a no-vegetation spectral signature, it struggled to identify the borders of landslides, leading to a higher probability of classifying areas with a higher level of vegetation as nonlandslide areas.
The SVM method identified the smallest landslide area and resulted in the largest number of misclassifications, 31 points, which may have been caused by the same problems presented for windthrow detection due to the similarity of spectral signatures between landslide and bare areas and overfitting. As in windthrow detection, we used the default settings for the SVM method of the Google Earth Engine, with the linear kernel, using visually interpreted training samples. We tried to increase the number of training samples, but this did not improve the final result, and cross-validation is recommended to improve the final classification [42].
The SAM method misclassified 7 points, the same ones misclassified by the NDVI filtering method. As mentioned before, although the SAM method classified the smallest landslide area due to the difference in spectral signatures, the algorithm had adequate performance for landslide detection. Compared to the SVM method, this method delivered a higher user accuracy, which represents the probability that the landslide pixel is actually represented on the ground. On the other hand, the SVM method performed better for the no-damage class, elevating its overall accuracy.
The landslide areas were visually completely washed out and did not contain remnant vegetation, but the spectral signature showed that vegetation was present. Although bare areas have a different spectral signature, the reflectance variation in the bands of the posttyphoon landslide spectral signature contributed to the misclassification. One simple way to improve the final classification would be masking the bare areas that were present before the typhoon event.
The NDVI filtering method had the best overall accuracy and kappa values for landslide detection, which was expected due to the characteristics of the NDVI used to distinguish different amounts of vegetation. The histograms of the landslide areas conveyed clear information to define the threshold values (Figure 3). This result confirms Danneels’ [43] statement about landslide classification based on the NDVI producing the best results.
The results obtained from both study sites, combined with the high spatial resolution and horizontal accuracy of the PlanetScope data [44], showed that even with some caveats, all methods were suitable for overall windthrow and landslide detection.
The PlanetScope dataset played an important role in this research, and a resolution of 3 meters provided enough information for the methods to identify the damage without being too detailed (where more processing time and tuning of parameters would be necessary) or too rough (where the spatial resolution mixes different landcover classes together). It is recommended to conduct further studies on datasets with different resolutions.
Overall, the SAM method and the NDVI filtering method were the most reliable for measuring windthrow and landslides, respectively.
In contrast, the SVM method results, processed in Google Earth Engine, performed below our expectations despite being generated by the most sophisticated algorithm. Even though the SVM classifier working with the linear kernel delivered a “substantial level of agreement”, the usage of a different kernel could improve accuracy but would increase the processing time.

5. Conclusions

The evolution of remote sensing is introducing new techniques for acquiring more rapid and accurate data, and this innovation has resulted in easier workflows that different end-users can take advantage of. Although multiple techniques are available, examinations of the appropriate method according to disaster type are missing. In this study, we compared three different conventional remote sensing classification methodologies using high-resolution imagery to identify windthrow and landslides using a simple workflow.
The high temporal and spatial resolution of the imagery played an important role in land cover change detection, in addition to the methodologies applied to identify windthrow and landslides. This result was confirmed by the fact that all three conventional methods, namely, the NDVI filtering method, the SAM method, and the SVM method, combined with the high-resolution imagery were suitable for windthrow and landslide detection, judging from kappa values that had a “substantial level of agreement” and an “almost perfect level of agreement”. One aspect to consider in further studies is the use of different-resolution datasets.
For windthrow, the SAM method performed best due to its high capacity to identify damage even if the spectral signatures of the classes were similar. The NDVI filtering method, although not fully suitable for windthrow detection, performed best in landslide detection. The capability of the NDVI to distinguish different amounts of vegetation facilitated the distinction between areas with and without vegetation.
Even though the SVM method had lower performance than the other methods for windthrow and landslide detection, it delivered satisfactory results. The usage of different kernel types could potentially improve its performance.

Supplementary Materials

Author Contributions

Conceptualization, F.F., J.M. and N.Y.; methodology, F.F.; validation, N.Y.; formal analysis, F.F.; resources, M.K.; writing—original draft preparation, F.F.; writing—review and editing, F.F., J.M. and N.Y.; supervision, J.M.; project administration, J.M. All authors have read and agreed to the published version of the manuscript.

Funding

This research received JSPS KAKENHI Grant Number JP17H01516 and TOUGOU Grant Number JPMXD0717935498.

Acknowledgments

The authors would like to acknowledge Planet Labs Inc. for data providing.

Conflicts of Interest

The authors declare no conflict of interest.

References

  1. Yamamoto, S.-I. Gap dynamics in climaxFagus crenata forests. Bot. Mag. Tokyo 1989, 102, 93–114. [Google Scholar] [CrossRef]
  2. Mabry, C.M.; Hamburg, S.P.; Lin, T.-C.; Horng, F.-W.; King, H.-B.; Hsia, Y.-J. Typhoon Disturbance and Stand-level Damage Patterns at a Subtropical Forest in Taiwan1. Biotropica 1998, 30, 238–250. [Google Scholar] [CrossRef]
  3. Dale, V.H.; Joyce, L.A.; McNulty, S.; Neilson, R.P.; Ayres, M.P.; Flannigan, M.D.; Hanson, P.J.; Irland, L.C.; Lugo, A.E.; Peterson, C.J.; et al. Climate Change and Forest Disturbances. Bioscience 2001, 51, 723. [Google Scholar] [CrossRef] [Green Version]
  4. Murakami, H.; Wang, Y.; Yoshimura, H.; Mizuta, R.; Sugi, M.; Shindo, E.; Adachi, Y.; Yukimoto, S.; Hosaka, M.; Kusunoki, S.; et al. Future Changes in Tropical Cyclone Activity Projected by the New High-Resolution MRI-AGCM. J. Clim. 2012, 25, 3237–3260. [Google Scholar] [CrossRef]
  5. Van Westen, C.J. Remote sensing for natural disaster management. Int. Arch. Photogramm. Remote Sens. Spat. Inf. Sci. ISPRS Arch. 2000, 33, 1609–1617. [Google Scholar]
  6. Boccardo, P.; Giulio Tonolo, F. Remote Sensing Role in Emergency Mapping for Disaster Response. In Engineering Geology for Society and Territory-Volume 5; Lollino, G., Manconi, A., Guzzetti, F., Culshaw, M., Bobrowsky, P., Luino, F., Eds.; Springer International Publishing: Cham, Switzerland, 2015; pp. 17–24. ISBN 978-3-319-09048-1. [Google Scholar]
  7. Rozenstein, O.; Karnieli, A. Comparison of methods for land-use classification incorporating remote sensing and GIS inputs. Appl. Geogr. 2011, 31, 533–544. [Google Scholar] [CrossRef]
  8. Rwanga, S.S.; Ndambuki, J.M. Accuracy Assessment of Land Use/Land Cover Classification Using Remote Sensing and GIS. Int. J. Geosci. 2017, 08, 611–622. [Google Scholar] [CrossRef] [Green Version]
  9. Bolstad, P.V.; Gessler, P.; Lillesand, T.M. Positional uncertainty in manually digitized map data. Int. J. Geogr. Inf. Syst. 1990, 4, 399–412. [Google Scholar] [CrossRef]
  10. Fonji, S.F.; Taff, G.N. Using satellite data to monitor land-use land-cover change in North-eastern Latvia. Springerplus 2014, 3, 61. [Google Scholar] [CrossRef] [Green Version]
  11. Klemas, V.V. The Role of Remote Sensing in Predicting and Determining Coastal Storm Impacts. J. Coast. Res. 2009, 256, 1264–1275. [Google Scholar] [CrossRef] [Green Version]
  12. Joyce, K.E.; Wright, K.C.; Samsonov, S.V.; Ambrosia, V.G. Remote sensing and the disaster management cycle. In Advances in Geoscience and Remote Sensing; InTech: London, UK, 2009; pp. 317–346. [Google Scholar]
  13. Okamoto, K.; Fukuhara, M. Estimation of paddy field area using the area ratio of categories in each mixel of Landsat TM. Int. J. Remote Sens. 1996, 17, 1735–1749. [Google Scholar] [CrossRef]
  14. Hamdi, Z.M.; Brandmeier, M.; Straub, C. Forest Damage Assessment Using Deep Learning on High Resolution Remote Sensing Data. Remote Sens. 2019, 11, 1976. [Google Scholar] [CrossRef] [Green Version]
  15. Mokroš, M.; Výbošťok, J.; Merganič, J.; Hollaus, M.; Barton, I.; Koreň, M.; Tomaštík, J.; Čerňava, J. Early Stage Forest Windthrow Estimation Based on Unmanned Aircraft System Imagery. Forests 2017, 8, 306. [Google Scholar] [CrossRef] [Green Version]
  16. Wu, C.; Du, B.; Cui, X.; Zhang, L. A post-classification change detection method based on iterative slow feature analysis and Bayesian soft fusion. Remote Sens. Environ. 2017, 199, 241–255. [Google Scholar] [CrossRef]
  17. Einzmann, K.; Immitzer, M.; Böck, S.; Bauer, O.; Schmitt, A.; Atzberger, C. Windthrow Detection in European Forests with Very High-Resolution Optical Data. Forests 2017, 8, 21. [Google Scholar] [CrossRef] [Green Version]
  18. Kupfer, J.A.; Emerson, C.W. Remote Sensing. In Encyclopedia of Social Measurement; Elsevier: Amsterdam, The Netherlands, 2005; Volume 3, pp. 377–383. [Google Scholar]
  19. Wang, J.; Sheng, Z.; Yu, H. Popularization of remote sensing education and general course construction in undergraduate education. IOP Conf. Ser. Earth Environ. Sci. 2014, 17, 012262. [Google Scholar] [CrossRef] [Green Version]
  20. Forest Management Division, Bureau of Forestry, Department of Fisheries and Forestry, Hokkaido Government. Forest Management to Reduce the Risk of Damage of Windthrow. 2018. (In Japanese). Available online: http://www.pref.hokkaido.lg.jp/sr/srs/riskdown.pdf (accessed on 5 October 2020).
  21. Olofsson, P.; Foody, G.M.; Stehman, S.V.; Woodcock, C.E. Making better use of accuracy data in land change studies: Estimating accuracy and area and quantifying uncertainty using stratified estimation. Remote Sens. Environ. 2013, 129, 122–131. [Google Scholar] [CrossRef]
  22. Tsai, F.; Lin, T.-H.; Chen, L.-C.; Chen, W.W. Landslide detection and monitoring using remote sensing and spatial analysis in Taiwan. In Proceedings of the Earth Resources and Environmental Remote Sensing/GIS Applications II; Michel, U., Civco, D.L., Eds.; International Society for Optics and Photonics: Bellingham, WA, USA, 2011; Volume 8181, p. 81810V. [Google Scholar]
  23. Gorelick, N.; Hancher, M.; Dixon, M.; Ilyushchenko, S.; Thau, D.; Moore, R. Google Earth Engine: Planetary-scale geospatial analysis for everyone. Remote Sens. Environ. 2017, 202, 18–27. [Google Scholar] [CrossRef]
  24. Japan Meteorological Agency. Disaster Meteorological Report-Heavy Rain and Storms from 2016 August 16 to August 31 due to Typhoon No. 7, No. 9, No. 10, No. 11 and Front Line in 2016; Japan Meteorological Agency: Tokyo, Japan, 2017. [Google Scholar]
  25. Planet Lab Inc. PLANET IMAGERY AND ARCHIVE. Available online: https://www.planet.com/products/planet-imagery/ (accessed on 6 June 2020).
  26. Japanese Ministry of Land Infrastructure Transport and Tourism National Land Numerical Information Download Service. Available online: https://nlftp.mlit.go.jp/ksj/index.html (accessed on 24 September 2020).
  27. Maxar Technologies WORLDVIEW-2. Available online: https://www.maxar.com/constellation (accessed on 6 June 2020).
  28. Rouse, J.W.; Hass, R.H.; Schell, J.A.; Deering, D.W. Monitoring vegetation systems in the great plains with ERTS. Third Earth Resour. Technol. Satell. Symp. 1973, 1, 309–317. [Google Scholar]
  29. Kruse, F.A.; Lefkoff, A.B.; Boardman, J.W.; Heidebrecht, K.B.; Shapiro, A.T.; Barloon, P.J.; Goetz, A.F.H. The spectral image processing system (SIPS)-interactive visualization and analysis of imaging spectrometer data. In Proceedings of the AIP Conference Proceedings; AIP: College Park, MD, USA, 1993; Volume 283, pp. 192–201. [Google Scholar]
  30. Congedo, L. Semi-Automatic Classification Plugin Documentation. Release 6.0.1.1. Release 2016, 4, 29. [Google Scholar] [CrossRef]
  31. QGIS Development Team QGIS Geographic Information System 2009. Available online: https://qgis.org/en/site/ (accessed on 5 October 2020).
  32. Cortes, C.; Vapnik, V. Support-vector networks. Mach. Learn. 1995, 20, 273–297. [Google Scholar] [CrossRef]
  33. Sharma, V.; Baruah, D.; Chutia, D.; Raju, P.; Bhattacharya, D.K. An assessment of support vector machine kernel parameters using remotely sensed satellite data. In Proceedings of the 2016 IEEE International Conference on Recent Trends in Electronics, Information & Communication Technology (RTEICT), Bangalore, India, 20–21 May 2016; IEEE: Piscataway, NJ, USA, 2017; pp. 1567–1570. [Google Scholar] [CrossRef]
  34. Story, M.; Congalton, R.G. Remote Sensing Brief Accuracy Assessment: A User’s Perspective. Photogramm. Eng. Remote Sens. 1986, 52, 397–399. [Google Scholar]
  35. Cohen, J. A Coefficient of Agreement for Nominal Scales. Educ. Psychol. Meas. 1960, 20, 37–46. [Google Scholar] [CrossRef]
  36. Llano, X.C. AcATaMa-QGIS Plugin for Accuracy Assessment of Thematic Maps, version 19.11; 2019. Available online: https://smbyc.github.io/AcATaMa (accessed on 5 October 2020).
  37. Donner, A.; Shoukri, M.M.; Klar, N.; Bartfay, E. Testing the equality of two dependent kappa statistics. Stat. Med. 2000, 19, 373–387. [Google Scholar] [CrossRef]
  38. Foody, G.M. Thematic Map Comparison. Photogramm. Eng. Remote Sens. 2004, 70, 627–633. [Google Scholar] [CrossRef]
  39. Landis, J.R.; Koch, G.G. An Application of Hierarchical Kappa-type Statistics in the Assessment of Majority Agreement among Multiple Observers. Biometrics 1977, 33, 363. [Google Scholar] [CrossRef]
  40. Mountrakis, G.; Im, J.; Ogole, C. Support vector machines in remote sensing: A review. ISPRS J. Photogramm. Remote Sens. 2011, 66, 247–259. [Google Scholar] [CrossRef]
  41. Petropoulos, G.P.; Vadrevu, K.P.; Kalaitzidis, C. Spectral angle mapper and object-based classification combined with hyperspectral remote sensing imagery for obtaining land use/cover mapping in a Mediterranean region. Geocarto Int. 2013, 28, 114–129. [Google Scholar] [CrossRef]
  42. Hsu, C.-W.; Chang, C.-C.; Lin, C.J. A Practical Guide to Support Vector Classification. BJU Int. 2008, 101, 1396–1400. [Google Scholar]
  43. Danneels, G.; Pirard, E.; Havenith, H.-B. Automatic landslide detection from remote sensing images using supervised classification methods. In Proceedings of the 2007 IEEE International Geoscience and Remote Sensing Symposium, Barcelona, Spain, 23–28 July 2007; IEEE: Piscataway, NJ, USA, 2007; pp. 3014–3017. [Google Scholar]
  44. Dobrinic, D. Horizontal Accuracy Assessment of Planetscope, Rapideye and Worldview-2 Satellite Imagery. In Proceedings of the International Multidisciplinary Scientific GeoConference Surveying Geology and Mining Ecology Management; SGEM: Sofia, Bulgaria, 2018; Volume 18, pp. 129–136. [Google Scholar]
Figure 1. Setana North and Setana South study area with PlanetScope data from 21 September, 2016.
Remotesensing 12 03242 g001
Figure 2. Flowchart of the windthrow and landslide classification and assessment procedure. Input features are identified in the gray boxes.
Remotesensing 12 03242 g002
Figure 3. Histograms of damaged areas with the respective threshold values indicated in red. The histogram in the upper left shows Setana North   N D V I b e f o r e N D V I a f t e r   , and that in the top right shows Setana North N D V I a f t e r . Setana South N D V I b e f o r e N D V I a f t e r is displayed in the lower left corner, and Setana South N D V I a f t e r is displayed in the lower right corner.
Remotesensing 12 03242 g003
Figure 4. Comparison of combinations training sample numbers (x-axis) and threshold values according to overall accuracy (y-axis).
Remotesensing 12 03242 g004
Figure 5. Windthrow classification results in Setana North: PlanetScope RGB image, NDVI filtering method results, spectral angle mapper (SAM) method results and support vector machine (SVM) method results. The detected windthrow areas are expressed in red.
Remotesensing 12 03242 g005
Figure 6. Spectral signature for windthrow taken from the entire windthrow area (upper left: N = 5723) and all different misclassified points of bare land (upper right: N = 14), grassland (lower left: N = 15), and forest (lower right: N = 6). The red line shows the spectral signature from the median values of the data distribution of each landcover type.
Remotesensing 12 03242 g006
Figure 7. Landslide classification results in Setana South zoomed into the west-central area: (a) PlanetScope RGB image, (b) NDVI filtering method results, (c) SAM method results, and (d) SVM method results. The landslide-damaged areas are shown in red.
Remotesensing 12 03242 g007
Figure 8. Spectral signature for the entire landslide area (left: N = 156) and all different misclassified bare points (right: N = 31). The red line shows the spectral signature from the median values of the data distribution of each landcover type.
Remotesensing 12 03242 g008
Figure 9. Comparison of windthrow delineations by three methods in Setana North. The SAM method could distinguish some parts of the road crossing the area (the light-colored line in the RGB image) from windthrow.
Remotesensing 12 03242 g009
Figure 10. Comparison of landslide delineations by three methods in Setana South. While the normalized difference vegetation index (NDVI) filtering method (blue) classified all areas as landslides, the SAM method (yellow) could not detect some areas (top area of the center landslide), and the SVM method (red) did not classify the borders of the landslide area.
Remotesensing 12 03242 g010
Table 1. The error matrices of windthrow detection in Setana North.
ReferenceAccuracyError
DamagedNondamagedTotalUAArea (ha)OAStd Error
Kappa
a) Classified by NDVI FilteringDamaged65299469.1%234.084.0%0.0159
Nondamaged310310697.2%13625.10.67
Total68132200
PA95.6%78.0%
DamagedNondamagedTotalUAArea (ha)OAStd Error
Kappa
b) Classified by SAMDamaged5646093.3%203.392.0%0.0234
Nondamaged1212814091.4%13655.80.82
Total68132200
PA82.4%97.0%
DamagedNondamagedTotalUAArea (ha)OAStd Error
Kappa
c) Classified by SVMDamaged673310067.0%312.883.0%0.0098
Nondamaged19910099.0%13546.20.66
Total68132200
PA98.5%75.0%
PA: producer accuracy, UA: user accuracy, OA: overall accuracy
Table 2. False-positive misclassified points of windthrow detection in Setana North.
BareForestGrasslandTotal
NDVI filtering method1341229
SAM method0404
SVM method1351533
Table 3. The error matrices of landslide detection in Setana South.
ReferenceAccuracyError
DamagedNondamagedTotalUAArea (ha)OAStd Error
Kappa
a) Classified by NDVI FilteringDamaged6977690.8%22.096.0%0.0080
Nondamaged112312499.2%8039.00.91
Total70130200
PA98.6%94.6%
DamagedNondamagedTotalUAArea (ha)OAStd Error
Kappa
b) Classified by SAMDamaged6377090.0%17.693.0%0.0198
Nondamaged712313094.6%8043.20.85
Total70130186
PA90.0%94.6%
DamagedNondamagedTotalUAArea (ha)OAStd Error
Kappa
c) Classified by SVMDamaged693110069.0%4.784.0%0.0099
Nondamaged19910099.0%8056.10.66
Total70130200
PA98.6%75.0%
PA: producer accuracy, UA: user accuracy, OA: overall accuracy
Table 4. False-positive misclassified points of landslide detection in Setana South.
BareTotal
NDVI filtering method77
SAM method77
SVM method3131

