1. Introduction
Urbanization is the only way for China to build a well-off society and achieve modernization. China’s urbanization will not only determine China’s future, but also the process of urbanization in the world [
1]. Urban agglomeration is the main area of new national urbanization and a core strategic area of economic development, which plays an irreplaceable role in promoting urbanization in China [
2]. At present, China is one of the three countries with the fastest urban expansion in the world. In 2011, China’s urban population exceeded the rural population for the first time, and the urbanization rate reached 51.3% [
3]. In the process of urbanization in China, the expansion of urban agglomerations plays a vital role. Due to differences in the natural, social, and economic conditions of each region, the expansion of a city can take different spatial forms. Consequently, urban land expansion has long been one of the focuses of academic research and discussion [
4].
To date, the academic community has carried out a lot of research on the expansion of urban land use. In terms of research content, the main focus has been on expanding space-time characteristics [
5,
6,
7,
8], driving forces and driving mechanisms [
9,
10,
11], and links between the urban and ecological environments [
12,
13,
14,
15]. In terms of research methods, these include the nighttime lighting data method [
16,
17,
18], the Logistic- Geographically and temporally weighted regression (GTWR) model [
19,
20], street based metrics [
21,
22,
23], and other multi-source remote-sensing data methods [
24,
25,
26]. In terms of research scales, these include from national to regional to local scales [
27,
28,
29,
30], the Beijing–Tianjin–Hebei urban agglomeration [
31,
32,
33], Wuhan [
34,
35,
36], and Jiangsu Province [
37,
38,
39].
The YREB has unique advantages and great development potential, especially given the new round of reform to open up and transform China to implement a new regional open development strategy. Therefore, the YREB has also attracted widespread attention in the academic community. At present, research on the YREB mainly includes urbanization [
40,
41,
42], regional innovation [
43,
44,
45], the ecological environment [
46,
47,
48], and carbon emissions [
49,
50,
51]. In the study of the urbanization in the Yangtze River Economic Belt, specifically speaking, Liu et al. [
40] explored the relationship between the expansion of urban land use in China’s YREB and the scope of human activities. The results of the study indicate that there is a coupling between urban land and the scope of human activities in metropolitan areas and urban agglomerations. Jin et al. [
41] measured the urban land-use efficiency by introducing the Stochastic Frontier Analysis (SFA). The study found that the urban land-use efficiency of YREB increased continuously from 2005 to 2014, and gradually decreased from east to west. Not only the intra-provincial and inter-provincial differences are significant, but also the differences between the upper, middle and lower reaches are larger. Xie et al. [
42] takes 108 prefecture-level cities in the YREB as an example, and uses the spatial econometric model to explore the impact of urban construction land expansion on regional economic growth. The results show that the expansion of YREB urban construction land has an important impact on economic growth, and there are significant differences between the regions.
Therefore, by summarizing the above research status, we can find that the current research on urbanization in the YREB mainly focuses on the analysis of the relationship between urban land expansion and the scope of human activities and economic growth [
40,
41], and the efficiency of urban land use [
42]. It is obvious that there are relatively few studies on the spatial and temporal evolution of urban land expansion in the YREB. In addition, on the one hand, as urban land area expansion is one of the important indicators to measure the level of urbanization development, therefore, in the study of urbanization, it is very important to carry out research on urban land expansion. In addition, based on the current situation that there are relatively few studies on the spatial and temporal evolution of urban land expansion in the YREB. Therefore, it is necessary to study the spatial and temporal evolution of urban land expansion in the YREB. On the other hand, the study of the spatial and temporal evolution of urban land expansion in urban areas over a long period of time can be used to find out the extended characteristics and patterns of urban land use in this urban area during this period. In addition, due to the extremely important status of the YREB and the prospect of great development, there are many gaps in the development of various urban agglomerations and cities within the YREB. Therefore, in the process of development and construction of the YREB, if we want to achieve the rational development and coordinated development of urban areas, we need to carry out long-term research on the spatial and temporal evolution of urban land expansion in the YREB.
The Operational Linescan System (OLS) sensor in the U.S. Defense Weather Satellite’s Defense Meteorological Satellite Program (DMSP) makes it possible to capture nighttime lighting data [
52]. Because towns emit light at night, nighttime images can be used to accurately extract and analyze built-up areas and spatial agglomerations (urban agglomerations), which can play an important role in understanding global and regional urbanization processes [
53]. To date, scholars have carried out a lot of research based on DMSP/OLS data, mainly in urban expansion [
54,
55,
56], saturation method research [
57,
58,
59], gross domestic product (GDP) estimation [
60,
61,
62], carbon emissions [
63,
64,
65], and power consumption estimation [
66,
67,
68]. In addition, the existing research that applies DMSP/OLS data to describe the evolution of urban land use is mainly based on China at the national level [
69,
70] and the Beijing–Tianjin–Hebei urban agglomeration [
71,
72].
Based on the current research status, this paper finds that there are relatively few studies on the temporal and spatial evolution of urban land expansion in the YREB using DMSP/OLS data over a long period of time. Since the reform and opening up, the YREB has developed into one of the regions with the strongest comprehensive strength and strategic support in China. This shows that the YREB strategy plays a very important role in China’s national development. Therefore, we must have a deep understanding of the characteristics and laws of urban expansion in the YREB over a long period of time. In addition, the use of DMSP/OLS data to carry out long-term research on the spatial and temporal evolution of urban land expansion in the YREB can reflect the characteristics, laws and irrationalities of urban land expansion in the YREB. Therefore, based on night lighting data, we use landscape index method, spatial expansion intensity index, compactness index, urban land fractal index, elasticity coefficient, spatial autocorrelation analysis and standard deviation ellipse to analyze the spatial and temporal evolution of urban land expansion in YREB. The purpose is to reveal the temporal and spatial characteristics and laws of urban land expansion in the YREB. In addition, we also analyze the driving factors of urban land expansion in the YREB. Therefore, we believe that the research work in this paper can enrich the depth of relevant research and has certain theoretical significance. Moreover, the characteristics, laws and irrationalities of urban expansion in the YREB discovered by this study, as well as the force of different driving factors in different time periods, can also provide some reference for the government, such as policy makers and urban planners, and also have certain use value.
4. Results
4.1. Characteristics of the Evolution of the Urban Land-Use Landscape Pattern in the Yangtze River Economic Belt (YREB)
The landscape pattern analysis software FRAG-STATS has been widely used in landscape ecology research. In this study, after using the stratified SVM method to extract the urban land area of the Yangtze River Economic Belt from 1992 to 2013, the data was exported to the year-by-year TIF format, and then the year-by-year TIF format data was imported into FRAG-STATS 4.2. This software was used to calculate the eight selected landscape pattern indicators, eight landscape pattern indicators are selected on the operation page of FRAG-STATS 4.2.
Table 2 shows the results. Based on these results, the characteristics of the evolution of the landscape pattern of the YREB for the 22-year period 1992–2013 can be summarized.
4.2. Time-Space Process of Urban Land Expansion in the YREB
After using the auxiliary data-based comparison method to determine the threshold for extracting the built-up area of a town, as shown in
Figure 2 and
Figure 3, we extracted the urban built-up area of the YREB and its four core cities (Shanghai, Wuhan, Chengdu, and Chongqing) for the period 1992–2013. The built-up area of the YREB in 1992 was 10,383.25 square kilometers, and increased to 110,915.25 square kilometers in 2013. This is an increase of approximately 9.68 times, with an average annual growth of 4569.64 square kilometers and an average annual growth rate of 11.94%. By calculating the spatial expansion intensity index of the YREB, we determined the overall annual average expansion intensity index of the YREB to be 0.18. The spatial expansion intensity indices for 1992–1999, 1999–2006, and 2006–2013 were 0.03, 0.16, and 0.34, respectively. It can clearly be seen that the urban expansion intensity in 1992–2013 experienced some volatility. At the same time, the intensity of urban expansion in 1999–2006 was greater than that in 1992–1999, and the intensity of urban expansion in 2006–2013 was significantly higher than that in 1999–2006. These results reflect the continuous expansion of urban land use in the YREB, the continuous increase in expansion speed, and the constant improvement in the level of urbanization.
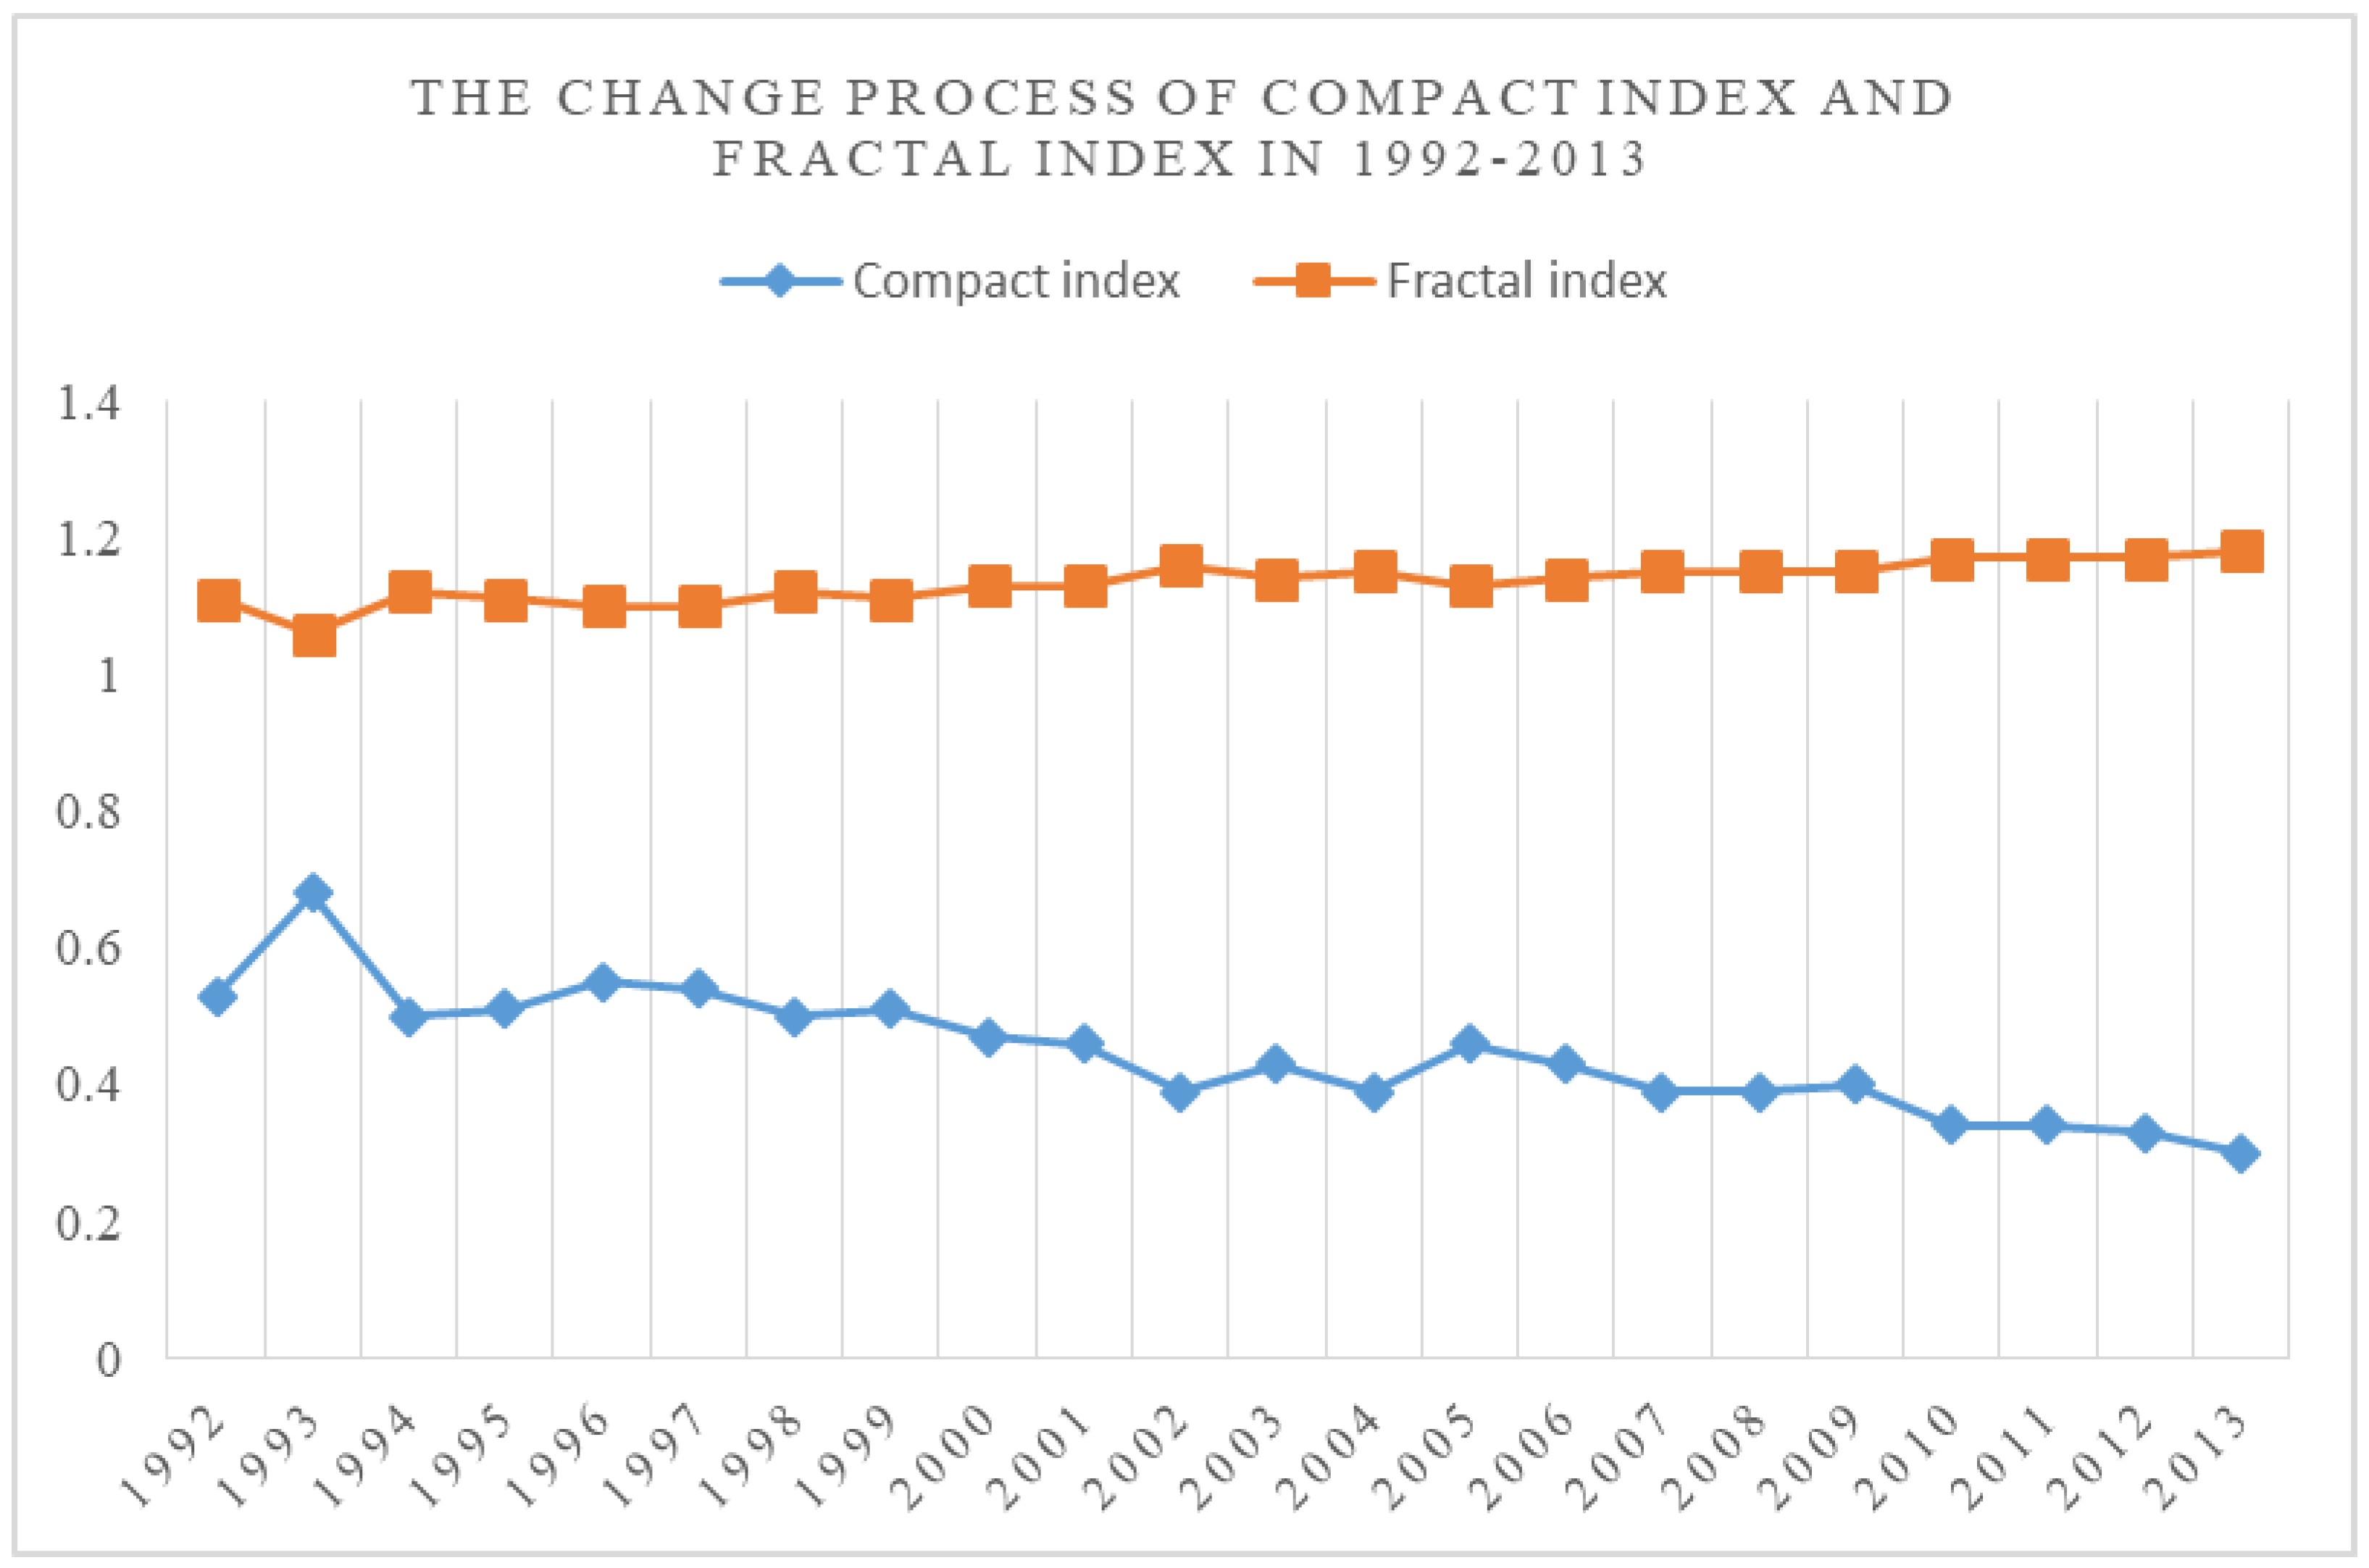
4.3. Evolution of the Spatial Form of Urban Land Expansion in the YREB
It can be seen from
Table 3 and
Figure 4 that the urban compactness of the YREB decreased over time as a whole, which indicates that the shape of the urban built-up area of the YREB is fragmented and the compactness of the urban form is poor. However, in the two periods 1992–1994 and 2002–2005, there were ups and downs in the compactness, which indicates that the morphological changes in the urban built-up areas of the YREB were not stable. The fractal dimension of the urban land increased slowly with time. Its value increased from 1.11 in 1992 to 1.18 in 2013 and remained between 1.1 and 1.2 for the duration of the study period. This increase is small, reflecting that the YREB had a simple urban spatial boundary and compact land use. In addition, the fractal dimensions of the years 2007, 2008, and 2009 were all 1.15, and the fractal dimensions of the years 2010, 2011, and 2012 were all 1.17, indicating that the shape of the urban spatial boundary of the YREB changed little. These results further indicate that the urban development of the YREB was in a relatively stable state.
It can be seen from
Table 4 that, during the entire study period (1992–2013), the urban expansion coefficient of the YREB was 3.09, which is 2.76 times the reasonable value (1.12). The coefficient of elasticity of urban expansion first increased and then decreased. Overall, this reflects the inconsistency between urban expansion and population growth in the YREB. From 1992 to 1999, the coefficient of elasticity of urban expansion in the study area was 1.72, which is slightly higher than the reasonable value (1.12), and then the coefficient increased significantly. From 1999 to 2006, the coefficient was 3.88 times the reasonable value (1.12). The main reason for this is that, during the study period, the urban built-up area of each core city in the YREB increased significantly, but the population growth lagged slightly. From 2006 to 2013, the coefficient of elasticity of urban expansion in the YREB fell to 3.45, and the degree of direct disharmony between the urban expansion speed and the population growth rate was slightly reduced. However, the elastic coefficient of expansion during this period was still 3.08 times the reasonable value (1.12), which indicates that, during this period, the population growth and expansion of the urban built-up area in the YREB were poor.
4.4. Characteristics of the Spatial Evolution of Urban Land Expansion in the YREB
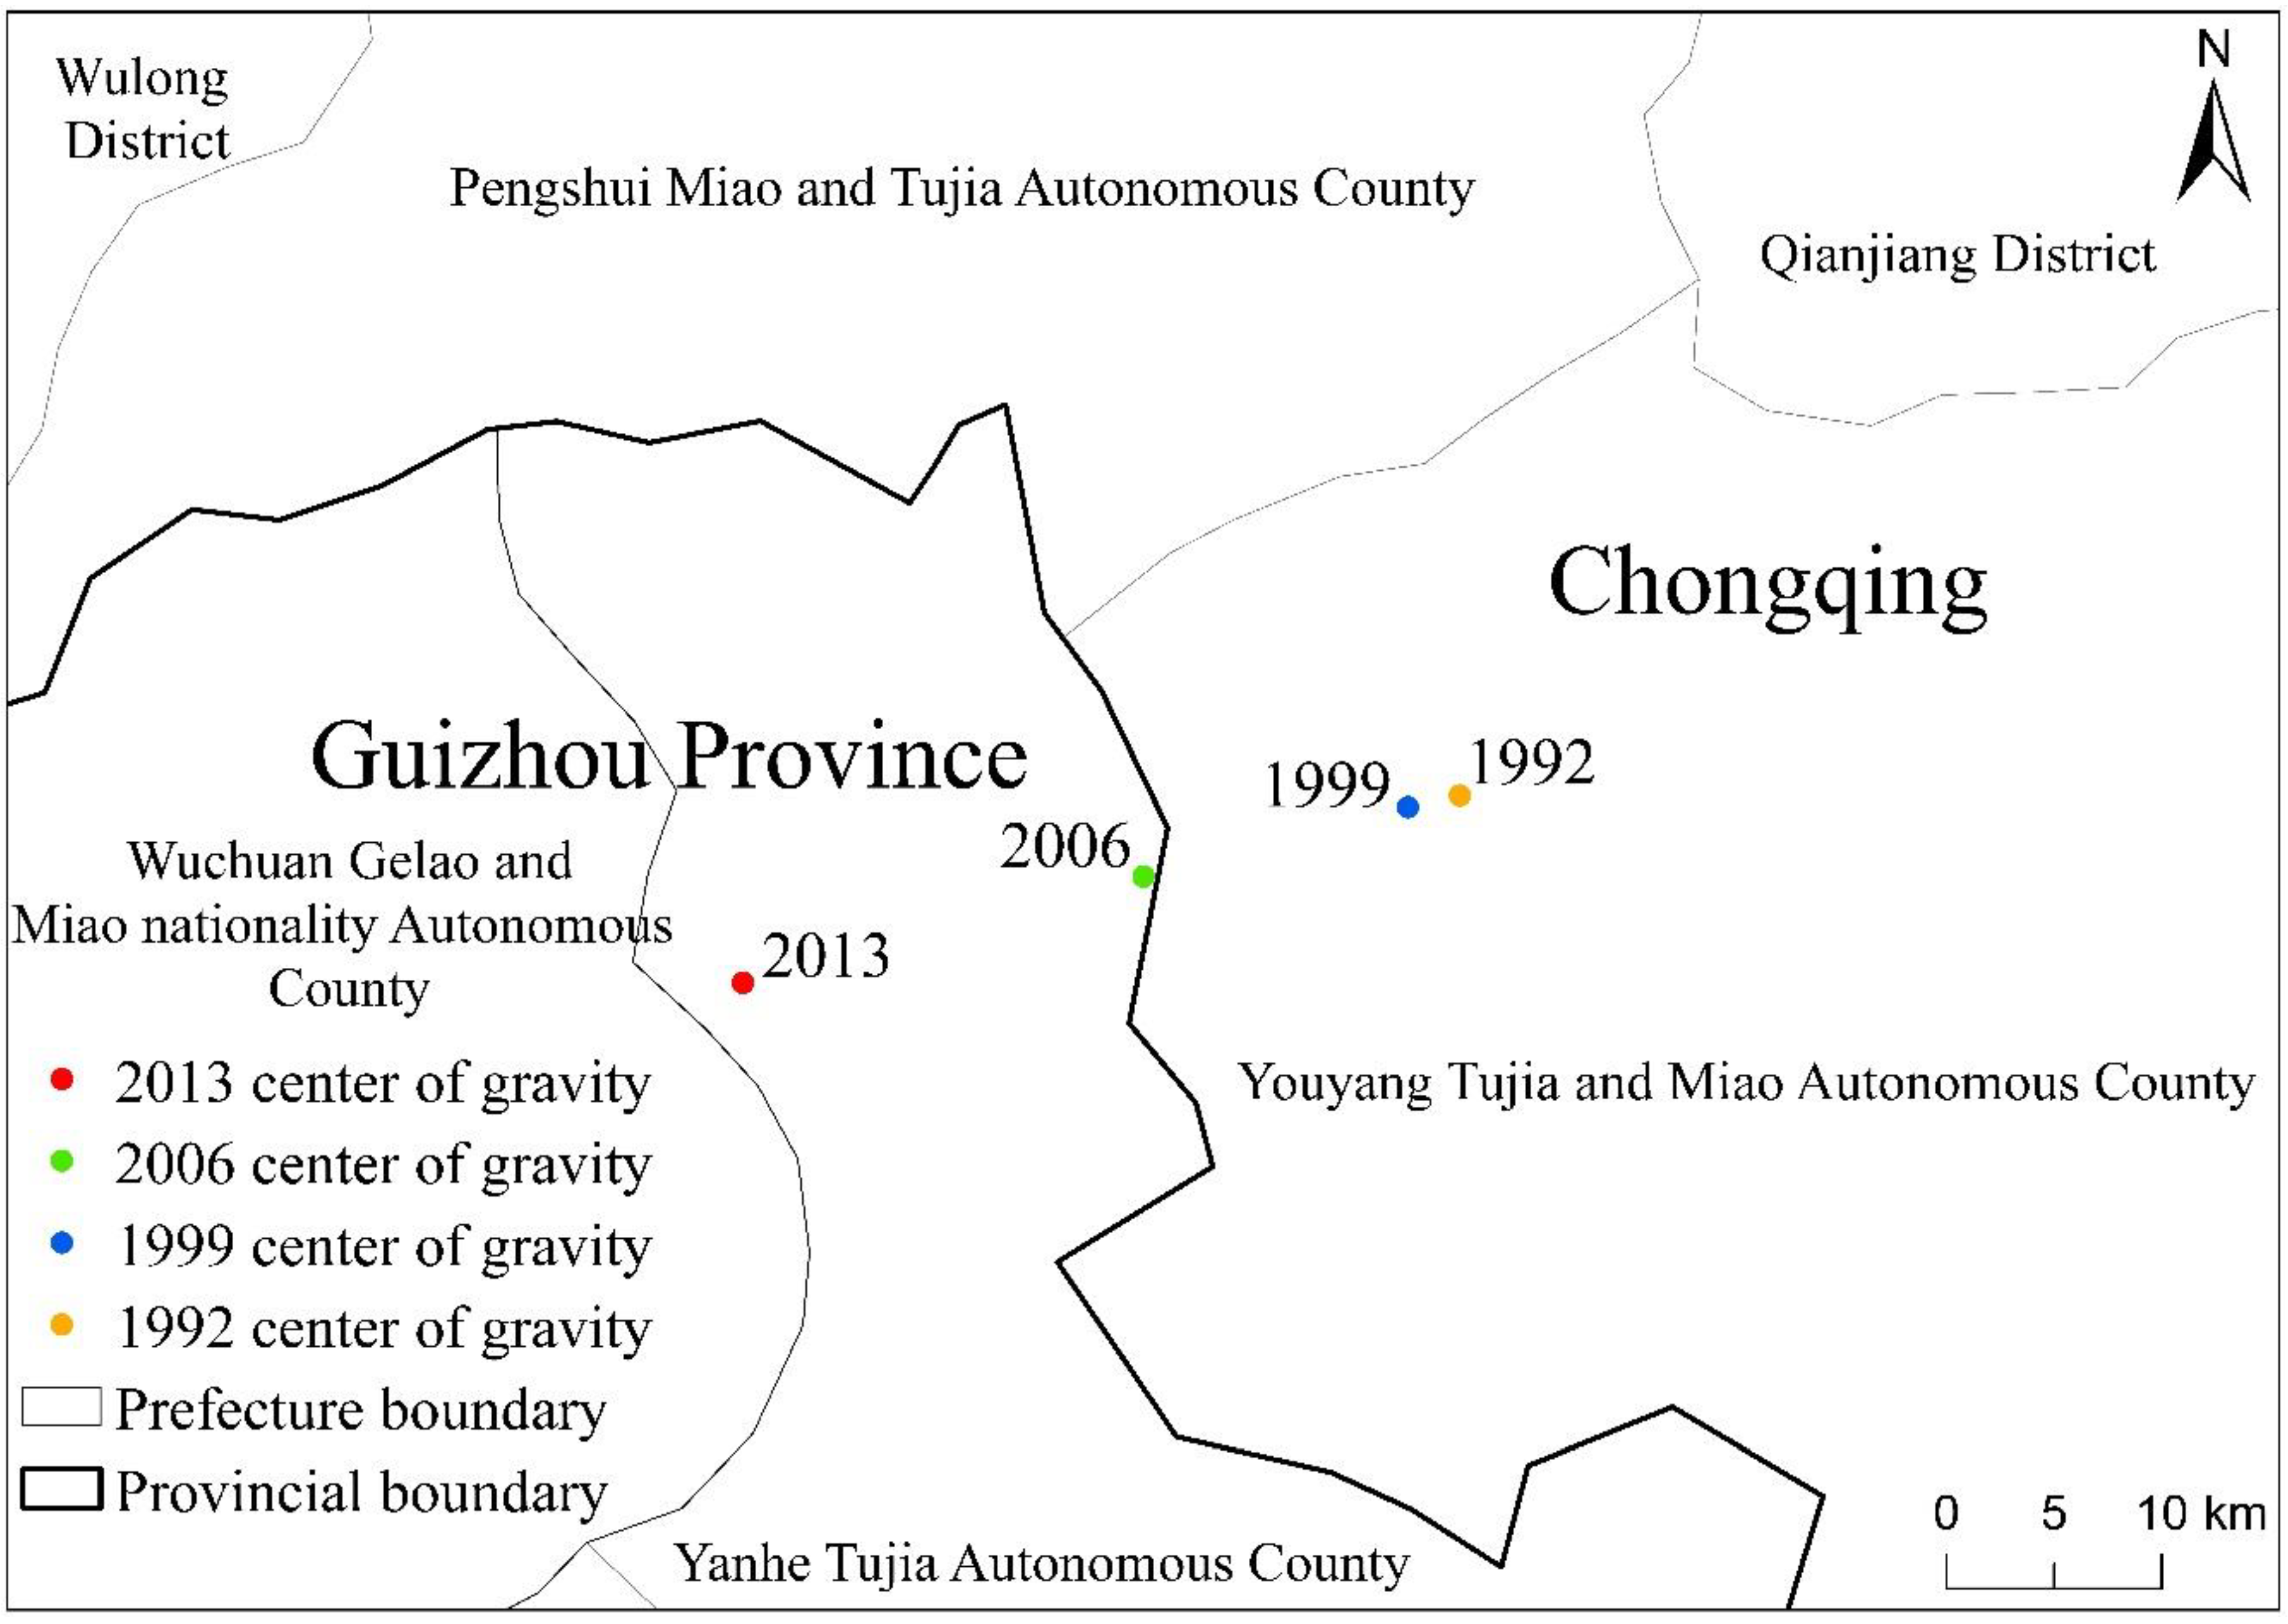
The standard deviation ellipse, as a tool for measuring spatial distribution, is mainly used to determine the range and directional factors of spatial distribution features. It is one of the most important tools for studying the distribution and evolution of spatial elements. Therefore, in order to further analyze the spatial direction of urban land expansion in the YREB, the standard deviation ellipse method was used to measure the urban expansion of the YREB. Then, the standard deviation ellipse of the urban land expansion in the YREB was drawn, and the direction and concentration of the urban land expansion in terms of spatial expansion were clarified by the change in the ellipse area and the movement of the center of gravity.
It can be seen from
Table 5,
Figure 5 and
Figure 6 that the long axis and the short axis of the standard deviation ellipse of the YREB have undergone a certain degree of change during the inspection period, and the spatial distribution generally shows the “southwest–north” pattern. The standard deviation of the scale of the urban system is obviously stronger than that of the short axis. This shows that the main force driving the evolution of the urban system of the YREB originated from the urban growth in the east–west direction, rather than from the urban growth in the north–south direction. The long axis of the standard deviation ellipse has shortened from 946 km in 1992 to 924.7 km in 2013, with an average reduction of 0.97 km per year, while the short axis has increased from 414.5 km in 1992 to 418.9 km in 2013, with an average increase of 0.2 km. Every year, the long-term or short-axis changes in 1992–1999 are smaller than the changes in 1999–2013. It can be seen that, once the 21st century began, the YREB experienced a marked increase in urban expansion.
In terms of gravity shift, during the study period, the center of gravity moved mainly from northeast to southwest. The coordinates of the urban expansion’s center of gravity were transferred from (108.27 E, 28.55 N) in 1992 to (108.09 E, 28.50 N) in 2013. The focus of urban expansion in the YREB was located in You-yang Tu-jia and Miao Autonomous County in 1992–1999, and was also located in You-yang Tu-jia and Miao Autonomous County for most of the 1999–2006 period. However, from 2006 to 2013, the focus of urban expansion was located in the Yan-he Tu-jia Autonomous County along the river. From 1992 to 2013, the center of gravity shifted 29.59 kilometers, with an average annual transfer of 1.35 kilometers to the southwest. The transfer speed was slow in 1992–1999, and it shifted to the southwest at an annual rate of 0.31 kilometers. In 1999–2013, the transfer speed was significantly accelerated, and it shifted to the southwest at an annual rate of 1.97 kilometers. Throughout the study period, the urban system of the YREB gradually shifted southwest, and the urban areas at the fringe of the urban system in the central and western regions grew faster than the core regions, such as the Yangtze River Delta. The southern part of Chongqing and the northern part of Guizhou Province were the areas with the most significant urban growth.
4.5. The Evolution of the Spatial–Temporal Correlation Pattern of Urban Expansion in the YREB
In order to better understand the spatial autocorrelation characteristics of urban expansion in the YREB, the global Moran’s I method was used to calculate the spatial autocorrelation characteristics of the YREB in the years of 1992, 1999, 2006, and 2013.
Figure 7 shows the scatter plot of the calculation results. From
Figure 7, we can see that the global autocorrelation coefficients (Moran’s I) of the YREB in 1992, 1999, 2006, and 2013 are 0.451, 0.495, 0.506, and 0.424, respectively. The average coefficient is 0.0.468933, and the Moran’s I values of all four years are greater than 0, indicating that the data are positively correlated with space, and the value has been increasing continuously from 1992 to 2006. That is to say, the characteristics of urban clusters are significant, as the larger cities tend to be closer to larger cities, and the smaller cities tend to be adjacent to smaller cities. These results also reflect that the spatial expansion of urban expansion in the YREB became more prominent over time during the research period, and the development of small and medium-sized cities and towns was rapid. However, in 2013, the Moran’s I values declined, reflecting the fluctuations in urban expansion. At this time, the spatial cluster characteristics of the urban-scale spatial distribution in the YREB were weakened.
In order to further measure the local spatial structure characteristics of and changes in urban systems, it is necessary to conduct a spatial-scale local-area indicator LISA analysis at the urban scale.
Figure 8,
Figure 9,
Figure 10 and
Figure 11 are urban spatial agglomeration maps and saliency maps based on the Moran’s I scatter plots for 1992, 1999, 2006, and 2010, respectively. From the figure, we can determine the local characteristics and trend of change of the spatial distribution at the scale of the YREB.
In 1992, the spatial distribution of cities of all levels within the YREB initially showed the characteristics of the Yangtze River Delta urban agglomeration, the middle reaches of the Yangtze River, and the Chengdu–Chongqing urban agglomeration. The three major urban agglomerations are core area of expansion of the YREB, especially the leading position of the Yangtze River Delta urban agglomeration, is more obvious. Both the existing urban built-up area and the speed of urban expansion are obviously greater than other areas of the YREB. In addition, the statistically significant urban agglomerations, in addition to the three major urban agglomerations, include the Yu-zhong urban agglomeration, the Qian-zhong urban agglomeration, and the Dianzhong urban agglomeration, which are mainly concentrated in provincial capital cities. The cities around the main city are relatively small in scale and relatively slow in development. The YREB has not yet demonstrated significant spatial relevance.
In 1999, the urban spatial distribution in the YREB began to show more obvious cluster characteristics. At this stage, spatial polarization is the main theme of the evolution of the entire urban agglomeration. On the one hand, the geographical concentration of the entire urban system is further enhanced. On the other hand, those cities near the four cores Shanghai, Wuhan, Chengdu, and Chongqing have developed faster, with the formation of metropolitan areas with Shanghai, Wuhan, Chengdu, and Chongqing as the core. The Yangtze River Delta urban agglomeration still holds this absolute advantage regardless of the urban built-up area or the speed of urban expansion. Besides this, and in addition to the original three major cities, new areas with statistical significance have also been added, including the Central Gui-zhou urban agglomeration and Huai-hua City in Hunan Province. The urbanization of the northern part of Sichuan Province has experienced a period of rapid development and growth. Therefore, we can find that the YREB reflects significant spatial relevance.
In 2006, the cluster characteristics of the spatial distribution of urban systems in the YREB were more obvious. At this stage, the diffusion effects of the three major urban agglomerations and core cities appear, and the metropolitan area and the periphery develop faster. Large and medium-sized cities are end-to-end, transitioning to the initial spatial form of the urban agglomeration, especially the development and agglomeration of the Yangtze River Delta urban agglomeration. The degree of development is most obvious, and the situation of the extended urban agglomeration has been initially formed. In addition, the concentration and distinctive features of the Chengdu–Chongqing, Yu-zhong, and Dian-zhong urban agglomerations are also obvious; these urban agglomerations each have a trend of continuous development. The three sub-cities within the middle reaches of the Yangtze River have a certain distance in spatial distribution. Therefore, the scale of agglomeration is relatively isolated, and it is impossible to form a continuous urban area with a certain scale. The spatial distribution of urban agglomeration is more discontinuous. Large-scale cities are mainly concentrated in Wuhan urban agglomerations and Changsha–Zhuzhou–Xiangtan urban agglomerations. The agglomeration characteristics of Nanchang urban agglomerations are not significant.
In 2013, the degree of clustering of urban spatial distribution in the YREB declined. The Yangtze River Delta urban agglomeration, Wuhan urban agglomeration, Chengdu–Chongqing urban agglomeration, and Yu-zhong urban agglomeration were the regions with more obvious clusters at this stage. Urban systems in other regions had poor clustering. At this stage, the diffusion effect of the Yangtze River Delta urban agglomeration and the Chengdu–Chongqing urban agglomeration is more obvious. The metropolitan area and peripheral development are faster. The large and medium-sized cities are interconnected and transition to the basic spatial form of the continuously spreading urban agglomeration. Among them, the development and concentration of the Yangtze River Delta urban agglomeration is the most obvious, and the pattern of the urban agglomeration has basically formed. In addition, there are many statistically significant areas, such as the Yangtze River Delta urban agglomeration and the Chengdu–Chongqing urban agglomeration. The remaining regions are not significant or significantly weak. In addition, the spatial pattern of the urban system of the entire YREB presents the status quo and trends of the development along the axis of the Yangtze River, along the Yangtze River trunk line, along the Shanghai–Kunming line, and along regional traffic corridors.
4.6. Analysis of Driving Forces of Urban Land Expansion in the YREB
Table 6 shows the statistics of the total urban built-up area, urban population and regional GDP, total social fixed assets investment, and total retail sales of consumer goods in the YREB. It can be seen that the values of the various elements have been increasing. Therefore, in order to further analyze the correlation between the four driving factors and the urban expansion of the YREB, we conducted a correlation analysis. We found that the correlation coefficients between the four driving factors (total urban built-up area, urban population and regional GDP, total social fixed assets investment, and total retail sales of consumer goods) and the urban expansion of the YREB are 0.963, 0.998, 0.99, and 0.994, respectively, indicating that there is a significant correlation between the four driving factors and urban land expansion in the YREB. In addition, the correlation analysis results in this paper are also very close to the calculation results of existing correlation studies [
99,
100], indicating that our correlation analysis results are trustworthy.
The JMP software was used to carry out a partial least-squares regression analysis. The urban construction land in the YREB in 1992–1999, 1999–2006, and 2006–2013 was taken as the dependent variable, and the total urban population, GDP, total investment in fixed assets, and total retail sales of consumer goods were taken as the independent variables. According to the results of the regression analysis, for the periods 1992–1999, 1999–2006, and 2006–2013, the goodness of fit R² of urban construction land and the four influencing factors (total urban population, GDP, total investment in fixed assets, and total retail sales of consumer goods) in the YREB is 0.791, 0.824, 0.851, and 0.898, respectively. These results show that the four influencing factors have an important impact on the expansion of urban construction land in the YREB. However, there are significant differences in the size of the action in different time periods. A summary is provided below.
(a) The regression coefficient of the urban population increased from 0.692 in 1992 to 0.845 in 2013, indicating that its impact on urban land expansion in the YREB increased over time. The reason for this is that, after a large number of people enter a town, the size of its urban residential areas will increase. For example, the area with the highest level of urbanization in the YREB was also the most concentrated area in the region. (b) The regression coefficients of regional GDP in the periods 1992–1999, 1999–2006, and 2006–2013 were 0.892, 0.941, and 0.982, respectively, reflecting that the influence of regional GDP on urban land expansion in the YREB became greater over time. With the continuous increase in the urban economic level, the towns also experienced tremendous development. Example manifestations of this development are the increase in the area of urban construction land and the emergence of new towns. (c) The regression coefficient of the total investment in fixed assets increased from 0.756 in 1992 to 0.921 in 2013, indicating that the total investment in fixed assets played an increasingly important role in the expansion of urban land use in the YREB. The reason for this is that total investment in fixed assets is the main source of funding for urban construction and other development. (d) The regression coefficient of the total retail sales of consumer goods dropped from 0.612 in 1992 to 0.463 in 2013, indicating that the impact of total retail sales of consumer goods on urban expansion in the YREB declined, as evidenced by the continuous expansion of urban areas and the urban population. The consumption capacity of the whole of society, especially the overall consumption power of residents, increased more slowly than urban population and regional GDP due to such factors as income level and price level.
5. Discussion
The YREB Strategy is a new regional open development strategy that is the product of a new round of reform to open up and transform China. The YREB is an inland economic belt with global influence. It is a major national strategic development area of China, and has great development potential. In addition, the promotion of urbanization is also one of the main goals of the development of the YREB. Therefore, we believe that it is meaningful to analyze the urban expansion of the YREB in China and the forces that drive its expansion.
The research methods used in this study have a good effect when used in combination. (a) The landscape pattern index method can reflect the changes in urban land patches in the YREB. (b) The expansion strength index can reflect the growth rate of urban land use in the YREB in a unit of time. (c) The compactness index can reflect the degree of compactness of the urban form. (d) The fractal dimension of urban land can be used to describe the curvature and complexity of the shape of a town’s boundary in the YREB. (e) The coefficient of elasticity of urban expansion can establish the coordination relationship between the speed of urban expansion and the speed of population growth. (f) The standard deviation ellipse method can reflect the direction and center of urban expansion in the YREB. (g) The spatial autocorrelation analysis method can reveal the spatial correlation of urban expansion in the YREB. Moreover, this study also analyzed the factors that drive urban expansion in the YREB, and determined the influence that these factors had on the urban expansion of the YREB in different time periods. Therefore, the results of this paper are relatively reliable and reasonable.
In conclusion, we found that, due to the geographical conditions, spatial distance, and stage of development, the urban spatial distribution of the YREB showed obvious discontinuity and fragmentation. The evolution of the urban agglomerations in the region exhibited diverse spatial development characteristics. Therefore, optimization of the spatial structure of the urban system of the YREB ought to be promoted. Such optimization should not only emphasize the local spatial agglomeration at different levels but should also improve the coordination among the different urban spatial structures throughout the YREB.
This study has two shortcomings. Firstly, the DMSP/OLS nighttime lighting data have significant advantages for urban research. In addition, since the data are long-term sequence data that span the period from 1992 to 2013, they are suitable for application in research work that reveals changes in urban land use over long periods of time. However, the DMSP/OLS nighttime lighting data also have a low resolution, which makes the extraction of small urban areas, such as small towns, less accurate. In addition, considering that Net Primary Production-Visible infrared Imaging Radiometer (NPP-VIIRS) night light data and Luojia01 night light data have higher resolution, especially Luojia01 night light data has the highest resolution. Therefore, in the follow-up study, the integration of DMSP/OLS night lighting data, NPP-VIIRS night lighting data and Luojia01 night lighting data can be further expanded and improved. Moreover, the method of street based metrics is also an important indicator worth applying to urbanization research. Secondly, in the analysis of the factors that drive urban expansion in the YREB, since the research object includes 11 provinces and cities, and the study’s time span is a long period of time, differences exist in the statistics of different provinces and cities, resulting in a lack of such data as the total green area and the total length of traffic lines. Therefore, we only selected four driving factors (urban population, regional GDP, total fixed assets investment, and total retail sales of consumer goods). However, the forces that drive urban built-up area expansion include a variety of influencing factors. Therefore, in the follow-up study, we should increase the driving force of urban expansion, carry out extensive data collection and expand data collection channels, such as increasing the urban green area and the length of urban public transportation mileage, so as to finally build a reasonable driving force index system for urban expansion.
6. Conclusions
In this study, we used nighttime lighting data and nine methods, including a comparison method based on auxiliary data, the landscape index method, a spatial expansion strength index, a compactness index, an urban land fractal index, the elasticity coefficient, and the standard deviation ellipse, to analyze the evolution of urban expansion in the YREB in China. Our conclusions are as follows.
(a) Through the calculation of the selected 8 landscape pattern indicators, we found that during the study period, the number of urban built-up areas and towns in YREB generally increased, and small and medium-sized cities and emerging towns also continued to develop. At the time level, the growth rate between 2003 and 2013 was significantly higher than the growth rate from 1992 to 2002. In addition, as the overall index declines, this reflects the increasing frequency of interactions and interactions between towns. However, during the study period, there are certain fluctuations in various indicators, which reflects the significant instability and irregularity of YREB urbanization development. (b) The average annual growth index of YREB is 0.18 during the 22 years from 1992 to 2013, and the expansion intensity index is increasing year by year, reflecting that the urban development of YREB is in a consistent growth trend and the growth rate is increasing. (c) The compactness of YREB generally decreased over time, and the fractal dimension increased slowly over time. These results indicate that YREB’s urban development is relatively stable. In addition, the coefficient of elasticity of urban expansion increased first and then decreased, reflecting the inconsistency between urban expansion and YREB population growth. (d) The long axis and short axis of the standard deviation ellipse of the YREB underwent a certain degree of change during the inspection period. The standard deviation of the urban system scale was obviously stronger than that of the short axis. The main driving force came from the urban growth in the east–west direction, not the north–south direction. In terms of gravity shift, during the study period, the center of gravity’s movement trajectory mainly shifted from northeast to southwest, reflecting that the urban area in the central and western regions grew faster than that in the core regions, such as the Yangtze River Delta.(e) The values of Moran’s I in the years 1992, 1999, 2006, and 2013 were all greater than 0, indicating a positive spatial correlation, and the values increased continuously from 1992 to 2006, showing significant urban cluster characteristics. However, in 2013, the Moran’s I values declined, reflecting a weakening trend of spatial clusters in the spatial distribution at the urban scale in the YREB. (f) The four factors that promoted the expansion of urban construction land in the YREB had an important impact on the expansion of YREB urban construction land, and these four factors were positively related to the urban expansion of the YREB. However, there were significant differences in the size of the action in different time periods.


