Article

The Continuity MODIS-VIIRS Cloud Mask

Cooperative Institute for Meteorological Satellite Studies, Space Science and Engineering Center, University of Wisconsin-Madison, Madison, WI 53706, USA
*
Author to whom correspondence should be addressed.
Remote Sens. 2020, 12(20), 3334; https://doi.org/10.3390/rs12203334
Submission received: 25 August 2020 / Revised: 2 October 2020 / Accepted: 9 October 2020 / Published: 13 October 2020

Abstract

:
This paper introduces the Continuity Moderate Resolution Imaging Spectroradiometer (MODIS)-Visible Infrared Imaging Radiometer Suite (VIIRS) Cloud Mask (MVCM), a cloud detection algorithm designed to facilitate continuity in cloud detection between the MODIS (Moderate Resolution Imaging Spectroradiometer) on the Aqua and Terra platforms and the series of VIIRS (Visible Infrared Imaging Radiometer Suite) instruments, beginning with the Soumi National Polar-orbiting Partnership (SNPP) spacecraft. It is based on the MODIS cloud mask that has been operating since 2000 with the launch of the Terra spacecraft (MOD35) and continuing in 2002 with Aqua (MYD35). The MVCM makes use of fourteen spectral bands that are common to both MODIS and VIIRS so as to create consistent cloud detection between the two instruments and across the years 2000–2020 and beyond. Through comparison data sets, including collocated Aqua MODIS and Cloud-Aerosol LIdar with Orthogonal Polarization (CALIOP) from the A-Train, this study was designed to assign statistical consistency benchmarks between the MYD35 and MVCM cloud masks. It is shown that the MVCM produces consistent cloud detection results between Aqua MODIS, SNPP VIIRS, and NOAA-20 VIIRS and that the quality is comparable to the standard Aqua MODIS cloud mask. Globally, comparisons with collocated CALIOP lidar show combined clear and cloudy sky hit rates of 88.2%, 87.5%, 86.8%, and 86.8% for MYD35, MVCM Aqua MODIS, MVCM SNPP VIIRS, and MVCM NOAA-20 VIIRS, respectively, for June through until August, 2018. For the same months and in the same order for 60S–60N, hit rates are 90.7%, 90.5%, 90.1%, and 90.3%. From the time series constructed from gridded daily means of 60S–60N cloud fractions, we found that the mean day-to-day cloud fraction differences/standard deviations in percent to be 0.68/0.55, 0.94/0.64, −0.20/0.50, and 0.44/0.82 for MVCM Aqua MODIS-MVCM SNPP VIIRS day and night, and MVCM NOAA-20 VIIRS-MVCM SNPP VIIRS day and night, respectively. It is seen that the MODIS and VIIRS 1.38 µm cirrus detection bands perform similarly but with MODIS detecting slightly more clouds in the middle to high levels of the troposphere and the VIIRS detecting more in the upper troposphere above 16 km. In the Arctic, MVCM Aqua MODIS and SNPP VIIRS reported cloud fraction differences of 0–3% during the mid-summer season and −3–4% during the mid-winter.

Graphical Abstract

1. Introduction

Discrimination between the clear and cloudy pixels is a crucial first step in most satellite data applications. Retrieval algorithms, such as atmospheric correction, aerosol properties, or sea-surface temperature (SST), require observations without clouds. On the other hand, cloud property algorithms, such as optical depth, cloud particle size, or cloud thermodynamic phase, need cloudy fields of view (FOVs) that ideally are devoid of clear skies. Many cloud detection schemes have been proposed in the meteorological satellite era [1], some appropriate for very specific regions such as the Atacama Desert [2] or the Himalayan region [3], others for specific uses like SST generation [4] or vegetation properties [5]. Other methods were designed for global use and more general purposes such as Earth radiation budget studies [6] or cloud properties such as frequency, height, and radiative forcing [7]. Some masks, such as in the International Satellite Cloud Climatology Project (ISCCP) [8] or the Clouds from Advanced Very High Resolution Radiometer (AVHRR) Extended (CLAVR-x) [9,10] have been applied to instruments on both polar orbiting and geostationary platforms [11].
The Continuity Moderate Resolution Imaging Spectroradiometer (MODIS)-Visible Infrared Imaging Radiometer Suite (VIIRS) Cloud Mask (MVCM) derives from a cloud detection algorithm applied to combined solar and infrared imager and sounder data from a polar orbiting satellite. In the 1990s, a multi-spectral thresholding cloud mask was developed for combined Advanced Very High Resolution Radiometer (AVHRR) and High-resolution Infrared Radiation Sounder (HIRS) data [7]. A similar, but spectrally expanded cloud mask using “fuzzy” logic to implement spectral cloud test thresholds (MxD35) was created to operate on Moderate Resolution Imaging Spectroradiometer (MODIS) radiances [12]. Here, we used “MxD35” to indicate the general MODIS cloud mask algorithm, i.e., MYD35 (Aqua) or MOD35 (Terra). Details of the MxD35 algorithm, the implementation of fuzzy logic, the combination of the various spectral tests, and the history of its development may be found in [12,13]. Since 2000, this algorithm and its later improved versions have been in continuous operation in the MODIS Adaptive Processing System (MODAPS) located at NASA Goddard Space Flight Center, creating cloud detection data for Terra and Aqua MODIS. The MVCM is derived directly from Collection 6 of the MxD35 algorithm and is designed to facilitate continuity in cloud detection between MODIS on the Aqua and Terra platforms and the series of Visible Infrared Imaging Radiometer Suite (VIIRS) instruments, beginning with the Soumi National Polar-orbiting Partnership (SNPP) spacecraft. Global Terra and Aqua MODIS cloud products, including cloud fraction (CF), have been available from early 2000 until present and are expected to continue until 2026. The VIIRS data begin in early 2012 and will potentially be available until 2040 on various satellite platforms. Together, these instruments constitute a 40 year record of satellite ocean, land and atmosphere measurements, including clouds. In this paper, we determined the degree to which the MVCM Aqua MODIS, SNPP VIIRS, and NOAA-20 VIIRS are consistent with each other and with MYD35, recognizing that improvements will continue to be made and the reprocessing of the various MVCM output data sets will be performed. Statistics shown in the paper will be used as benchmarks for these improvement efforts.

2. Materials and Methods

MODIS instruments measure upwelling radiation from the earth-atmosphere system in 36 spectral bands [14], while the VIIRS has a subset of these in 20 bands plus a day/night visible channel [15]. To promote continuity [16], the MVCM utilizes only those channels that are common to both instruments (see Table 1). MODIS band 21 (3.96 µm) has no corresponding band on the VIIRS. Since the 4 µm spectral region is important for both day and night cloud detection and MODIS cloud test thresholds have been carefully selected and adjusted over the years, it was decided to keep this band for MODIS and to develop separate VIIRS thresholds using M12 (3.75 µm). Pixel by pixel clear sky vs. cloudy sky discrimination was accomplished using the same “fuzzy logic” methodology as in the MODIS cloud mask [12]. Nominal spatial resolution of the MVCM L2 product is 1 km for MODIS and 750 m for VIIRS. The MVCM is capable of processing both MODIS and VIIRS inputs; in this document, we refer to the VIIRS output from the algorithm as “MVCM VIIRS” and the MODIS output as “MVCM Aqua MODIS”. Terra MODIS outputs have not yet been produced by the MVCM.
Clouds are generally brighter and colder than their underlying surfaces. Therefore, during daylight hours a majority of clouds are discernable by the use of visible and near infrared (VNIR) reflectances along with long wave infrared (LWIR) measurements (here we use LWIR to denote the atmospheric window region from 8 to 12 µm). At night, the LWIR brightness temperatures are sufficient for the detection of most middle and high-altitude clouds. However, it is in areas with reduced LWIR contrast at night (e.g., oceanic low altitude clouds, polar night) that infrared measurements in atmospheric gas absorbing spectral regions become important for cloud detection. Fewer of these spectral observations on the VIIRS instrument compared to the MODIS accounts for most of the differences between the MVCM and MxD35 algorithms.
The most important atmospheric absorption bands for MODIS cloud detection that are not included on the VIIRS are the water vapor absorption channels at 6.7 and 7.3 µm. These, in addition to the CO2 absorption band at 13.3 µm play a significant role in the detection of clear skies in polar night conditions [17]. These “clear sky restoral” tests are performed to find unambiguously clear pixels for certain scene types and are not strictly part of the “fuzzy logic” algorithm [12]. In addition, MODIS bands at 17 and 18 in the 0.9 µm water vapor absorption band are used in clear sky restoral tests for sun glint conditions. Table 2 shows MODIS spectral bands and cloud tests used in MxD35 that are not found in the MVCM.
In an attempt to mitigate the loss of information due to a lack of absorption bands seen in Table 2, and to take advantage of new algorithm development, there are several new features in the MVCM that are currently not found in the MxD35 algorithm.

2.1. 6/2.1 µm Ocean Day Threshold Test

A new a threshold test employs reflectances from the 1.6 µm (VIIRS and Terra MODIS) and 2.1 µm (Aqua MODIS) bands to better detect water phase clouds over daytime water surfaces. The 2.1 µm band is substituted for 1.6 µm on Aqua because the performance of the majority of detectors is irreversibly compromised [18]. The very dark ocean background in these spectral bands is especially helpful for thin clouds, partially cloud-filled pixels, and cloud edges. How this test, and all the various spectral cloud tests are combined to create the final confidence of clear sky can be found in [12,13].

2.2. Turbid Water Test

A new turbid water clear sky test has been implemented for shallow waters and follows the method of Chen and Zhang [19]. Bottom and suspended sediments in near-shore waters can have strong reflectance signals in VNIR bands and result in false cloud determinations. Reflectance standard deviations at 2.1 µm are calculated over 3 × 3 pixel regions centered on the pixels of interest. Pixels in regions with smaller standard deviations than the threshold value are labeled as clear.

2.3. Test for Snow Cover over Vegetated Regions

An addition to the normalized difference snow index (NDSI) test has been added, following Klein et al. [20]. For vegetated scenes where the NDSI is lower than expected for snow cover, a normalized difference vegetation index (NDVI) value is compared to a threshold that is itself a function of the NDSI. If the NDVI is less than the calculated threshold, snow cover is assumed.

2.4. New Test Thresholds in the MVCM

A general strategy for transitioning cloud tests from MxD35 to the MVCM was to fine tune thresholds, i.e., tune the tests such that they detect as many clouds as possible without greatly increasing false positives. Where possible, this was done in order to account for lesser amounts of information in the VIIRS suite of spectral measurements. The following changes were made to the MVCM cloud test thresholds as compared to MxD35.

2.5. Daytime Land 1.38 µm Cirrus Test

These thresholds were lowered from {0.040, 0.035, 0.030} to {0.0375, 0.0250, 0.0125} for low, middle, and high confidence of clear sky, respectively.

2.6. Daytime Water 0.86, 1.6/2.1, and 1.38 µm Thresholds

In the MVCM, these thresholds are functions of solar zenith angle (SZA) in the following form:
thr = coeff[0] + coeff[1]*sza + coeff[2]*sza2 + coeff[3]*sza3 + …,
where thr is the high confidence clear sky threshold and sza is the solar zenith angle. The middle and low confidence thresholds are calculated as offsets from thr. There are separate coefficients for MODIS and VIIRS and both were taken from collocated imager reflectances and CALIOP (Cloud-Aerosol Lidar with Orthogonal Polarization) lidar data [21] where the CALIOP cloud product [22] served as the “truth” for clear vs. cloudy skies. The thresholds are further defined according to the viewing zenith angle (VZA) in the following form:
thrvza = thr * (1.0/cos(vza)p),
where p = 0.75 for VIIRS and 0.50 for MODIS (0.86 and 1.38 µm tests). The value of p for the VIIRS 1.6 µm is test is 0.25; no VZA adjustment is used for MODIS Aqua (2.1 µm). Additional upward adjustments are made for the 1.38 µm thresholds beyond 45 degrees SZA (maximum of 0.02 at 90 degrees SZA). Very low values of atmospheric moisture in these regions make adjustments mandatory. This test will need monitoring because of the future possibility of more open water at polar latitudes.
MVCM granule (Level 2) and aggregated MVCM (Level 3) data were obtained from the NASA Atmosphere Science Investigator-Led Processing Systems (ASIPS) at the University of Wisconsin-Madison [23]. The ASIPS is responsible for maintaining the MVCM algorithm and creating the MVCM product. The entire record of Level 2 and Level 3 MVCM Aqua MODIS, SNPP VIIRS, and NOAA-20 VIIRS mask data (March 2012–present) has been generated and delivered to the NASA Level-1 and Atmosphere Archive and Distribution System (LAADS) Distributed Active Archive Center (DAAC) for public distribution. MODIS cloud mask (MYD35) data are also available from the LAADS DAAC and collocated CALIOP lidar and MVCM observations were obtained from the ASIPS and are available upon request.

3. Results

3.1. An Example Aqua MODIS Scene

Figure 1 shows an example output from the MVCM Aqua MODIS. The data are from 4 August, 2019 at 09:15 UTC. The bounding coordinates (latitude, longitude) for this 5 min granule are, clockwise from top left: (−7.86, 76.98), (−10.89, 55.94), (7.05, 52.22), and (10.07, 73.22); however, only about 50% of the latitudinal extent of the granule is pictured here. Lines of equal latitude and longitude in 5° increments are shown. Note that Aqua was in ascending node at this time, with north shown at the bottom and east at the right, in proper time order that the data were taken. This places the scene in the equatorial Atlantic Ocean during daylight hours. Much of the scene is in the geometric sunglint region, defined as up to 40° from the specular reflection point.
Panels (a) and (b) show 0.86 µm and 1.38 µm reflectances, respectively, while Panel (c) shows the basic MVCM output comprised of four possible classes: clear (shown in green), probably clear (blue), probably cloudy (red), and cloudy (white). The inherent uncertainties of VNIR cloudy vs. clear sky thresholds account for much of the red (probably cloudy) and blue (probably clear) decisions seen. Three spectral cloud tests are show in Panels d–f: 1.38, 1.6, and 8.6 µm, respectively. The 1.6 µm test (d) is new in the MVCM, as are the 1.38 µm test thresholds, as noted above. The 8.6 µm test (f) is performed in both day and night conditions but is obviously not as sensitive to thin cirrus as is the 1.38 µm test. Highly sensitive cloud tests during daylight hours as well as more cloud tests in general, explain the more robust daytime detection statistics seen in the results below. See [13] for detailed explanations of the various cloud tests using the bands listed in Table 1 and examples of day and night mask output.

3.2. Comparisons to CALIOP Lidar

Table 3 shows the overall hit rates (combined cloud and clear sky agreement, see Equation (3)) when MYD35 C6.1 (“M35” in Table 3, MVCM Aqua MODIS, MVCM SNPP VIIRS, and MVCM NOAA-20 VIIRS are compared to the collocated 1 km resolution CALIOP lidar cloud detection [24], here considered to be “truth”. Overall hit rates in Table 3 are calculated as
OvHR = [(n(tp) + n(tn)/n(total)] * 100.0,
where OvHR is overall hit rate in percent, n(tp) is the number of pixels where the CALIOP and cloud mask agreed the scene was cloudy (“true positives”), n(tn) is the number of pixels where CALIOP and cloud mask agreed that a scene was clear (“true negatives”), and n(total) is the total number of pixels analyzed. Time coverage is June–August (JJA), 2018 (left hand side, and December 2017–February (DJF), 2018 (right hand side. A maximum of 5 minutes was allowed between CALIOP and the imager observations. In the comparisons, only completely clear and completely cloudy 1 km CALIOP data were considered. The authors considered CALIOP cloud detection to be the best option for validating passive imager cloud masks. Though certainly not perfect, it provides global, high quality cloud screening during both day and night. Since it is capable of detecting very optically thin clouds, it also provides a severe test of cloud masks derived from passive sensors. Several drawbacks are that CALIOP is nadir viewing only, never views significant sunglint, and its footprint is only 80 meters wide while that of the imagers in this study are 750 meters (VIIRS) to 1000 meters (MODIS). However, the extreme sensitivity to clouds compared to MODIS and VIIRS and the global nature of the observations easily outweigh these disadvantages.
Globally, MVCM Aqua MODIS < MYD35 by 0.7% in JJA and 1.5% in DJF, where the latter difference comes primarily from polar night conditions. Lack of IR absorbing channels in the MVCM algorithm (consistent with VIIRS) account for this difference. Agreement discrepancies are smaller for 60S–60N overall. In other 60S–60N categories, the MYD35 vs. MVCM Aqua MODIS differences are generally < 1% (except the water day in DJF) and MVCM Aqua MODIS exceeds MYD35 in some scene types. Globally, the MVCM VIIRS (SNPP and NOAA-20) < MVCM Aqua MODIS. Generally, MVCM VIIRS < MVCM MODIS except for water day, land and desert night, and polar night. It is not yet clear what causes lower agreements to CALIOP for MVCM VIIRS. Larger view angle differences, calibration differences, smaller numbers of collocations, as well as suboptimal cloud test thresholds are all suspects. Note that statistics do not include December 2017 for NOAA-20 VIIRS (shown in Table 3 as JF) as the instrument was not yet operational at that time.
Calculations of the Student’s T-Test statistic for global and 60S–60N categories indicate that differences between MYD35 and MVCM Aqua MODIS hit rates are statistically significant at p = 0.05 except for 60S–60N during JJA. Significant differences are not unexpected given that more information about clear vs. cloudy skies is available to MYD35. However, when most snow and ice are removed from consideration (60S–60N during JJA), the differences become insignificant. MVCM SNPP and NOAA-20 VIIRS hit rate differences that are not statistically significant because the inputs and cloud test thresholds are very similar. MVCM Aqua MODIS and MVCM SNPP VIIRS hit rate differences are significant, both globally and from 60S–60N latitude, during JJA but not for DJF. The interpretation here is less clear; perhaps it indicates that the SNPP VIIRS thresholds are less than optimal for some regions or scene types as noted above. From Table 3, one notices a rather large hit rate difference between these two for the global day in JJA but beyond that, inferences are not obvious.

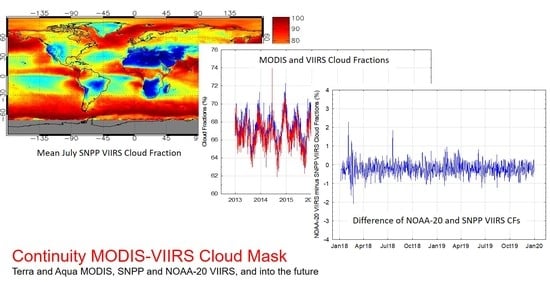
3.3. Comparisons of the MVCM between Aqua MODIS, SNPP VIIRS, and NOAA-20 VIIRS

In this section, we inspect the continuity of cloud detection through comparisons of equal-angle 1° latitude/longitude mean daytime CFs from MVCM Aqua MODIS and SNPP VIIRS. Figure 2a,b show the global maps of mean MVCM MODIS and VIIRS CFs, respectively, from the month of July over the years 2013–2019, while Figure 2c,d detail MODIS minus VIIRS CFs for the months of July and January, respectively, from 2013 to 2019. Figure 2a,b clearly show the same large-scale cloud features with heavy cloud cover along the Intertropical Convergence Zone (ITCZ), in the subtropical stratus regimes west of California, S. America, and Africa, and in oceanic regions of both hemispheres poleward of 30° latitude. Areas of little cloud cover are seen in the western U.S., central South America, Northern and Southern Africa, and Australia. Smaller-scale features also agree, like the cloud-free area west of Madagascar and the shapes of the cloudy regions in the oceanic stratus regimes (darker red shades). Figure 2c,d show the MVCM Aqua MODIS minus SNPP VIIRS CF differences in percent. The most apparent disparities in the oceanic regions are the two bands of higher cloudiness seen in the SH in July and in the NH in January (yellow color). Larger positive differences (red) are seen in snow- and ice-covered areas in both months, while negative discrepancies (blue) are seen in some arid regions of North Africa, the Arabian Peninsula, and central Asia.
Figure 3 shows the time series of MVCM Aqua MODIS and MVCM SNPP VIIRS CFs. Panels a and b illustrate 60S to 60N daily mean CFs from 2013 to 2019 for day and night, respectively. MODIS and VIIRS track one another closely with MODIS CFs slightly larger for the vast majority of days. This is expected because of the larger instantaneous field of view (IFOV) of the MODIS (1 km at nadir, [14]) compared to the VIIRS (750 m) [15]. Panels c and d show MODIS minus VIIRS CFs for the same regions and time period. Means of the daytime differences range from about one-half percent at the beginning of the period to about one percent by 2020, while the nighttime values have a bias of approximately 1% across the time period. Ninety percent of the daily mean daytime CF differences lie between −0.3% and 1.6%. For the nighttime, the range is from −0.1% to 2.1%. The decrease in daytime SNPP VIIRS CF (increase in Aqua MODIS minus SNPP VIIRS) is related to changing the calibration characteristics of visible and near infrared (NIR) channels between the SNPP VIIRS and Aqua MODIS. Meyer et al. [25] showed a consistent decrease in the SNPP VIIRS M5 (0.65 µm) and M7 (0.86 µm)-calibrated reflectances relative to the corresponding MODIS Aqua spectral bands (1 and 2, respectively) beginning in 2016. VIIRS M5 is relied on for cloud detection over vegetated surfaces and M7 over water surfaces in the MVCM algorithm (see Table 1). A majority of the positive change seen in Figure 3c is over oceans, due to a greater sensitivity to clouds over dark water surfaces than over brighter and more variable land surfaces. Panels e and f (day and night, respectively) show cloud fraction differences between SNPP and NOAA-20 VIIRS over the calendar years 2018–2019 from the6 0S–60N latitude. The differences are small and stable over time, with 90% of the daytime differences lying between −0.9 and 0.4%. Similar nighttime values range from −0.4% to 1.1%.
Table 4 shows mean values of day-to-day cloud fraction differences and variabilities between the three MVCM algorithms (Aqua MODIS minus SNPP VIIRS, NOAA-20 VIIRS minus SNPP VIIRS) and for several scene types between 60S to 60N latitude. Day and night values for the entire zonal bands are in bold type at the beginning of the Table 4. Differences are taken between aggregations of pixel- and area-weighted daily mean 1° cloud fractions. Differences between Aqua MODIS and SNPP VIIRS are from 2013 to 2019, while those between NOAA-20 and SNPP VIIRS are from 2018 to 2019. Overall, the differences of daily means average < 1.0% between Aqua MODIS and SNPP VIIRS over the seven years from 2013 to 2019, and <0.5% between SNPP and NOAA-20 VIIRS from 2018 to 2019. Perhaps more importantly, standard deviations of the differences are also < 1% overall from 60S–60N. Hemispheric differences for land and water surfaces are listed in non-bolded values in the remainder of Table 4.

3.4. Cirrus Detection Comparison between MODIS and VIIRS 1.38 µm Channels

As is well known [26], spectral characteristics differ between the 1.38 µm water vapor absorption bands of MODIS [14] and VIIRS [27]. The response function of the MODIS band is broader than the VIIRS. This results in the significant response from the wings of the band, allowing reflectances from the lower and middle atmosphere to be measured by MODIS, especially in regions of low water vapor loading. The VIIRS band is narrower, allowing relatively less reflected energy from low in the troposphere and relatively more from upper regions (higher signal to noise), including cirrus clouds. Figure 4 shows MVCM Aqua MODIS and MVCM SNPP VIIRS 1.38 µm cloud test results (hit rates) as a function of collocated CALIOP cloud heights for the Julys from 2013 to 2016 and 60S–60N latitude. A “hit” is defined as a confidence of cloud > 0.5 according to the 1.38 µm cloud test (see “middle” confidence thresholds in Section 2 above). The MVCM reports two 1.38 µm cloud test results in the 48 bits allotted for each pixel: (1) a thin cirrus test in bit 9 and (2) a more general cloud test in bit 16 that is included in the calculation of the final cloud/no cloud decision. Here, we used the more general test results. Panel a displays the hit rates as a function of land or water surface while Panel b shows only those observations with CALIOP cloud optical depths (COD) > 0.25. Panel a shows that the detection rate of cirrus is about 20% higher over water for both MODIS (solid lines) and VIIRS (dashed lines). This is due to the fact that cloud vs. clear sky thresholds over water surfaces may be set lower than for land surfaces due to the contrast between the cloud and the darker ocean surface. For water surfaces, the MODIS algorithm is more successful in detecting clouds below about 7 km. This is explained by the higher reflectances measured by the MODIS instrument in the middle troposphere due to its lesser sensitivity to water vapor. Some clouds are not detected by the VIIRS due to water vapor absorption in the narrower spectral band of the VIIRS. The pattern switches above about 15 km where these high and likely tropical clouds are more easily detected by VIIRS. Here, the moist, tropical atmosphere results in a better contrast in VIIRS than MODIS between a cirrus cloud and the background reflectance. The same pattern generally holds for land surfaces but the detection rate for both instruments is lower due to higher surface reflectances. Panel b is similar but here only those clouds with COD > 0.25 are considered (as measured by CALIOP). In this plot, solid lines represent all clouds and dashed lines are “thin” clouds defined as those lidar profiles where both cloud and surface returns were observed. Detection rates are > 0.9 for all cirrus clouds from about 7–15 km in height. Again, MODIS is slightly more sensitive for cloud tops up to about to about 15 km where the VIIRS then becomes more effective. The same holds for the thinner clouds but the hit rate is lower.

3.5. Cloud Detection in the Arctic

Though clouds play an important role in the Arctic radiation budget [28] and are suspected of currently undergoing changes in a climate change scenario [29], their detection and characterization by passive remote sensors is challenging [30]. There is often little contrast in visible reflectance between clouds and the frozen surfaces during daytime. This is exacerbated by low sun angles during spring and fall seasons. During the polar night, there may be little contrast between cloud and surface temperatures. In addition, this is often complicated by one or more temperature inversions in an atmospheric column that may or may not contain clouds.
Modern radiometers like MODIS and VIIRS contain bands that are absorbing in certain NIR wavelengths such as 1.6 and 2.1 µm (see Table 1). These bands report low reflectance over clear sky snow and ice surfaces while water clouds are very bright, creating a good radiance contrast between clear and cloudy skies during daylight hours. Thus, reasonably accurate cloud detection may be accomplished between low-level water clouds and clear skies (see the polar day category in Table 3). There is still some ambiguity, however, in detecting mixed or ice phase clouds when there is little thermal contrast. Polar night conditions present the most challenging conditions for cloudy vs. clear sky discrimination using passive observations (see polar night category in Table 3).
Nevertheless, we present Arctic day and nighttime series results in this section, comparing MYD35, MVCM Aqua MODIS and MVCM SNPP VIIRS cloud detection results. In panels a and b of Figure 5, cloud fractions for day and night, respectively, are shown along with Aqua MODIS minus.
SNPP VIIRS cloud fraction differences in Panels (c) and (d). The time series runs from March 2012 to December 2018 and covers the region 60–90N latitude. The MYD35 data (gray color) display higher cloud amounts detected during both day and night. In the daytime, this is explained by the more conservative snow detection algorithm in MYD35 than is found in the MVCM. Less snow detected leads to more cloud found in the MYD35. The MVCM uses the same NDSI algorithm as MYD35 but adds the Klein et al. [20] algorithm that allows more accurate snow mapping over vegetated surfaces (see Section 2). At night, the MYD35 has the use of several water vapor absorption bands that aid in the detection of clear skies (6.7, 7.3, and 13.3 µm, see Table 2). Both day and night show a slight upward movement in cloud fraction over this period. Panels c and d of Figure 5 show differences between the MVCM MODIS minus the VIIRS cloud fractions. The solid red lines (scale on RHS) of these plots show the maximum latitude of daytime (Panel a) and nighttime (Panel b) retrievals. Differences are small (generally 0–3% and −3 to +4%) through the middle of the day and night seasons, respectively, when geographical coverage is large (sampling from 60N–90N). During the spring and fall seasons, when the amount of day or night is reduced (sampling is smaller), differences grow larger. Note the asymmetry between day and night definitions, where day is defined as <= 85° SZA and night is > 85° SZA. The maximum latitude of observations is as low as 61.5N for day and 70.5N for night.

4. Discussion

One of the greatest resources in the arena of automated cloud detection from satellite imagers is the availability of global polar-orbiter lidar cloud data from CALIOP. Collocated CALIOP and Aqua MODIS cloud detection data was relied on heavily for MYD35 improvements [24] (and consequently Terra MODIS as well) and MVCM Aqua MODIS algorithm development. We also used collocated CALIOP/SNPP VIIRS and CALIOP/NOAA-20 VIIRS for MVCM VIIRS development. In our opinion, CALIOP data offers excellent “ground truth” data appropriate for satellite imager cloud detection validation.
Table 3 shows how we validate the MVCM against CALIOP as well as compare MVCM Aqua MODIS to MYD35 and MVCM VIIRS. While we feel this is a good validation strategy, there are several issues to mention. Until September 2018, both CALIOP and Aqua flew in the A-train constellation of satellites [31]. Since CALIOP is nadir viewing, VZAs between Aqua MODIS and CALIOP are within approximately ±20°. This is not the case for collocated CALIOP and VIIRS data from the SNPP and NOAA-20 satellites since these are not included in the A-Train. This is a possible reason for the consistent decrease in MVCM VIIRS hit rates relative to MVCM Aqua MODIS for global and 60S–60N data.
Both MODIS and VIIRS calibration is maintained and monitored by NASA; however, given the MVCM is designed for climate applications and is sensitive to small differences in calibration, we have implemented calibration offsets that are used to adjust VIIRS reflectances to be consistent with those of MODIS Aqua. A detailed description of the methodology is provided in [25]. See also Section 2.3 of the User Guide for the Climate Data Record Continuity Level-2 Cloud Top and Optical Properties Product (CLDPR tOP) [32]. Bands M5 and M7 are particularly important for the stability of cloud detection in the MVCM. VIIRS bands M5 (0.67 µm), M7 (0.87 µm), M8 (1.24 µm), M10 (1.61 µm), and M11 (2.25 µm) are monitored. The ASIPS has implemented the software developed for [25] to monitor the relative radiometry on a monthly basis. Should drifts occur that have impacts on MODIS-VIIRS cloud data record continuity, it is expected that adjustments to the above calibration offsets (biases) will be applied, though an exact approach for this is still under consideration [33]. Once appropriate bias values have been developed and verified, the impacted portion of the time series of MVCM output will be reprocessed. In the current version of the MVCM (1.1) these calibration offsets are fixed and provided as metadata in the product netcdf4 file. An example of the need for time-monitoring of these offsets is seen in Figure 3c. The biases used in the current MVCM are based on MODIS and VIIRS radiance data taken from March 2012 to March 2018 [33]. However, the offsets for M5 and M7 changed rapidly after 2016 [33] rendering the averages inappropriate after that time and the retrieved VIIRS cloud fractions began to differ from those of Aqua MODIS.
The MODIS cloud mask and MVCM are thresholding cloud detection algorithms. Each instrument has its own set of thresholds, allowing for differences in the spectral position and spectral responses, that are manually generated and fine-tuned by an expert analyst. However, the setting of thresholds is still largely subjective even when “ground truth” (e.g., CALIOP cloud data) is used to generate initial thresholds because weights or “confidences” must be assigned to a range of possible clear vs. cloudy boundary reflectances or brightness temperatures [12]. Along with the calibration challenges mentioned above, this is another possible source of reduced MVCM VIIRS hit rates. We have had approximately 20 years of MODIS cloud masking and threshold-setting experience but less than half that for VIIRS thus far. Teasing out the exact cause(s) of the discrepancy has not been accomplished and is a task for the future.
Panel (a) of Figure 4 illustrates threshold-related problems inherent with use of the 1.38 µm band for quantitative work. For example, consistent cloud detection using this test across land–water boundaries is very difficult in an automated system. The MVCM necessarily uses separate 1.38 µm reflectance thresholds for each. The MVCM also makes use of total precipitable water estimates taken from GDAS (Global Data Assimilation System) [34] forecast model output to remove certain pixels from the test. The use of a 1.38 µm cloud test in very dry atmospheres above deserts, middle and high latitude wintertime surfaces, ice caps, and other high-altitude regions often results in false cloud reports. The differences in cloud detection between MODIS and VIIRS shown in Figure 4 result from both instrument differences and required variations in cloud test thresholds.
Figure 2c,d show bands of larger MVCM Aqua MODIS minus MVCM SNPP VIIRS CF differences (yellow color). It has not been determined what the cause or causes are for this phenomenon. Several possibilities have been investigated including FOV size relating to cloud morphology changes through the seasons and the seasonal progression of observed solar scattering angles. No firm conclusions have been drawn but some evidence has been found for the latter. This is another task for the future that will eventually lead to more refined VNIR cloud test thresholds.
Figure 2c,d and Figure 5c,d reveal concerns about polar cloud detection consistency. MVCM SNPP VIIRS finds fewer clouds over daytime snow and ice than does MVCM Aqua MODIS in Figure 2, while Figure 5c shows the effect growing rapidly during times of Arctic low sun (sun near horizon but solar zenith angles < 85°). Figure 5d shows MVCM Aqua MODIS vs. MVCM SNPP VIIRS cloud fraction differences going in the opposite direction during Arctic twilight (sun near horizon but solar zenith angles ≥ 85°). These are likely caused by non-optimal threshold settings that will be addressed in future work. As in the early development of the MODIS cloud mask, the MVCM algorithm is a work in progress with thresholds like something of a moving target because of changing relative instrument calibration which will be monitored and adjusted as significant trends are detected.

5. Conclusions

This study compares the quality of the MVCM to the operational Aqua MODIS cloud mask (MYD35) as well as the consistency between the MODIS and VIIRS MVCM cloud detection algorithms. We compared the MYD35, MVCM Aqua MODIS, MVCM SNPP VIIRS, and MVCM NOAA-20 VIIRS cloud detection results to the CALIOP lidar, contrasted global MVCM Aqua MODIS and SNPP VIIRS 1° resolution mapped cloud fractions, showed the time series of MODIS, SNPP and NOAA-20 VIIRS cloud fractions from MVCM processing, compared cloud detection statistics from the MODIS and VIIRS 1.38 µm cirrus detection bands, and interrogated the Arctic cloud fraction data from the four aforementioned data sets. In addition to the maps and time series differences that show generally very good agreement and continuity, comparisons against CALIOP observations show combined clear and cloudy sky hit rates of 88.2%, 87.5%, 86.8%, and 86.8% for MYD35, MVCM Aqua MODIS, MVCM SNPP VIIRS, and MVCM NOAA-20 VIIRS, respectively, for June through August, 2018. For the same months and in the same order for 60S–60N, hit rates were 90.7%, 90.5%, 90.1%, and 90.3%. Percentages for NH winter months are slightly lower due to the increased difficulty of cloud vs. snow and ice discrimination. Calculations of the Student’s T-Test statistic for hit rates against CALIOP cloud detection in global and 60S–60N categories indicate that MVCM SNPP VIIRS and MVCM NOAA-20 VIIRS are statistically similar in both summer and winter seasons. MVCM Aqua MODIS and MVCM SNPP VIIRS in DJF fall into this category as well, along with MVCM Aqua MODIS and MYD35 (operational Aqua MODIS cloud mask) for JJA from 60S–60N. From time series constructed from gridded daily means of 60S–60N cloud fractions, we find the mean day-to-day cloud fraction differences/standard deviations in percent to be 0.68/0.55, 0.94/0.64, −0.20/0.50, and 0.44/0.82 for MVCM Aqua MODIS-MVCM SNPP VIIRS day and night, and MVCM NOAA-20 VIIRS-MVCM SNPP VIIRS day and night, respectively. It is seen that the MODIS and VIIRS 1.38 µm cirrus detection bands perform similarly with MODIS detecting slightly more ice clouds in the middle to high levels of the troposphere and VIIRS detecting more in the upper troposphere above 15 km. In the Arctic, MVCM Aqua MODIS and SNPP VIIRS reported cloud fraction differences of 0–3% during the mid-summer season and −3–4% during mid-winter. The elimination of atmospheric gas absorption bands in the MVCM algorithm have the largest impact during polar night where MYD35 hit rates vs. CALIOP lidar best those from MVCM by 3–5.5%. On the other hand, the algorithm and/or threshold adjustments have resulted in larger hit rates for MVCM in certain scene types: 60S–60N land day, land night, desert day, and desert night (see Table 3).
Several improvements to the MVCM algorithm are planned for the near future. These include, but are not limited to, threshold adjustments to SNPP and NOAA-20 VIIRS cloud tests, especially for snow and ice surfaces, and a determination of the cause(s) of the daytime oceanic cloud fraction differences seen in Figure 2.

Author Contributions

Conceptualization, R.A.F., S.A.A., R.E.H.; methodology, R.A.F., S.A.A., R.E.H.; software, R.A.F., S.D., Z.G.; validation, R.A.F., S.A.A., R.E.H.; formal analysis, R.A.F.; investigation, R.A.F.; resources, S.D., Z.G.; data curation, S.D., Z.G.; writing-original draft preparation, R.A.F.; writing-review and editing, S.A.A., R.E.H.; visualization, R.A.F.; supervision, S.A.A., R.E.H.; project administration, S.A.A., R.E.H.; funding acquisition, S.A.A. All authors have read and agreed to the published version of the manuscript.

Funding

This research was funded by NASA under grant 80NSSC18K1022.

Acknowledgments

The authors would like to acknowledge Kerry Meyer of the Earth Sciences Division of NASA Goddard Space Flight Center for contributing knowledge and expertise regarding VIIRS radiometric adjustment factors (biases) utilized in the MVCM algorithm. We also acknowledge the Atmosphere Science Investigator-led Processing System (ASIPS) at the University of Wisconsin-Madison for providing data processing and storage support. The ASIPS is funded under NASA contract NNG15HZ38C.

Conflicts of Interest

The authors declare no conflict of interest.

References

  1. Ackerman, S.; Platnick, S.; Bhartia, P.; Duncan, B.; L’Ecuyer, T.; Heidinger, A.; Skofronick-Jackson, G.; Loeb, N.; Schmidt, T.; Smith, W. Satellites see the world’s atmosphere. Meteor. Monogr. 2018. [Google Scholar] [CrossRef]
  2. Lehnert, L.; Thies, B.; Bendix, J. A new high spatial low stratus/fog retrieval for the Atacama Desert. Remote Sens. Environ. 2020, 236, 111445–111455. [Google Scholar]
  3. Brun, F.; Dumont, M.; Wagnon, P.; Berthier, E.; Azum, M.; Shea, J.; Sirguey, P.; Rabatel, A.; Ramanathan, A. Seasonal changes in surface albedo of Himalayan glaciers from MODIS data and links with the annual mass balance. Cryosphere 2015, 9, 341–355. [Google Scholar] [CrossRef] [Green Version]
  4. Uddstrom, M.; Gray, W.; Murphy, R.; Oien, N.; Murray, T. A Bayesian cloud mask for sea surface temperature retrieval. J. Atmos. Ocean Tech. 1999, 16, 117–133. [Google Scholar] [CrossRef]
  5. Liu, R.; Liu, Y. Generation of new cloud masks from MODIS land surface reflectance products. Remote Sens. Environ. 2013, 133, 21–37. [Google Scholar]
  6. Minnis, P.; Young, D.; Spangenberg, D.; Heck, P.; Doelling, D.; Trepte, Q.; Chen, Y. Cloud mask for CERES from VIRS on the TRMM satellite. In Proceedings of the ALPS 99 Symposium, Meribel, France, 18–22 January 1999; WK-P-06. pp. 1–4. [Google Scholar]
  7. Frey, R.; Ackerman, S.; Soden, B. Climate parameters from satellite spectral measurements. Part I: Collocated AVHRR and HIRS/2 observations of spectral greenhouse parameter. J. Clim. 1996, 9, 327–344. [Google Scholar] [CrossRef] [Green Version]
  8. Rossow, W.; Walker, A.; Garder, L. Comparison of ISCCP and other cloud amounts. J. Clim. 1993, 6, 2394–2418. [Google Scholar] [CrossRef] [Green Version]
  9. Heidinger, A.; Evan, A.; Foster, M.; Walther, A. A naïve Bayesian cloud-detection scheme derived from CALIPSO and applied within PATMOS-x. J. Clim. Appl. Meteorol. 2012, 51, 1129–1144. [Google Scholar] [CrossRef]
  10. Heidinger, A. Algorithm Theoretical Basis Document: ABI Cloud Mask. NOAA NESDIS Center for Satellite Applications and Research. Ver. 3.0. 2012. Available online: www.goes-r.gov (accessed on 19 August 2020).
  11. Heidinger, A.; Botambekov, D.; Walther, A. A Naïve Bayesian Cloud Mask Delivered to NOAA Enterprise. Ver. 1.2. 2016. Available online: https://www.star.nesdis.noaa.gov/goesr/documents/ATBDs/Enterprise/ATBD_Enterprise_Cloud_Mask_v1.2_Oct2016.pdf (accessed on 24 August 2020).
  12. Ackerman, S.; Strabala, K.; Menzel, W.P.; Frey, R.; Moeller, C.; Gumley, L. Discriminating clear sky from clouds with MODIS. J. Geophys. Res. 1998, 103, 32141–32157. [Google Scholar] [CrossRef]
  13. Ackerman, S.; Frey, R.; Strabala, K.; Liu, K.; Gumley, L.; Baum, B.; Menzel, W.P. Discriminating Clear-Sky from Clouds with MODIS Algorithm Theoretical Basis Document (MOD35). Ver. 6.1. October 2010. Available online: https://atmosphere-imager.gsfc.nasa.gov/sites/default/files/ModAtmo/MOD35_ATBD_Collection6_0.pdf (accessed on 19 August 2020).
  14. Barnes, W.; Pagano, T.; Salomonson, V. Pre-launch characteristics of the Moderate Resolution Imaging Spectroradiometer (MODIS) on EOS AM1. IEEE Trans. Geosci. Remote Sens. 1998, 36, 1088–1100. [Google Scholar]
  15. Oudrari, H.; McIntire, J.; Xiong, X.; Butler, J.; Lee, S.; Lei, N.; Schwarting, T.; Sun, J. Prelaunch radiometric characterization and calibration of the S-NPP VIIRS sensor. IEEE Trans. Geosci. Remote Sens. 2015, 53, 2195–2210. [Google Scholar] [CrossRef]
  16. National Academies of Sciences, Engineering, and Medicine. Continuity of NASA Earth Observations from Space: A Value Framework; The National Academies Press: Washington, DC, USA, 2015. [Google Scholar] [CrossRef]
  17. Liu, Y.; Key, J.; Frey, R.; Ackerman, S.; Menzel, W.P. Nighttime polar cloud detection with MODIS. Remote Sens. Environ. 2004, 92, 181–194. [Google Scholar] [CrossRef]
  18. Gladkova, I.; Grossberg, M.; Borev, G.; Shahriar, F. A multiband statistical restoration of the aqua MODIS 1.6 micron band. In Proceedings of the SPIE, Algorithms and Technologies for Multispectral, Hyperspectral, and Ultraspectral Imagery XVII, Orlando, FL, USA, 20 May 2011; Volume 8048. [Google Scholar]
  19. Chen, S.; Zhang, T. An improved cloud masking algorithm for MODIS ocean colour data processing. Remote Sens. Lett. 2015, 6, 218–227. [Google Scholar] [CrossRef]
  20. Klein, A.; Hall, D.; Riggs, G. Improving snow cover mapping in forests through the use of a canopy reflectance model. Hydrol. Process. 1998, 12, 1723–1744. [Google Scholar]
  21. Winker, D.; Vaughan, M.; Hunt, B. The CALIPSO mission and initial results from CALIOP. In Proceedings of the SPIE 6409, Lidar Remote Sensing for Environmental Monitoring VII, Goa, India, 13–17 November 2006. [Google Scholar] [CrossRef]
  22. Winker, D.; Vaughan, M.; Omar, A.; Hu, Y.; Powell, K.; Liu, Z.; Hunt, W.; Young, S. Overview of the CALIPSO mission and CALIOP data processing algorithms. J. Atmos. Oceanic Technol. 2009, 26, 2310–2323. [Google Scholar] [CrossRef]
  23. Atmosphere SIPS. Available online: https://earthdata.nasa.gov/eosdis/sips/atmosphere-sips (accessed on 9 June 2020).
  24. Holz, R.; Ackerman, A.; Nagle, F.; Frey, R.; Dutcher, S.; Kuehn, R.; Vaughan, M.; Baum, B. Global moderate resolution imaging spectroradiometer (MODIS) cloud detection and height evaluation using CALIOP. J. Geophys. Res. 2008, 113. [Google Scholar] [CrossRef] [Green Version]
  25. Meyer, K.; Platnick, S.; Holz, R.; Dutcher, S.; Quinn, G.; Nagle, F. Derivation of shortwave radiometric adjustments for SNPP and NOAA-20 VIIRS for the NASA MODIS-VIIRS continuity cloud products. Remote Sens. 2020, in press. [Google Scholar]
  26. Xie, L.; Zhao, F.; Chen, L.; Zhang, R.; Mao, K.; Kylling, A.; Ma, Y. Performance comparison of the MODIS and the VIIRS 1.38 µm cirrus cloud channels using libRadtran and CALIOP data. Remote Sens. Environ. 2018, 206, 363–374. [Google Scholar] [CrossRef]
  27. Wolfe, R.; Lin, G.; Nishihama, M.; Tewari, K.; Tilton, J.; Isaacman, A. Suomi NPP VIIRS prelaunch and on-orbit geometric calibration and characterization. J. Geophys. Res. 2013, 118, 11508–11521. [Google Scholar] [CrossRef] [Green Version]
  28. Wyser, K.; Jones, C.; Du, P.; Girard, E.; Willén, U.; Cassano, J.; Christensen, J.H.; Curry, J.A.; Dethloff, K.; Haugen, J.-E.; et al. An evaluation of Arctic cloud and radiation processes during the SHEBA year: Simulation results from eight Arctic regional climate models. Clim. Dyn. 2008, 30, 203–223. [Google Scholar]
  29. Vavrus, S.; Holland, M.; Bailey, D. Changes in Arctic clouds during intervals of rapid sea ice loss. Clim. Dyn. 2011, 36, 1475–1489. [Google Scholar]
  30. Kay, J.; L’Ecuyer, T. Observational constraints on Arctic Ocean clouds and radiative fluxes during the early 21st century. J. Geophys. Res. 2013, 118, 7219–7236. [Google Scholar]
  31. Stephens, G.L.; Vane, D.G.; Boain, R.J.; Mace, G.G.; Sassen, K.; Wang, Z.; Illingworth, A.J.; O’connor, E.J.; Rossow, W.B.; Durden, S.L.; et al. The CLOUDSAT mission and the A-train: A New Dimension of Space-Based Observations of Clouds and Precipitation. Bull. Amer. Meteor. Soc. 2002, 83, 1771–1790. [Google Scholar] [CrossRef] [Green Version]
  32. Available online: https://ladsweb.modaps.eosdis.nasa.gov/missions-and-measurements/viirs/SNPP_CloudOpticalPropertyContinuityProduct_UserGuide_v1.pdf (accessed on 28 September 2020).
  33. Meyer, K.; Earth Sciences Division, NASA Goddard Space Flight Center, Greenbelt, MD, USA. Personal communication, 2020.
  34. Derber, J.; Parrish, D.; Lord, S. The new global operational analysis system at the national meteorological center. Weather Forecast. 1991, 6, 538–547. [Google Scholar] [CrossRef] [Green Version]
Figure 1. Example MVCM Aqua MODIS output from 04 August, 2019 at 09:15 UTC; (a) MODIS 0.86 µm reflectance; (b) MODIS 1.38 µm reflectance; (c) representation of final output cloud mask; (d) results of the 1.38 µm cloud test; (e) results of the 1.6 µm cloud test; (f) results of the 8.6 µm cloud test.
Remotesensing 12 03334 g001
Figure 2. MVCM cloud fractions (CFs) and differences from January and July 2013–2019; (a) monthly mean daytime MVCM Aqua MODIS CFs for July; (b) monthly mean daytime MVCM SNPP VIIRS CFs for July; (c) daytime July CF differences between MVCM Aqua MODIS and MVCM SNPP VIIRS; (d) daytime January CF differences between MVCM Aqua MODIS and MVCM SNPP VIIRS.
Remotesensing 12 03334 g002
Figure 3. MVCM MODIS and VIIRS time series statistics (60S–60N); (a) daily mean daytime cloud fractions (CFs) for MVCM Aqua MODIS (blue) and MVCM SNPP VIIRS (red); (b) daily mean nighttime CFs for MVCM Aqua MODIS (blue) and MVCM SNPP VIIRS (red); (c) daytime CF differences between MVCM Aqua MODIS and MVCM SNPP VIIRS, (d) nighttime CF differences between MVCM Aqua MODIS and MVCM SNPP VIIRS; (e) daytime CF differences between MVCM SNPP VIIRS and MVCM NOAA-20 VIIRS; (f) nighttime CF differences between MVCM SNPP VIIRS and MVCM NOAA-20 VIIRS.
Remotesensing 12 03334 g003
Figure 4. MVCM 1.38 µm cloud tests vs. CALIOP cloud detection by cloud height; (a) hit rates over water (blue) and land (red) for MVCM Aqua MODIS (solid lines) and MVCM SNPP VIIRS (dotted lines); (b) hit rates for all clouds (blue) and thin clouds (red) where CALIOP cloud optical depth > 0.25 for MVCM Aqua MODIS (solid lines) and MVCM SNPP VIIRS (dotted lines).
Remotesensing 12 03334 g004
Figure 5. Time series of MVCM and MYD35 cloud detection in the Arctic (60N-90N) from the period March 2012–December 2018; (a) daytime cloud fractions (CFs) for MYD35 (gray), MVCM Aqua MODIS (blue) and MVCM SNPP VIIRS (red); (b) nighttime CFs for MYD35 (gray), MVCM Aqua MODIS (blue) and MVCM SNPP VIIRS (red); (c) daytime CF differences between MVCM Aqua MODIS and MVCM SNPP VIIRS (blue lines). Red lines indicate the maximum latitude of daytime CFs recorded (scale on the right); (d) nighttime CF differences between MVCM Aqua MODIS and MVCM SNPP VIIRS (blue lines). Red lines show the maximum latitude of nighttime CFs (scale on the right).
Remotesensing 12 03334 g005
Table 1. Moderate Resolution Imaging Spectroradiometer (MODIS) and Visible Infrared Imaging Radiometer Suite (VIIRS) spectral bands used in the MVCM.
Spectral Bands Used in the MODIS-VIIRS Cloud Mask (MVCM)
MODIS Wavelengths (µm)MODIS BandVIIRS BandPrimary Use
0.4128M1daytime desert cloud detection
0.4439M2sun glint clear sky detection
0.5554M4snow/ice detection
0.6451M5land surface cloud detection
0.8592M7water surface cloud detection
1.245M8turbid water clear sky detection
1.37526M9transmissive cirrus cloud detection
1.646M10snow/ice detection, water surface cloud detection
2.137M11snow/ice detection, water surface cloud detection
3.7520M12land and water surface cloud detection (VIIRS)
3.9621not usedland and water surface cloud detection (MODIS)
8.5529M14water surface ice cloud detection
11.0331M15night land and water surface cloud detection
12.0232M16transmissive cirrus cloud detection
Table 2. Spectral bands and uses in MxD35 that are not part of the MVCM. BT and BTD represent the brightness temperature and brightness temperature difference, respectively.
MODIS Spectral Cloud and Clear Sky Tests Not Found in the MVCM
Wavelengths (µm)MODIS BandUse in MxD35
0.90517Clear sky detection in sun glint conditions (0.905/0.936 µm)
0.93618Clear sky detection in sun glint conditions (0.905/0.936 µm)
6.727Global high cloud BT threshold test; clear sky detection in polar night conditions (6.7–11 µm BTD)
7.328Nighttime middle cloud detection over land, polar night cloud detection, polar night clear sky detection (7.3–11 µm BTD); nighttime ocean low cloud detection (8.6–7.3 µm BTD)
13.333Clear sky detection in polar night conditions (13.3–11 µm BTD)
13.935Mid-latitude (60S–60N) high cloud BT threshold test
Table 3. Cloud detection hit rates of MYD35 and MVCM compared to the Cloud-Aerosol LIdar with Orthogonal Polarization (CALIOP) lidar.
MYD35 and MVCM vs. CALIOP Cloud Detection
Scene TypeJJA 2018 Hit Rates (%)DJF 2017–2018 Hit Rates (%)
M35MVCMAqua MODISMVCMSNPP VIIRSMVCM NOAA-20 VIIRSM35MVCMAqua MODISMVCMSNPP VIIRSMVCM NOAA-20 VIIRS (JF)
Global88.287.586.886.888.186.686.386.5
60S–60N90.790.590.190.390.189.789.689.5
Global Day91.190.589.389.290.689.989.489.0
Global Night85.684.784.584.685.983.783.684.3
60S–60N Day91.090.690.290.390.890.290.390.0
60S–60N Night90.390.590.090.389.489.288.988.9
60S–60N Water Day91.490.690.490.692.391.091.591.3
60S–60N Water Night90.190.189.689.790.790.690.389.5
60S–60N Land Day90.190.489.789.486.687.886.886.3
60S–60N Land Night90.991.790.891.986.085.385.687.6
60S–60N Desert Day91.091.390.491.085.786.785.584.5
60S–60N Desert Nt90.691.090.491.983.584.185.086.3
Polar Day91.290.387.386.890.289.487.486.3
Polar Night76.973.573.973.779.774.274.676.5
Table 4. Mean and variabilities of day-to-day cloud fraction differences between the MVCM algorithms (Aqua MODIS, SNPP VIIRS, NOAA-20 VIIRS) Bolded values are for entire 60S–60N latitude bands.
Algorithm ComparisonMean Diff. (%)Std. Dev. (%)Time Period
MODIS—SNPP VIIRS 60S–60N Day0.680.552013–2019
MODIS—SNPP VIIRS 60S–60N Night0.940.642013–2019
N20 VIIRS—SNPP VIIRS 60S–60N Day−0.200.502018–2019
N20 VIIRS—SNPP VIIRS 60S–60N Night0.440.822018–2019
MODIS—SNPP VIIRS 0–60N Ocean Day 0.661.282013–2019
MODIS—SNPP VIIRS 0–60N Ocean Night1.280.782013–2019
MODIS—SNPP VIIRS 0–60S Ocean Day1.471.172013–2019
MODIS—SNPP VIIRS 0–60S Ocean Night1.270.572013–2019
MODIS—SNPP VIIRS 0–60N Land Day−0.561.062013–2019
MODIS—SNPP VIIRS 0–60N Land Night−0.441.852013–2019
MODIS—SNPP VIIRS 0–60S Land Day−0.271.782013–2019
MODIS—SNPP VIIRS 0–60S Land Night1.032.152013–2019
N20 VIIRS—SNPP VIIRS 0–60N Ocean Day−0.320.852018–2019
N20 VIIRS—SNPP VIIRS 0–60N Ocean Night0.271.042018–2019
N20 VIIRS—SNPP VIIRS 0–60S Ocean Day−0.240.922018–2019
N20 VIIRS—SNPP VIIRS 0–60S Ocean Night0.220.722018–2019
N20 VIIRS—SNPP VIIRS 0–60N Land Day0.040.812018–2019
N20 VIIRS—SNPP VIIRS 0–60N Land Night1.001.802018–2019
N20 VIIRS—SNPP VIIRS 0–60S Land Day−0.191.582018–2019
N20 VIIRS—SNPP VIIRS 0–60S Land Night0.801.852018–2019
Publisher’s Note: MDPI stays neutral with regard to jurisdictional claims in published maps and institutional affiliations.

