Article

A Robust Algorithm Based on Phase Congruency for Optical and SAR Image Registration in Suburban Areas

1
Changchun Institute of Optics, Fine Mechanics and Physics, Chinese Academy of Sciences, Changchun 130033, China
2
University of Chinese Academy of Sciences, Beijing 100049, China
3
College of Earth Exploration Science and Technology, Jilin University, Changchun 130012, China
*
Author to whom correspondence should be addressed.
Remote Sens. 2020, 12(20), 3339; https://doi.org/10.3390/rs12203339
Submission received: 3 September 2020 / Revised: 30 September 2020 / Accepted: 10 October 2020 / Published: 13 October 2020
(This article belongs to the Special Issue Multi-Sensor Systems and Data Fusion in Remote Sensing)

Abstract

:
Automatic registration of optical and synthetic aperture radar (SAR) images is a challenging task due to the influence of SAR speckle noise and nonlinear radiometric differences. This study proposes a robust algorithm based on phase congruency to register optical and SAR images (ROS-PC). It consists of a uniform Harris feature detection method based on multi-moment of the phase congruency map (UMPC-Harris) and a local feature descriptor based on the histogram of phase congruency orientation on multi-scale max amplitude index maps (HOSMI). The UMPC-Harris detects corners and edge points based on a voting strategy, the multi-moment of phase congruency maps, and an overlapping block strategy, which is used to detect stable and uniformly distributed keypoints. Subsequently, HOSMI is derived for a keypoint by utilizing the histogram of phase congruency orientation on multi-scale max amplitude index maps, which effectively increases the discriminability and robustness of the final descriptor. Finally, experimental results obtained using simulated images show that the UMPC-Harris detector has a superior repeatability rate. The image registration results obtained on test images show that the ROS-PC is robust against SAR speckle noise and nonlinear radiometric differences. The ROS-PC can tolerate some rotational and scale changes.

Graphical Abstract

1. Introduction

The rapid development of sensor technology provided multiple remote sensing images for the observation of the Earth. Optical images ensure facilitated interpretation and are similar to human vision; however, they are affected easily by the weather. The synthetic aperture radar (SAR) is an active microwave imaging system that effectively compensates for the shortcomings of optical imaging systems and operates irrespective of the time of day and weather conditions. Optical and SAR images can be used together to form complementary information, which has important application value, such as image fusion [1,2], pattern recognition [3], and change detection [4,5]. Image registration is a preliminary work of these applications. It refers to aligning two or more images of the same scene acquired by different times, viewpoints, or sensors. Registration accuracy seriously affects these applications. Optical and SAR registration is still a challenging task owing to the speckle noise of SAR and the large radiation differences between optical and SAR images [6,7].
Generally, image registration methods can be roughly divided into two categories—namely, area-based methods and feature-based methods [8]. In area-based methods, which are also known as intensity-based methods, first, a template is defined, and subsequently, the geometric transformation model is estimated by optimizing a similarity measurement between the SAR and optical images, such as mutual information [9,10], normalized cross-correlation [11], and cross-cumulative residual entropy [12]. Area-based methods deliver high accuracy, as the entire intensity information is utilized. However, due to its high computational loads and sensitivity to the geometry and radiation differences, they are limited in their applications of optical and SAR image registration.
Feature-based methods usually first extract features such as points [13], edges [14,15], and contours [16] from input images. Then, a distinctive feature descriptor is designed. Finally, the transformation model is estimated by establishing the corresponding relationship between the features. Feature-based methods are recommended for optical and SAR image registration because they process images with their significant features rather than all intensity information, thereby achieving high precision and robustness to geometry and radiation differences. Feature-based methods are mainly composed of three steps: feature detection, feature description, and feature matching.
The most representative feature-based method is the scale-invariant feature transform (SIFT), owing to its efficient performance and invariance to scale and rotation [17]. Subsequently, a variety of improved methods have been reported. To improve matching efficiency, principal component analysis (PCA) is applied to reduce the dimension of the descriptor [18]. To reduce time, a speeded-up robust feature uses the determinant value of the Hessian matrix to detect feature points and an integral graph to accelerate the operation [19]. Affine SIFT simulates the parameters of affine transformation to achieve full affine invariance and considerably expands the scope of application of image registration [20]. A uniform robust SIFT is proposed to extract uniformly distributed and robust feature points [21]. Adaptive binning SIFT is proposed to increase the particularity and robustness of descriptors [22].
However, speckle noise in SAR images and the intensity difference between optical and SAR images make it difficult to obtain good results when these methods are applied directly to image registration. Numerous scholars have proposed improved methods for optical and SAR image registration. An improved SIFT is realized using optical and SAR satellite image registration by exploring their spatial relationship [23]. An automatic SAR and optical image registration method, from rough to accurate, is proposed with the use of SIFT features [24]. A novel gradient definition, yielding an orientation and a magnitude that is robust to speckle noise, is specifically dedicated to SAR images [25]. Further, to overcome the difference in image intensity between remote image pairs and increase the number of correct correspondences, a new gradient definition and an enhanced feature matching method by combining the position, scale, and orientation of each keypoint are proposed [26]. The gradients in the descriptor are computed by a multiscale Gabor odd filter (GOF)-based ratio operator, and the proposed GOF-based descriptor is formed for the SIFT features [27]. Xiang et al. proposed a robust SIFT-like algorithm (OS-SIFT) to register high-resolution optical and SAR images, in which the consistent gradient magnitudes in the SAR and optical images are computed using a multi-scale ratio of exponentially weighted averages (ROEWA) operator and a multi-scale Sobel operator, respectively [28].
Although numerous methods have achieved improvements in gradient redefinition and descriptor construction when encountering optical and SAR images with large nonlinear radiation differences, the matching performance of feature descriptors based on gradient information is not ideal, and there are still many mismatches. Recently, various registration methods based on phase congruency (PC) information have been widely used in multi-sensor images, because PC has been confirmed as an illumination and contrast invariant measure of the features [29,30,31].
An image descriptor, namely, the histogram of oriented phase (HOP) based on the PC concept and PCA is present, and it is more robust to image scale variations and contrast and illumination changes [32]. Ye et al. proposed a novel feature descriptor named the histogram of oriented phase congruency (HOPC) for multimodal image registration [33]. Further, they proposed a local phase-based invariant feature for remote sensing image matching, which consists of a feature detector called minimum moment of PC (MMPC)-Lap and a feature descriptor called the local HOPC (LHOPC) [34]. Similar to gradients, PC also reflects the significance of the features of local image regions. Chen et al. proposed an optical and SAR image registration method by combining a new Gaussian-Gamma-shaped bi-windows-based gradient operator and the histogram of oriented gradient pattern [35]. To address large geometric differences and speckle noise in SAR images, a novel optical-to-SAR image registration algorithm was proposed using a new structural descriptor [36]. A dense descriptor named the histograms of oriented magnitude and phase congruency was proposed to register multi-sensor images. It is based on the combination of the magnitude and PC information of local regions, and successfully captures the common features of images with nonlinear radiation changes [37]. A novel image registration method, which combines nonlinear diffusion and PC structural descriptors, has been proposed for the registration of SAR and optical images [38]. To overcome nonlinear radiation distortions, Li et al. [39] proposed a radiation invariant feature transform (RIFT) algorithm to register multi-sensor images, including optical and SAR images. The RIFT uses PC instead of image intensity for feature point detection and it proposes a maximum index map (MIM) for feature description. Further, the RIFT not only largely improves the stability of feature detection but also overcomes the limitation of gradient information for feature description.
Although a number of PC-based image registration methods have been proposed in the past few years, there are limitations that cannot be ignored when these methods are applied to optical and SAR image registration with large radiation differences. These limitations are listed below.
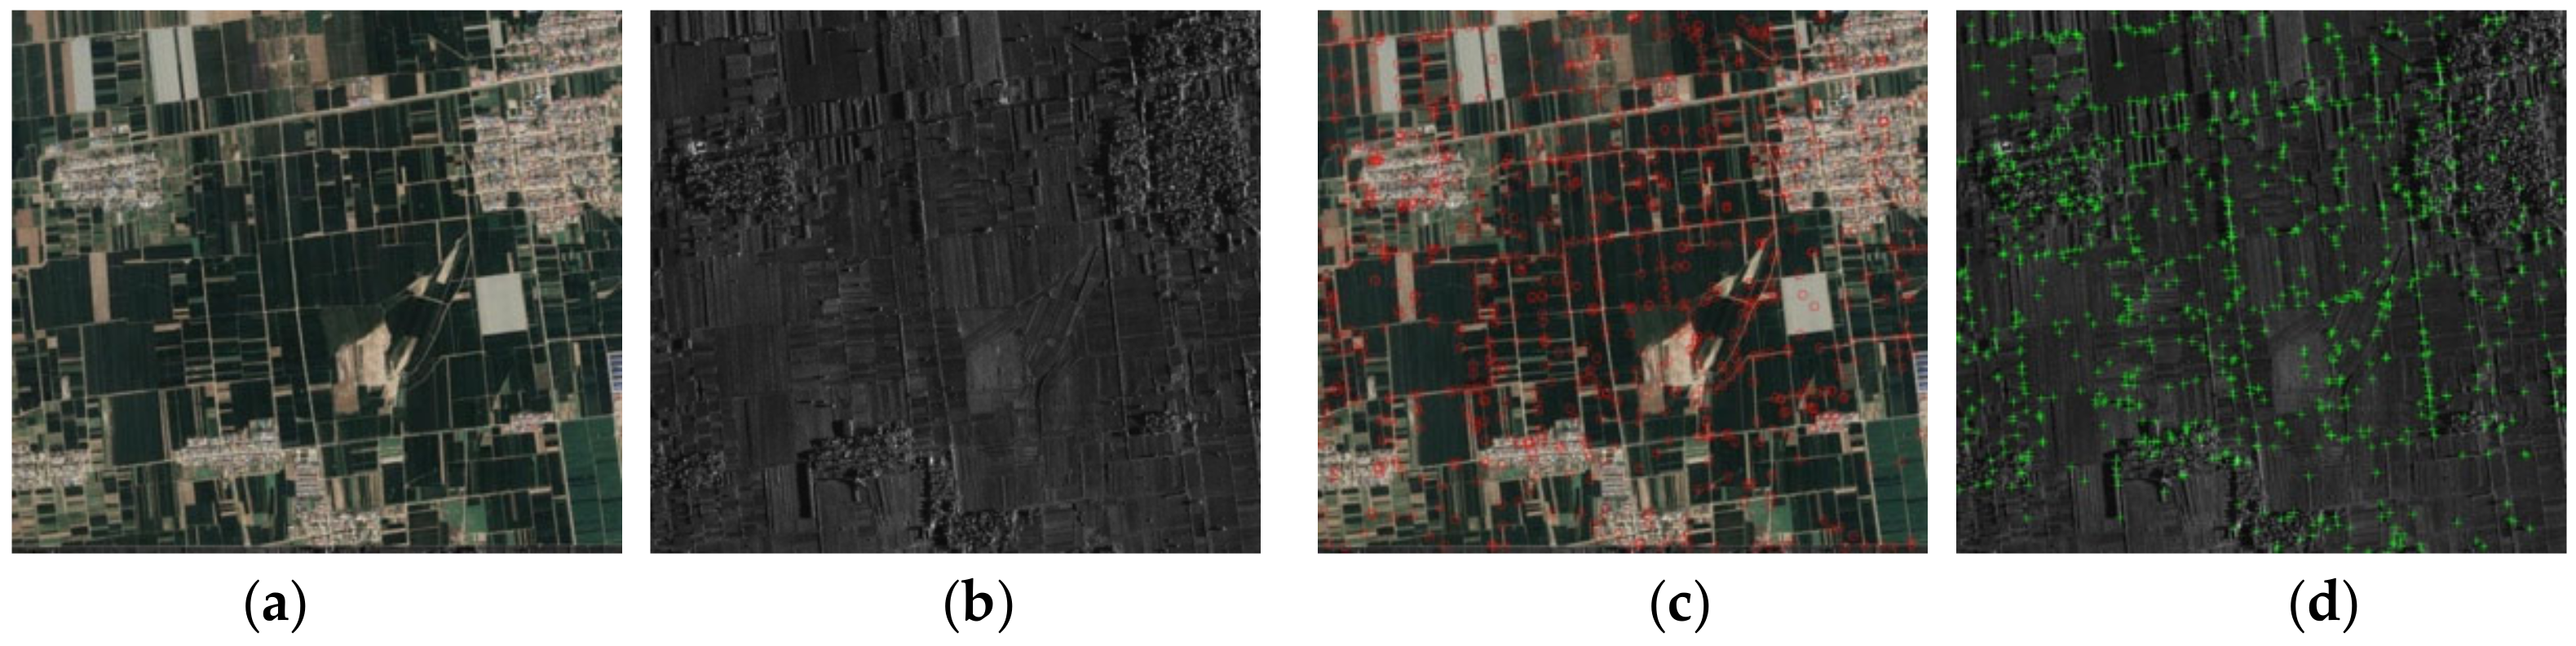
  • Several methods detect keypoints directly from a PC map (PCM) or the moment of the PCM for feature matching. However, because of SAR speckle noise, some unreasonable points are detected in the SAR image; further, because of significant nonlinear intensity differences, the feature detection result of one image generally has no corresponding feature points in the other image. Several classical methods are tested using a pair of optical and SAR images, as shown in Figure 1. These limitations lead to the low repeatability of the feature point, which is not conducive to feature matching.
  • The extracted points are not uniformly distributed. When calculating the PC of a whole image, the noise threshold T is estimated using the Rayleigh distribution mode, which is a fixed value. This leads to a noise threshold larger than the actual noise in the dark region. The feature information is drowned by the noise. As shown in Figure 1, the features are always concentrated in the bright region, especially in the SAR image. The nonuniform distribution of feature points leads to limited registration accuracy on large images or high-contrast images.
  • Because of the different imaging mechanisms for optical and SAR sensors, the acquired images have different expressions for the same objects, thereby resulting in large radiation differences between image pairs. Such nonlinear radiation differences reduce the correlation between corresponding points, which often leads to difficulties in feature description.
In this paper, we address the above limitations by developing a robust optical and SAR image registration method based on PC (ROS-PC). The proposed method mainly contains the following two works.
First, a uniform Harris feature detection method based on multi-moment of the PCM (UMPC-Harris) is proposed. In the UMPC-Harris, we take the corners and edge points as keypoints. The edge structure feature has a high similarity and better resistance to radiation difference between optical and SAR images [30,36,39], thus, extracting feature points on the edge can ensure enough number of features and robustness to radiation difference. Besides, corner features can increase the number of homologous points. Therefore, the multi-moment of the PCM is constructed by using maximum and minimum moment maps. Harris operator is used on the multi-moment to detect corners and edge points. Finally, the overlapping block and voting strategy are introduced to detect uniformly distributed and reliable keypoints.
Second, since PC is not suitable for constructing descriptors directly, the feature descriptor is derived for a keypoint by utilizing the histogram of phase congruency orientation on multi-scale max amplitude index maps (HOSMI). The proposed HOSMI descriptor is utilizing the MIM instead of the PCM because it is more robust to intensity radiation distortions than the PCM [39]. Furthermore, in remote sensing images, many salient features usually appear in different scales [38]. Therefore, we construct the phase congruency orientation maps and max amplitude index maps, respectively. In the local region of each keypoint, the histograms of phase congruency orientation on multi-scale max amplitude index maps are calculated. Finally, the descriptor is constructed by combining the feature vectors of all patched in order. Compared with state-of-the-art, the main contribution of this study can be summarized as follows:
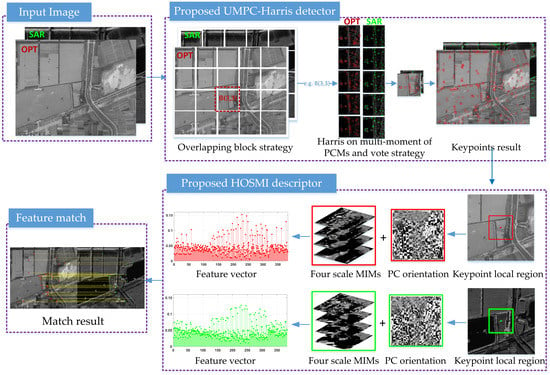
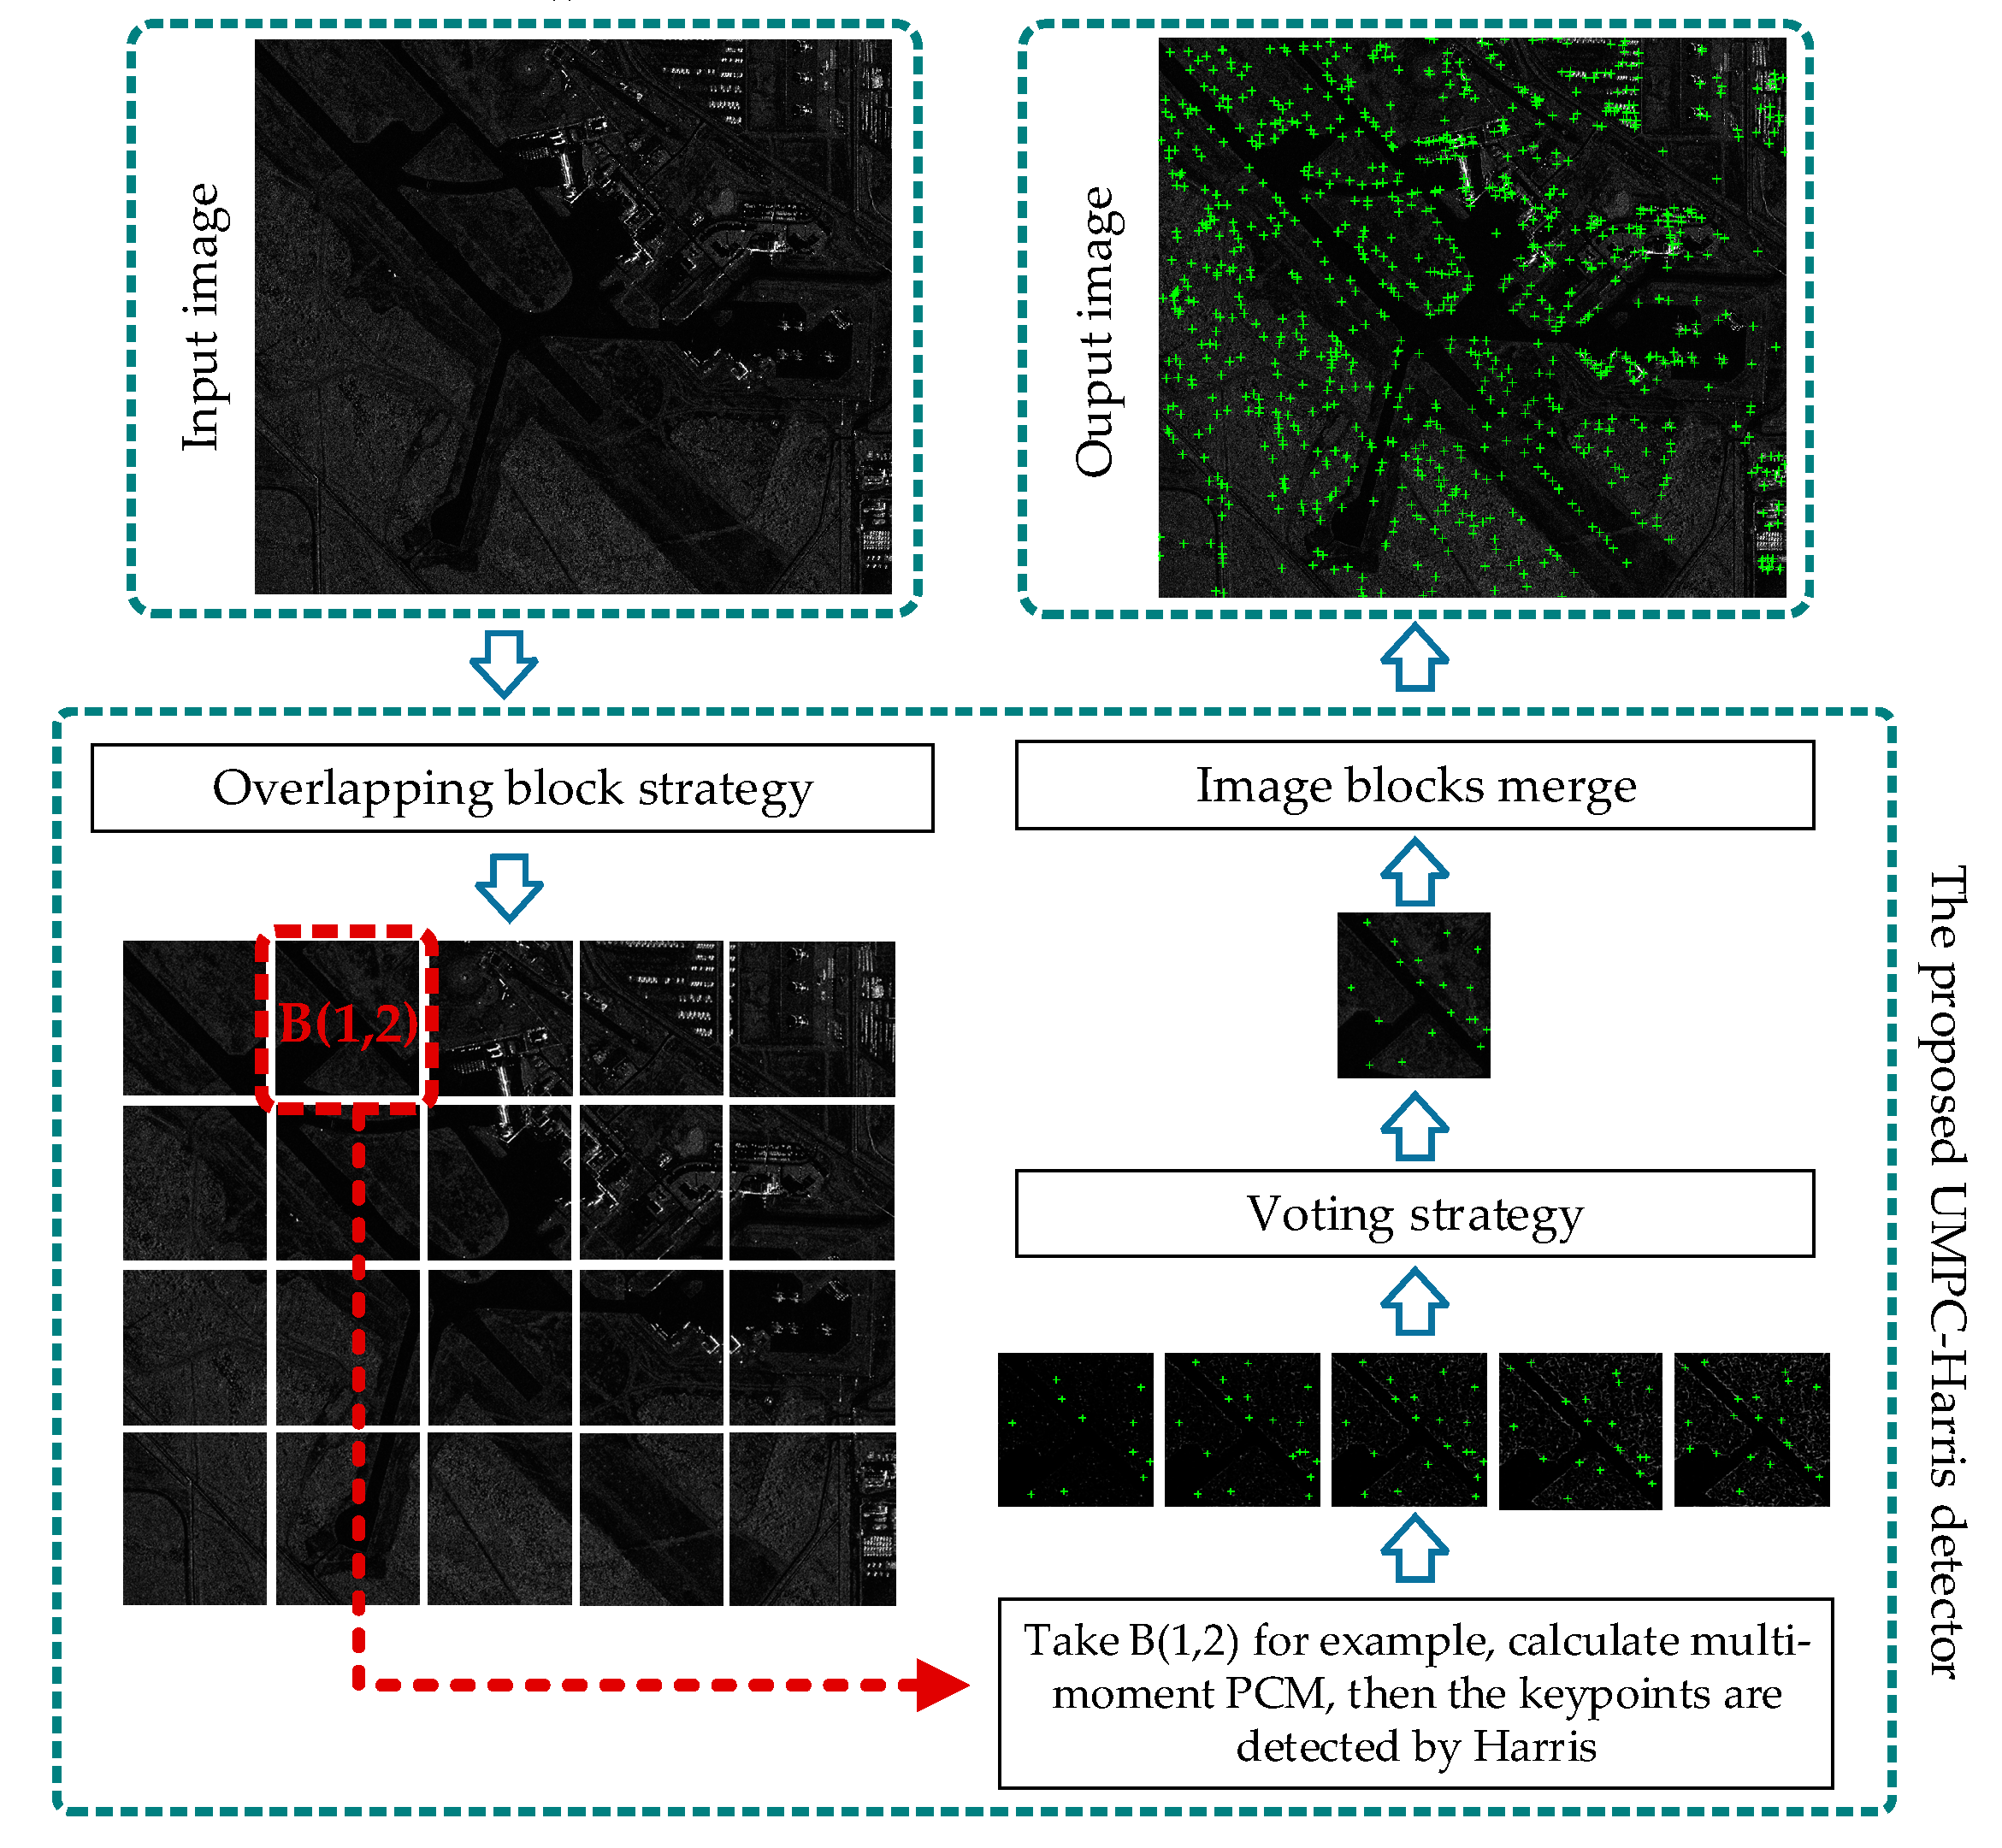
  • The UMPC-Harris feature detection method is proposed based on the multi-moment of the PCM, a voting strategy, and an overlapping block strategy. The detector can obtain enough reliable and uniformly distributed feature points.
  • The HOSMI feature description method is proposed based on the histograms of phase congruency orientation on multi-scale max amplitude index maps. The descriptor is more robust against nonlinear radiation variation and speckle noise.
The rest of this paper is organized as follows: Section 2 starts with a review of PC theory, and followingly introduces the ROS-PC in detail, including the UMPC-Harris feature detector and HOSMI feature descriptor. In Section 3, through several experiments, the repeatability rate of keypoints by UMPC-Harris, the robustness of ROS-PC, and the sensitivity of ROS-PC to scale and rotation changes are evaluated and discussed. Finally, the conclusions are provided in Section 4.

2. Methodology

The PC has been confirmed to be robust to nonlinear radiometric differences, which can capture the common features between multi-sensor images [37,39,40]. The ROS-PC method is based on PC. This section first reviews the PC theory briefly and then presents the design processing of the UMPC-Harris detector and HOSMI descriptor.

2.1. Review of PC Theory

According to Kovesi’s approach, PC can be computed by convolving an image with a log-Gabor filter (LGF) to extract local phase information. The LGF is efficient for detecting features over multiple scales and orientations. In the frequency domain, LGF is defined as:
L G F ω = exp log ω / ω 0 2 2 log κ / ω 0 ,
where ω 0 is the central frequency of the filter, κ is the related-width parameter of the filter that varies with ω 0 , which ensures that κ / ω 0 is a constant.
The filter is transformed from the frequency to the spatial domain using an inverse Fourier transform. In the spatial domain, the 2-D LGF is represented as:
L G F x , y = L G F s , o e v e n x , y + i × L G F s , o o d d x , y .
Considering the coordinates of an input image I ( x , y ) , the convolution responses e s , o ( x , y ) and o s , o ( x , y ) at scale s and orientation o are obtained, and then, the convolution results of even and odd symmetric wavelets form the response arrays as follows:
e s , o x , y , o s , o x , y = I x , y L G F s , o e v e n , I x , y L G F s , o o d d ,
where L G F s , o e v e n and L G F s , o o d d refer to the even-symmetric (cosine) and odd-symmetric (sine) wavelets of the LGF at scale s and orientation o, respectively. Further, e s , o x , y and o s , o x , y are the convolution responses of L G F s , o e v e n and L G F s , o o d d at scale s and orientation o , respectively.
The corresponding amplitude A s , o x , y and phase φ s , o x , y at scale s and orientation o are given by:
A s , o x , y = e s , o x , y 2 + o s , o x , y 2 ,
φ s , o x , y = arctan o s , o x , y ,   e s , o x , y .
Considering the negative effect of image noise, the improved PC (called PC2) and the phase deviation function are, respectively, defined as [41]:
P C 2 = o s W o x , y A s , o x , y Δ φ s , o x , y T o s A s , o x , y + ε ,
Δ φ s , o ( x , y ) = cos ( φ s , o ( x , y ) φ ¯ s , o ( x , y ) ) sin ( φ s , o ( x , y ) φ ¯ s , o ( x , y ) ) ,
where W o x , y is the weighting function, T is the estimated noise threshold, ε is a small constant to prevent division by zero, and φ ¯ s , o ( x , y ) is the mean phase angle. The function denotes that the enclosed quantity is equal to itself when its value is positive, and zero otherwise. P C 2 denotes the PC magnitude map of the input image.
Further, to obtain the information of PC varying with orientation o in the image, phase congruency is calculated independently in each orientation. Thus, serval PCMs according to the orientation angle are obtained [42].
P C 2 = o P C ( θ o ) ,
where θ o denotes the angle corresponding to orientation o , and P C ( θ o ) represents a PCM at orientation angle θ o . The moment of PC is calculated using these intermediate quantities as:
a = o ( P C ( θ o ) cos ( θ o ) ) 2 ,
b = 2 o ( P C ( θ o ) cos ( θ o ) ) ( P C ( θ o ) sin ( θ o ) ) ,
c = o ( P C ( θ o ) sin ( θ o ) ) 2 .
The maximum moment m a x ψ and the minimum moment m i n ψ of PC are defined as:
m a x ψ = 1 2 ( a + c + b 2 + ( a c ) 2 ) ,
m i n ψ = 1 2 ( a + c - b 2 + ( a c ) 2 ) .
The maximum and minimum moments of the PCM represent the edge and corner strength map, respectively.

2.2. The Proposed UMPC-Harris Feature Detector

Keypoints with high repeatability and uniform distribution can obtain sufficient matches, thus improving the image registration accuracy [38]. The subsection presents a novel feature detector UMPC-Harris, which is based on voting strategy, Harris on the multi-moment of PCMs, and overlapping block strategy for the detection of corners and edge points. The purpose of this UMPC-Harris detector is to detect sufficient, reliable, and well-distributed keypoints in optical and SAR images. Figure 2 presents the main process of the UMPC-Harris detector, which contains three steps.
First, the input image is divided into S n × S m blocks. Further, to avoid missing feature information on the block boundary, an overlap region with n o p pixels is added between adjacent blocks. The choice of parameters S n and S m is a tradeoff between the amount of computation and the uniform distribution of the keypoints. When more blocks are divided, the keypoints will become more uniform, while increasing the number of calculations. The size and local complexity of the image should be considered for the selection of S n and S m .
Second, according to the description in Figure 2, we take block (1,2) as an example to illustrate the construction of multi-moment of the PCM. According to the definition of the maximum and minimum moments, the moment of the PCM M k is defined as:
M k = 1 2 a + c + k t 2 b 2 + a c 2 ,
where k t is a variable between −1 and 1. The moment map contains the maximum and minimum moment map, and we can use m a x ψ and m i n ψ to describe the above equation as:
M k = 1 2 m a x ψ + m i n ψ + k t 2 m a x ψ m i n ψ ,
where M k represents the moment of the PCM with parameter k t , and it is obvious that if k t is set to 1 , M k is the minimum moment map M k = m i n ψ , and if k t is set to 1 , M k is the maximum moment map M k = m a x ψ . The number of moments is n , and the step h is 2 n 1 .
Third, the points detected by Harris on the maximum and minimum moments of the PCM represent edge points and corners, respectively. Because the edge feature has a high similarity and better resistance to radiation difference between optical and SAR images, thus, extracting feature points on the edge can ensure enough number of features and robustness to radiation difference. Besides, corner features can increase the number of homologous points. Thus, we combine the corners and edge points as keypoints. However, corner features are sensitive to SAR speckle noise and the repeatability rate of the edge points is poor, and therefore, if all of them are considered as keypoints, there could be some unreasonable keypoints. Therefore, we extract Harris corners on the multi-moment of the PCMs, respectively, and we consider the points appearing many times as the final keypoints. Stable and reliable keypoints are found based on the voting strategy.

2.3. Feature Description

After a set of keypoints are detected by the UMPC-Harris method, feature descriptors need to be designed for each keypoint to achieve image registration. The orientation and maximum amplitude index of PC have been proved suitable for describing the similar local features of multi-sensor images [34,37]. In this subsection, we first introduce the construction process of the multi-scale max index maps and the orientation map of phase congruency. Finally, the HOSMI descriptor is established to increase the distinction of the features.

2.3.1. Multi-Scale Max Index Maps

Max index map is more suitable for multimodal image registration and is more robust to intensity radiation distortions compared to the gradient amplitude map. Furthermore, in remote sensing images, many salient features appear in different scales [38]. Inspired by this, multi-scale MIMs are formed by calculating the index of the maximum amplitude at each scale to improve the significance of descriptors. Figure 3 shows the construction process of the four-scale MIMs.
First, the input image I ( x , y ) is convoluted with LGF to obtain s × o PC amplitude maps in four scales and six orientations. Second, in the six amplitude maps of the same scale, we can find the maximum amplitude m a x { A s , o ( i , j ) } 1 o and the corresponding orientation o , where the superscripts and subscripts indicate orientations ranging from 1 to o for a pixel p with coordinates A s , o ( i , j ) . Third, the coordinate of the pixel p in MIM is represented by the corresponding orientation o . Thus, the MIM is an image with all elements from 1 to o . Finally, multi-scale MIMs are constructed by calculating the index of the maximum amplitude on four scales. Therefore, the information in the fine scale and coarse scale of the input image can be obtained, which can effectively enhance the saliency of features in the image.

2.3.2. Orientation of Phase Congruency

The orientation of PC represents the important directions of feature variation, and it has been proved robust to nonlinear radiation distortions [32]. Therefore, similar to the gradient and gradient orientations in the SIFT algorithm, we need to find orientation information in addition to multiscale MIMs.
The PC is calculated by the odd and even symmetric wavelets of LGF, wherein the odd-symmetric wavelet is a smooth derivative filter, which can compute the image derivative in a single direction [34]. For the calculation of PC, the convolution results of the odd-symmetric are obtained according to six orientations. The six convolution results are projected into x and y axes, respectively, and the projections of the x and y axes are obtained. The orientation of the PC can be calculated by the arctangent functions defined as:
O x = o ( o s , o ( θ o ) cos ( θ o ) ) ,
O y = o ( o s , o ( θ o ) sin ( θ o ) ) ,
O p c = arctan ( O y , O x ) ,
where θ o represents the angle corresponding to the orientation o , and e s , o ( θ o ) is the convolution result of the odd-symmetric in angle θ o . Further, O x and O y are the sum of the projection of the convolution result in the x and y directions, respectively. The PC orientation O p c can be obtained by the arctangent function. Notably, the PC orientation is limited to 0 ° , 180 ° , which can handle gradient inversion in optical and SAR images. Figure 4 shows the calculation process of the PC orientation.

2.3.3. The Proposed HOSMI Feature Descriptor
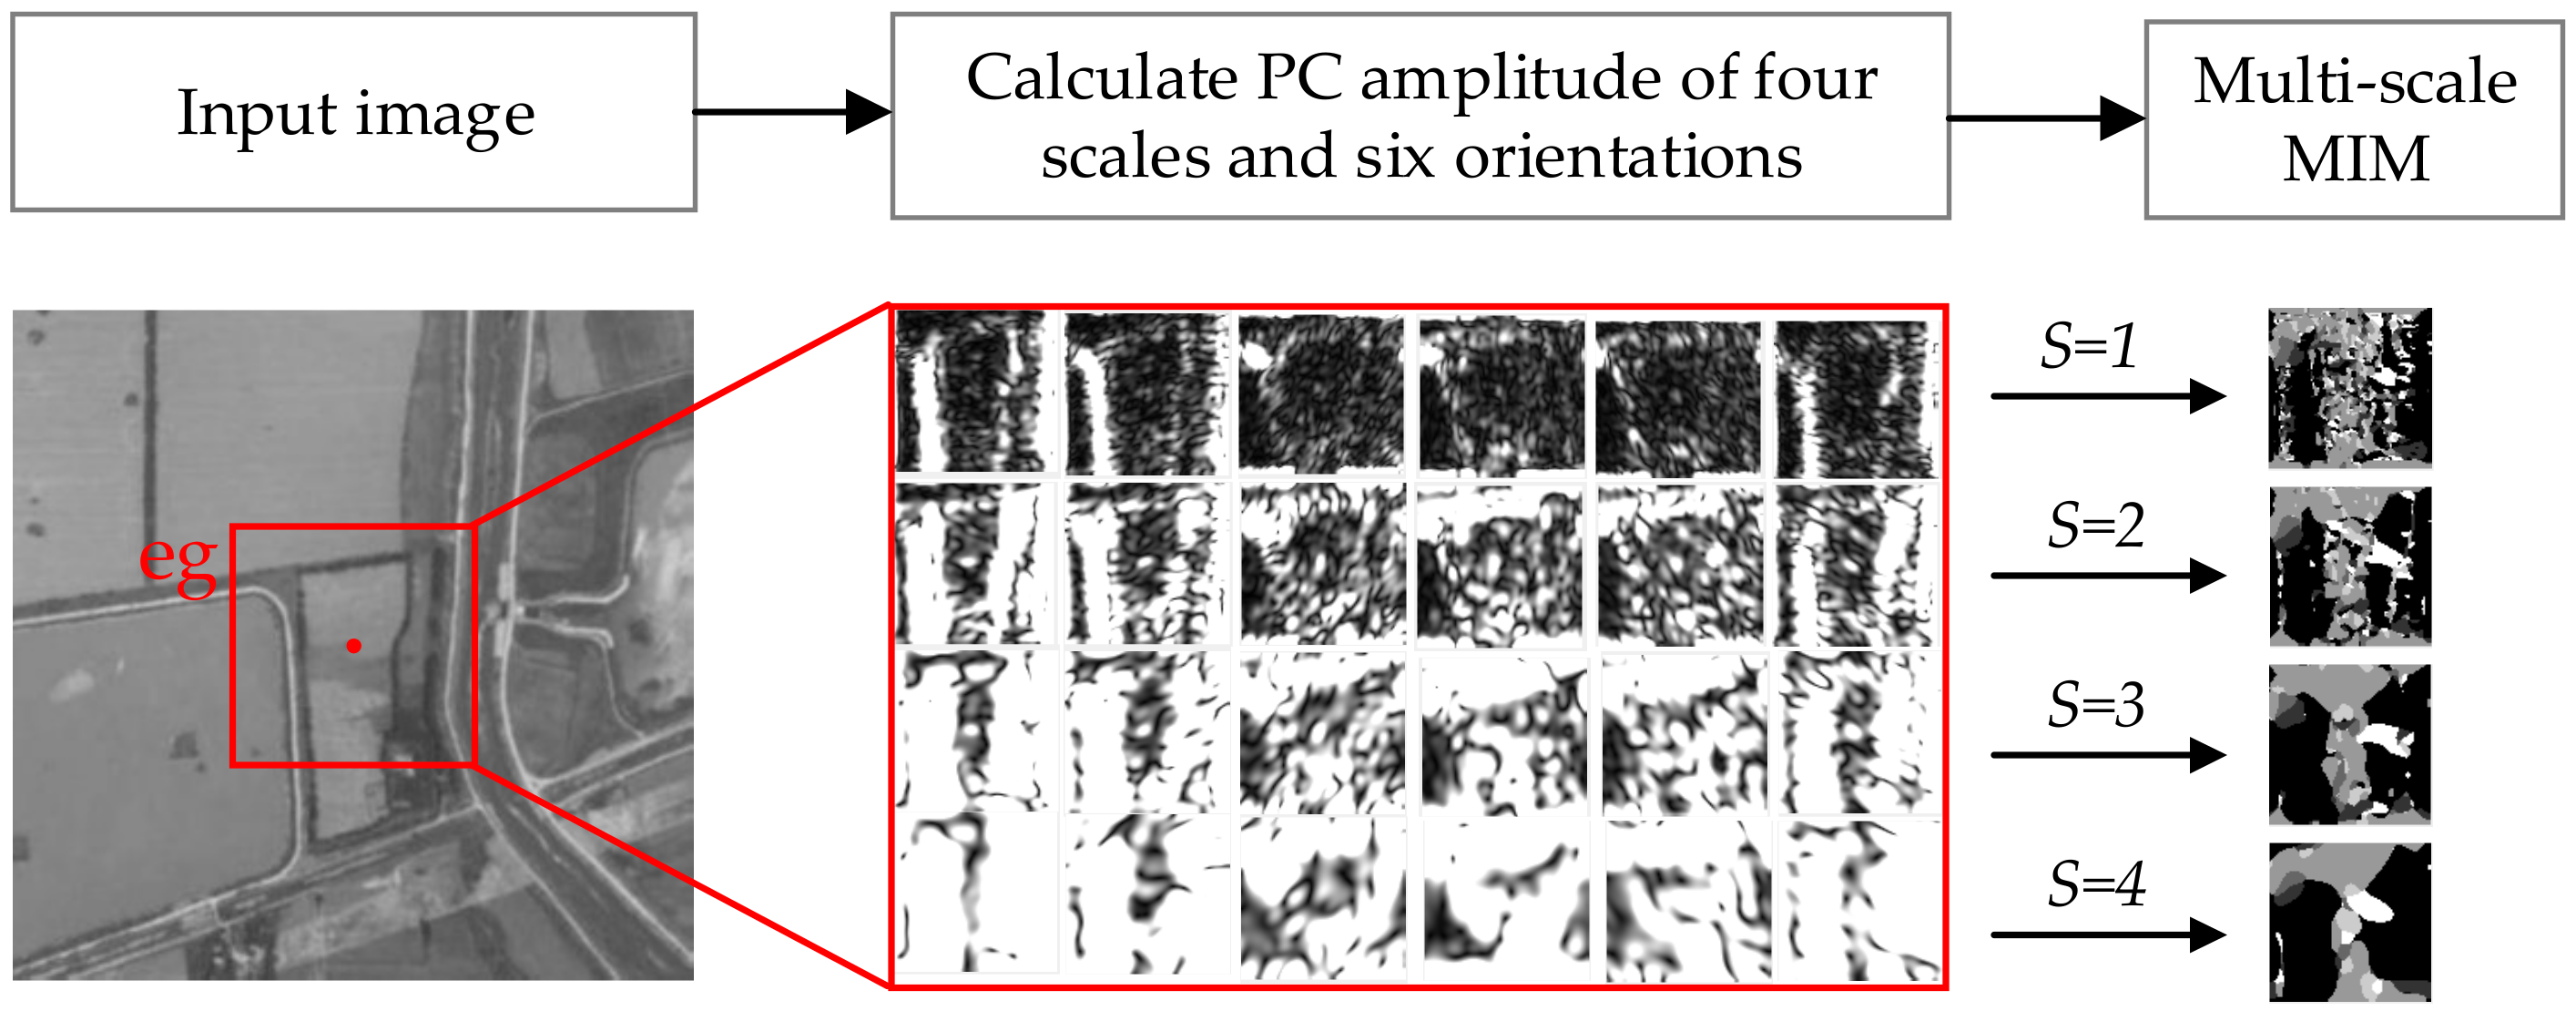
The proposed HOSMI descriptor is constructed using the histograms of the PC orientation on the multi-scale MIM. Figure 5 presents the main processing chain of the proposed HOSMI descriptor.
As shown in Figure 5, HOSMI is calculated based on a grid of patches, where local histograms of PC orientation are formed on each scale MIM. The main steps of the feature descriptor are listed below:
  • Apply the LGF to the local region L x of each keypoint, and then, calculate the odd and even convolution results of four scales and six orientations.
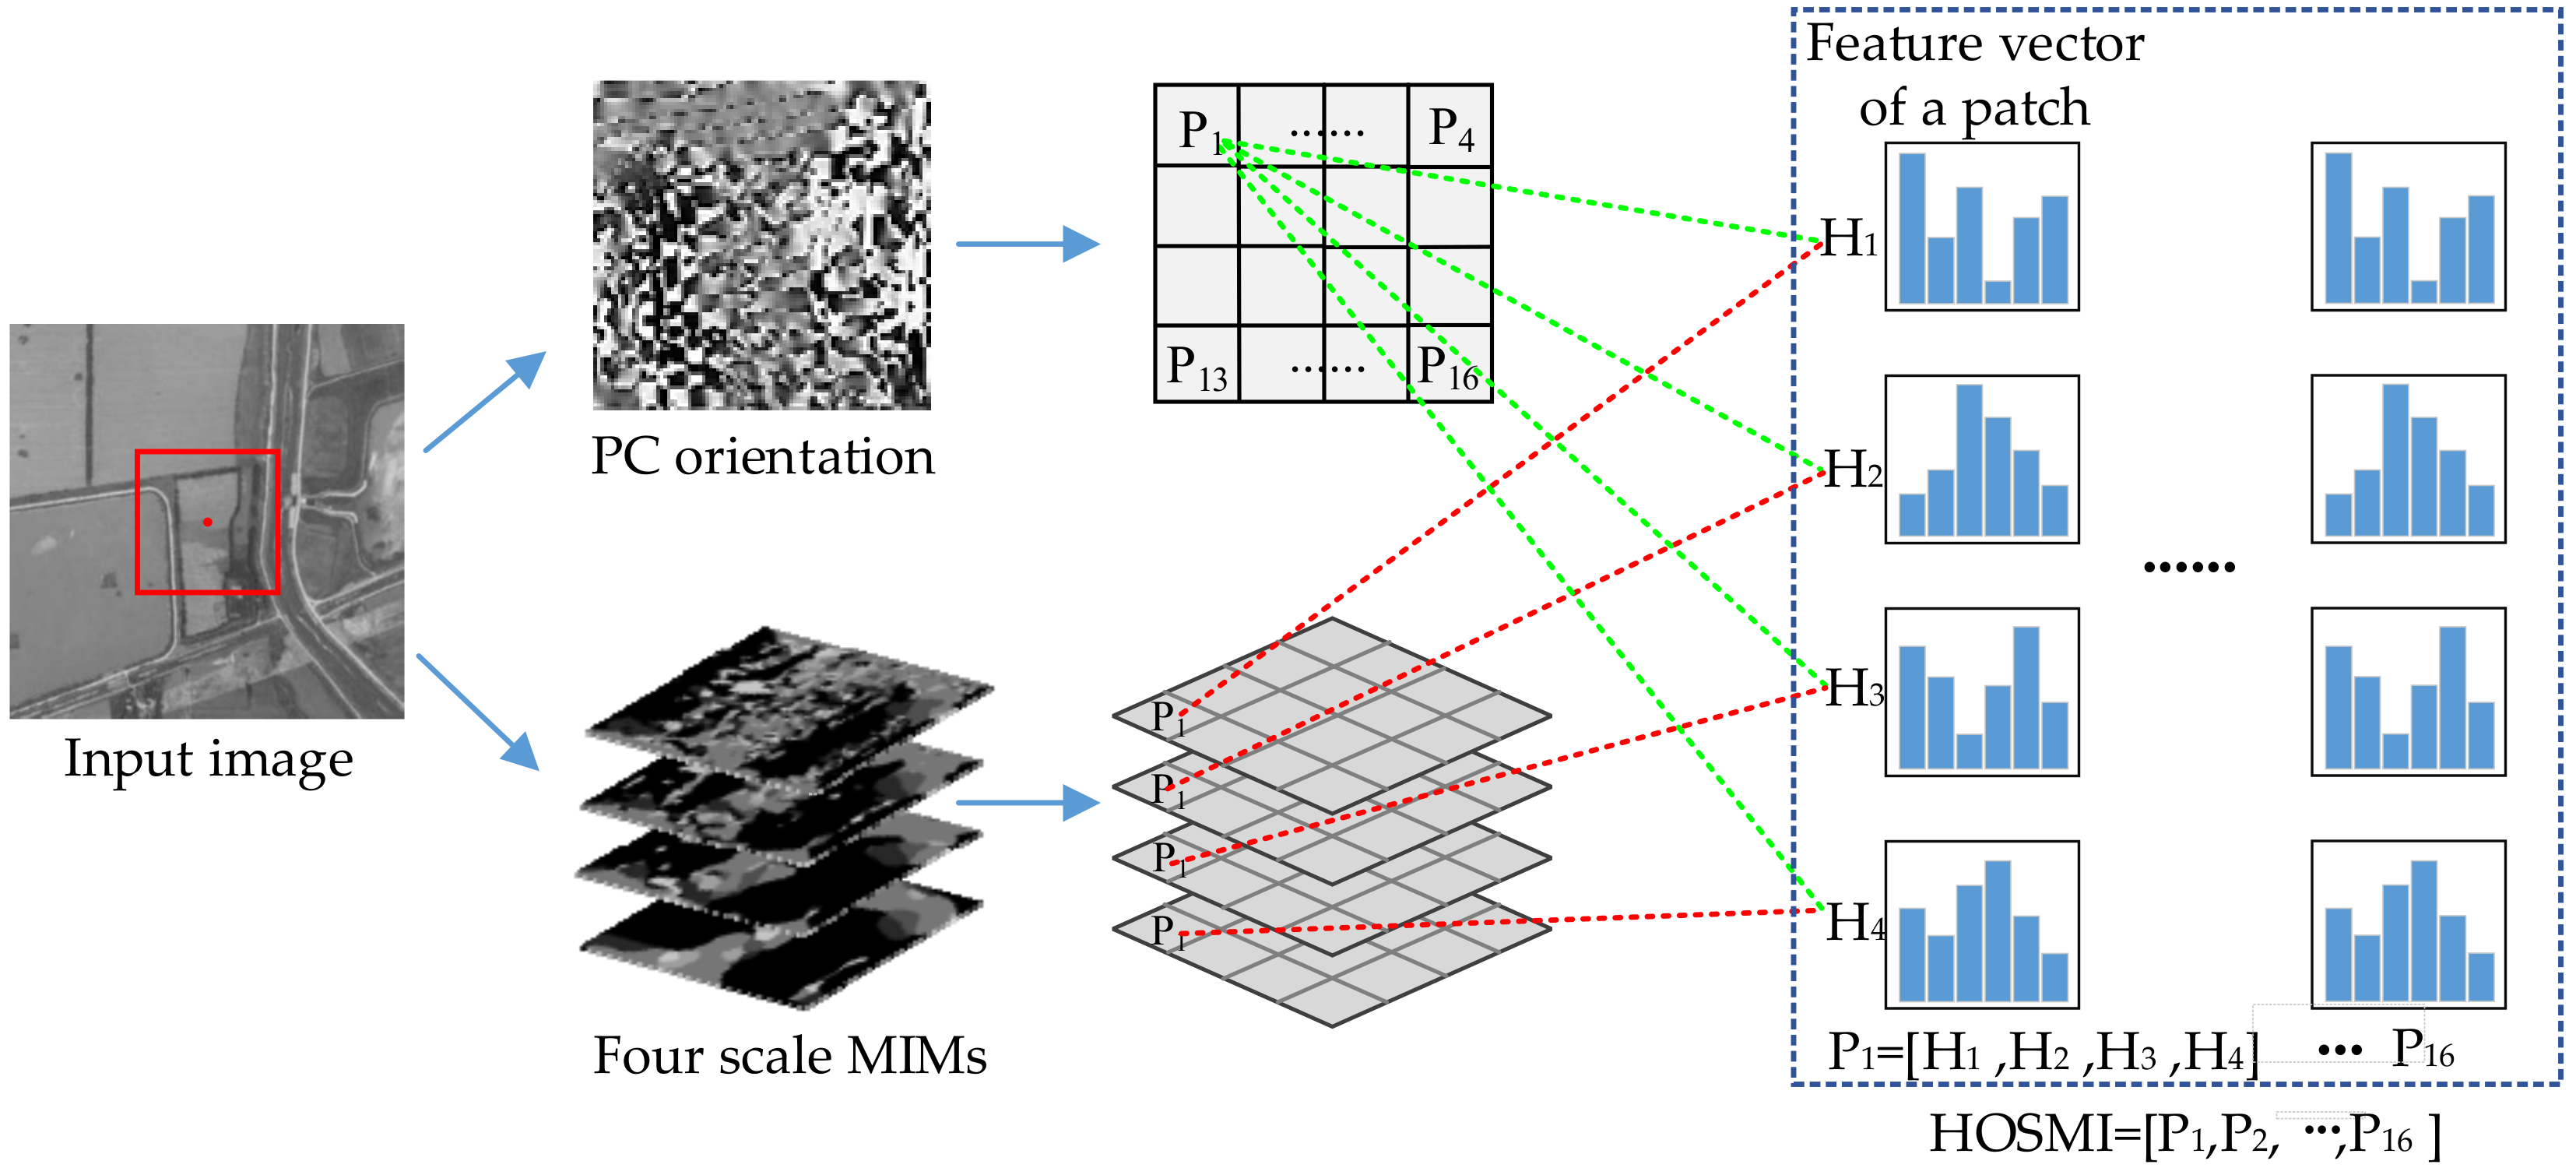
  • Calculate the amplitude map over four scales and six orientations. In each scale, the corresponding orientation to the maximum amplitude forms the multi-scale MIMs; the detailed calculation process is shown in Figure 3.
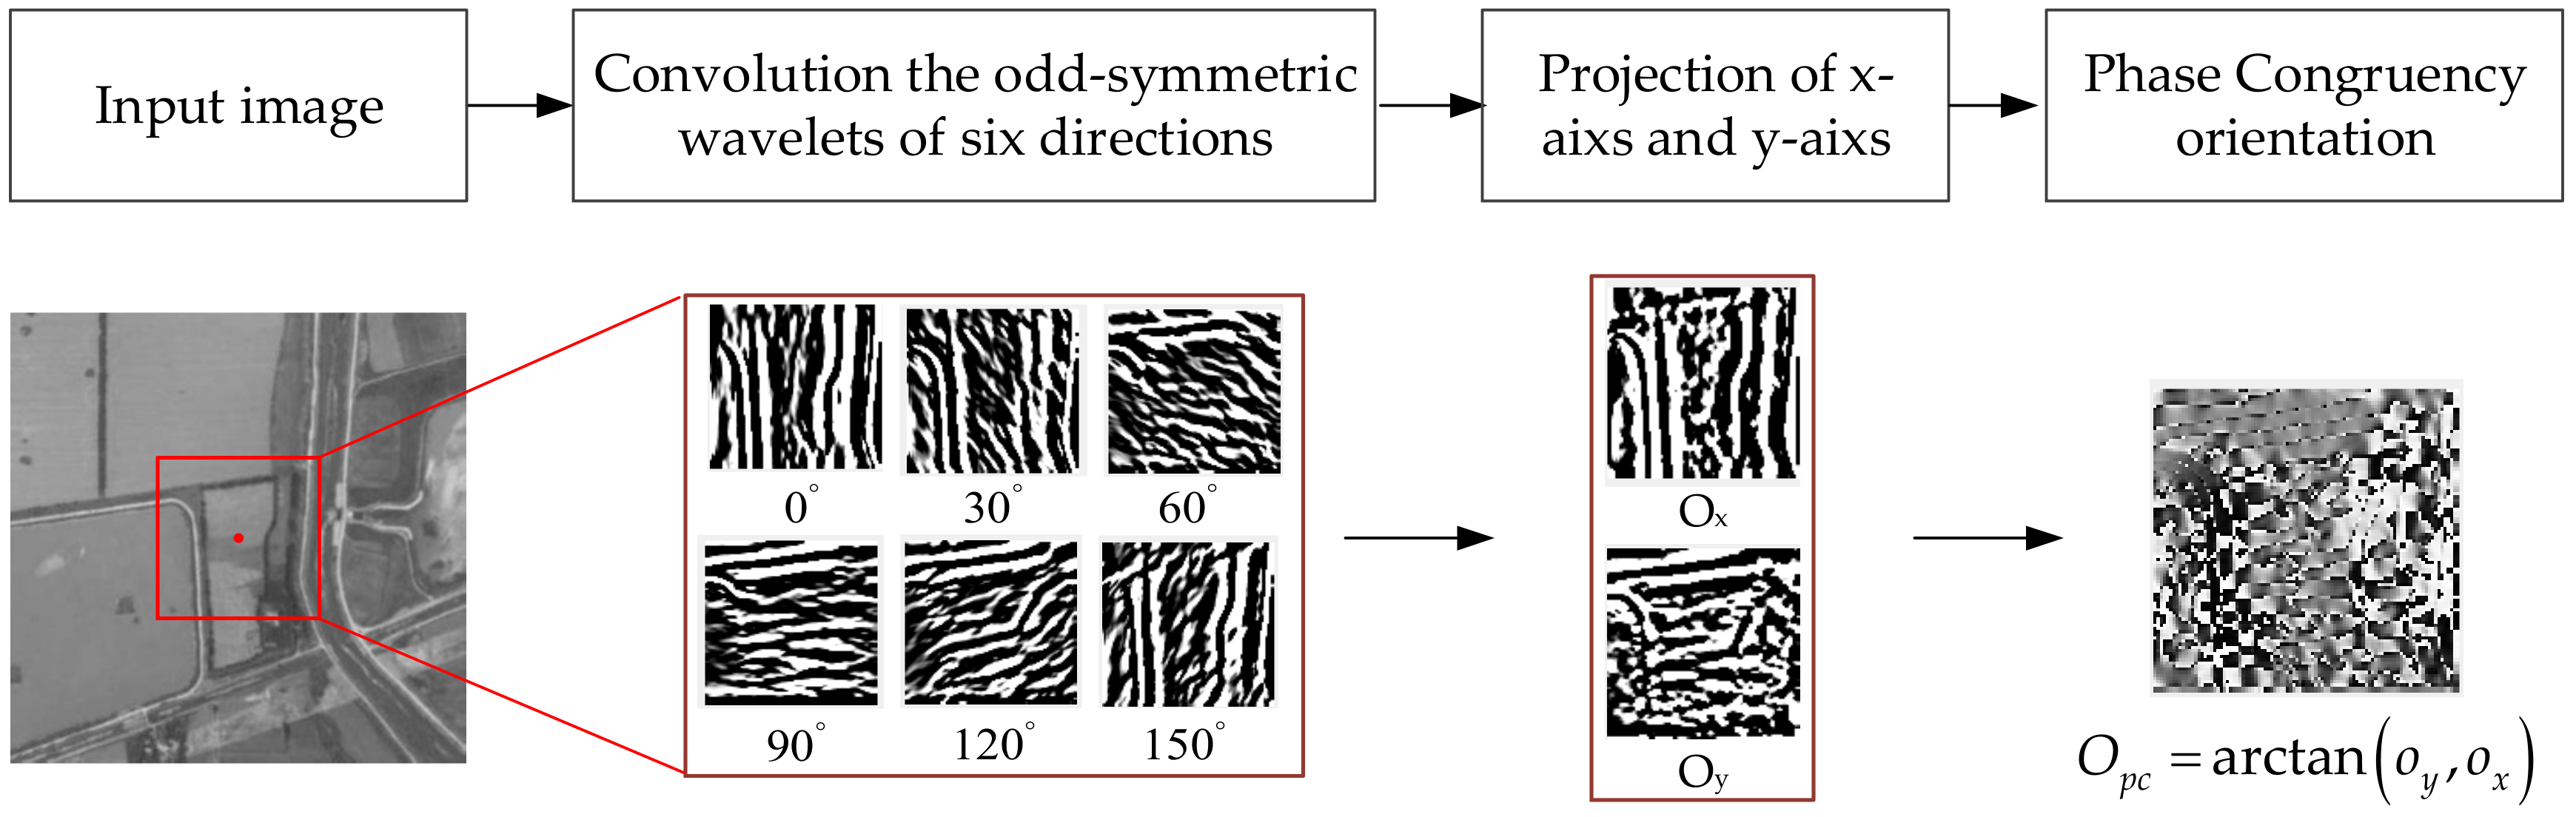
  • Obtain the PC orientation using the odd convolution results; the detailed calculation process is shown in Figure 4. The PC orientation is restricted to an interval 0 ° , 180 ° , which can handle gradient inversion in optical and SAR images, and large intensity differences between the optical and SAR images can be reduced.
  • Divide the PC orientation map and the multi-scale MIMs of each keypoint into n p × n p patches. If the local region L x is selected with a size of m × m pixels, the size of the patch is ( m / n p ) × ( m / n p ) pixels. The feature vector of each patch is calculated in order, and then a descriptor is constructed by combining the feature vectors of all patches.
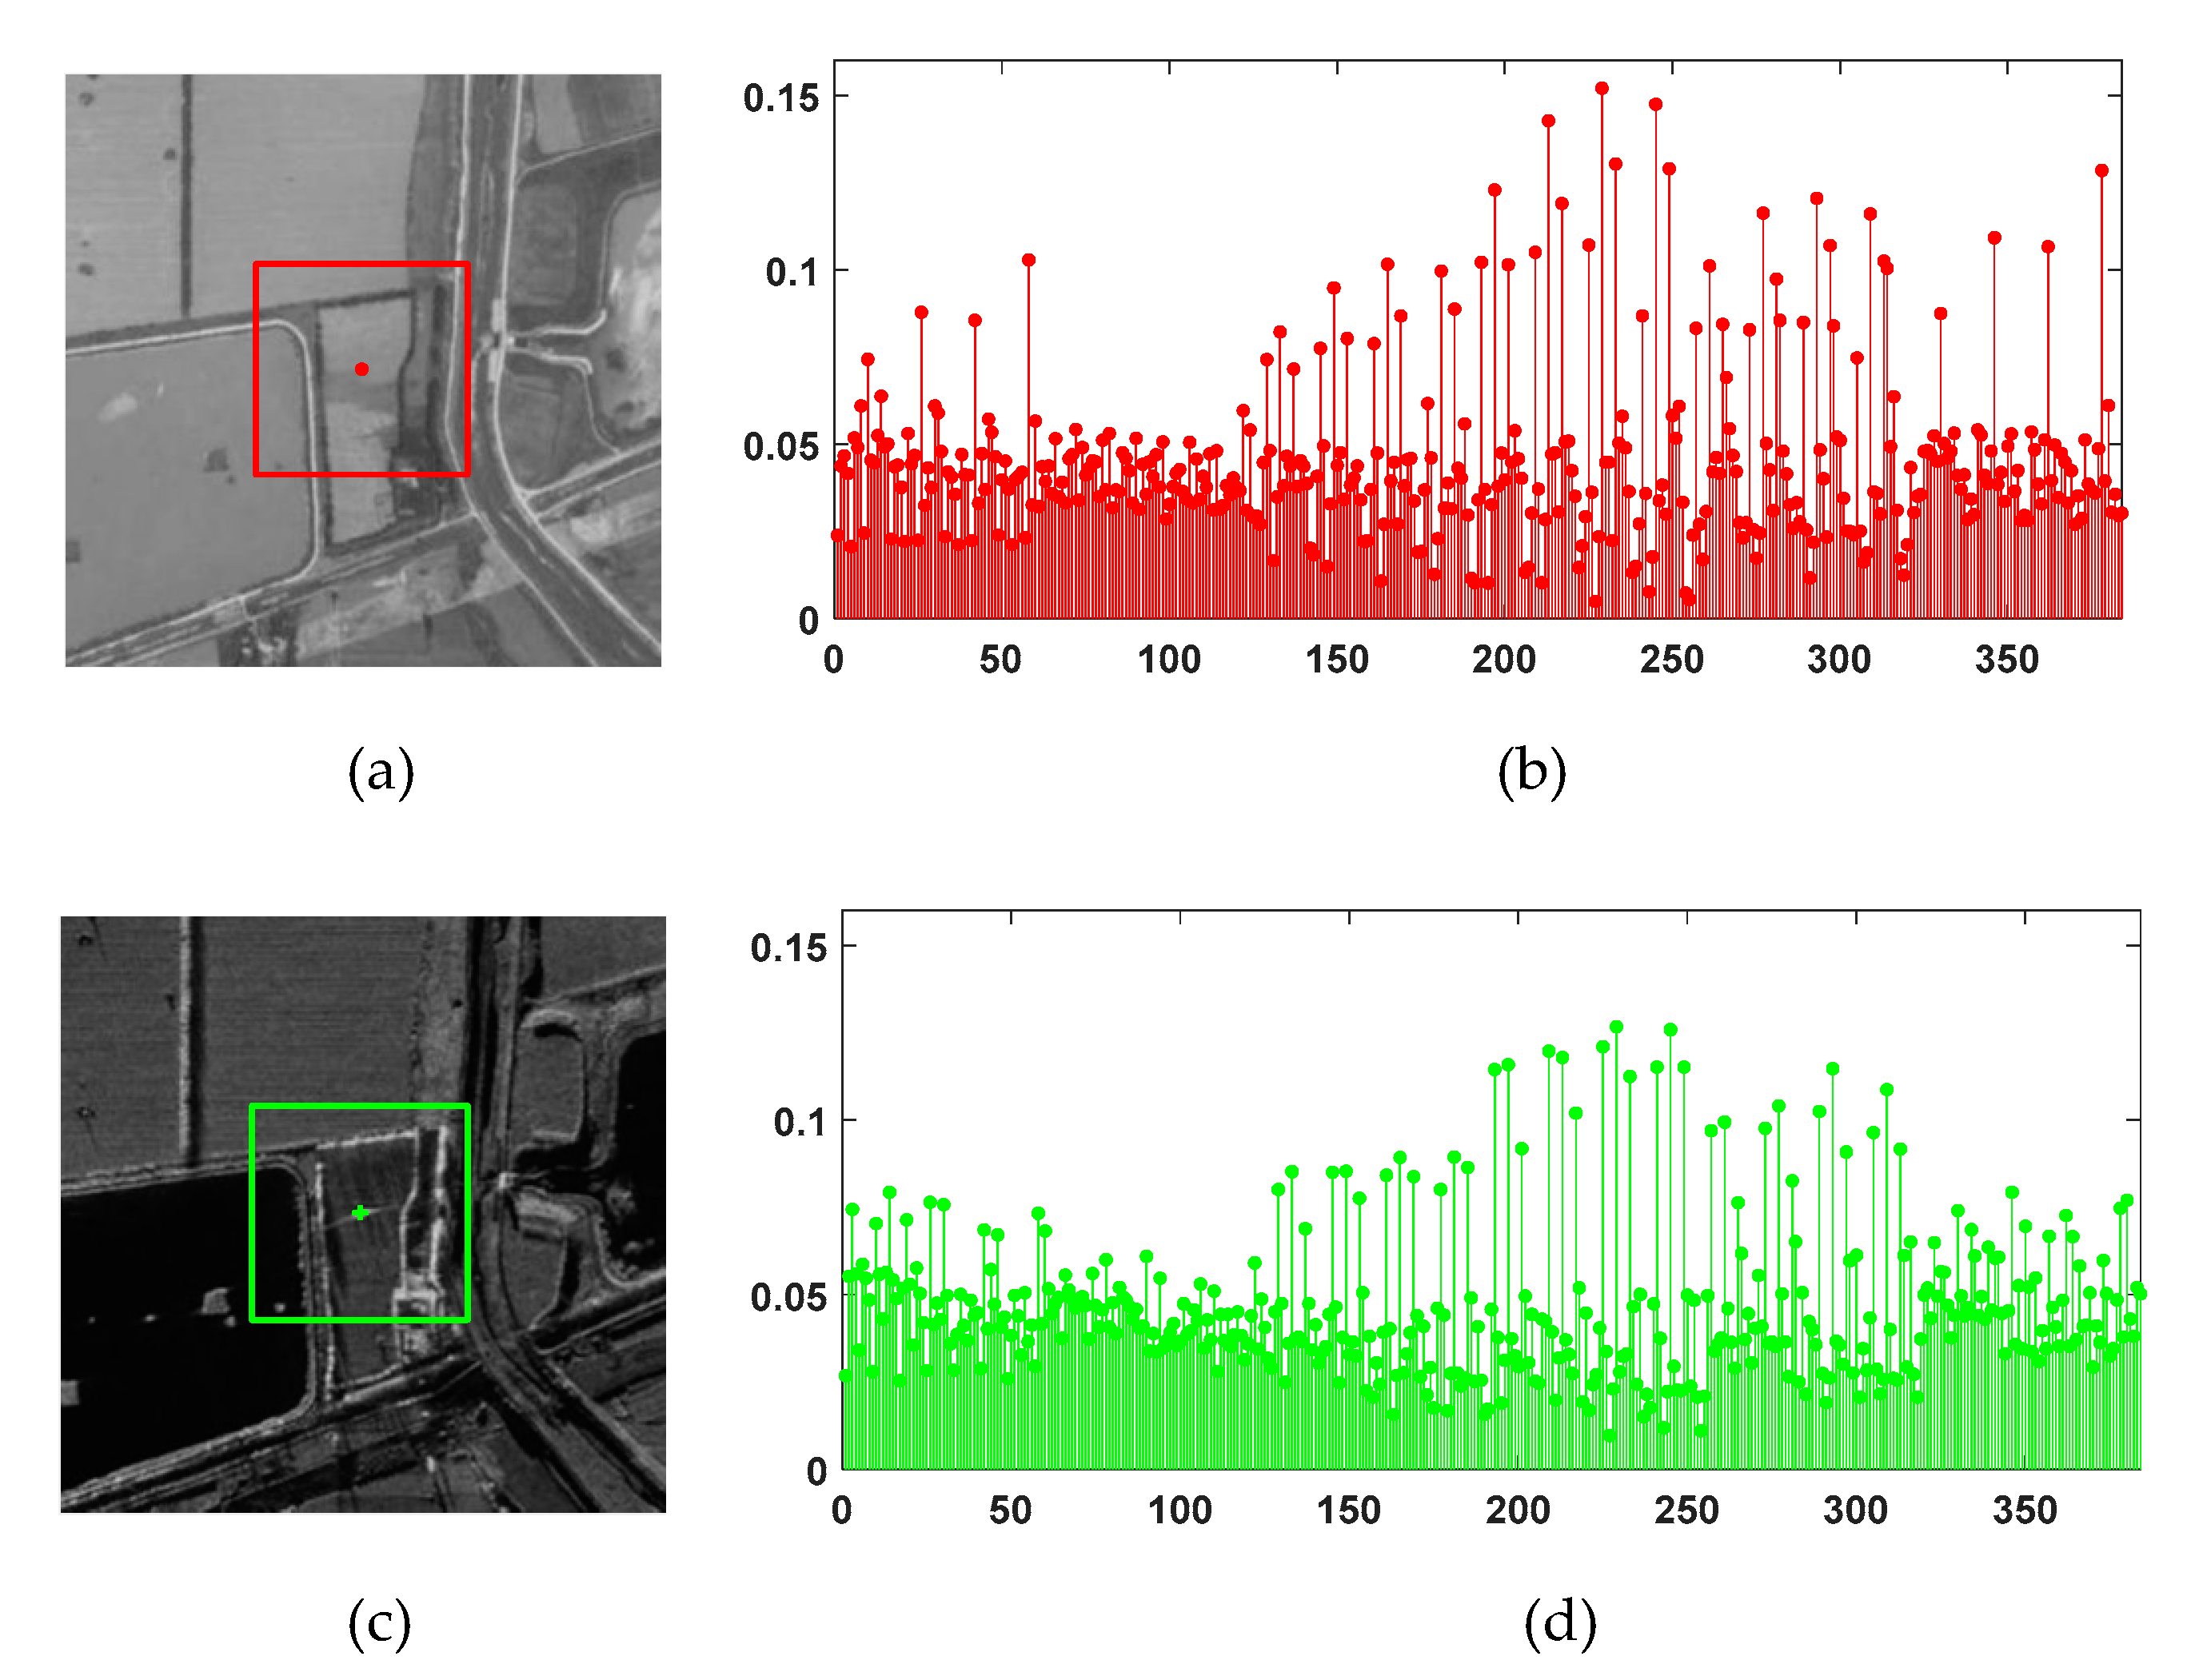
    • To calculate the feature vector of a patch, PC orientation is formed using n o bins covering the 180 degrees range of orientations. The sample added to the histogram is the element of the corresponding location on the MIM. To interpolate the peak position for better accuracy, a parabola is fitted to the three histogram values closest to each peak. The feature vector of patch P is calculated on four scales; therefore, the dimension of the feature vector of a patch is s × n o . In Figure 5, we take the first patch P 1 as an example. The scale used in the PC method is set to 4, and the feature vector of the patch is constructed as P 1 = H 1 , H 2 , H 3 , H 4 , where H 1 ~ H 4 are the histograms of the four scales.
    • To obtain the feature descriptor of a keypoint, the feature vectors of all patches are combined into one feature vector. The feature descriptor is normalized by the L 2 norm to achieve better invariance to illumination and shadowing. The dimension of the feature descriptor of a keypoint is s × n o × n p × n p . As shown in Figure 5, if the local region of a keypoint is divided into 4 × 4 patches, the feature descriptor is constructed by the 16 patches, as in H O S M I = P 1 , P 2 , , P 16 .
  • Construct a local feature descriptor HOSMI for optical and SAR image registration.
A pair of corresponding points in the optical and SAR images are selected to construct descriptors. To verify the similarity of descriptors, we draw descriptors into stem images in Figure 6.
Figure 6 shows the HOSMI descriptors of a pair of keypoints between the optical and SAR images. This pair of optical and SAR images has a strong difference in intensity and in gradient inversion, and there is obvious scattering in the SAR image. These differences introduce great challenges to the robustness of the descriptors. The square region represents the local region (96 × 96 pixels) around the keypoint, which is used for computing the feature descriptor. As shown in Figure 6, the similarity of the feature vector is high and radiation changes have a low effect on the proposed descriptor.

3. Experimental Results and Discussion

In this section, we evaluate the performance of the feature detector on simulated images with different SAR noise levels and radiometric (non-uniform intensity) changes. Then, eight pairs of optical and SAR images are used to test the ROS-PC and analyze the experimental results. The registration performances are evaluated via objective and subjective approaches. One approach is to use the evaluation criteria, and the other is to use a chessboard mosaic image and enlarged submaps. Finally, experiments are conducted to evaluate the tolerance of rotation and scale changes from the ROS-PC method. All experiments were conducted with the MATLAB R2017b software on a computer with an Intel Core i5-7200U CPU and 16.0 GB memory.

3.1. Performance Experiments of Proposed UMPC-Harris Detector

We test the performance of the proposed UMPC-Harris detector on simulated images with different noise levels and radiometric (non-uniform intensity) changes. The UMPC-Harris is compared to three other state-of-the-art detectors, Harris, SAR-Harris, and m+M-Harris.

3.1.1. Evaluation Criteria of Feature Detector

Repeatability rate: Given a pair of simulated optical and SAR images to be registered, the keypoints are detected on the two images. Further, two points are regarded as a pair of corresponding keypoints, only if their coordinates are satisfied:
p s o ( x , y ) p s s ( x , y ) 2 T ,
where p s o ( x , y ) and p s s ( x , y ) denote the coordinates of the corresponding keypoints in the simulated optical and SAR images, respectively. The function 2 denotes the Euclidean distance between points p s o ( x , y ) to p s s ( x , y ) . T is the threshold of the Euclidean distance, which is set to 2 pixels in this experiment. The repeatability rate is defined as:
R r e p = 2 N c o r n s o + n s s ,
where N c o r is the number of pairs of the corresponding keypoints, and n s o and n s s are the number of keypoints in the simulated optical and SAR images, respectively. The repeatability rate is a number between 0 and 1. The larger the repeatability rate, the better is the robustness of the detector.

3.1.2. Experimental Data and Parameter Settings of Feature Detector

  • Experimental Data
We used the high-resolution (HR) optical images from the official website of Changguang Satellite Technology Company as the experimental data. The resolution of these images is better than 1 m/pixel. We selected three images with 1000 × 1000 pixels, captured at the Kabul International Airport, Afghanistan, in June 2018; these images are named as Group 1 to 3, as shown in Figure 7.
b.
Parameter Settings
For the Harris detector, the threshold of the Harris operator is normalized between 0 and 1, and it is set to 0.1 in the following experiments. For the SAR-Harris detector, the first scale is set as σ   =   2 , the constant between two adjacent scales is set as k = 2 1 / 3 , the number of the scale layer is set to 8, and the arbitrary parameter is set as d = 0.04 . Based on our previous experience, the threshold in the keypoint detection of the simulated optical image is set between 1 and 5, and that of the SAR image is set between 5 and 10. Other parameters used in the experiments follow the parameter settings suggested in Reference [25]. The m+M-Harris and UMPC-Harris are both based on PC. For fairness, the parameters of the PC method are tuned to the same value at each noise level. The PC is calculated in four scales and six orientations. The wavelength of the smallest filters is set from 3 to 5 pixels, according to different images. The scaling factor between successive filters is set to 1.6. In the experiment, the parameters are selected as S n = 4 , S m = 5 , n o p = 20 , and the number of moments of the PCM is selected as n = 5 and h = 0.5 . The array of parameters k t is 1 ,   0.5 ,   0 ,   0.5 ,   1 .

3.1.3. Influence of Noise Level on Proposed UMPC-Harris Detector

To assess the robustness of the feature detector to noise, the HR optical images are utilized to generate simulated optical and SAR images by adding Gaussian noise and speckle noise, respectively. The simulated optical image is obtained by adding Gaussian white noise with 0 mean and 0.01 variance. In the simulated SAR images, the noise level is defined to describe the degree of multiplicative noise. The multiplicative noise with a different number of looks is simulated from one-look to nine-look in the simulated SAR image. It decreases with an increase in the SAR number of looks. A high number of looks refers to a small noise level in SAR images. The simulated images are shown in Figure 8.
With the SAR noise level ranging from 1 to 9, the repeatability rate of the UMPC_Harris detector is compared to three other detectors, Harris, Sar-Harris, and m+M-Harris. For fairness, each detector extracts approximately 600 pairs of points by adjusting the threshold, and the average value of ten calculations is taken as the experimental result. The curves of the repeatability rate with the SAR noise level in the three groups are shown in Figure 9.
The repeatability rate of the UMPC-Harris is the highest among the four detectors in the three groups, and it is more robust to noise than the other detectors. SAR-Harris and m+M-Harris have similar repeatability rates as that of the SAR noise level. Their repeatability rates are between 0.5 and 0.3. When the SAR noise level is high, the repeatability rate of the UMPC-Harris is still higher than 0.4. When the SAR noise level is small, the differences between the two simulated images caused by noise are small, and hence, the three methods show good performance, except for the Harris detector. The repeatability rate of the Harris detector is lower than 0.4, and it decreases rapidly with an increase in the SAR noise level. It is difficult for the Harris detector to deal with multiplicative noise in SAR images directly.

3.1.4. Influence of Radiometric Changes on Proposed UMPC-Harris Detector

To assess the robustness of the feature detector to nonlinear radiometric differences, HR optical images are utilized to generate an image with non-uniform radiometric differences. This is achieved by multiplying the HR optical image by a variable coefficient according to the change of the image column. The results are shown in Figure 10.
The four detectors are tested on these images. Each detector extracts approximately 600 pairs of keypoints by adjusting the threshold properly, and the experiment results are shown in Figure 11. Furthermore, the repeatability rate of the four detectors are presented in Table 1.
The repeatability rate of the UMPC-Harris is the highest among the four detectors. One can see that the keypoints detected by UMPC-Harris are distributed more uniformly over the image than other detectors, which illustrates that the UMPC-Harris is more robust to radiometric variation and it further indicates that the UMPC-Harris can be applied to keypoint detection for images with radiometric differences.

3.1.5. Results and Discussion of the Proposed UMPC-Harris Detector

The results of corner detection by UMPC-Harris on a pair of optical and SAR images are shown in Figure 12. They include images of a suburban in Weinan, Shaanxi, China. The size of the optical image and SAR image are 863 × 761 and 858 × 761, respectively. The optical image is obtained by Google Earth, and the SAR image is obtained by Airborne SAR. The resolutions are both 3.2 m/pixel. The comparison results indicate that the UMPC-Harris detector is able to extract uniformly distributed in the entire image and avoid missing keypoints at the border of the block.
The comparison of the repeatability rates of the four detectors indicates that the proposed UMPC-Harris detector has the highest repeatability rate. It is more robust to noise and it has better resistance to radiation differences. The reasons are listed below.
  • The UMPC-Harris aims to extract feature points on the multi-moment of the PCM. Stable and valuable keypoints are selected by voting on the Harris corner, which appears repeatedly on the PCM. The combination of the effective corners and edge points not only ensures the high repeatability of the features, but also a large number of features, which lays a foundation for subsequent feature matching.
  • Keypoints are well-distributed in the entire image, further points with obvious local features in the dark regions can be detected. This ensures that the keypoints are not limited to the bright region, thereby improving the accuracy of image registration.

3.2. Performance Experiments of Proposed ROS-PC Registration Algorithm

To evaluate the performance of the ROS-PC, it is compared with two other state-of-the-art algorithms, namely OS-SIFT [28] and RIFT [39]. The OS-SIFT is a feature-based method, and ROEWA and Sobel operators are used to calculate consistent gradients for optical and SAR images. The RIFT is a PC-based method that detects corners and edge points on the PC map, and it proposes a MIM for feature description. Both the OS-SIFT and RIFT exhibit good performances on multi-sensor image registration. The comparative programs are obtained through their respective academic home pages. Subjective and objective criteria are used to evaluate the performance of the registration algorithm.

3.2.1. Evaluation Criteria of the Registration Algorithm

The checkboard mosaic image and enlarged sub-images are displayed to observe the effect and details of image registration. For each test image pair, each algorithm is executed ten times, and the average of the ten results is computed as the final result. The following evaluation criteria are used to analyze the performance of the algorithm objectively and quantitatively.
Root mean square error (RMSE): This criterion is used to measure the accuracy of the image registration algorithm and is computed by the following method.
First, approximately 20 pairs of corresponding points are manually selected from the optical and SAR images to estimate the affine transformation matrix H. The coordinates of i t h correctly matched keypoints are ( x i o , y i o ) , ( x i s , y i s ) . The RMSE is computed as [26]:
R M S E = 1 N c o r i = 1 N c o r ( x i o ( x i s ) ) 2 + ( y i o ( y i s ) ) 2
where N c o r is the number of correctly matched keypoints after the fast sample consensus (FSC) [43], ( ( x i s ) , ( y i s ) ) and it denotes the transformed coordinates of ( x i s , y i s ) by the estimated transformation matrix H.
Number of correct matches (NCM): The NCM is the number of correctly matched keypoints after the FSC. If the NCM of an image pair is less than four, the matching is considered to have failed.
A small RMSE indicates that the accuracy of optical and SAR image registration is high. A large NCM indicates that there exist more correctly matched keypoints, thereby resulting in a more accurate transformation matrix H.

3.2.2. Datasets and Parameter Settings of the Registration Algorithm
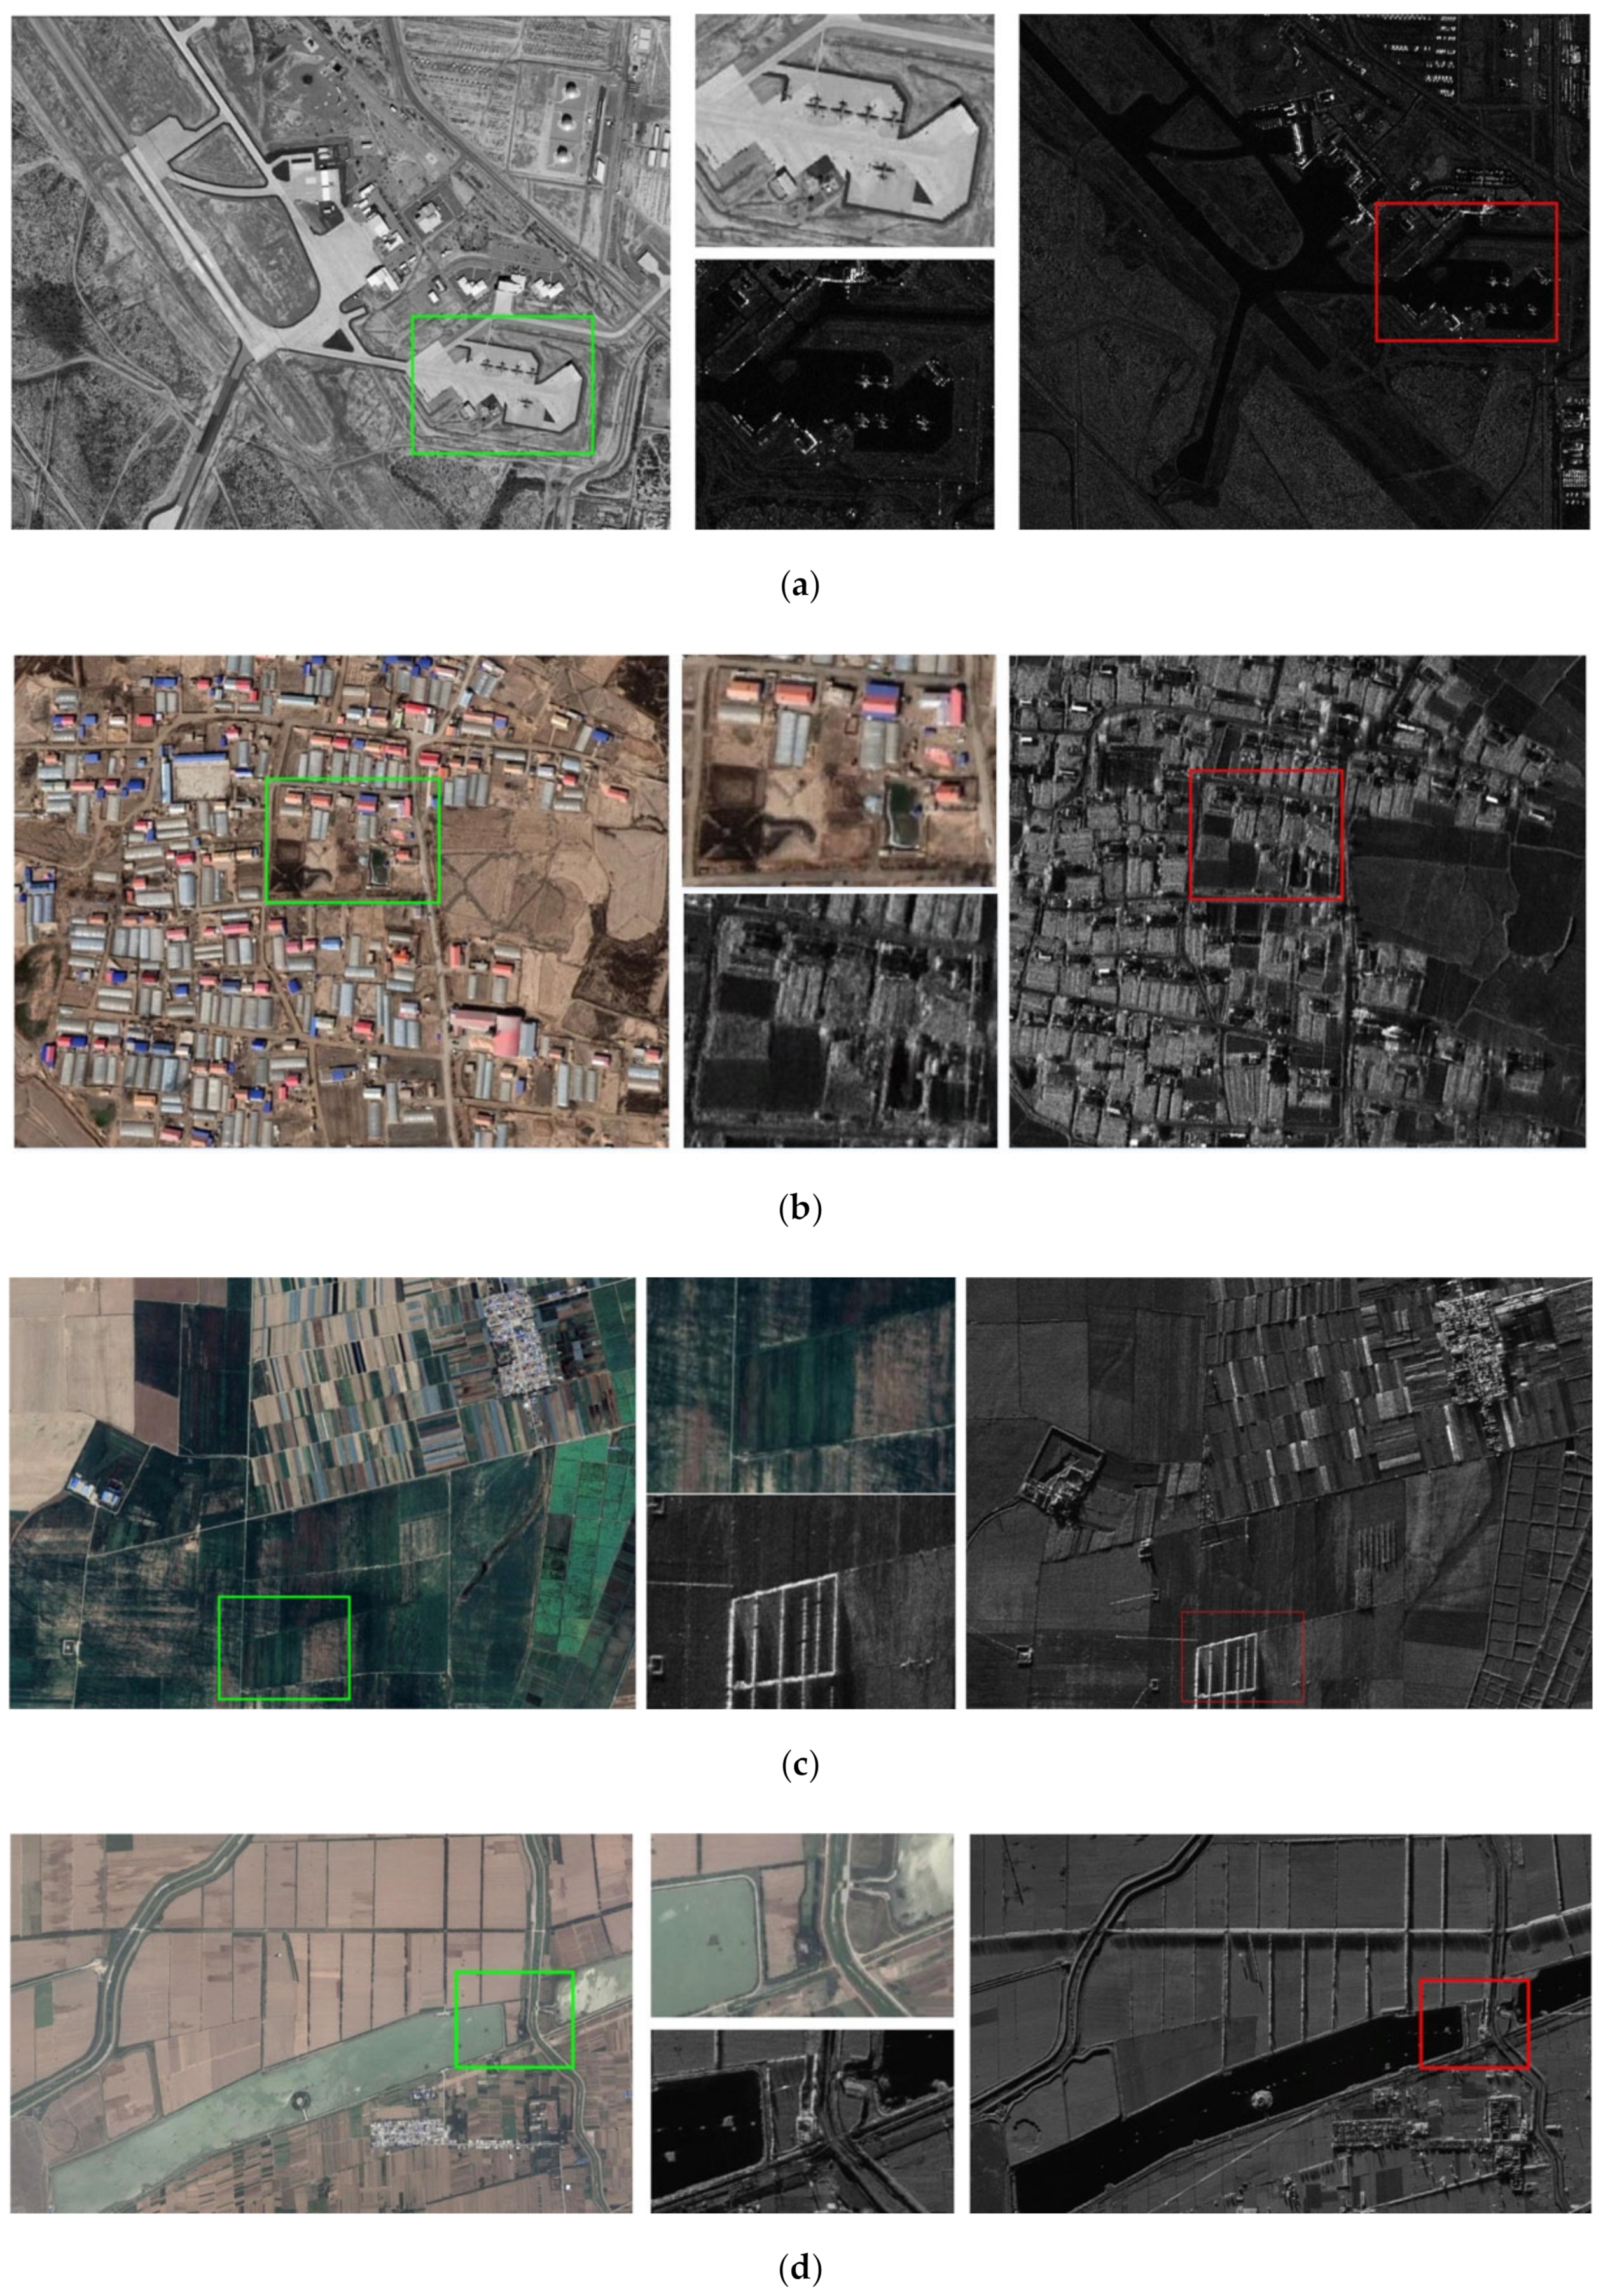
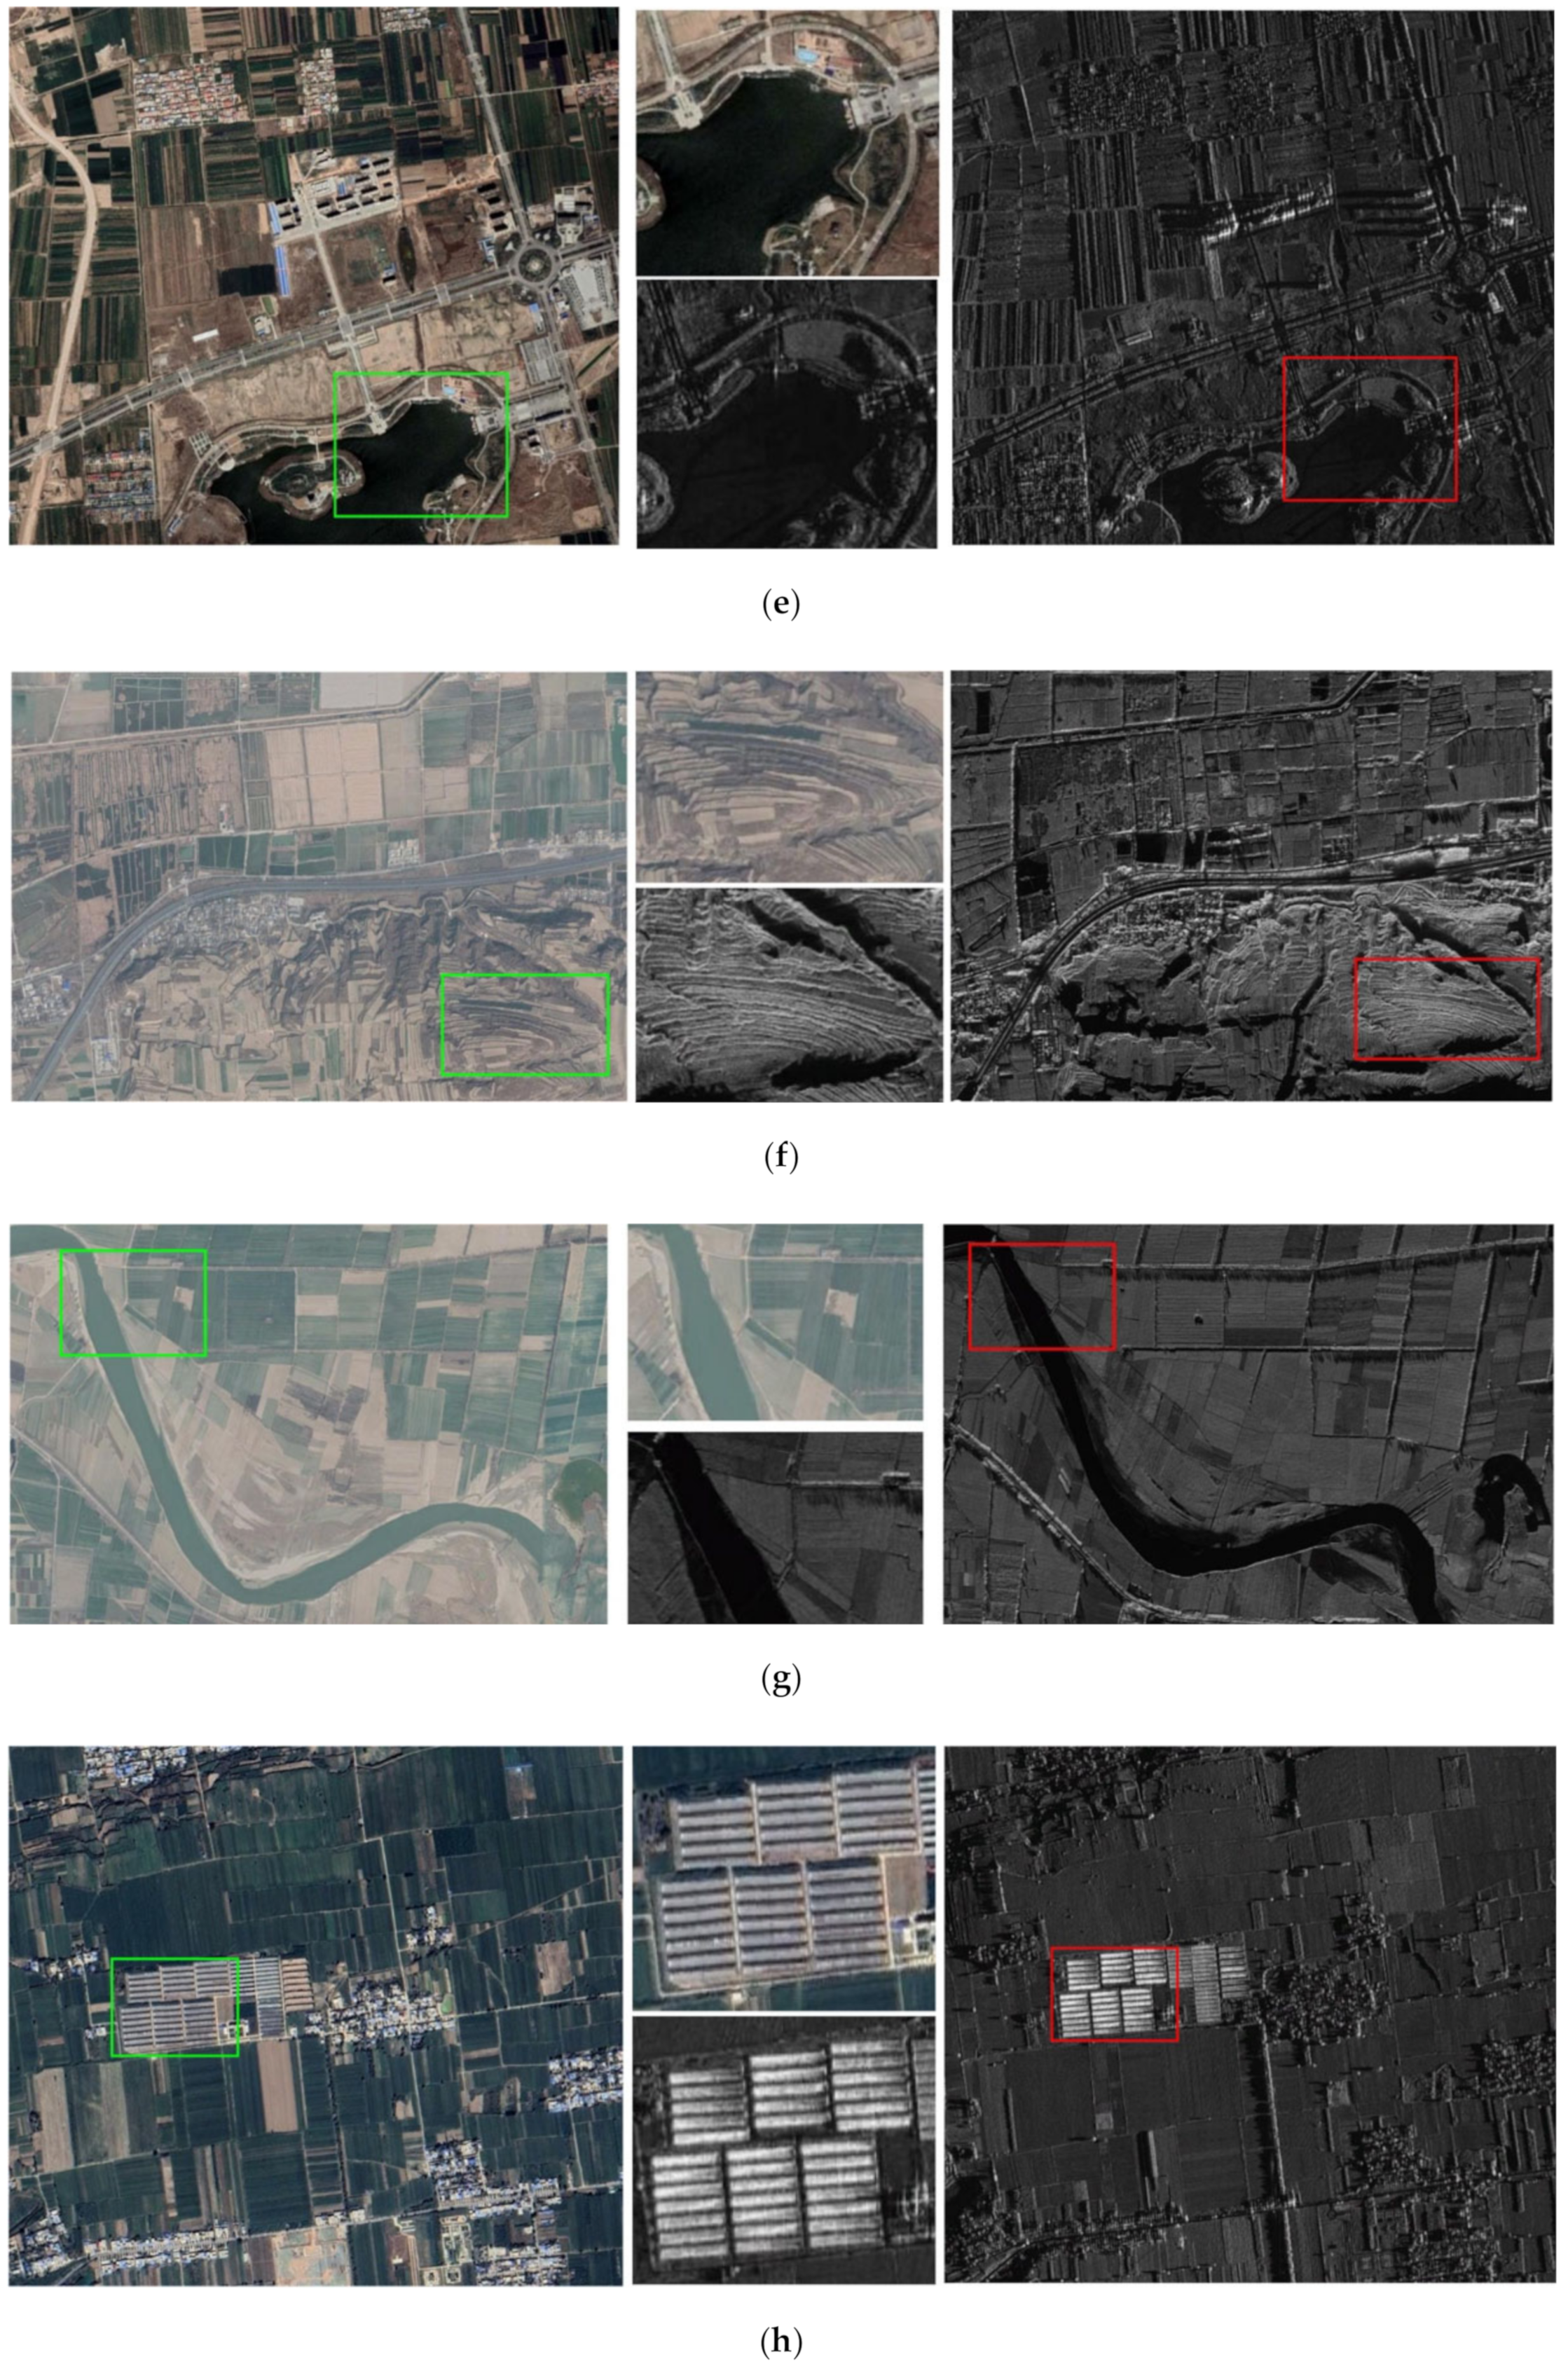
  • Datasets
In our experiment, eight pairs of optical and SAR images are used to test the ROS-PC; these pairs are referred to as Pairs A-H. Table 2 lists the information for the test images.
Numerous factors are considered in the selection of test images, including different SAR sensors, date, resolution, and size. The optical images of the eight pairs are obtained from Google Earth, and the SAR image contains a satellite SAR image and seven airborne SAR images. To verify the robustness of the ROS-PC, the image contains different features, as shown in Figure 13.
Pair A includes images of an airport in Tucson, AZ, USA; in this pair, there exists a slight rotation and translation difference. Pair B is obtained in Zhengzhou, Henan, China, and it includes images of a small village. There is a slight rotation and translation in this pair, and because of the arc-shaped roof, there is a large radiation difference over the houses. Some houses even are difficult to recognize on SAR images. Pair C is also obtained in Zhengzhou, Henan, China, and it includes images of a field, and the features of the field vary significantly with the date. Some obvious features exist in the SAR image but not in the optical image. The remaining five pairs of images are obtained in Weinan, Shaanxi, China. Pair D includes images of a large scene, that includes a river, small buildings, multiple fields, and several roads. There are no scale and rotation changes in this pair, and the features exhibit a little temporal difference. This pair of images is used for the rotation and scale variation experiments. Pair E mainly includes images of a lake. There are certain scale variations and time differences. Pair F includes images of a terrace. The fields and terraces in the image are divided into two parts by a road. The feature intensity of the terraces is stronger than that of the fields. Pair G includes images of a scene including a river and some fields, there exists a large time span between the two images. Pair H includes images of a complex scene with some different structure buildings.
b.
Parameter Settings
The parameter settings of the UMPC-Harris detector are described in Section 3.1.2. The proposed ROS-PC method contains three parameters n o , n p and m , respectively. Parameter n o and n p are related to the dimensions of the descriptor, so they should not be too large. Parameter m is the size of the local region used for feature description. If the local region is too small, it contains less information, which does not reflect the difference of features. On the contrary, if the local region is too large, not only the amount of calculation will increase but also the effect of geometric distortion will be received. In the feature descriptor, the parameters are set as n o = 6 , n p = 4 , and m = 96 . Therefore, the dimension of the feature descriptor of a keypoint is 384. The parameter settings of comparative algorithms OS-SIFT and RIFT follow the References [28,39]. For a fair, the thresholds of keypoints detection are properly adjusted to obtain similar numbers of keypoints (approximately 1000~1200).
For the feature matching, the sum of squared differences (SSD) is selected for the feature matching metric. If the distance between the two feature vectors is less than the threshold, a pair of keypoints is considered as a potential match, and the threshold is set to 3 pixels. Generally, the matching pairs contain many false matches. The FSC algorithm is used to remove false matches.

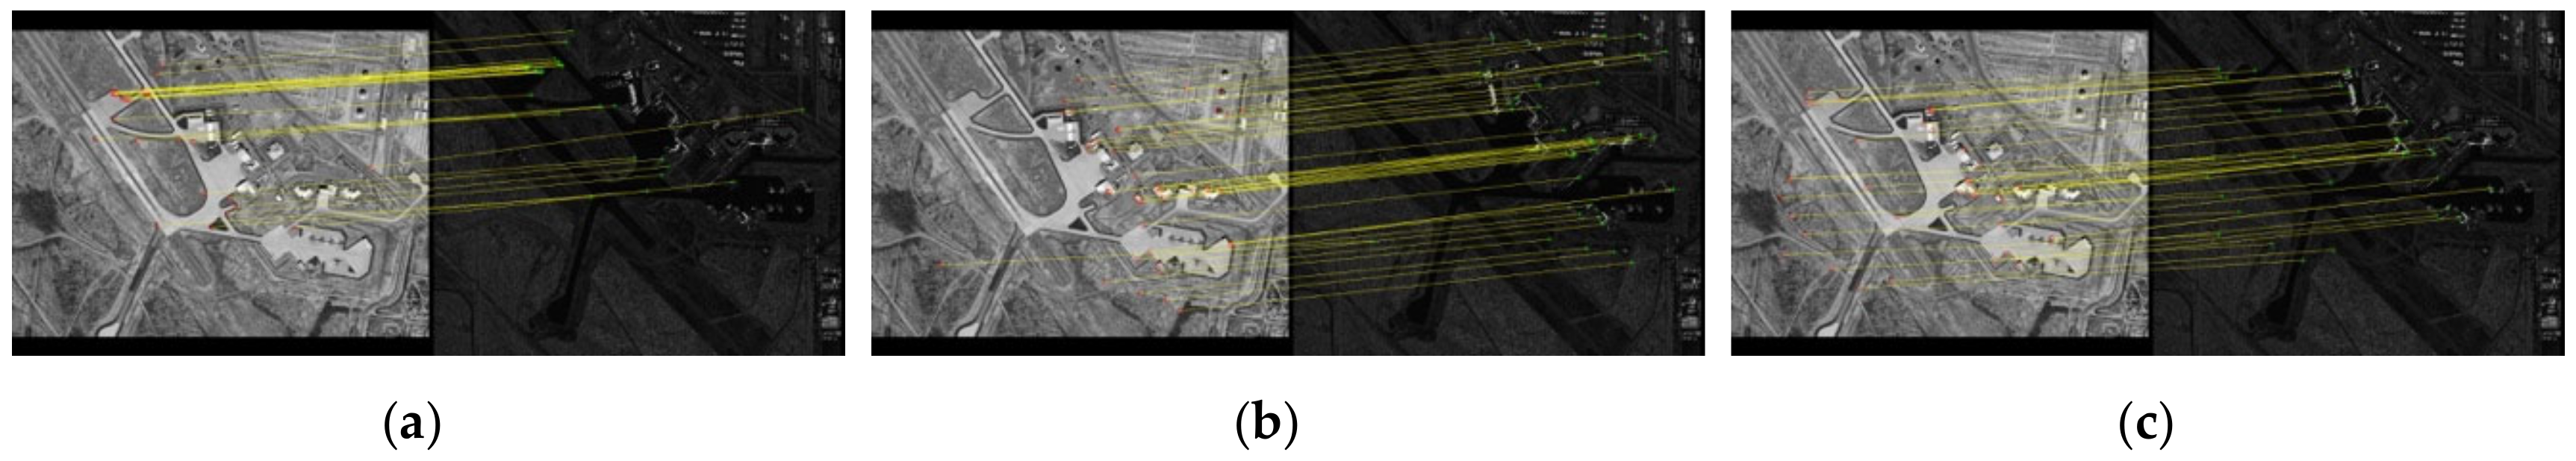
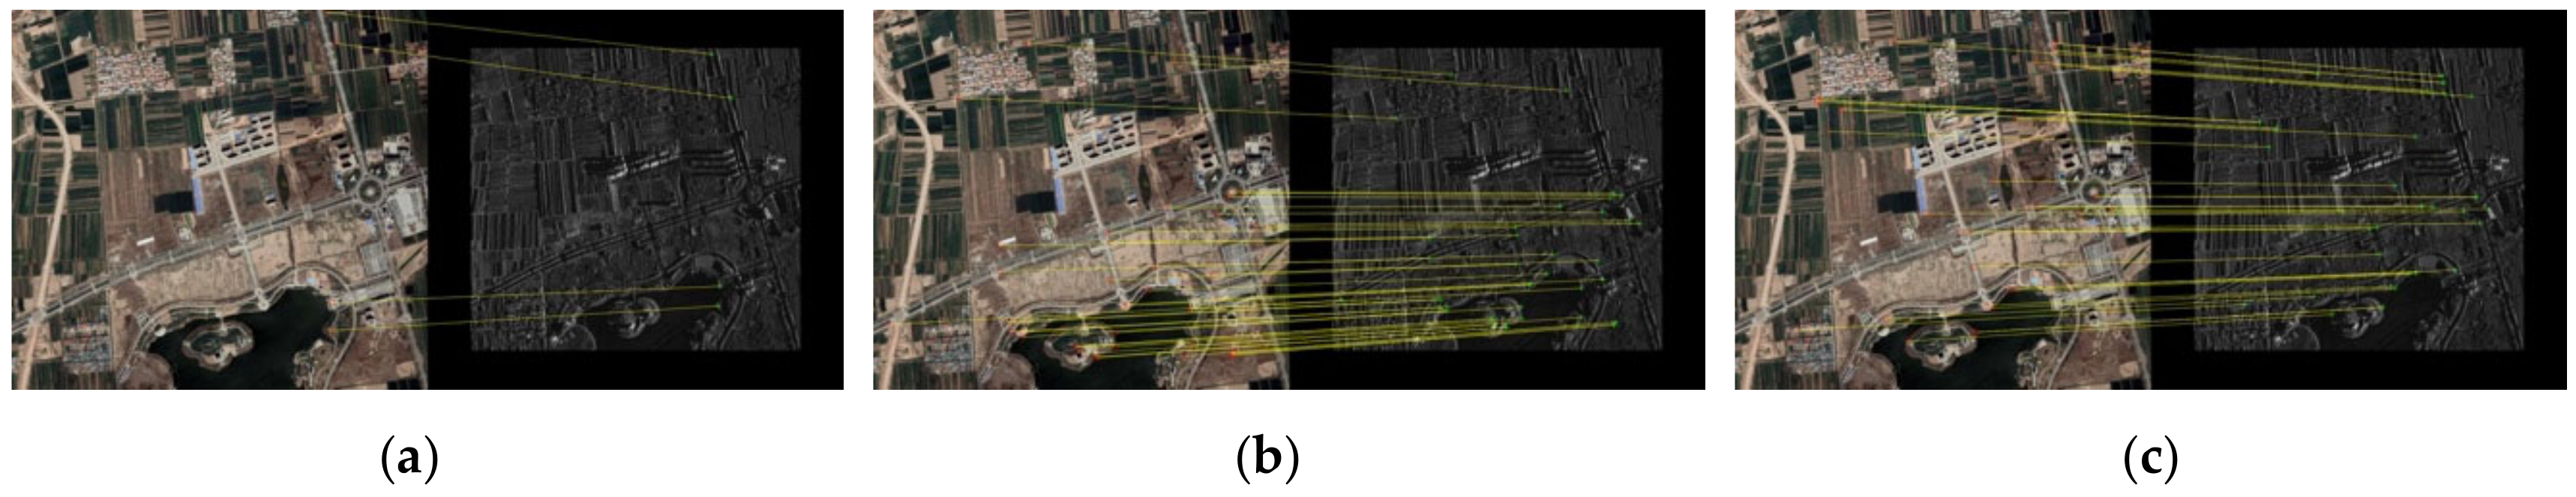
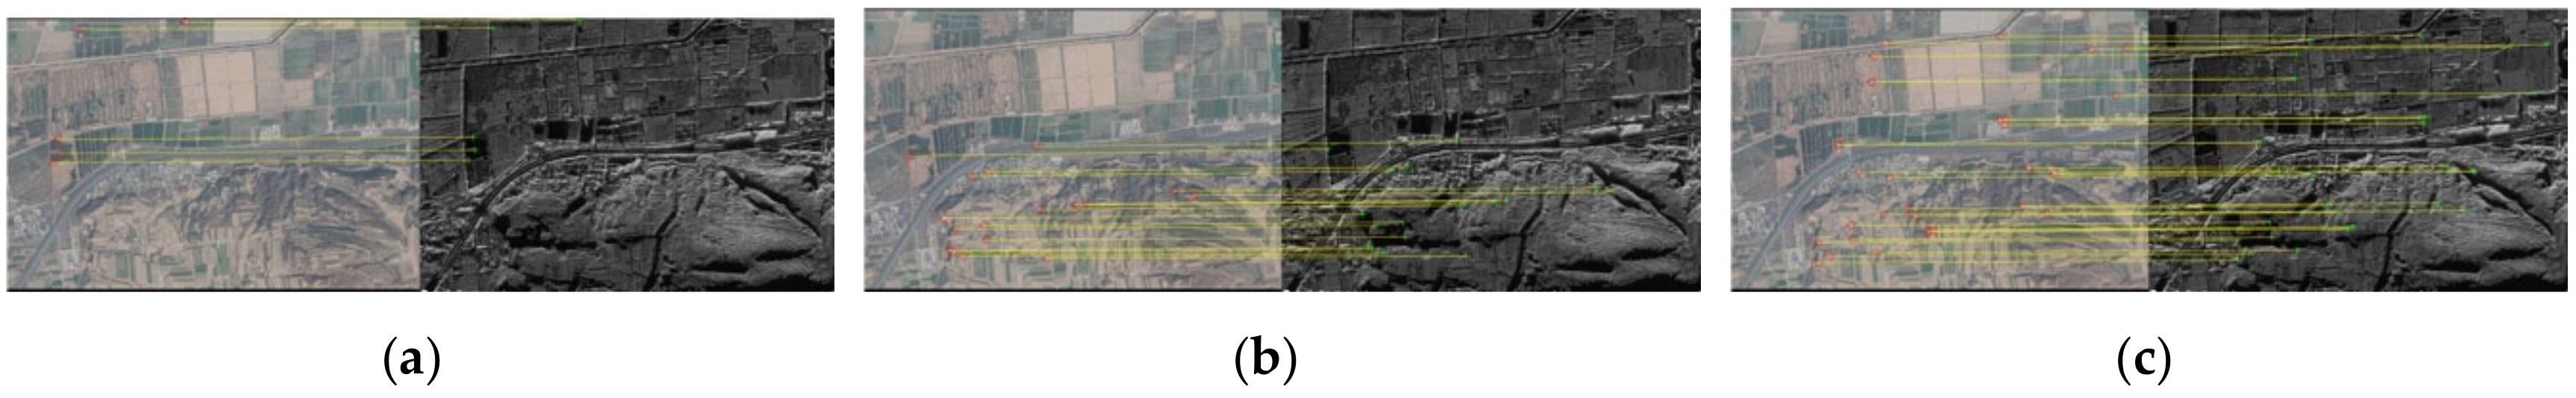
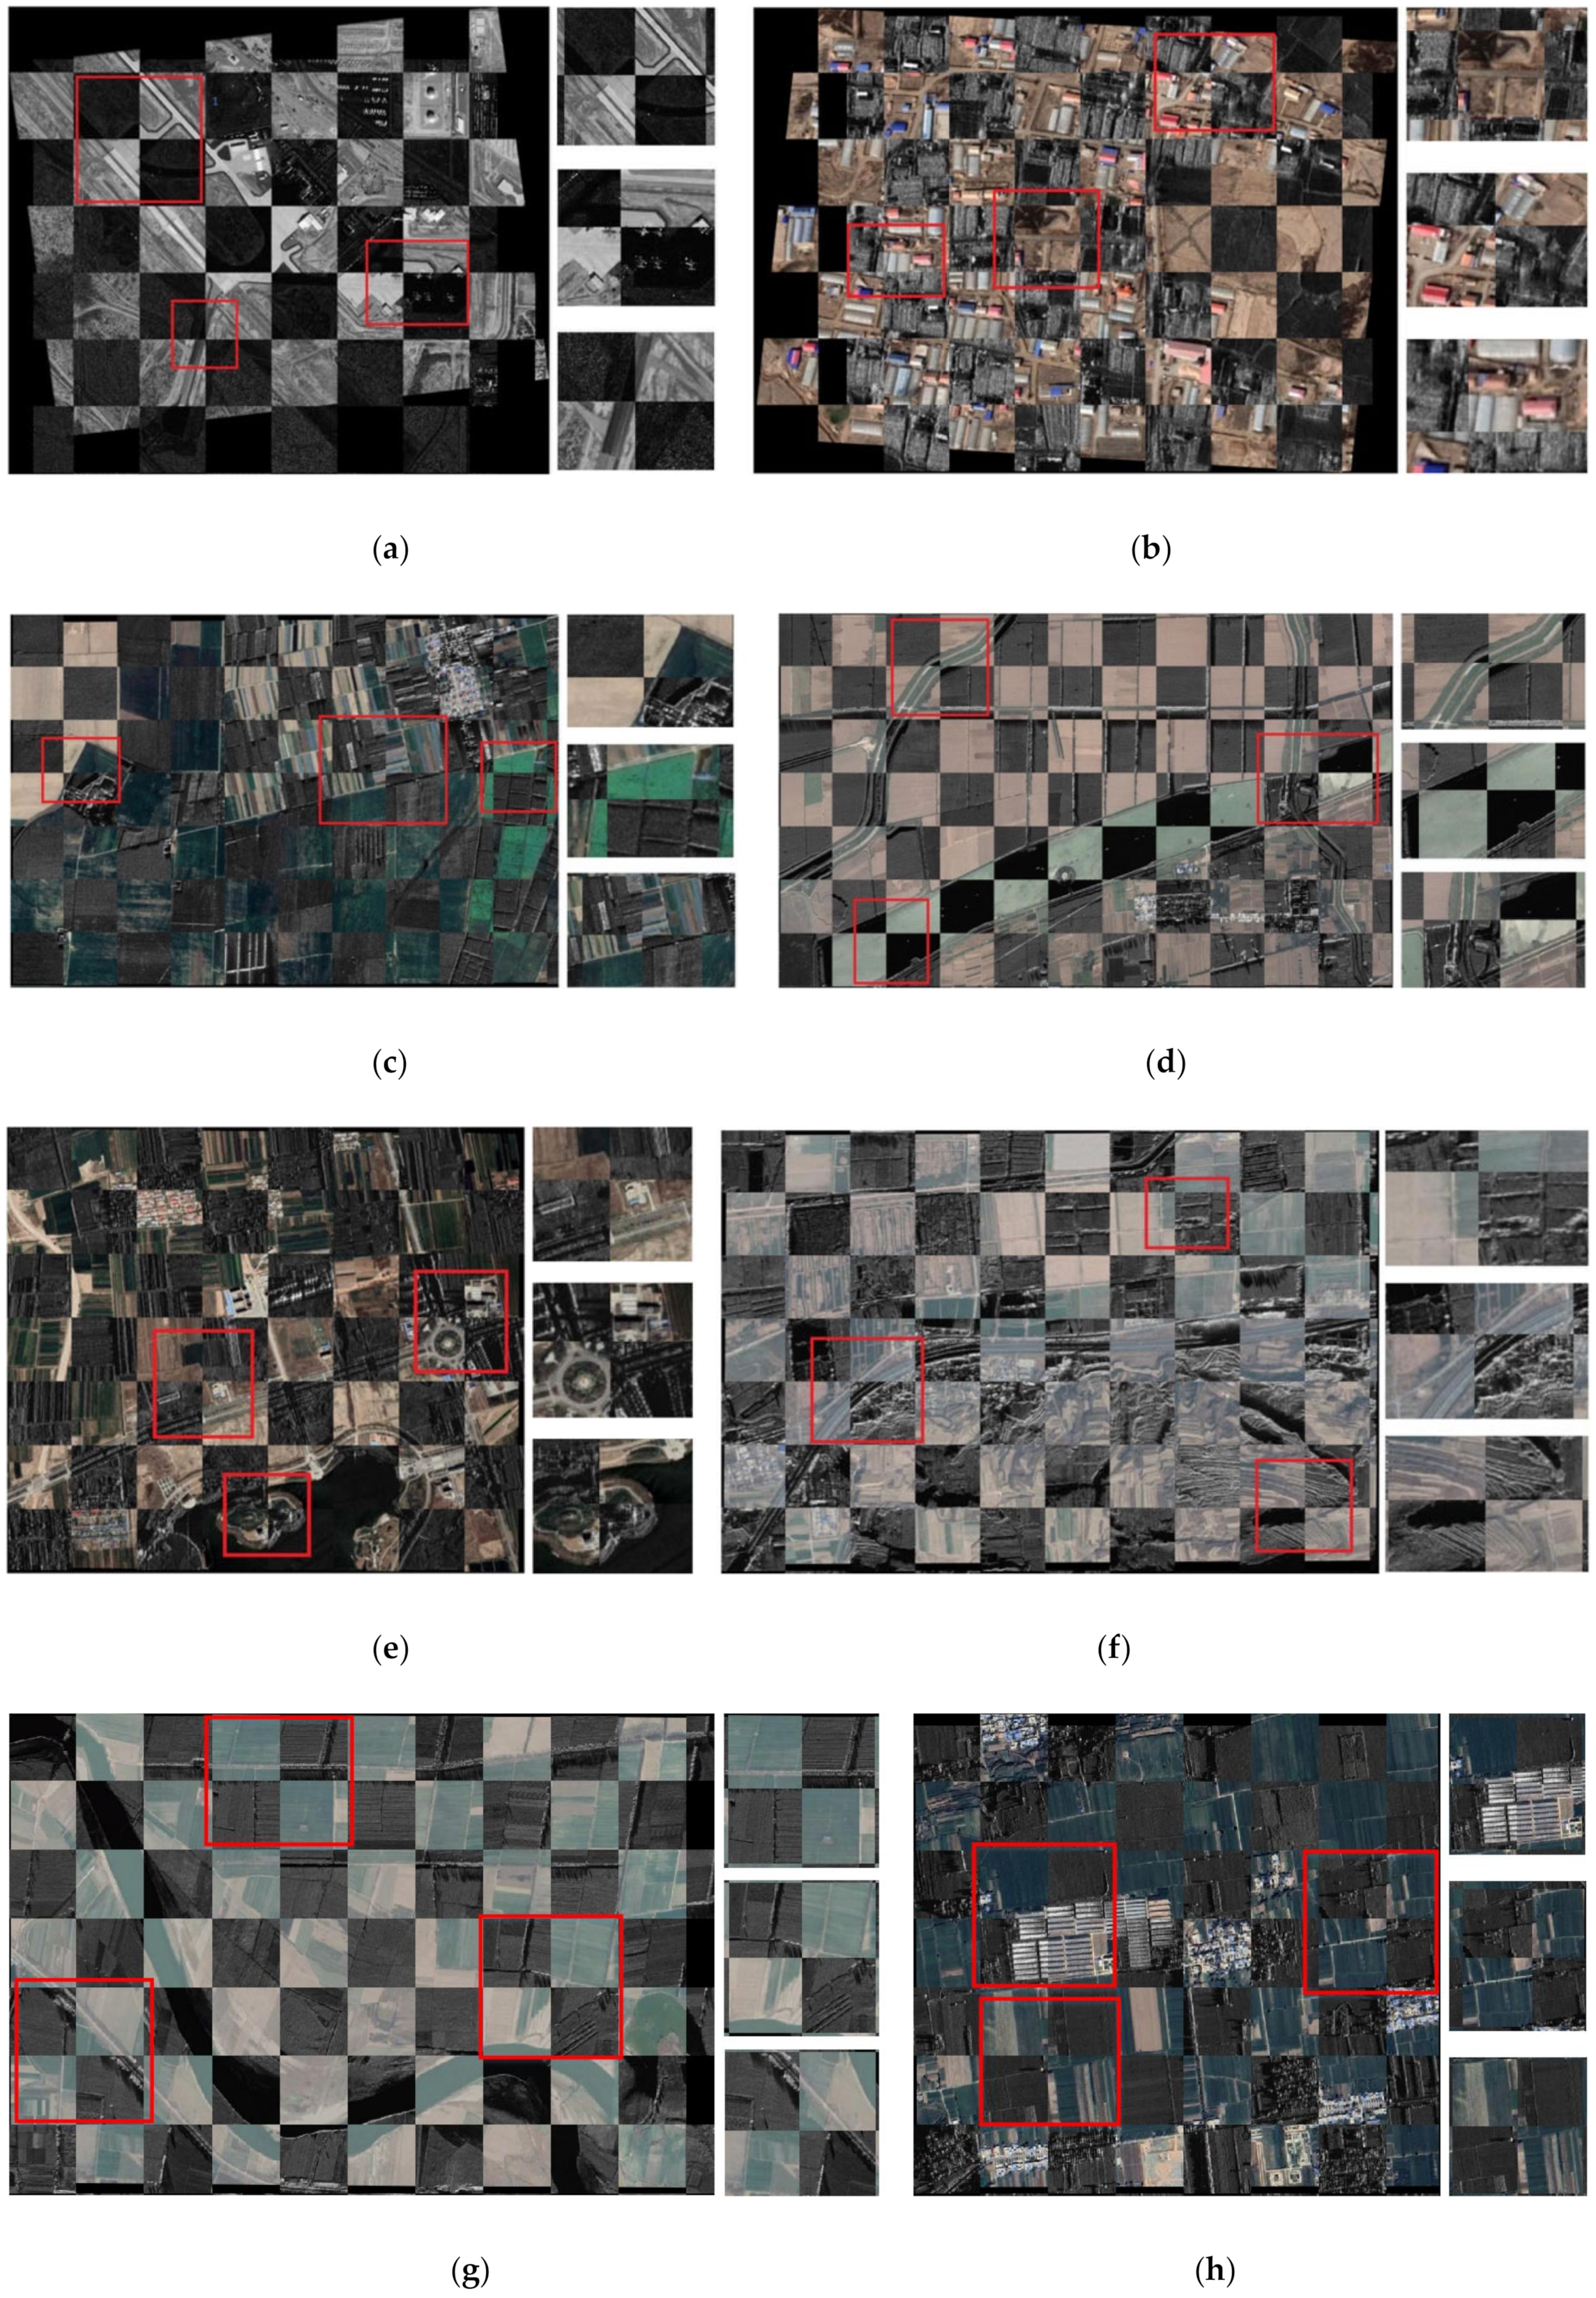
3.2.3. Comparison of Experimental Results and Discussion

To evaluate the optical and SAR image registration performance of the ROS-PC, the algorithm is compared with OS-SIFT and RIFT. The OS-SIFT utilizes two different operators to calculate the gradients for SAR and optical images. Multiple image patches are aggregated to construct a gradient location orientation histogram-like descriptor. It is an advanced gradient-based method. The RIFT is a radiation-insensitive feature matching method based on PC and MIM, which is considerably more robust to nonlinear radiation distortions than traditional gradient maps. The registration results of eight pairs of optical and SAR images are shown in Figure 14, Figure 15, Figure 16, Figure 17, Figure 18, Figure 19, Figure 20 and Figure 21.
Eight groups of images with different features are selected to verify the robustness of ROS-PC algorithm. It can be found that the ROS-PC has the best performance among the three methods, owing to the advantages of the proposed UMPC-Harris detector and HOSMI descriptor. For images with date and season differences, shown in Figure 14 and Figure 16, the ROS-PC shows better robustness and obtains some matched keypoints with the time difference. For images with large radiation differences, shown in Figure 15 and Figure 21, ROS-PC can still obtain some correctly matched keypoints, which are well-distributed in the image. For images with multiple objects, shown in Figure 17, Figure 18, Figure 19 and Figure 20, ROS-PC can extract matching keypoints from each object, and they are uniformly distributed, which ensures the accuracy of registration. To sum up, the ROS-PC is a robust algorithm, which is suitable for optical and SAR image registration.
To further observe the registration accuracy of the ROS-PC, the checkboard mosaic images and enlarged sub-images of each pair are displayed in Figure 22.
The sub-image is an enlarged view of the intersection of the checkboard mosaic images, where the common features in the optical and SAR images are displayed clearly. In each pair, three sub-images with different features are selected.
Comparisons of RMSE, NCM, and the running time of the eight pairs are presented in Table 3.
In the eight pairs of test images, most features of suburban areas, such as airports, houses, fields, terraces, roads, rivers, and lakes are included. The optical and SAR images exhibit nonlinear radiation distortion, which leads to intensity differences or gradient inversion. Next, we analyze and discuss the registration results of each pair of images.
For Pair A, all three methods can successfully achieve optical and SAR image registration because of the HR and less noise. The ROS-PC performs best on the RMSE and NCM, benefiting from the high repeatability rate of keypoints and the robustness of the feature description method. For Pair B, the RIFT fails to register the two images correctly because of the serious nonlinear radiometric difference. This is because the houses in the image have arc-shaped roofs, which induce the optical and SAR images with intensity differences. Although several correctly matched keypoints are detected by the OS-SIFT, the number and accuracy are significantly lower than the ROS-PC. For Pair C, the OS-SIFT fails to register the two images because of the gradient difference and obvious scattering in the SAR image. However, the ROS-PC is suitable for describing similar local information based on the PC orientation and the multi-scale MIMs of the keypoints. For Pair D, the image contains many features, and there are little scale, rotation, and date difference. The ROS-PC remains superior to the other two methods, as it is robust to nonlinear radiation differences and noise. For pair E and F, the image contains two types of features. ROS-PC can obtain correctly matching keypoints from each object, and they are well-distributed. For pair G, owing to the time difference, there are many unmatched keypoints of the river in the image, which causes extra difficulties in feature matching. However, the ROS-PC still successfully completes more NCM and achieves higher accuracy. For pair H, the radiation difference between optical and SAR images is large, because there are many buildings in the image, which leads to the failure of the other two algorithms. To sum up, the ROS-PC has the most uniform distribution, the largest NCM, and the best RMSE among the three algorithms. Therefore, the ROS-PC is more robust to noise and scattering in SAR images and the radiation difference between optical and SAR images.
Gradient-based descriptors such as OS-SIFT are more sensitive to nonlinear radiation differences because the gradient-based descriptors rely on a linear relationship between images, and therefore, they are not appropriate for significant nonlinear intensity differences caused by radiation distortion. The speckle noise and scattering in SAR images pose significant challenges in image registration. The RIFT performs better than the gradient-based descriptors because it uses PC to capture MIM. The RIFT uses the MIM to express the shape and structure information of objects and, therefore, it is robust to nonlinear radiation distortion. However, the repeatability rate of the corner detector in RIFT is not as good as that of UMPC-Harris, and the descriptor in RIFT has limited significance and robustness to noise and scattering in SAR images. Therefore, our ROS-PC yields the smallest RMSE and the largest NCM among all eight pairs because of two reasons, which are listed below.
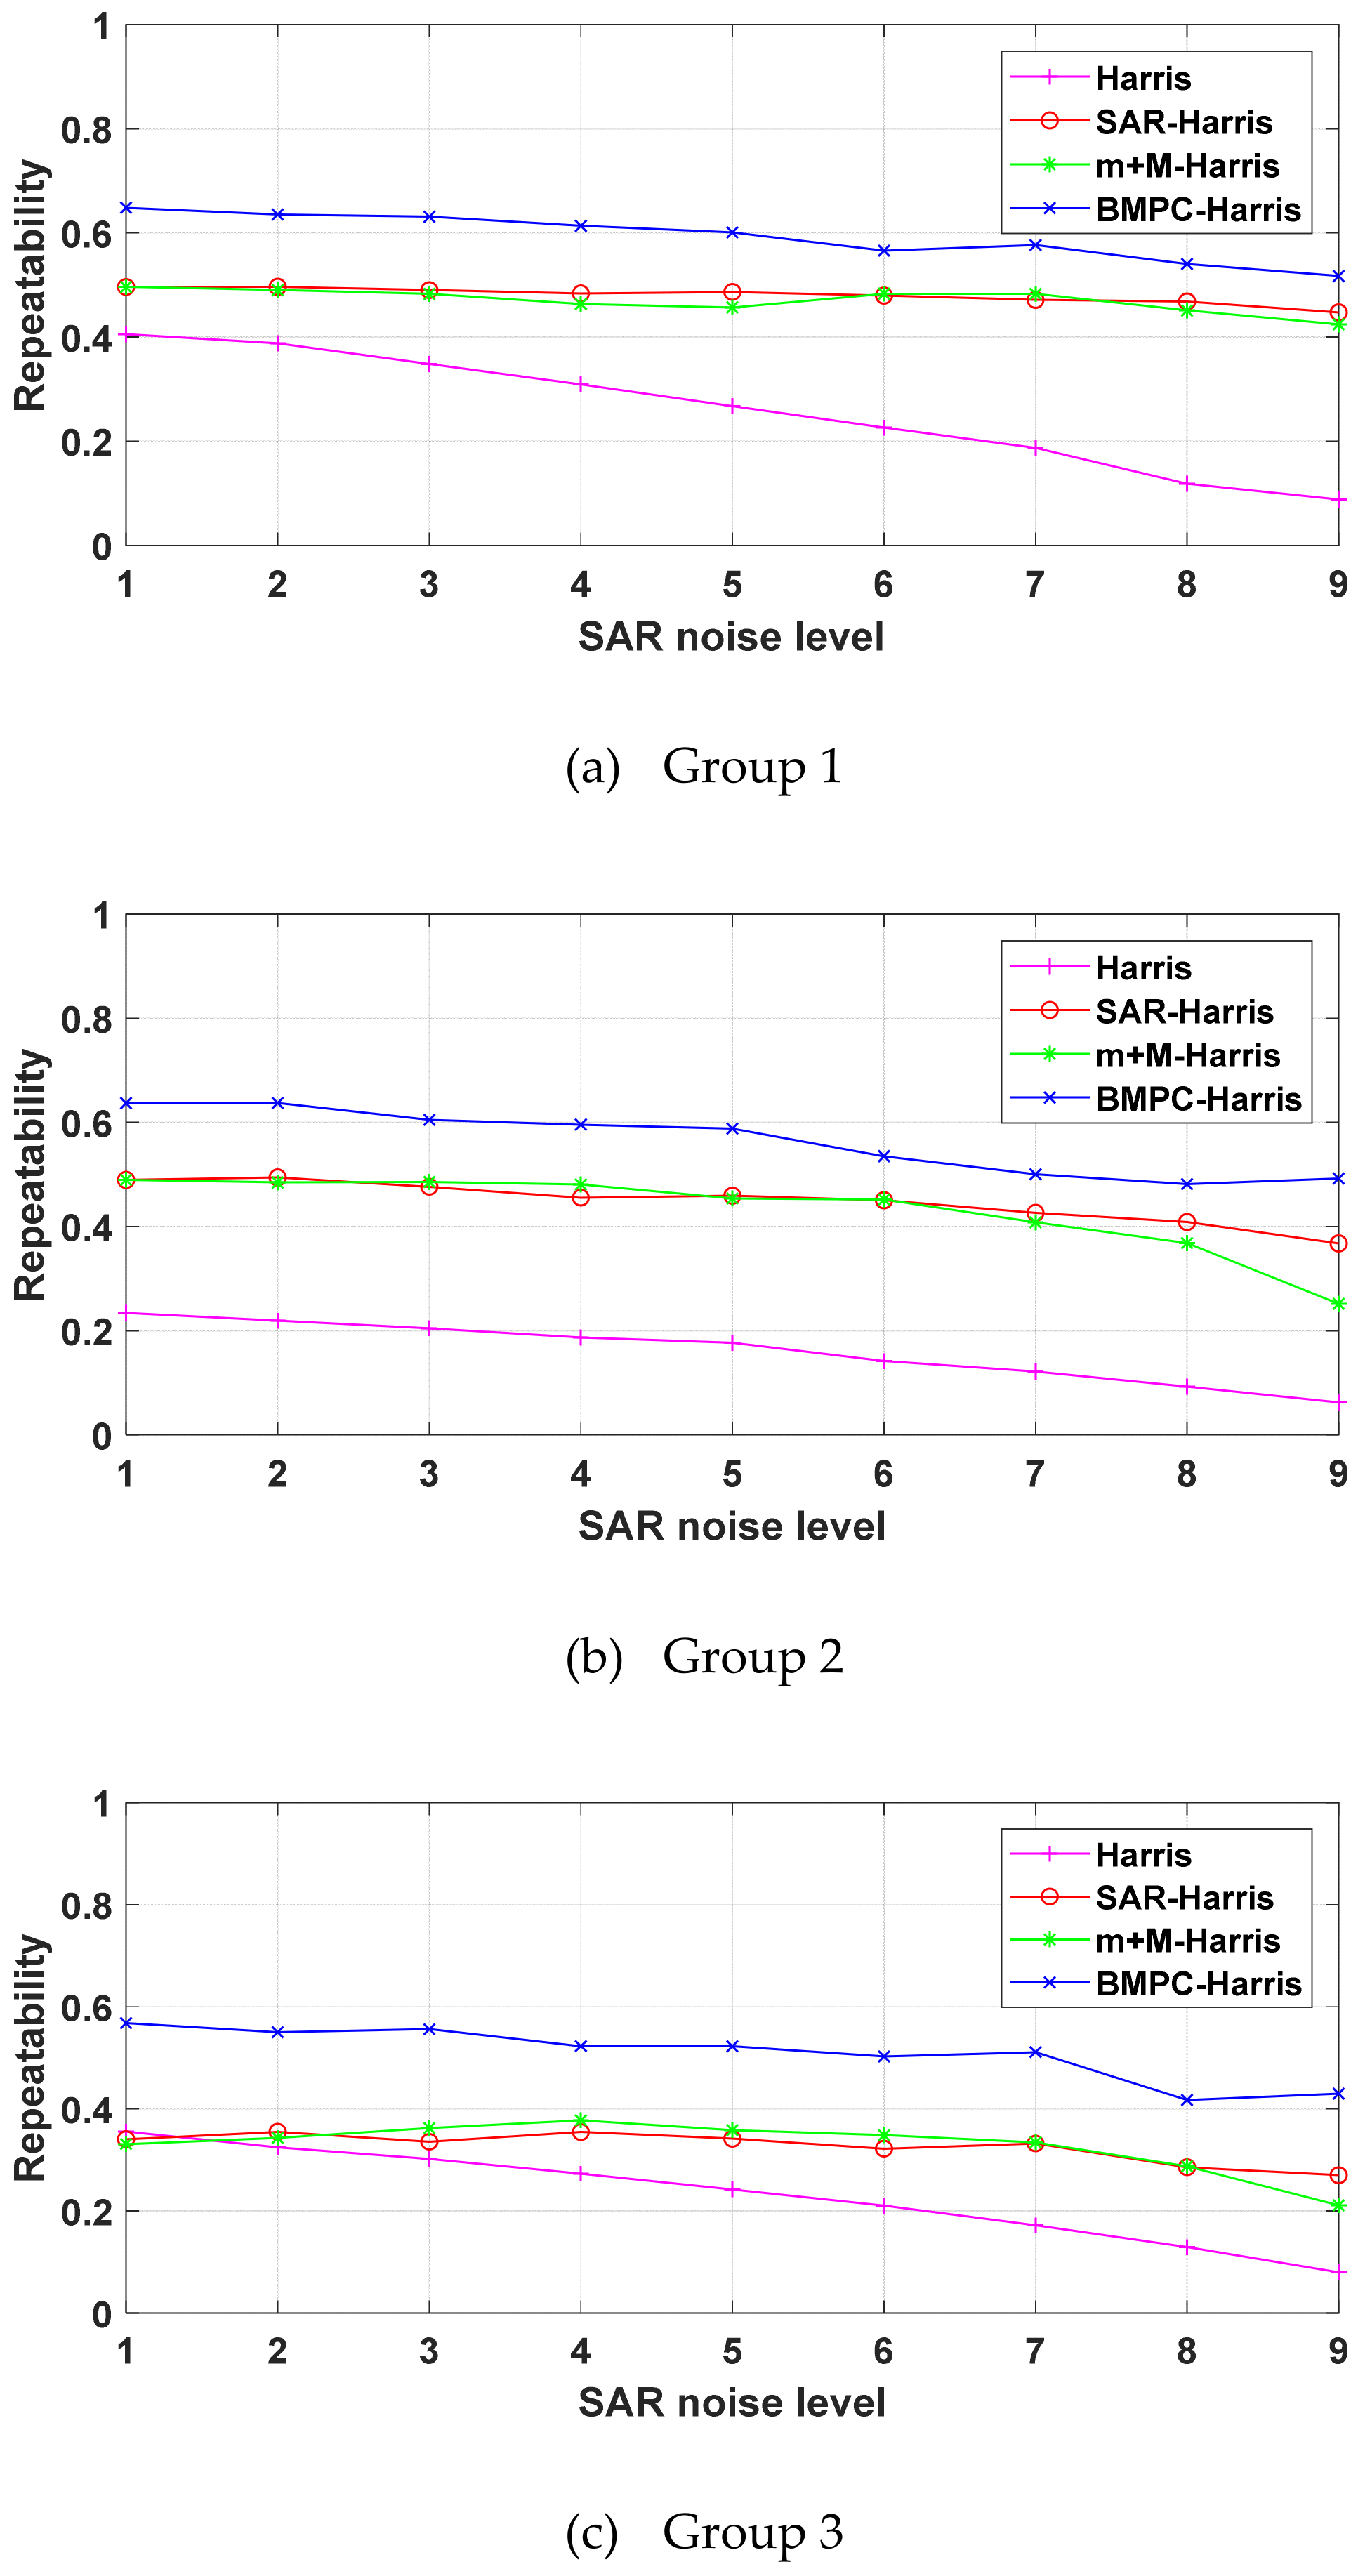
  • The UMPC-Harris can obtain a higher repeatability rate of keypoints than SAR-Harris and m + M-Harris between SAR and optical images.
  • The HOSMI descriptor uses four-scale and six-orientation LGFs to capture the multi-scale max index and orientation feature information of PC, which is robust to nonlinear radiation variations of optical and SAR images. Further, it can effectively overcome the noise and scattering of SAR images.
After comparisons of the running time in Table 3, it can be found that the ROS-PC is the most time-consuming. The reason is that the algorithm is based on the principle of PC, which is slow by nature. Second, in the process of feature detection, the overlapping block and voting strategies need to additional calculation than the other methods. Third, the descriptor is constructed over the four scales and the dimension is larger. This paper only focuses on a robust registration method for optical and SAR images, and the running time is not the focus. Therefore, reducing the computation time and improving the efficiency of the algorithm is a problem we need to study in the future. Moreover, computational efficiency can be further improved by optimizing the algorithm and implementing the ROS-PC in C/C++.

3.3. Influence of Rotation and Scale Variations on the Proposed ROS-PC

The previous experimental results show that the algorithm is robust to the radiation distortion between optical and SAR images; however, the ROS-PC is not designed for scale and rotation deformations. The large-angle rotation between remote sensing images can be corrected using sensor geographic information. Further, by employing remote sensing image ground resolution information, remote sensing images can be assigned to the same scale by resampling. Then, the ROS-PC could be used for fine matching, which can handle slight rotation and scale differences between optical and SAR images. In this subsection, the influence of rotation and scale variation on our algorithm is evaluated based on the NCM for Pair D.

3.3.1. Rotation Experiments of the Proposed ROS-PC

We tested the effect of rotation changes on the ROS-PC. Assuming the optical image remains unchanged, the SAR image is rotated from −12° to 16°. The optical and SAR image registration results of the rotation variation are shown in Figure 23. The relationship between the NCM and the rotation angle is listed in Table 4.
Figure 23 and Table 4 indicate that the ROS-PC can tolerate rotations between optical and SAR images below 9°, which is sufficient for images that have been corrected by sensor geographic information.

3.3.2. Scale Experiments of the Proposed ROS-PC

We test the robustness of the ROS-PC to scale changes. The optical image in Pair-D remains unchanged, and the SAR image is resized from 0.6 to 1.4 with an interval of 0.1. The optical and SAR image registration results of the scale variation are shown in Figure 24. The relationship between the NCM and the scale factor is listed in Table 5.
Figure 24 and Table 5 indicates that the ROS-PC can tolerate the scale difference between optical and SAR images in the range of 0.7–1.2, which is sufficient for images that have been assigned a similar scale by resampling.

4. Conclusions

In this study, a PC-based optical and SAR image registration algorithm ROS-PC is proposed to address the matching difficulties caused by complex nonlinear radiation differences and speckle noise.
We designed a novel feature detector named UMPC-Harris, comprising an overlapping block strategy, Harris on multi-moment of the PCM, and the vote strategy to obtain uniformly distributed keypoints and increase the repeatability rate of the keypoints. The experimental results on simulated images demonstrated that the proposed UMPC-Harris method achieved a good performance in keypoints detection. The proposed HOSMI descriptor is constructed using the histograms of the PC orientation on the multi-scale MIM. The image registration experiments prove that the ROS-PC is robust to nonlinear radiation variations of optical and SAR images and it can tolerate a small amount of rotation and scale changes.

Author Contributions

Conceptualization, L.W. and M.S.; methodology, L.W.; software, L.W.; validation, L.W., M.S., and J.L.; formal analysis, L.W. and M.S.; writing—original draft preparation, L.W.; writing—review and editing, L.C. and G.M.; All authors have read and agreed to the published version of the manuscript.

Funding

This work was supported in part by the National Key R&D Program of China under Grant NO. 2017YFC0822402.

Acknowledgments

The authors would like to thank Dr. Xiang for providing the OS-SIFT and Pair A images and the Beijing Institute of Radio Measurement for providing the SAR images in Pair B-H.

Conflicts of Interest

The authors declare no conflict of interest.

References

  1. Zhang, Q.; Liu, Y.; Blum, R.S.; Han, J.G.; Tao, D.C. Sparse representation based multi-sensor image fusion for multi-focus and multi-modality images: A review. Inf. Fusion 2018, 40, 57–75. [Google Scholar] [CrossRef]
  2. Kulkarni, S.C.; Rege, P.P. Pixel level fusion techniques for SAR and optical images: A review. Inf. Fusion 2020, 59, 13–29. [Google Scholar] [CrossRef]
  3. Tapete, D.; Cigna, F. Detection of archaeological looting from space: Methods, achievements, and challenges. Remote Sens. 2019, 11, 2389. [Google Scholar] [CrossRef] [Green Version]
  4. Song, S.L.; Jin, K.; Zuo, B.; Yang, J. A novel change detection method combined with registration for SAR images. Remote Sens. Lett. 2019, 10, 669–678. [Google Scholar] [CrossRef]
  5. Zhang, S.L.; Chen, J.Q.; Liu, X.; Li, J. Change Detection of Huangqi Lake Based on Modified Active Contour Using Sentinel-1 SAR Image. In Proceedings of the 2018 Progress in Electromagnetics Research Symposium (PIERS), Toyama, Japan, 1–4 August 2018; pp. 2291–2295. [Google Scholar]
  6. Li, K.; Zhang, X.Q. Review of Research on Registration of SAR and Optical Remote Sensing Image Based on Feature. In Proceedings of the 2018 IEEE 3rd International Conference on Signal and Image Processing (ICSIP 2018), Shenzhen, China, 13–15 July 2018; pp. 111–115. [Google Scholar]
  7. Wang, F.; You, H.J. Robust registration method of SAR and optical remote sensing images based on cascade. J. Infrared Millim. Waves 2015, 34, 486–492. [Google Scholar]
  8. Zitova, B.; Flusser, J. Image registration methods: A survey. Image Vis. Comput. 2003, 21, 977–1000. [Google Scholar] [CrossRef] [Green Version]
  9. Suri, S.; Reinartz, P. Mutual-information-based registration of TerraSAR-X and Ikonos imagery in urban areas. IEEE Trans. Geosci. Remote Sens. 2010, 48, 939–949. [Google Scholar] [CrossRef]
  10. Shu, L.X.; Tan, T.N. SAR and SPOT Image Registration Based on Mutual Information with Contrast Measure. In Proceedings of the 2007 IEEE International Conference on Image Processing, San Antonio, TX, USA, 16 September–19 October 2007; pp. 2681–2684. [Google Scholar]
  11. Shi, W.; Su, F.Z.; Wang, R.R.; Fan, J.F. A Visual Circle Based Image Registration Algorithm for Optical and SAR Imagery. In Proceedings of the 2012 IEEE International Geoscience and Remote Sensing Symposium (IGARSS 2012), Munich, Germany, 22–27 July 2012; pp. 2109–2112. [Google Scholar]
  12. Wang, F.; Vemuri, B.C. Non-rigid multi-modal image registration using cross-cumulative residual entropy. Int. J. Comput. Vis. 2007, 74, 201–215. [Google Scholar] [CrossRef] [Green Version]
  13. Yu, L.; Zhang, D.R.; Holden, E.J. A fast and fully automatic registration approach based on point features for multi-source remote-sensing images. Comput. Geosci. 2008, 34, 838–848. [Google Scholar] [CrossRef]
  14. Liu, S.Y.; Jiang, J. Registration algorithm based on line-intersection-line for satellite remote sensing images of urban areas. Remote Sens. 2019, 11, 26. [Google Scholar] [CrossRef] [Green Version]
  15. Sui, H.G.; Xu, C.; Liu, J.Y.; Hua, F. Automatic optical-to-SAR image registration by iterative line extraction and Voronoi integrated spectral point matching. IEEE Trans. Geosci. Remote Sens. 2015, 53, 6058–6072. [Google Scholar] [CrossRef]
  16. Li, H.; Manjunath, B.S.; Mitra, S.K. Contour-Based Multisensor Image Registration. In Proceedings of the Conference Record of the Twenty-Sixth Asilomar Conference on Signals, Systems & Computers, Pacific Grove, CA, USA, 26–28 October 1992; pp. 182–186. [Google Scholar]
  17. Lowe, D. Distinctive image features from scale-invariant keypoints. Int. J. Comput. Vis. 2004, 20, 91–110. [Google Scholar] [CrossRef]
  18. Ke, Y.; Sukthankar, R.; Society, I.C. PCA-SIFT: A More Distinctive Representation for Local Image Descriptors. In Proceedings of the 2004 IEEE Computer Society Conference on Computer Vision and Pattern Recognition (CVPR 2004), Washington, DC, USA, 27 June–2 July 2004; pp. 506–513. [Google Scholar]
  19. Bay, H.; Tuytelaars, T.; Gool, L.V. SURF: Speeded Up Robust Features. In Proceedings of the 9th European Conference on Computer Vision (ECCV 2006), Graz, Austria, 7–13 May 2006; pp. 404–417. [Google Scholar]
  20. Morel, J.M.; Yu, G. ASIFT: A new framework for fully affine invariant image comparison. SIAM J. Imaging Sci. 2009, 2, 438–469. [Google Scholar] [CrossRef]
  21. Sedaghat, A.; Mokhtarzade, M.; Ebadi, H. Uniform robust scale-invariant feature matching for optical remote sensing images. IEEE Trans. Geosci. Remote Sens. 2011, 49, 4516–4527. [Google Scholar] [CrossRef]
  22. Sedaghat, A.; Ebadi, H. Remote sensing image matching based on adaptive binning SIFT descriptor. IEEE Trans. Geosci. Remote Sens. 2015, 53, 5283–5293. [Google Scholar] [CrossRef]
  23. Fan, B.; Huo, C.L.; Pan, C.H.; Kong, Q.Q. Registration of optical and SAR satellite images by exploring the spatial relationship of the improved SIFT. IEEE Trans. Geosci. Remote Sens. Lett. 2013, 10, 657–661. [Google Scholar] [CrossRef] [Green Version]
  24. Gong, M.; Zhao, S.; Jiao, L.; Tian, D.; Wang, S. A novel coarse-to-fine scheme for automatic image registration based on SIFT and mutual information. IEEE Trans. Geosci. Remote Sens. 2014, 52, 4328–4338. [Google Scholar] [CrossRef]
  25. Dellinger, F.; Delon, J.; Gousseau, Y.; Michel, J.; Tupin, F. SAR-SIFT: A SIFT-like algorithm for SAR images. IEEE Trans. Geosci. Remote Sens. 2015, 53, 453–466. [Google Scholar] [CrossRef] [Green Version]
  26. Ma, W.; Wen, Z.; Wu, Y.; Jiao, L.; Gong, M.; Zheng, Y.; Liu, L. Remote sensing image registration with modified SIFT and enhanced feature matching. IEEE Geosci. Remote Sens. Lett. 2017, 14, 3–7. [Google Scholar] [CrossRef]
  27. Paul, S.; Pati, U.C. A Gabor odd filter-based ratio operator for SAR image matching. IEEE Trans. Geosci. Remote Sens. Lett. 2019, 16, 397–401. [Google Scholar] [CrossRef]
  28. Xiang, Y.; Wang, F.; You, H. OS-SIFT: A robust SIFT-like algorithm for high-resolution optical-to-SAR image registration in suburban areas. IEEE Trans. Geosci. Remote Sens. 2018, 56, 3078–3090. [Google Scholar] [CrossRef]
  29. Govindaraj, P.; Sudhakar, M.S. A new 2D shape retrieval scheme based on phase congruency and histogram of oriented gradients. Sig. Image Video Process. 2019, 13, 771–778. [Google Scholar] [CrossRef]
  30. Jiang, S.; Wang, B.N.; Zhu, X.Y.; Xiang, M.S.; Fu, X.K.; Sun, X.F. Registration of SAR and Optical Images by Weighted SIFT Based on Phase Congruency. In Proceedings of the IEEE International Geoscience and Remote Sensing Symposium (IGARSS 2018), Valencia, Spain, 22–27 July 2018; pp. 8885–8888. [Google Scholar]
  31. Cui, S.; Zhong, Y.F. Multi-Modal Remote Sensing Image Registration Based on Multi-Scale Phase Congruency. In Proceedings of the 10th IAPR Workshop on Pattern Recognition in Remote Sensing (PRRS 2018), Beijing, China, 19–20 August 2018; pp. 1–5. [Google Scholar]
  32. Ragb, H.K.; Asari, V.K. Histogram of oriented phase (HOP): A new descriptor based on phase congruency. In Mobile Multimedia/Image Processing, Security, and Applications 2016; SPIE: Bellingham, WA, USA, 19 May 2016; p. 98690V1-10. [Google Scholar]
  33. Ye, Y.; Shan, J.; Bruzzone, L.; Shen, L. Robust registration of multimodal remote sensing images based on structural similarity. IEEE Trans. Geosci. Remote Sens. 2017, 55, 2941–2958. [Google Scholar] [CrossRef]
  34. Ye, Y.; Shan, J.; Hao, S.; Bruzzone, L.; Qin, Y. A local phase based invariant feature for remote sensing image matching. ISPRS J. Photogramm. Remote Sens. 2018, 142, 205–221. [Google Scholar] [CrossRef]
  35. Chen, M.; Habib, A.; He, H.Q.; Zhu, Q.; Zhang, W. Robust feature matching method for SAR and optical images by using Gaussian-gamma-shaped Bi-windows-based descriptor and geometric constraint. Remote Sens. 2017, 9, 25. [Google Scholar] [CrossRef] [Green Version]
  36. Paul, S.; Pati, U.C. Automatic optical-to-SAR image registration using a structural descriptor. IET Image Process. 2020, 14, 62–73. [Google Scholar] [CrossRef]
  37. Fu, Z.; Qin, Q.; Luo, B.; Sun, H.; Wu, C. HOMPC: A local feature descriptor based on the combination of magnitude and phase congruency information for multi-sensor remote sensing images. Remote Sens. 2018, 10, 1234. [Google Scholar] [CrossRef] [Green Version]
  38. Fan, J.W.; Wu, Y.; Li, M.; Liang, W.K.; Cao, Y.C. SAR and optical image registration using nonlinear diffusion and phase congruency structural descriptor. IEEE Trans. Geosci. Remote Sens. 2018, 56, 5368–5379. [Google Scholar] [CrossRef]
  39. Li, J.; Hu, Q.; Ai, M. RIFT: Multi-modal image matching based on radiation-variation insensitive feature transform. IEEE Trans. Image Process. 2020, 29, 3296–3310. [Google Scholar] [CrossRef]
  40. Ye, Y.; Li, S. HOPC: A Novel Similarity Metric Based on Geometric Structural Properties for Multi-Modal Remote Sensing Image Matching. In Proceedings of the ISPRS Annals of the Photogrammetry, Remote Sensing and Spatial Information Sciences, Prague, Czech Republic, 12–19 July 2016; pp. 1–18. [Google Scholar]
  41. Kovesi, P. Image features from phase congruency. J. Comput. Vis. Res. 1999, 1, 1–26. [Google Scholar]
  42. Kovesi, P. Phase Congruency Detects Corners and Edges. In Proceedings of the International Conference on Digital Image Computing: Techniques and Applications (DICTA 2003), Macquarie University, Sydney, Australia, 10–12 December 2003; pp. 309–318. [Google Scholar]
  43. Wu, Y.; Ma, W.; Gong, M.; Su, L.; Jiao, L. A novel point-matching algorithm based on fast sample consensus for image registration. IEEE Geosci. Remote Sens. 2015, 12, 43–47. [Google Scholar] [CrossRef]
Figure 1. Comparison results of keypoints detection in optical and synthetic aperture radar (SAR) images (top row depicts the optical image, and bottom row depicts SAR images). (a) Original images; (b) Harris on the original images; (c) Harris on the minimum moment of the phase congruency map (PCM); (d) Harris on the maximum moment of the PCM.
Remotesensing 12 03339 g001
Figure 2. Main process of UMPC-Harris detector.
Remotesensing 12 03339 g002
Figure 3. Construction process of four-scale maximum index maps (MIMs).
Remotesensing 12 03339 g003
Figure 4. Calculation process of PC orientation.
Remotesensing 12 03339 g004
Figure 5. Main processing chain of proposed HOSMI descriptor.
Remotesensing 12 03339 g005
Figure 6. Comparison of similarity of feature vector between a pair of corresponding points in optical and SAR images. (a) Optical image; (b) Feature vector of the optical keypoint; (c) SAR image; (d) Feature vector of the SAR keypoint.
Remotesensing 12 03339 g006
Figure 7. High-resolution (HR) optical images. (a) Group 1; (b) Group 2; (c) Group 3.
Remotesensing 12 03339 g007
Figure 8. Simulated images. (a) Group 1 HR optical image; (b) Group 1 simulated optical image; (c) Group 1 simulated SAR image (five-look); (d) Group 2 HR optical image; (e) Group 2 simulated optical image; (f) Group 2 simulated SAR image (five-look); (g) Group 3 HR optical image; (h) Group 3 simulated optical image; (i) Group 3 simulated SAR image (five-look).
Remotesensing 12 03339 g008
Figure 9. Repeatability rate with different SAR noise level. (a) Group 1; (b) Group 2; (c) Group 3.
Remotesensing 12 03339 g009
Figure 10. Results of original image and non-uniform radiometric differences.
Remotesensing 12 03339 g010
Figure 11. Comparison of keypoint detection. (a) Harris; (b) SAR-Harris; (c) m+M-Harris; (d) UMPC-Harris.
Remotesensing 12 03339 g011
Figure 12. Corner detection results of UMPC-Harris. (a) Optical image; (b) SAR image; (c) UMPC-Harris on optical image; (d) UMPC-Harris on SAR image.
Remotesensing 12 03339 g012
Figure 13. Eight pairs of test images and enlarged view of the main features. (a) Pair A; (b) Pair B; (c) Pair C; (d) Pair D; (e) Pair E; (f) Pair F; (g) Pair G; (h) Pair H.
Remotesensing 12 03339 g013aRemotesensing 12 03339 g013b
Figure 14. Registration results of Pair A. (a) OS-SIFT; (b) (RIFT); (c) ROS-PC.
Remotesensing 12 03339 g014
Figure 15. Registration results of Pair B. (a) OS-SIFT; (b) RIFT; (c) ROS-PC.
Remotesensing 12 03339 g015
Figure 16. Registration results of Pair C. (a) OS-SIFT; (b) RIFT; (c) ROS-PC.
Remotesensing 12 03339 g016
Figure 17. Registration results of Pair D. (a) OS-SIFT; (b) RIFT; (c) ROS-PC.
Remotesensing 12 03339 g017
Figure 18. Registration results of Pair E. (a) OS-SIFT; (b) RIFT; (c) ROS-PC.
Remotesensing 12 03339 g018
Figure 19. Registration results of Pair F. (a) OS-SIFT; (b) RIFT; (c) ROS-PC.
Remotesensing 12 03339 g019
Figure 20. Registration results of Pair G. (a) OS-SIFT; (b) RIFT; (c) ROS-PC.
Remotesensing 12 03339 g020
Figure 21. Registration results of Pair H. (a) OS-SIFT; (b) RIFT; (c) ROS-PC.
Remotesensing 12 03339 g021
Figure 22. Checkboard mosaic images and enlarged sub-images of ROS-PC. (a) Pair A; (b) Pair B; (c) Pair C; (d) Pair D; (e) Pair E; (f) Pair F; (g) Pair G; (h) Pair H.
Remotesensing 12 03339 g022
Figure 23. Registration results of optical and SAR images with different rotation angles (degree). (a) −12°, (b) −9°, (c) −6°, (d) −3°, (e) 0°, (f) 4°, (g) 8°, (h) 12°, and (i) 16°.
Remotesensing 12 03339 g023
Figure 24. Registration results of optical and SAR images with different scales. (a) 0.6, (b) 0.7, (c) 0.8, (d) 0.9, (e) 1.0, (f) 1.1, (g) 1.2, (h) 1.3, and (i) 1.4.
Remotesensing 12 03339 g024
Table 1. Repeatability rate of the detectors on the images with non-uniform radiometric differences.
MethodHarrisSAR-Harrism+M-HarrisUMPC-Harris
Repeatability (%)59.9871.8368.8090.96
Table 2. Information for the test images.
PairSensorResolutionDateSize (Pixel)
AGoogle Earth1 m 9 October 2012923 × 704
TerraSAR-X1 m 23 December 2010900 × 795
BGoogle Earth1 m27 March 2020932 × 684
Airborne SAR1 mJune 2020867 × 740
CGoogle Earth3 m24 June 20201019 × 699
Airborne SAR3 m April 20181016 × 697
DGoogle Earth3 m 1 July 20171741 × 1075
Airborne SAR3 m April 20181744 × 1078
EGoogle Earth3.2 m 25 April 2020874 × 768
Airborne SAR4 m April 2018692 × 612
FGoogle Earth2.5 m 19 February 20201019 × 701
Airborne SAR2.5 m April 20181020 × 711
GGoogle Earth2.2 m19 February 2020968 × 662
Airborne SAR2.2 mApril 20181010 × 676
HGoogle Earth2.5 m19 February 2020858 × 758
Airborne SAR2.5 mApril 2018863 × 761
Table 3. Comparison of root mean square error (RMSE), number of correct matches (NCM), and time for different methods on eight pairs of test images.
MethodOS-SIFTRIFTROS-PC
Pair RMSENCMTime(s)RMSENCMTime(s)RMSENCMTime(s)
A1.85073052.842.29533910.41.93264173.46
B16.1443665.74---------2.82961777.36
C---------5.63341711.942.69613174.45
D4.8541981.122.65073324.331.67415897.49
E20.7450452.902.7754389.931.91163875.56
F22.2591567.624.61171913.581.77733074.12
G5.6215557.62.95632312.251.52643571.26
H------------------1.76123370.59
Table 4. NCM with different rotation angles.
Rotation Angle−12°−9°−6°−3°12°16°
NCM81928355832312015
Table 5. NCM with different scale factors.
Scale0.60.70.80.911.11.21.31.4
NCM162739555839231313
Publisher’s Note: MDPI stays neutral with regard to jurisdictional claims in published maps and institutional affiliations.

