The Use of SAR Offset Tracking for Detecting Sand Dune Movement in Sudan

 ,
,  , ,
, ,  , and
, and
Abstract
:1. Introduction
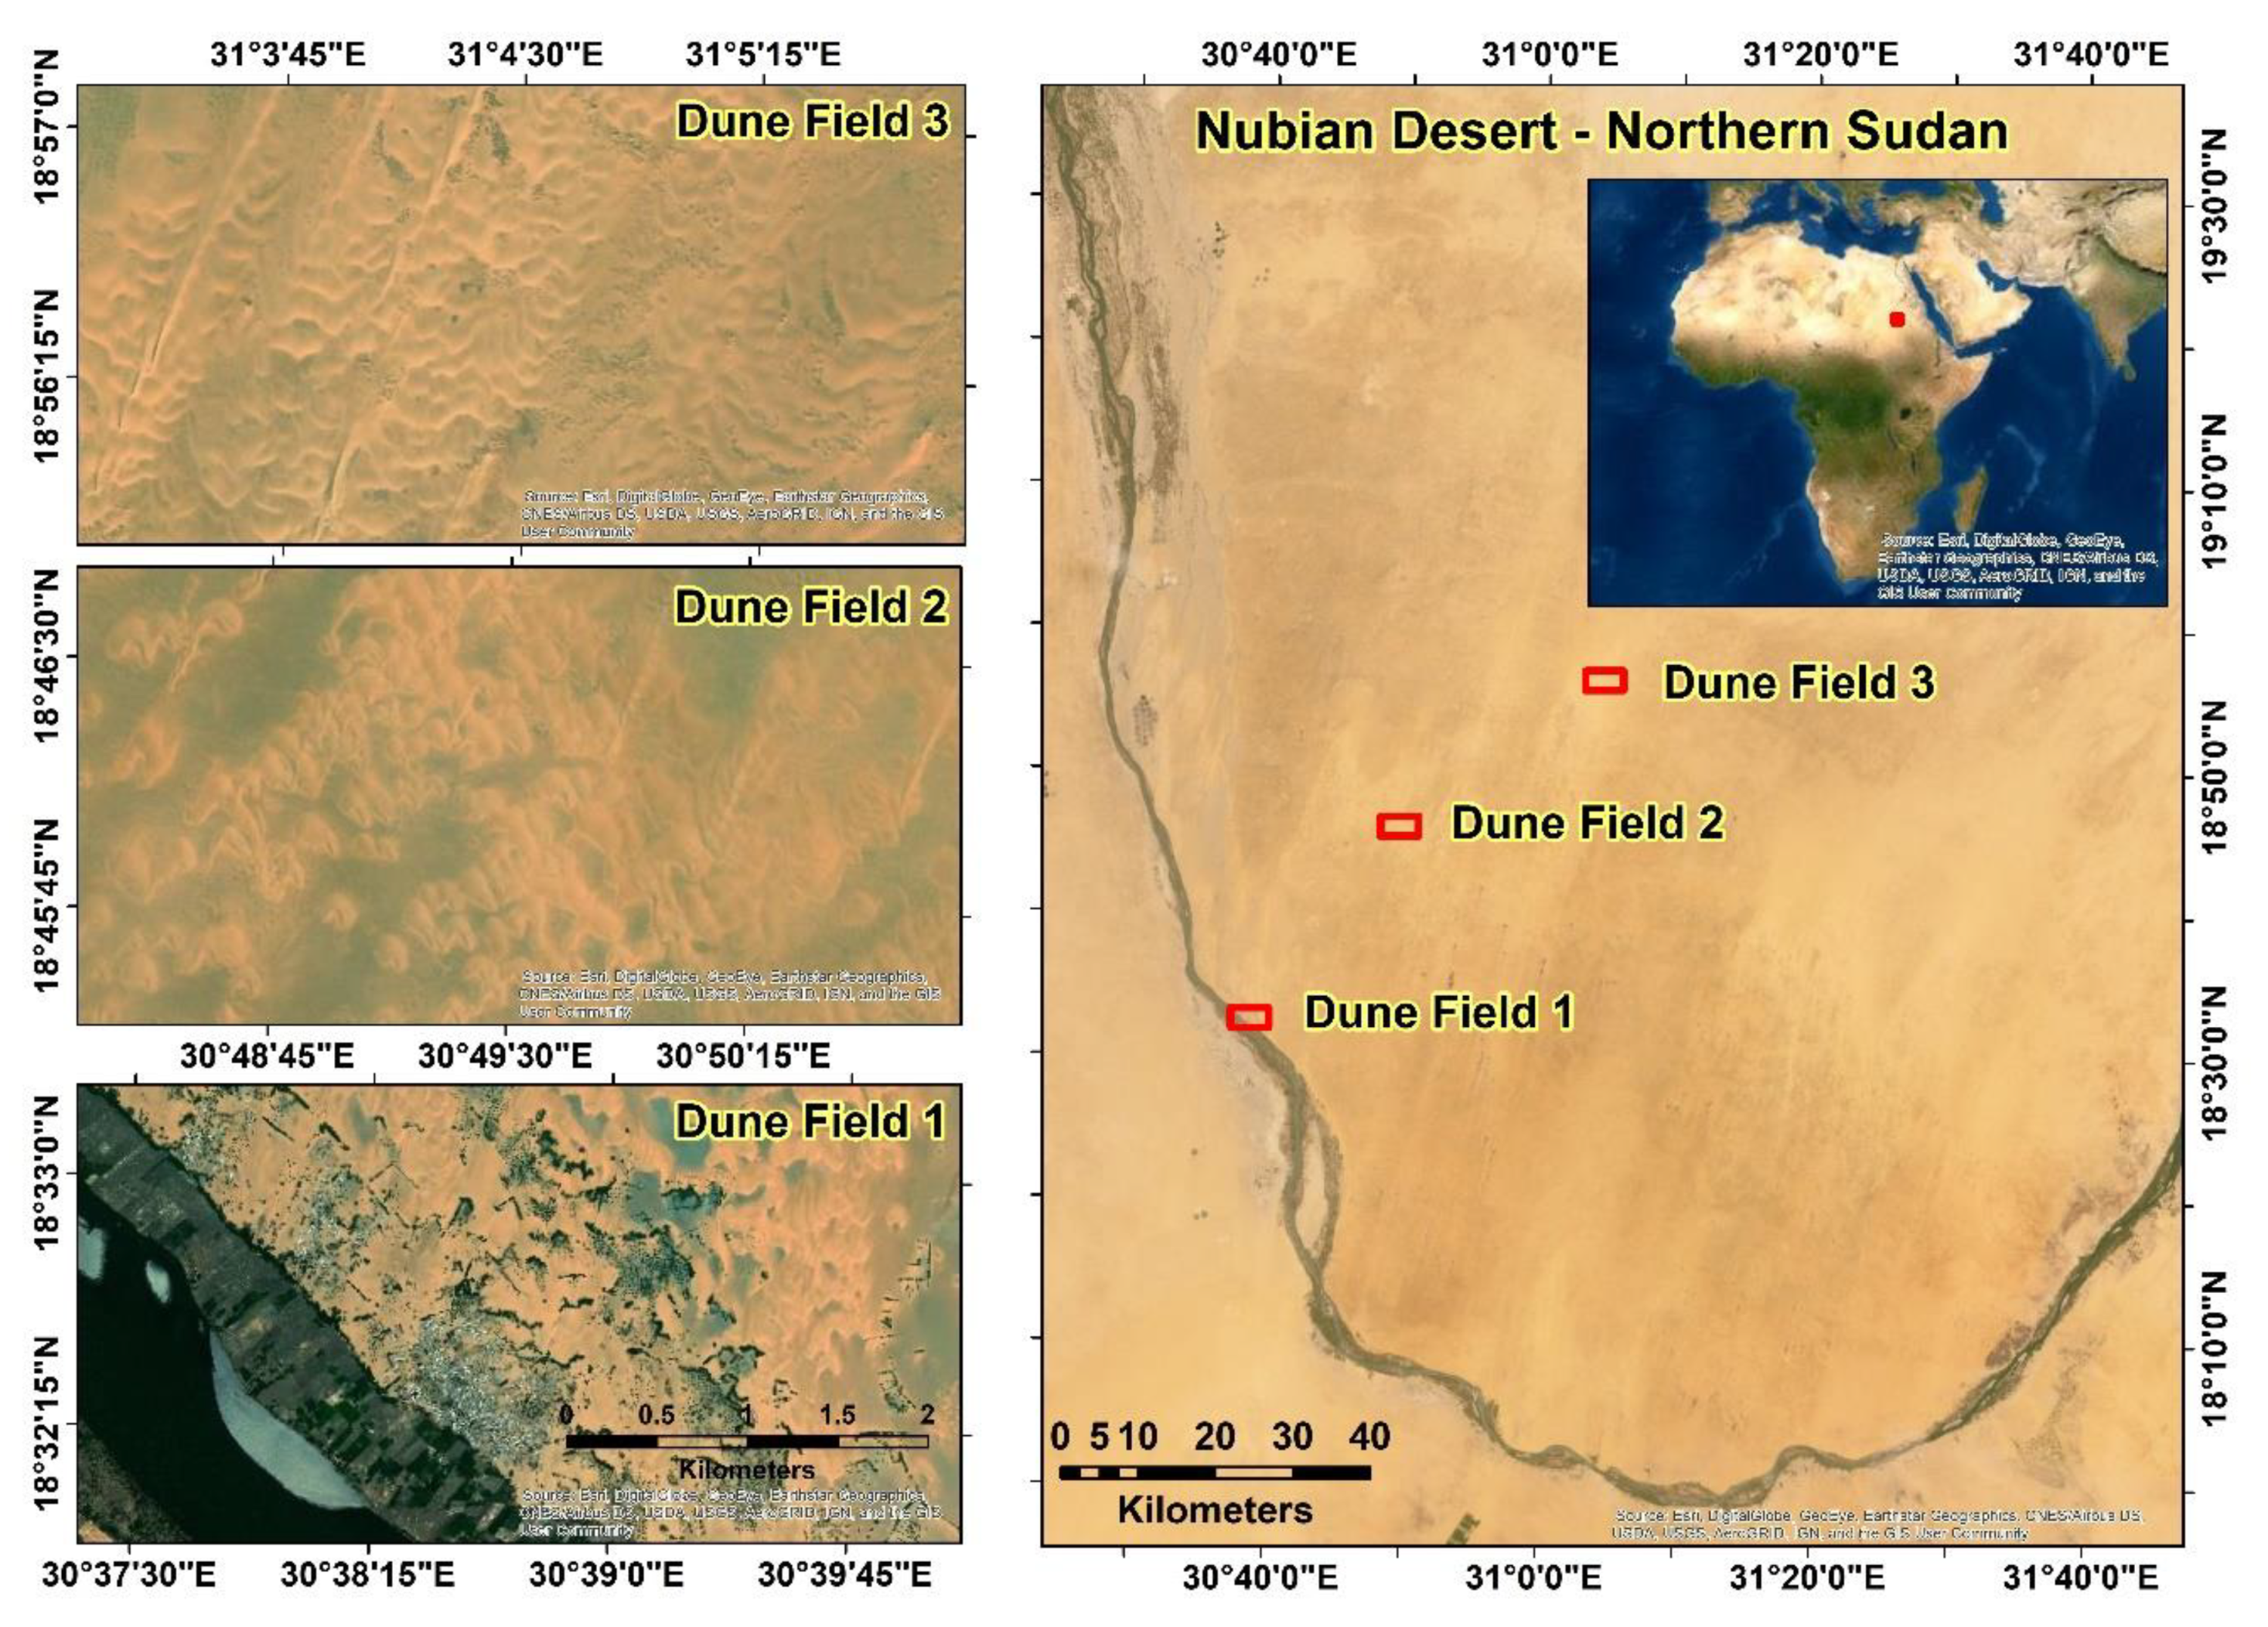
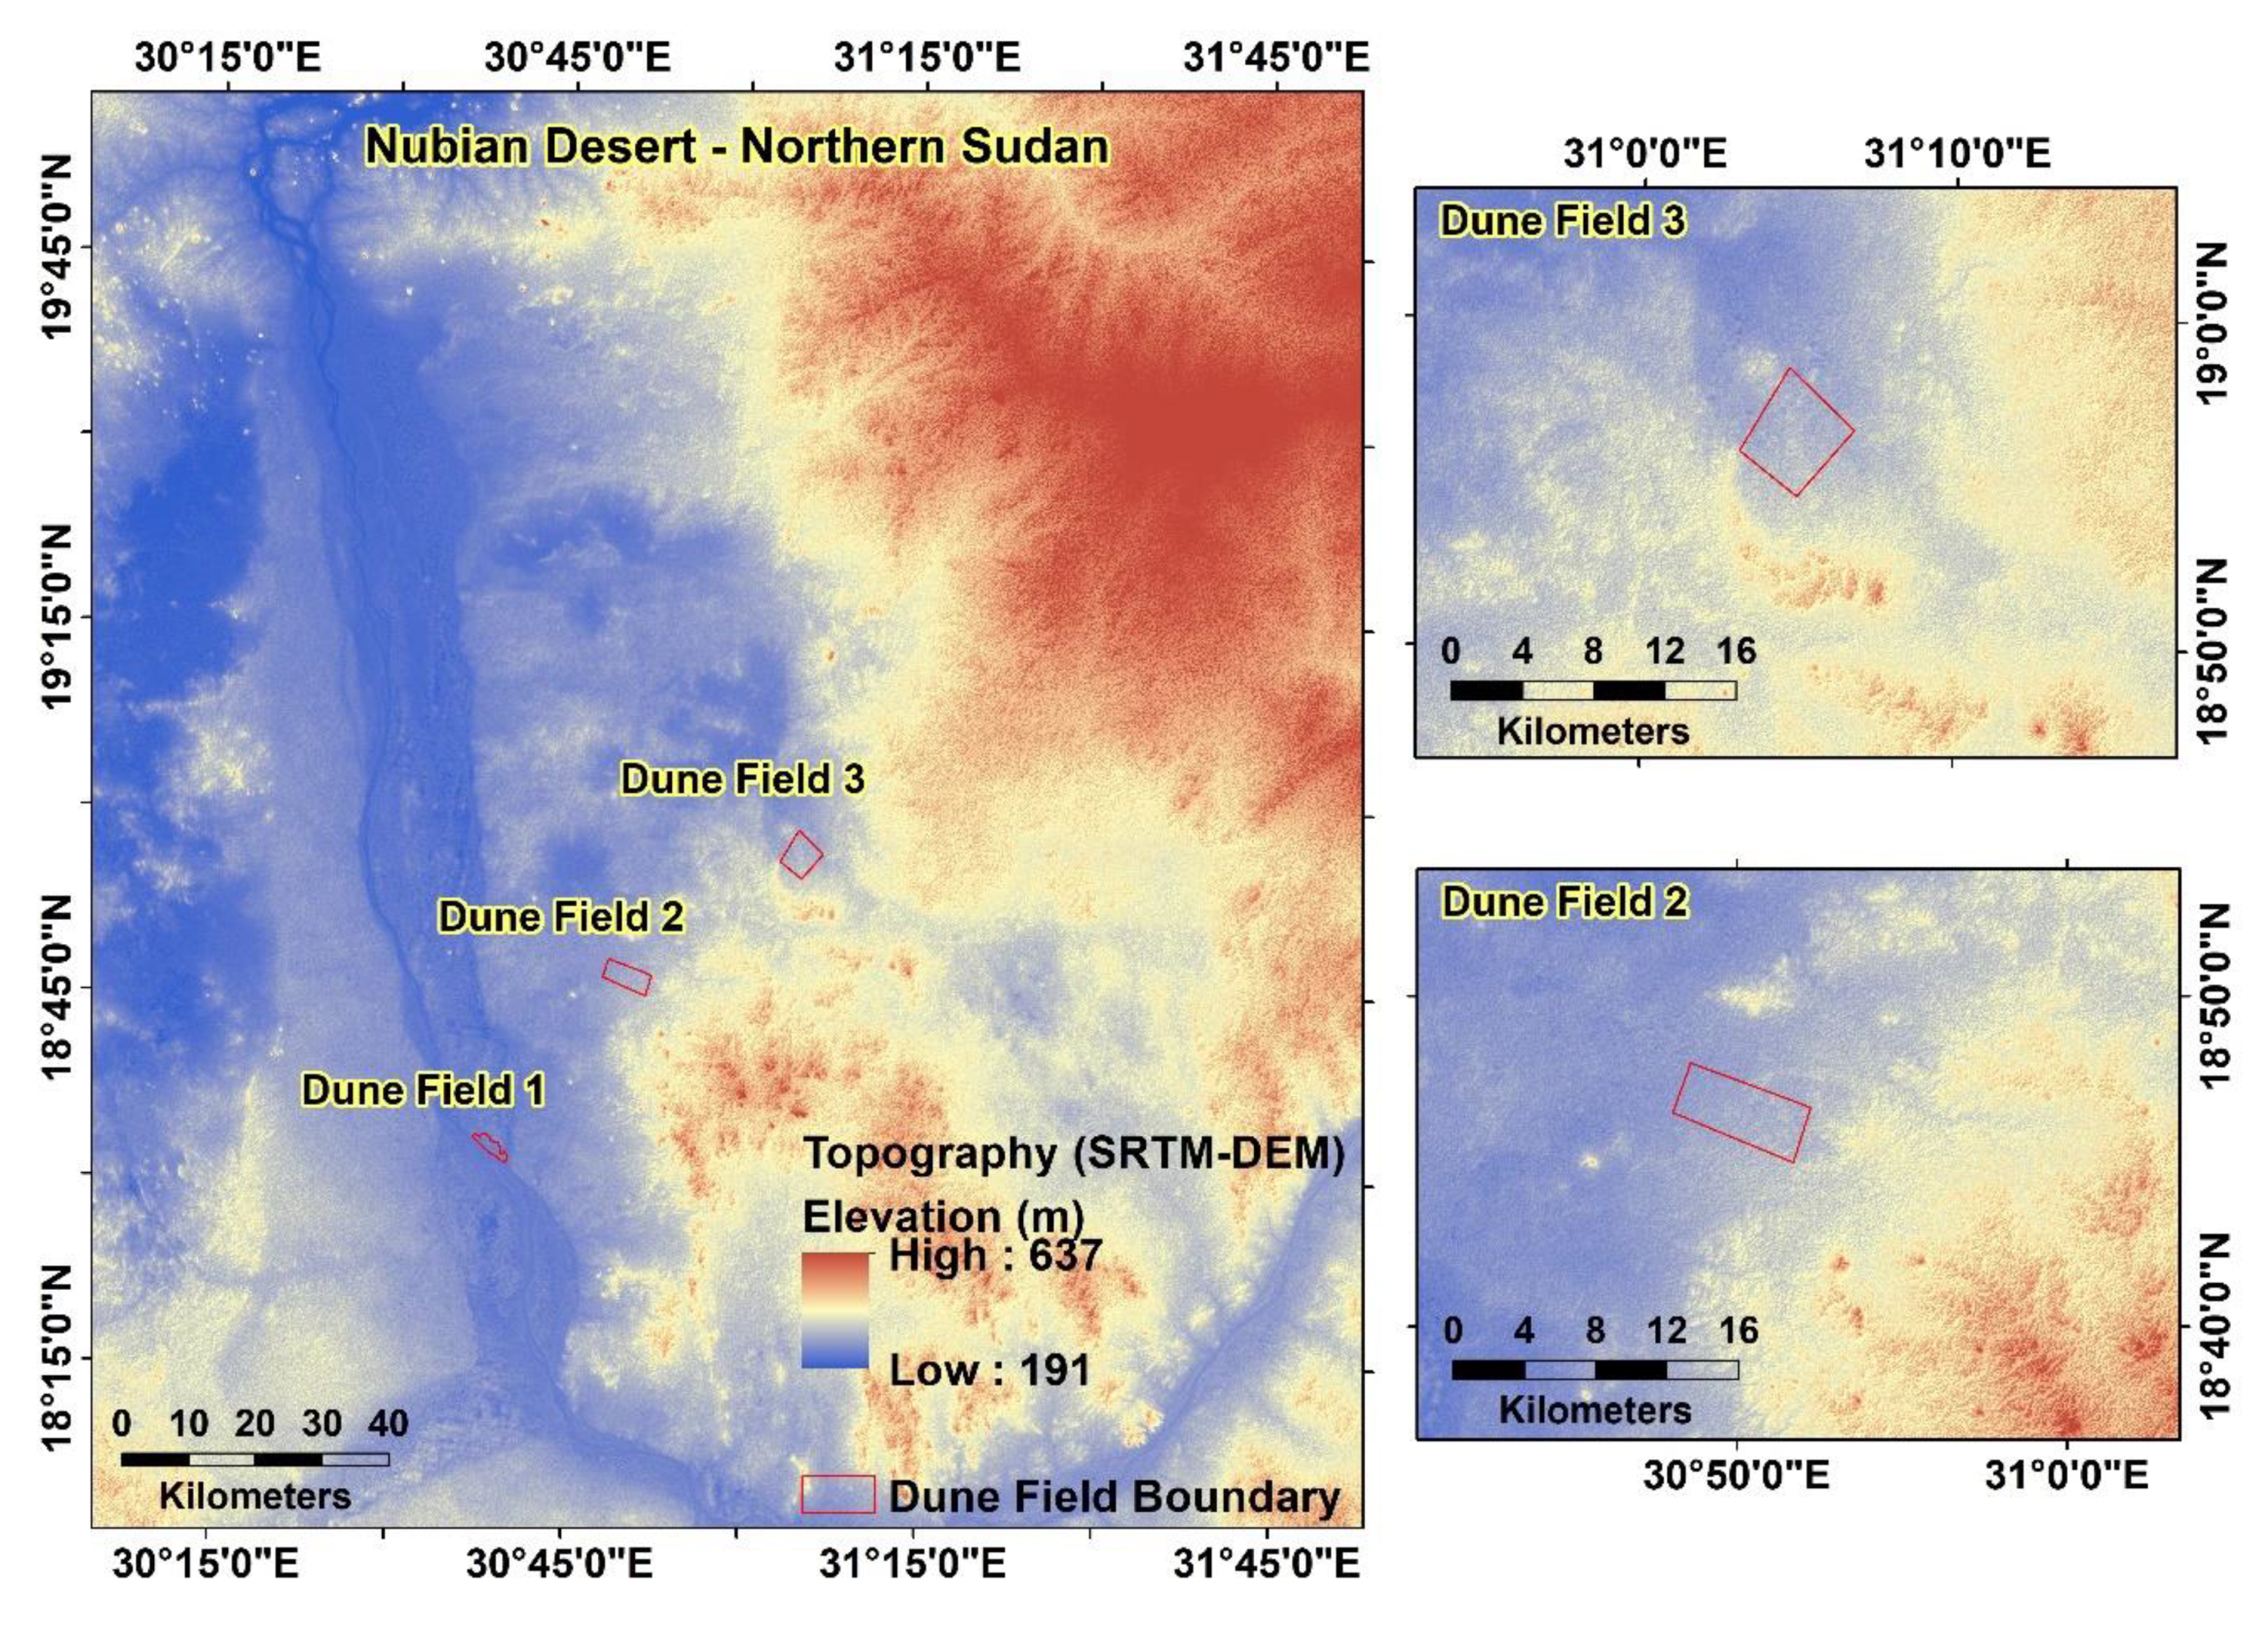
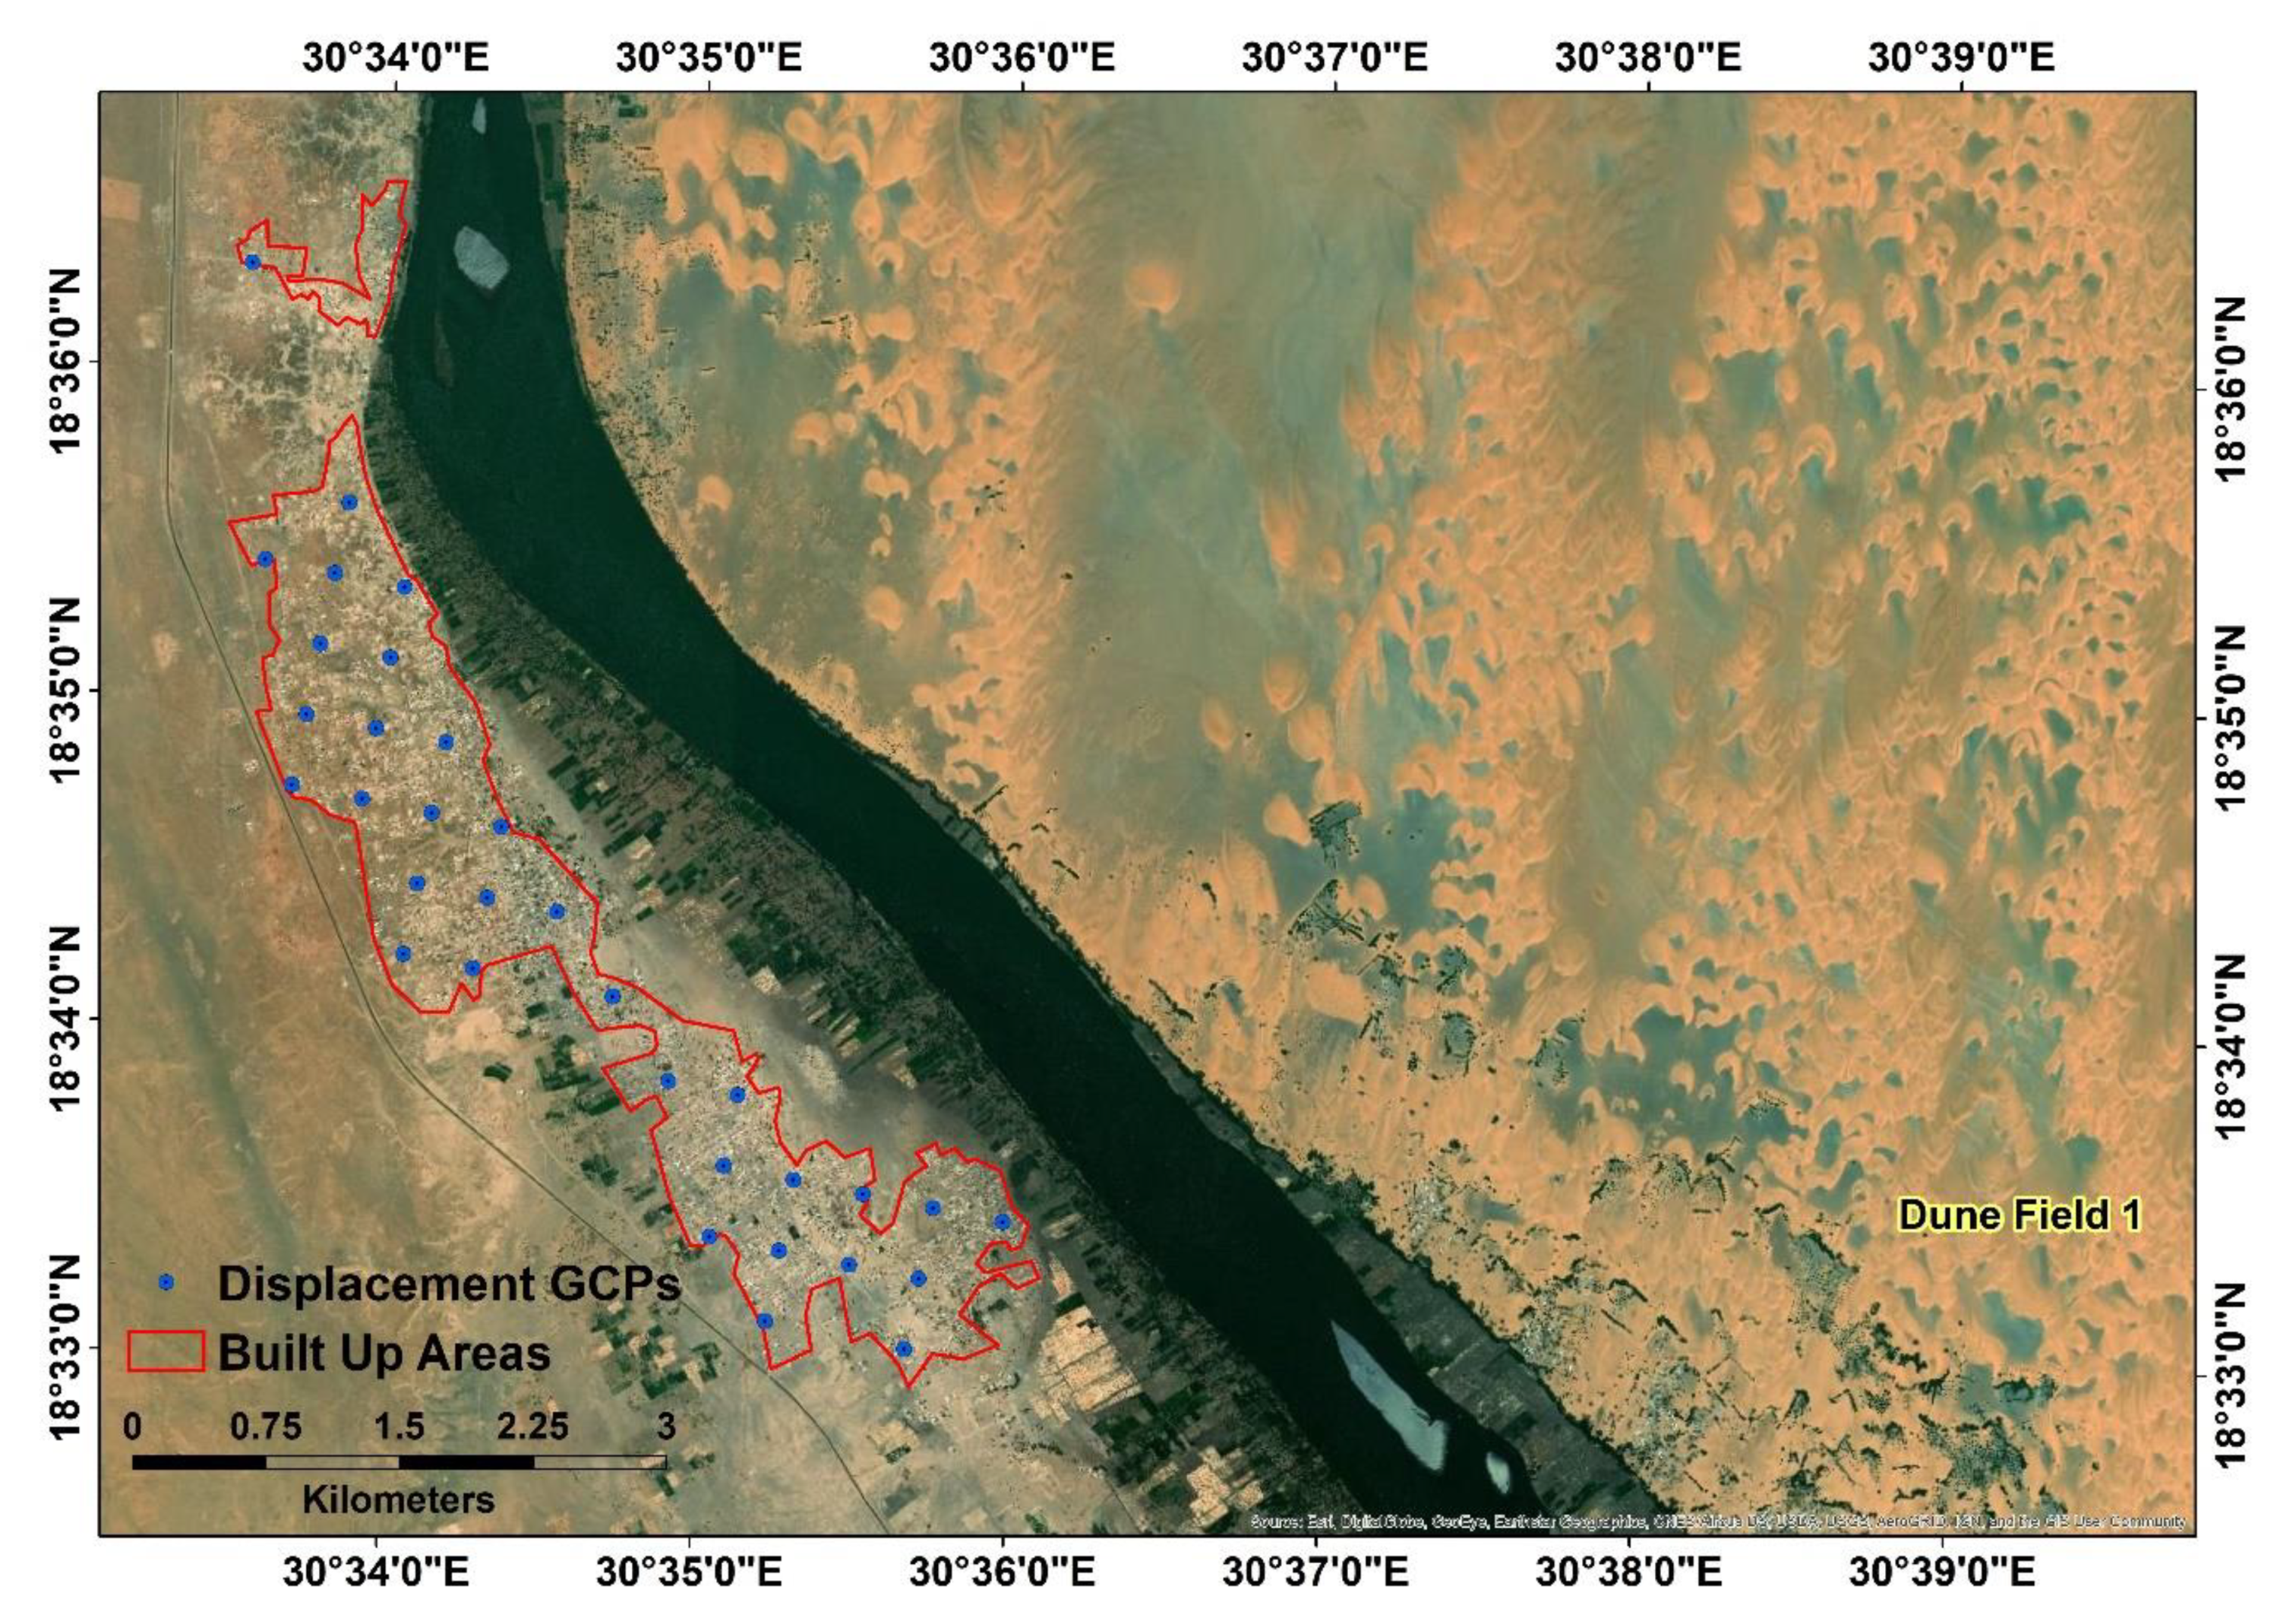
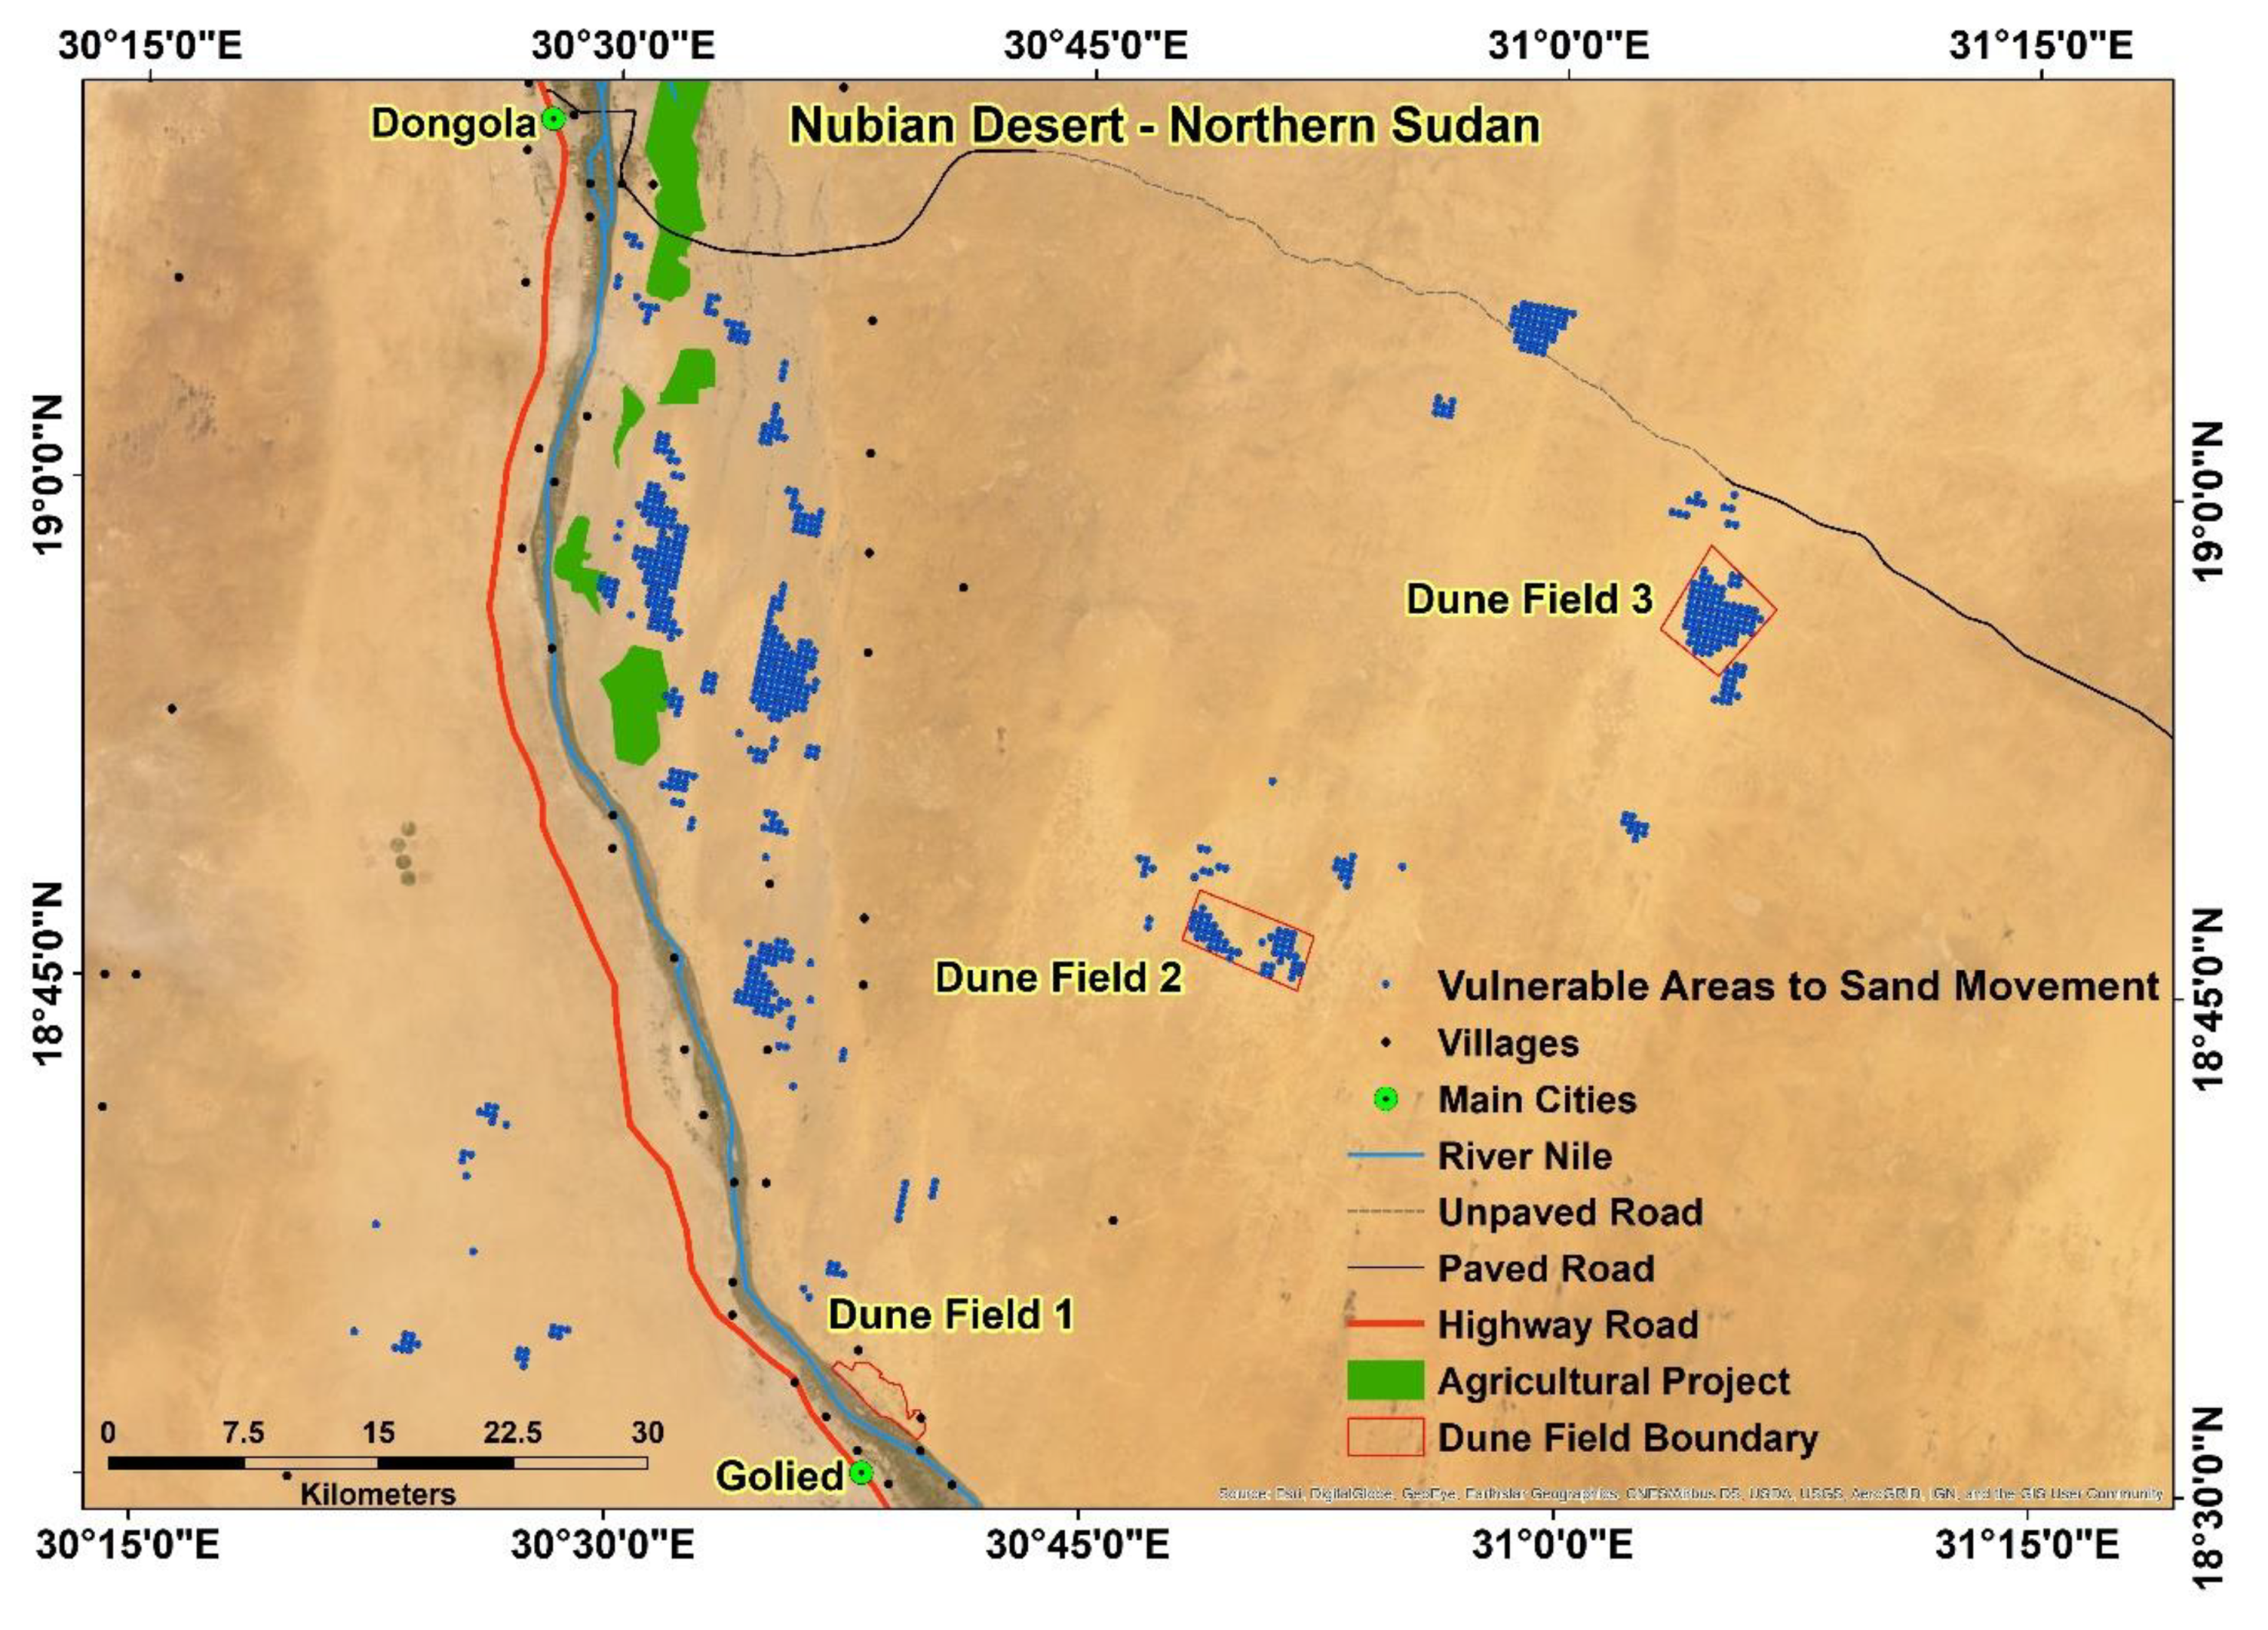
2. Study Area
3. Materials and Methods
3.1. Materials
3.1.1. SAR Images
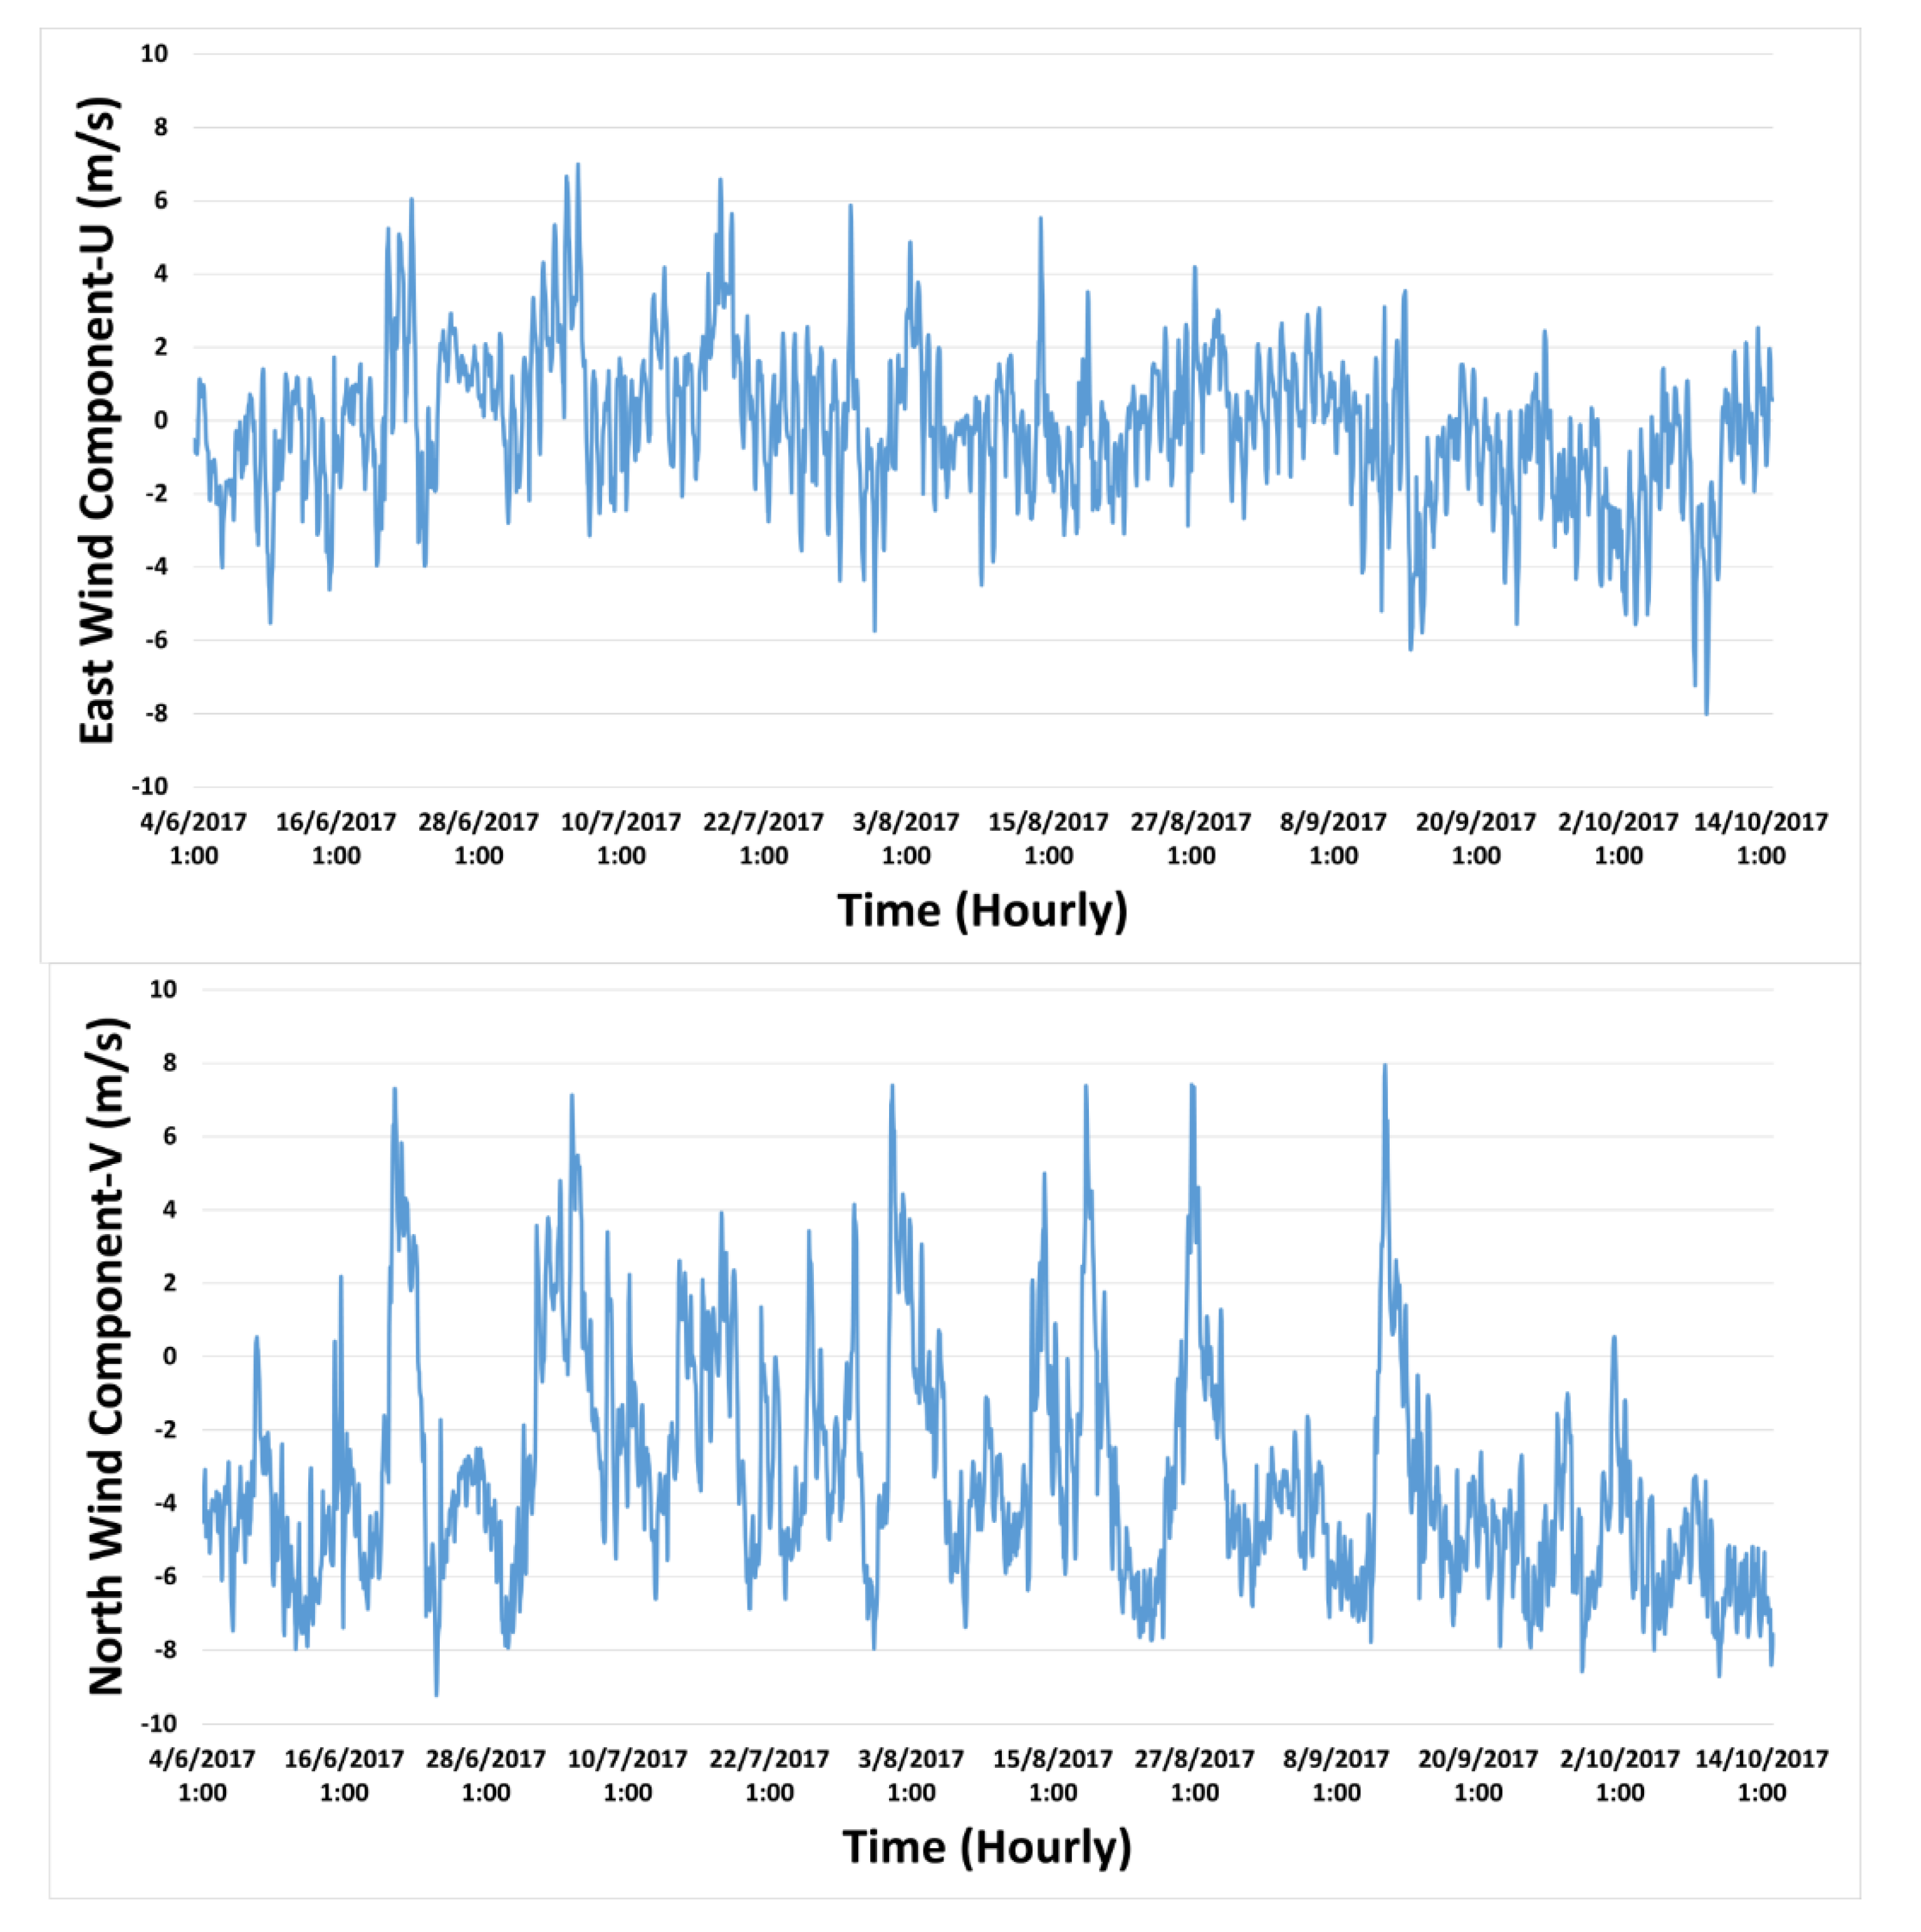
3.1.2. Wind Data
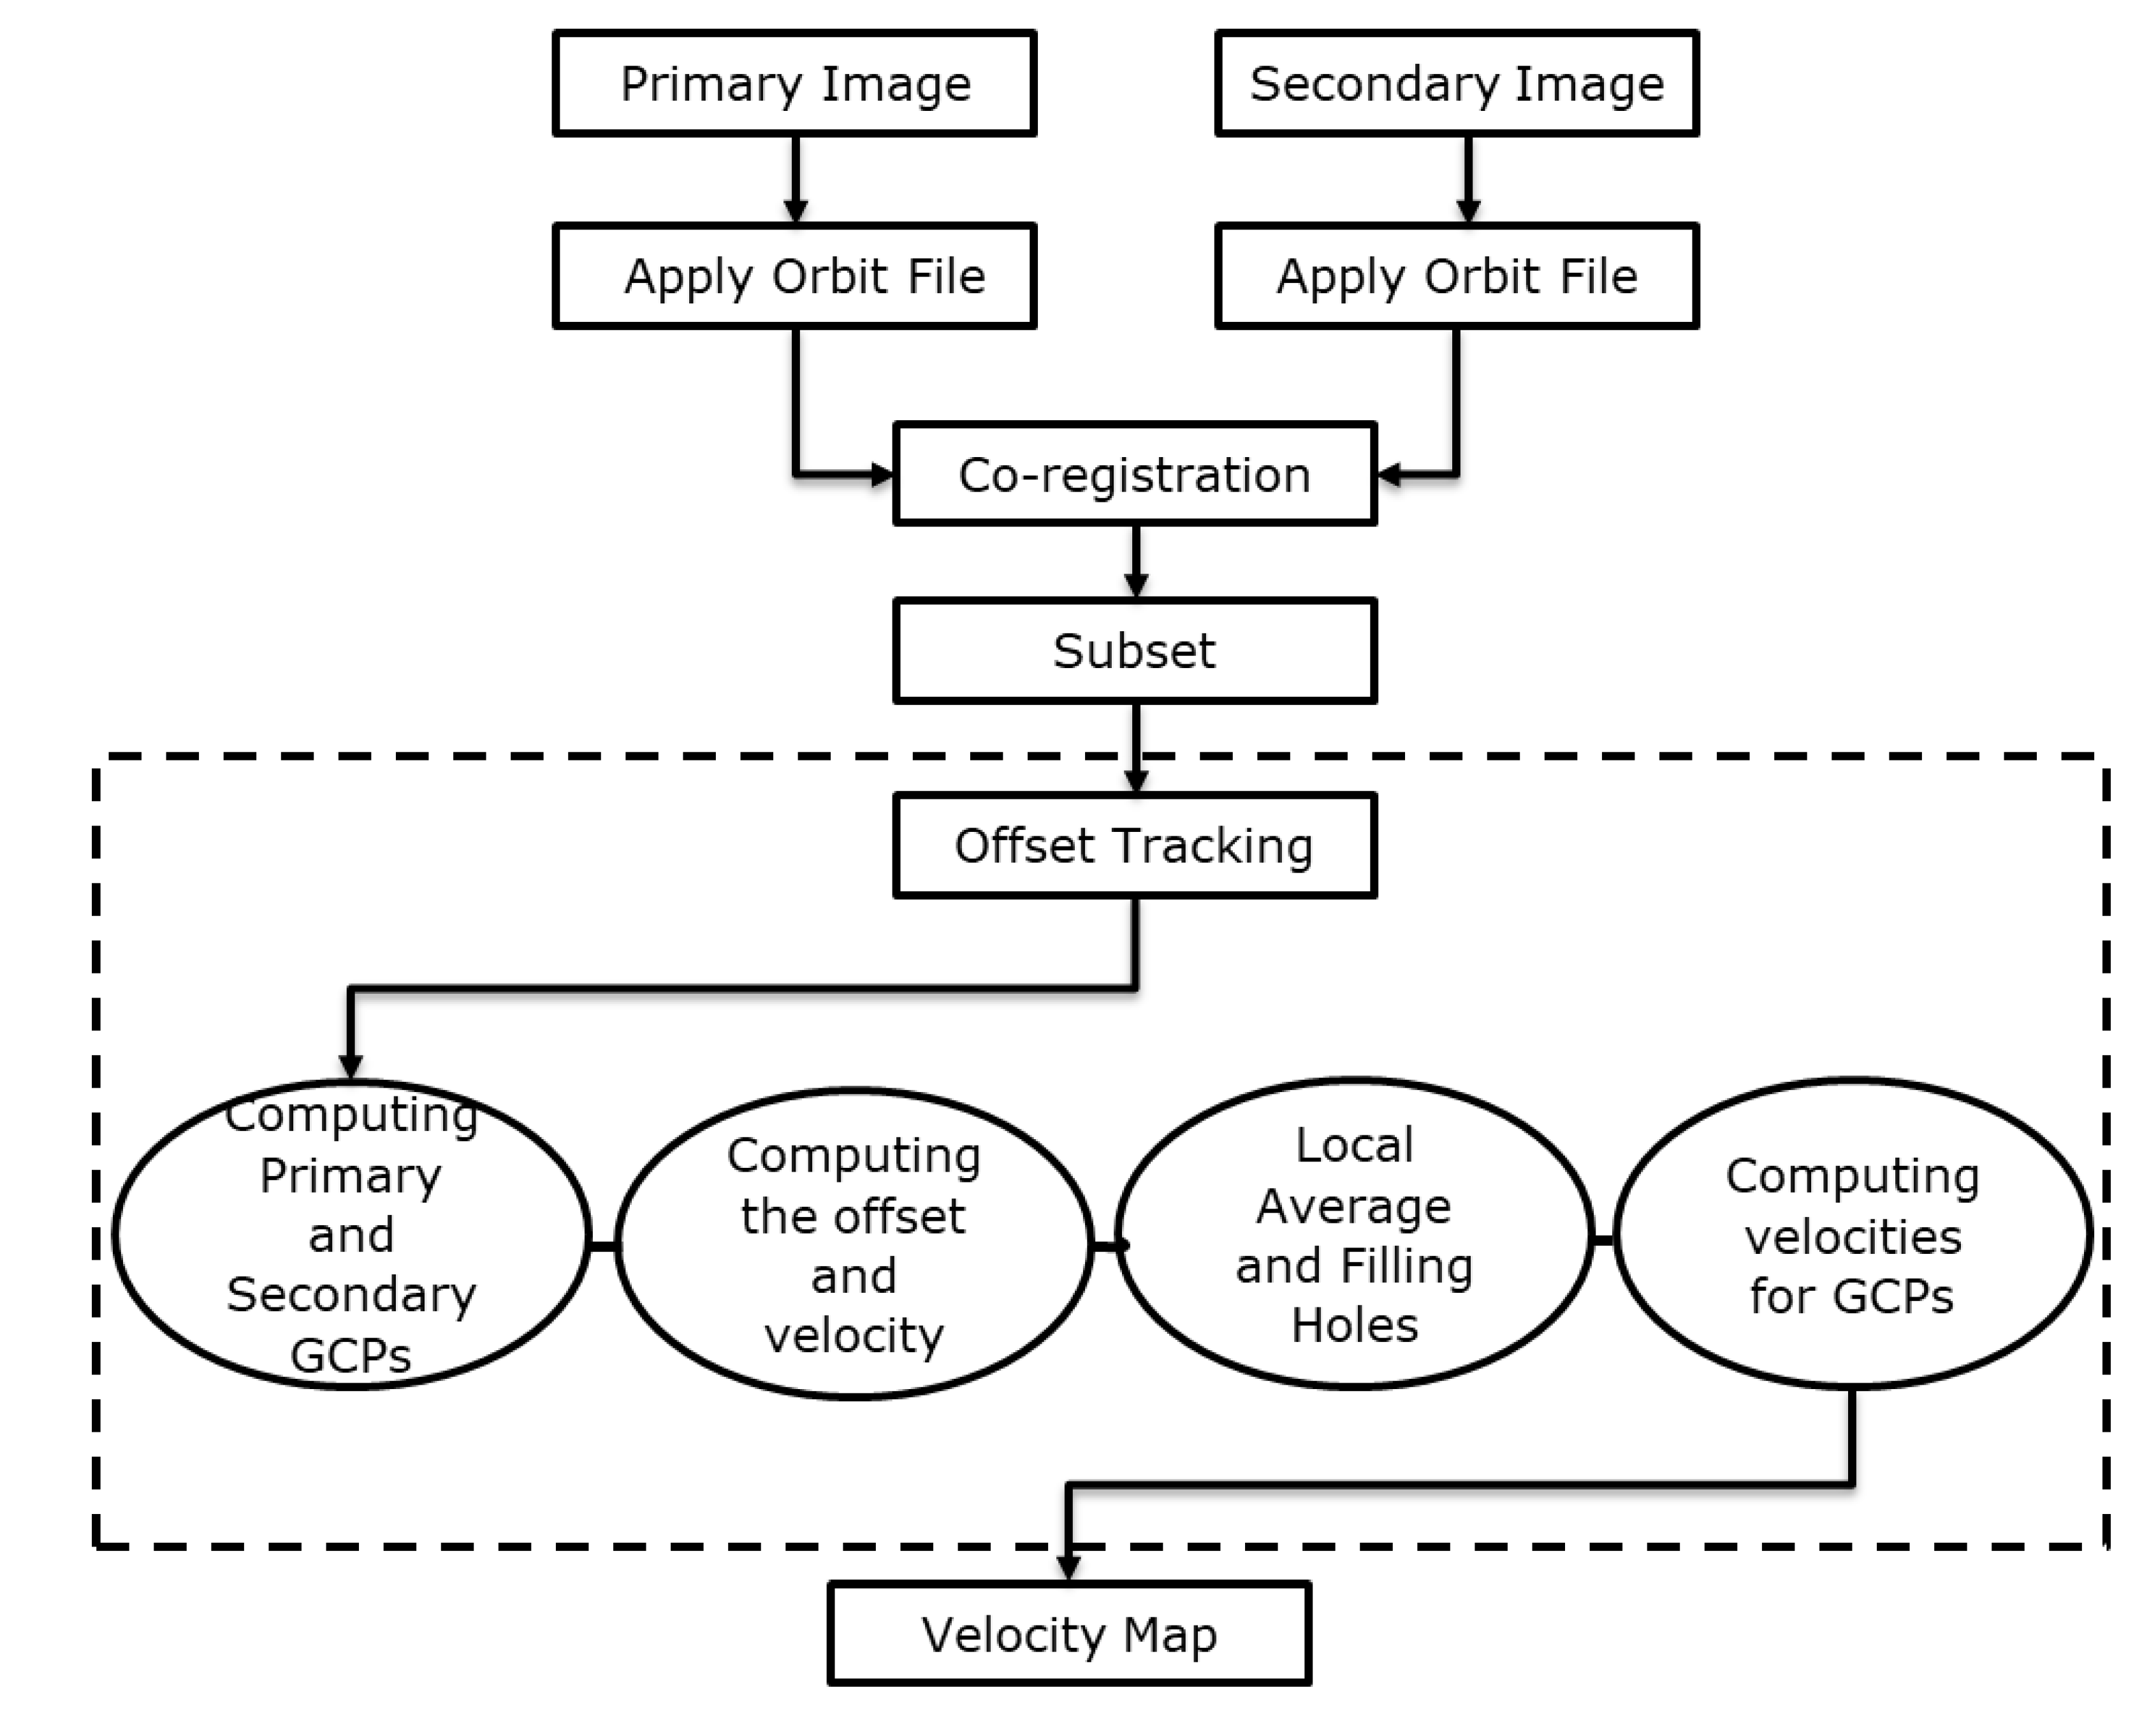
3.2. SAR Pixel Offset Method
4. Results
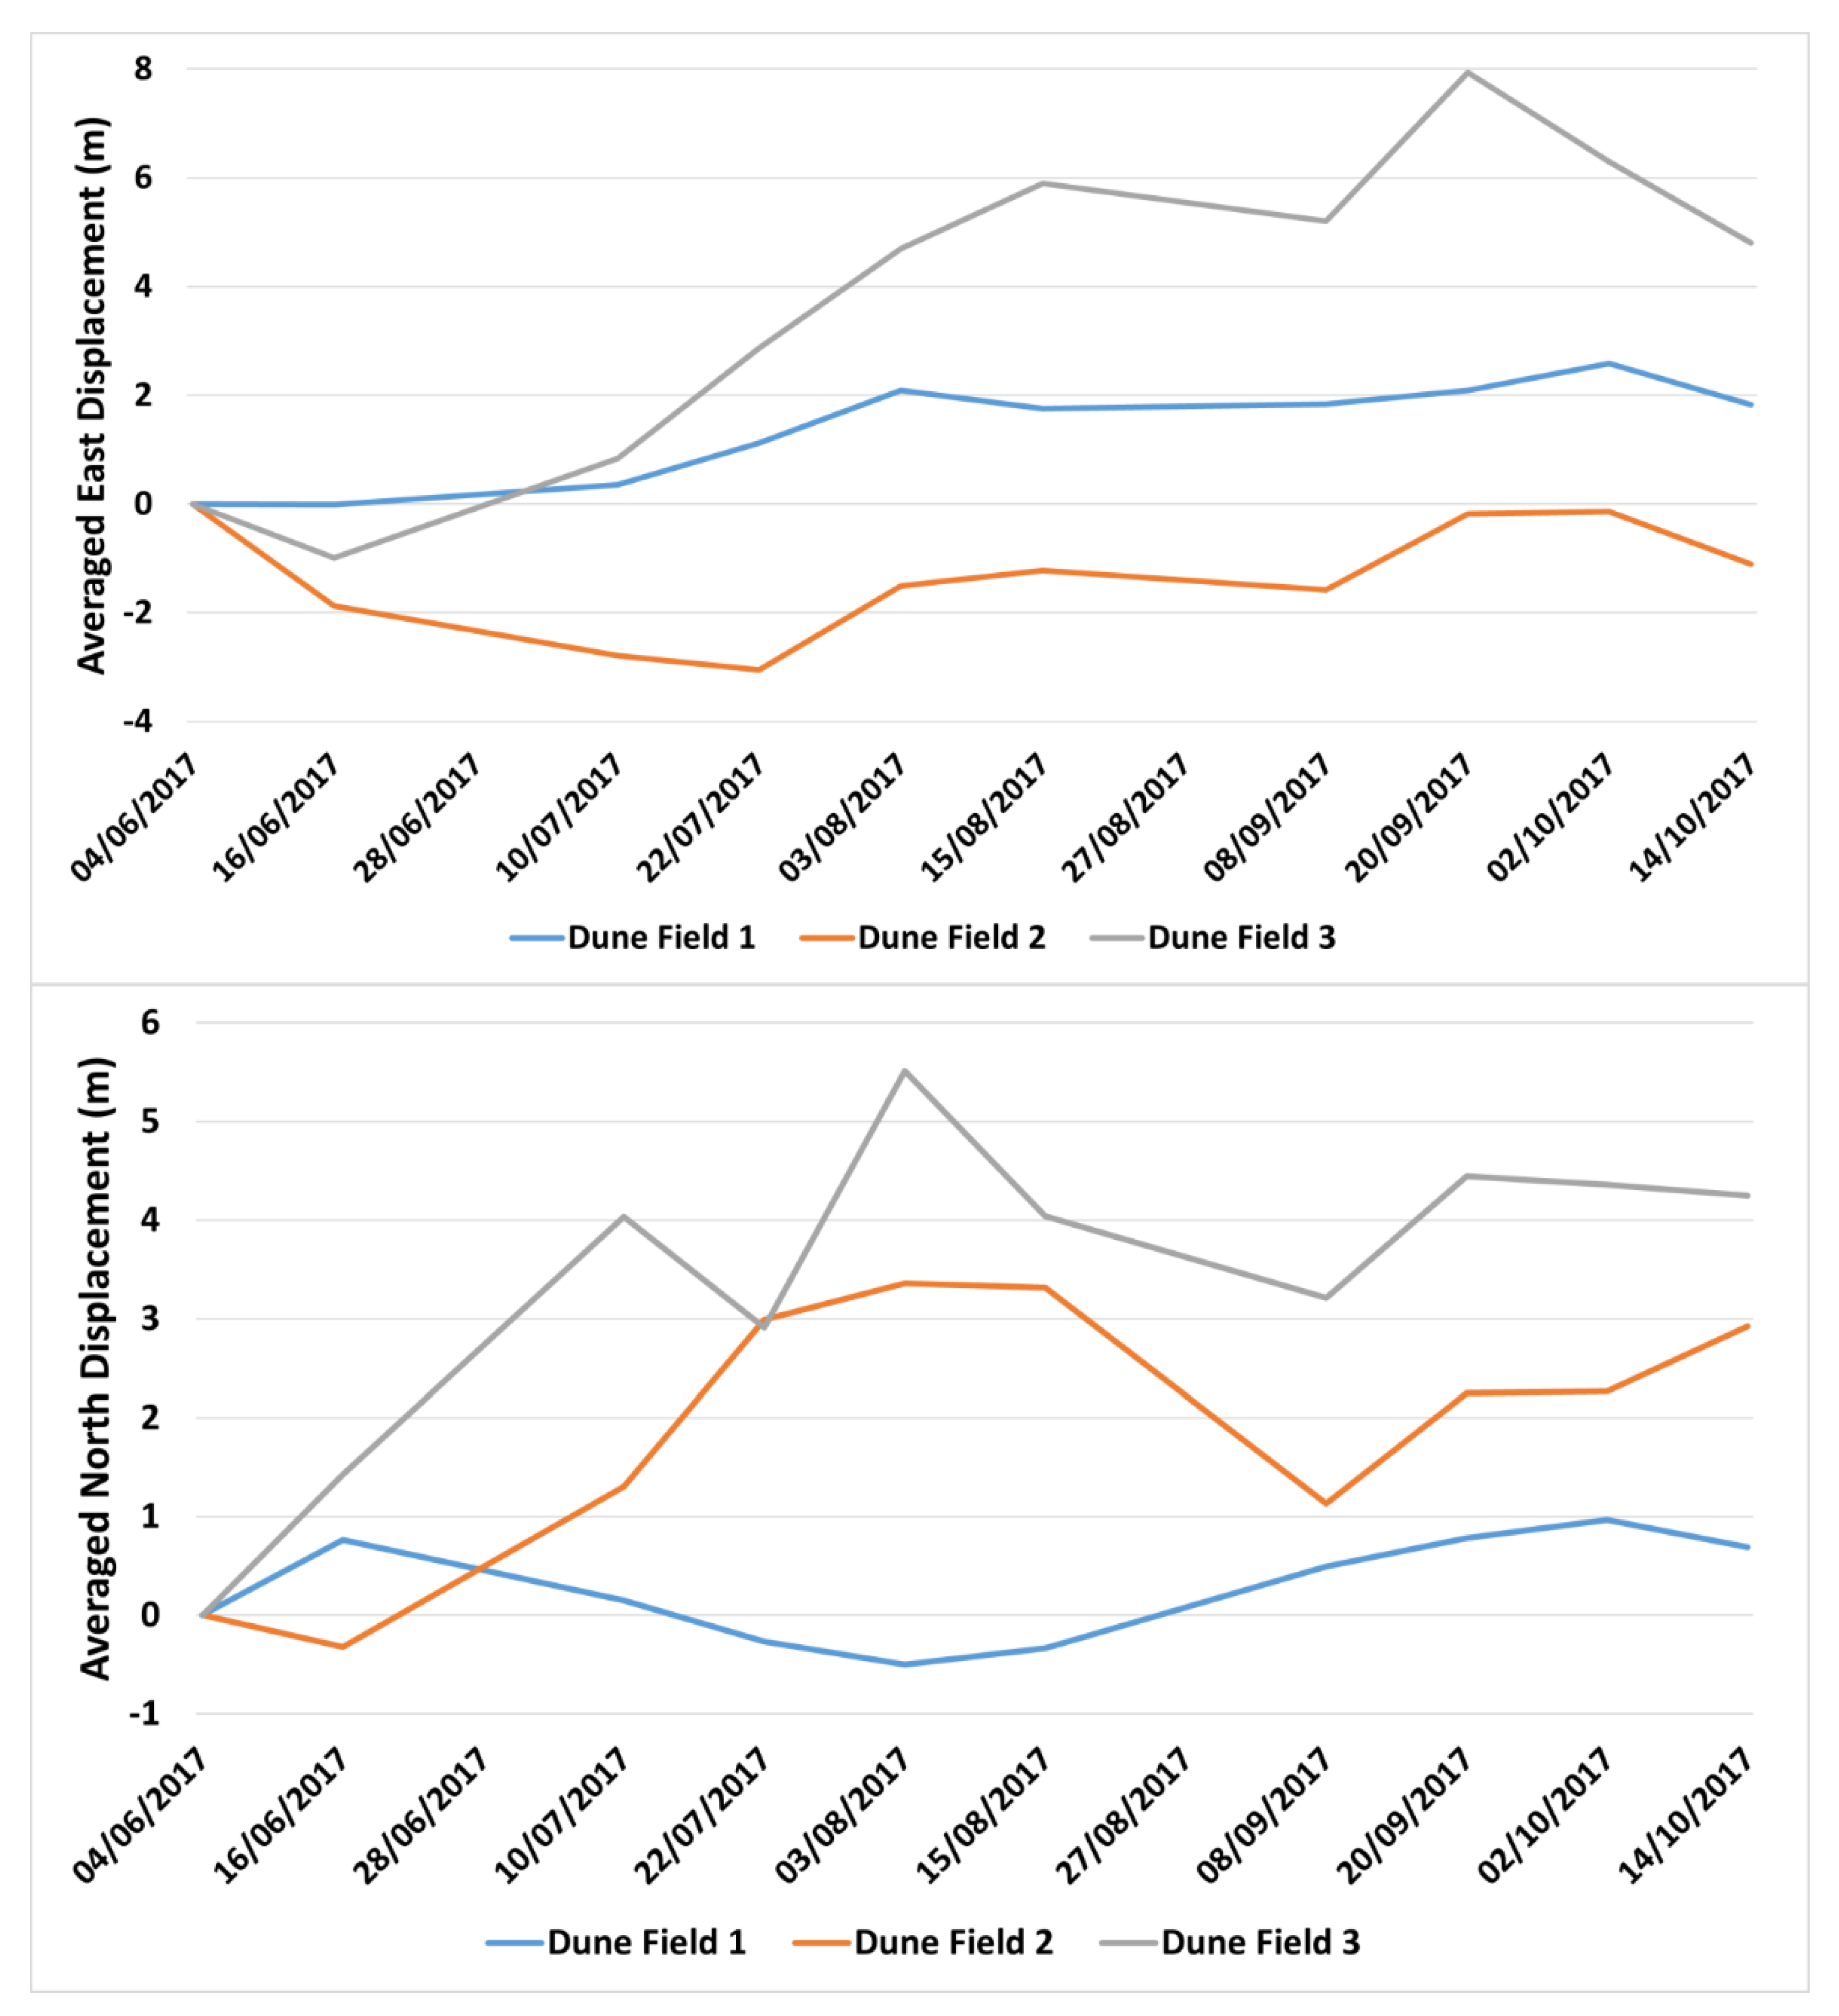
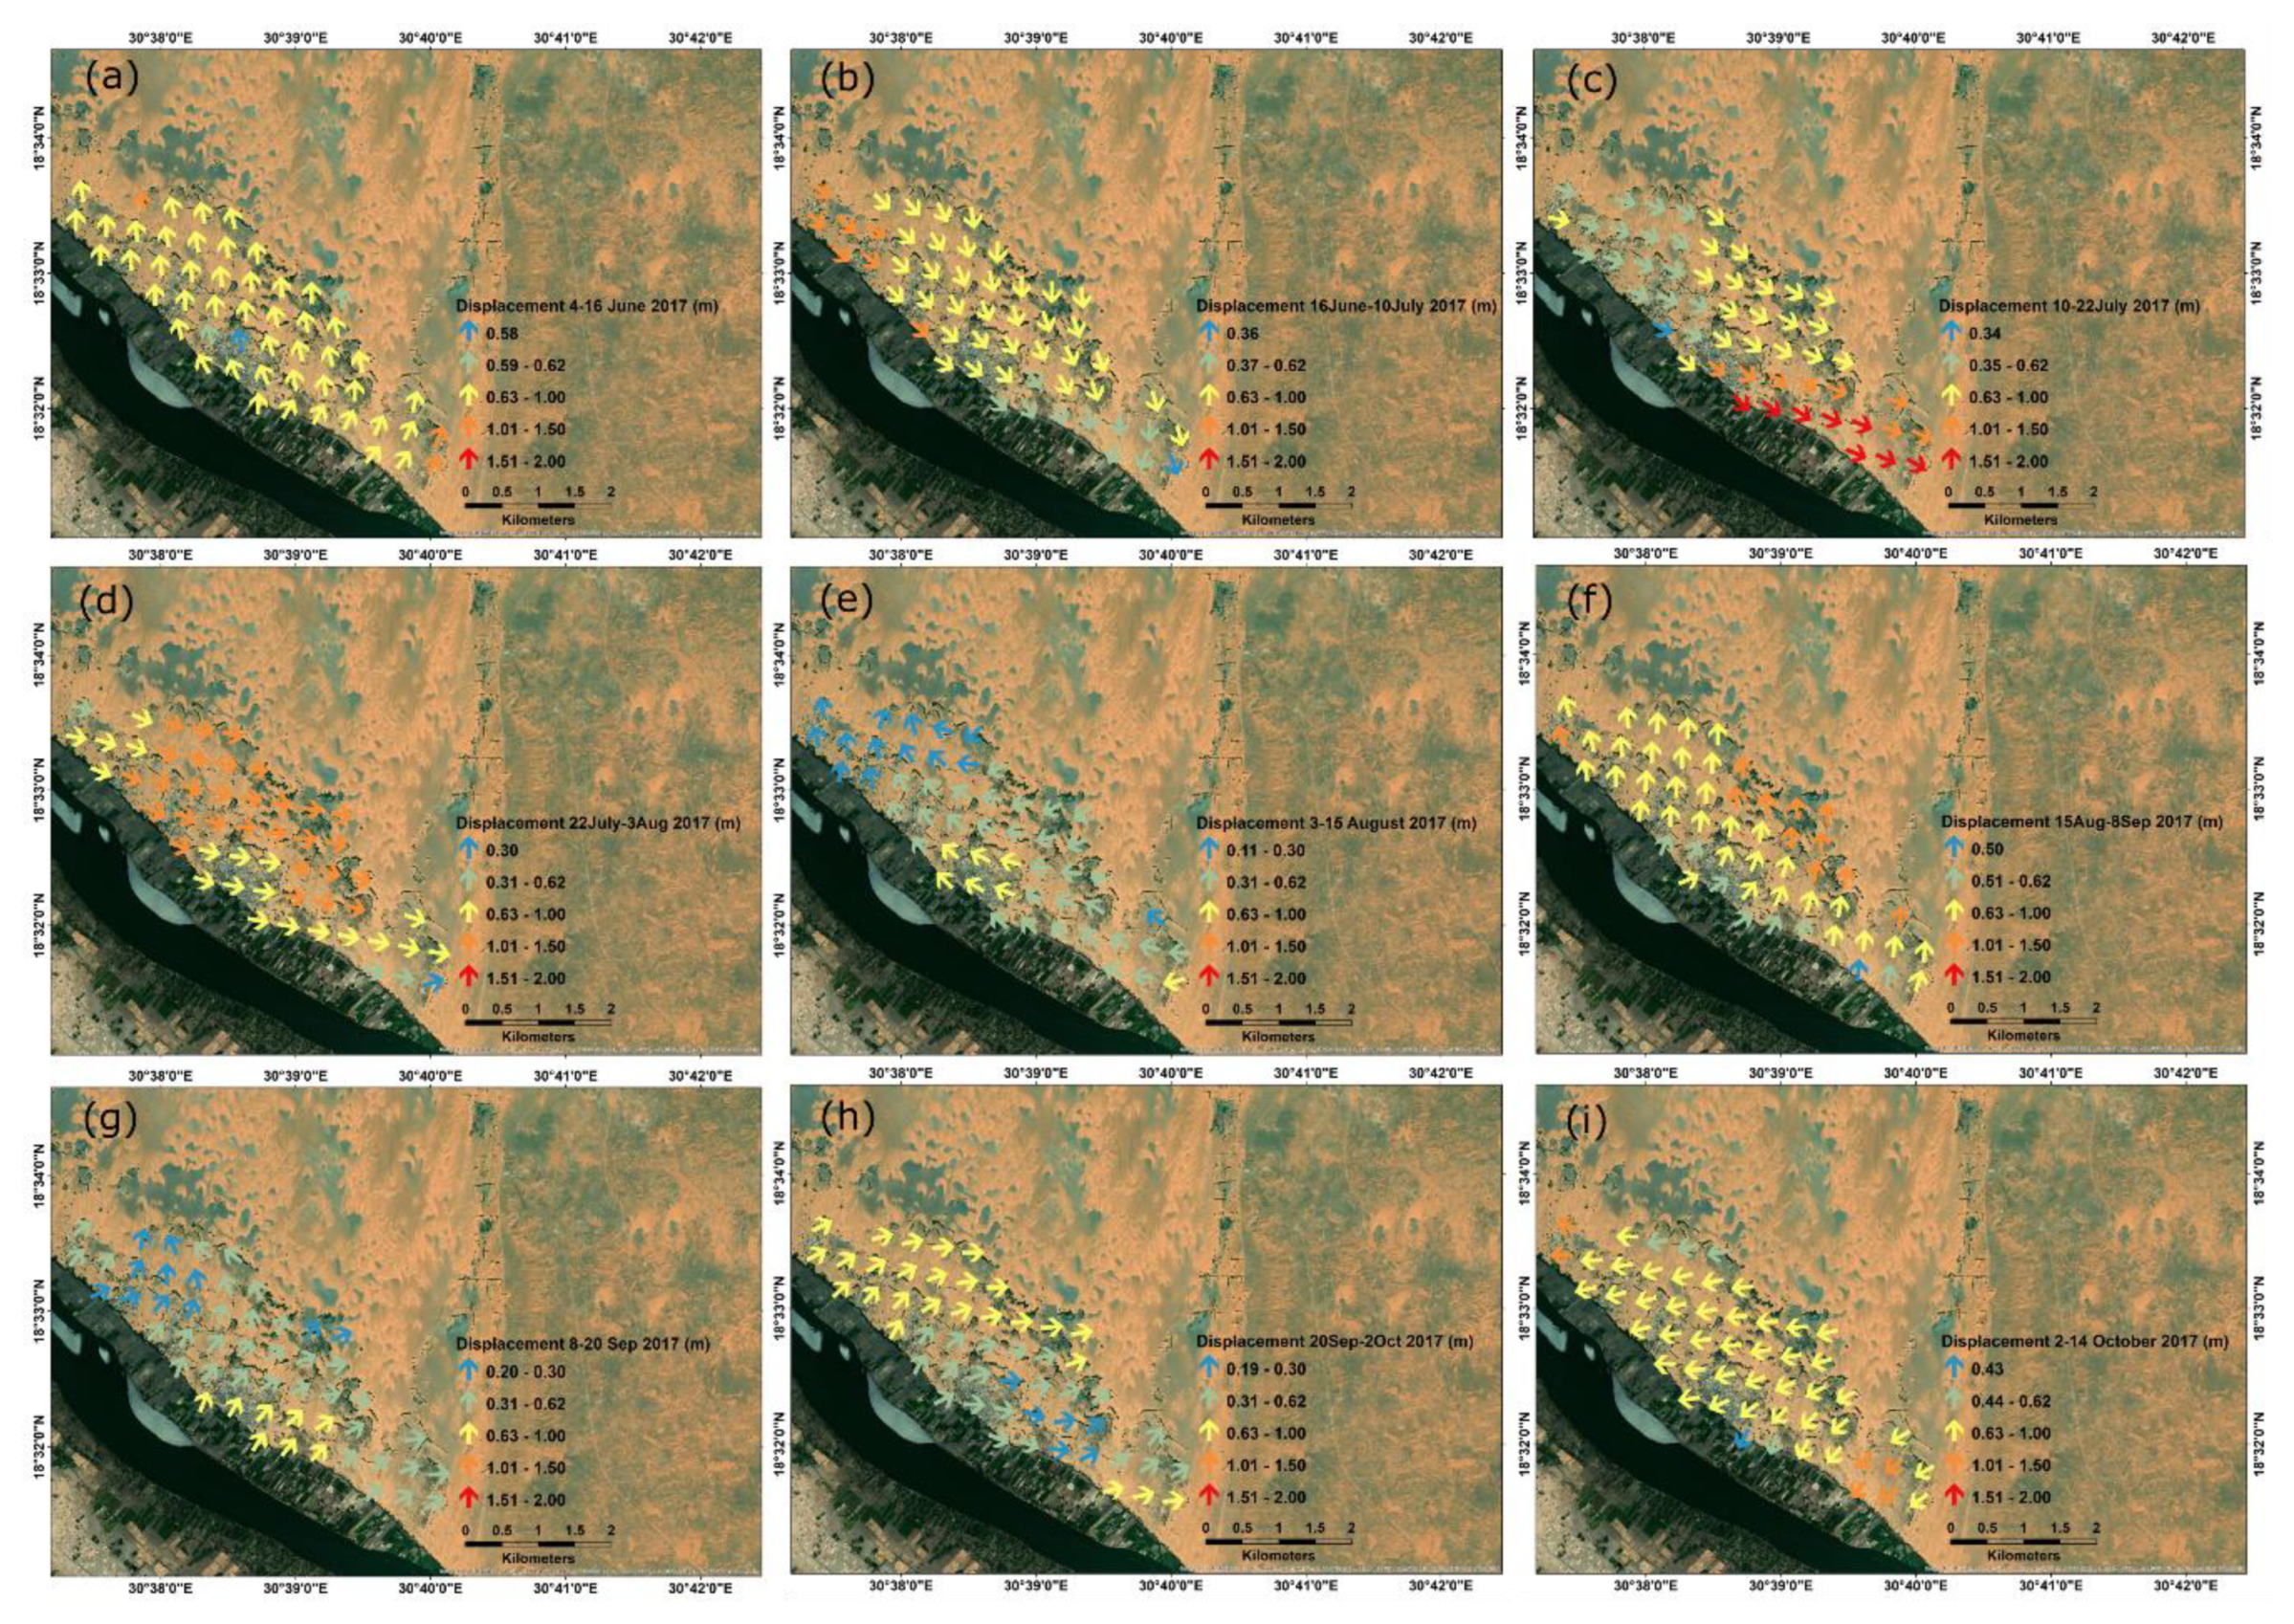
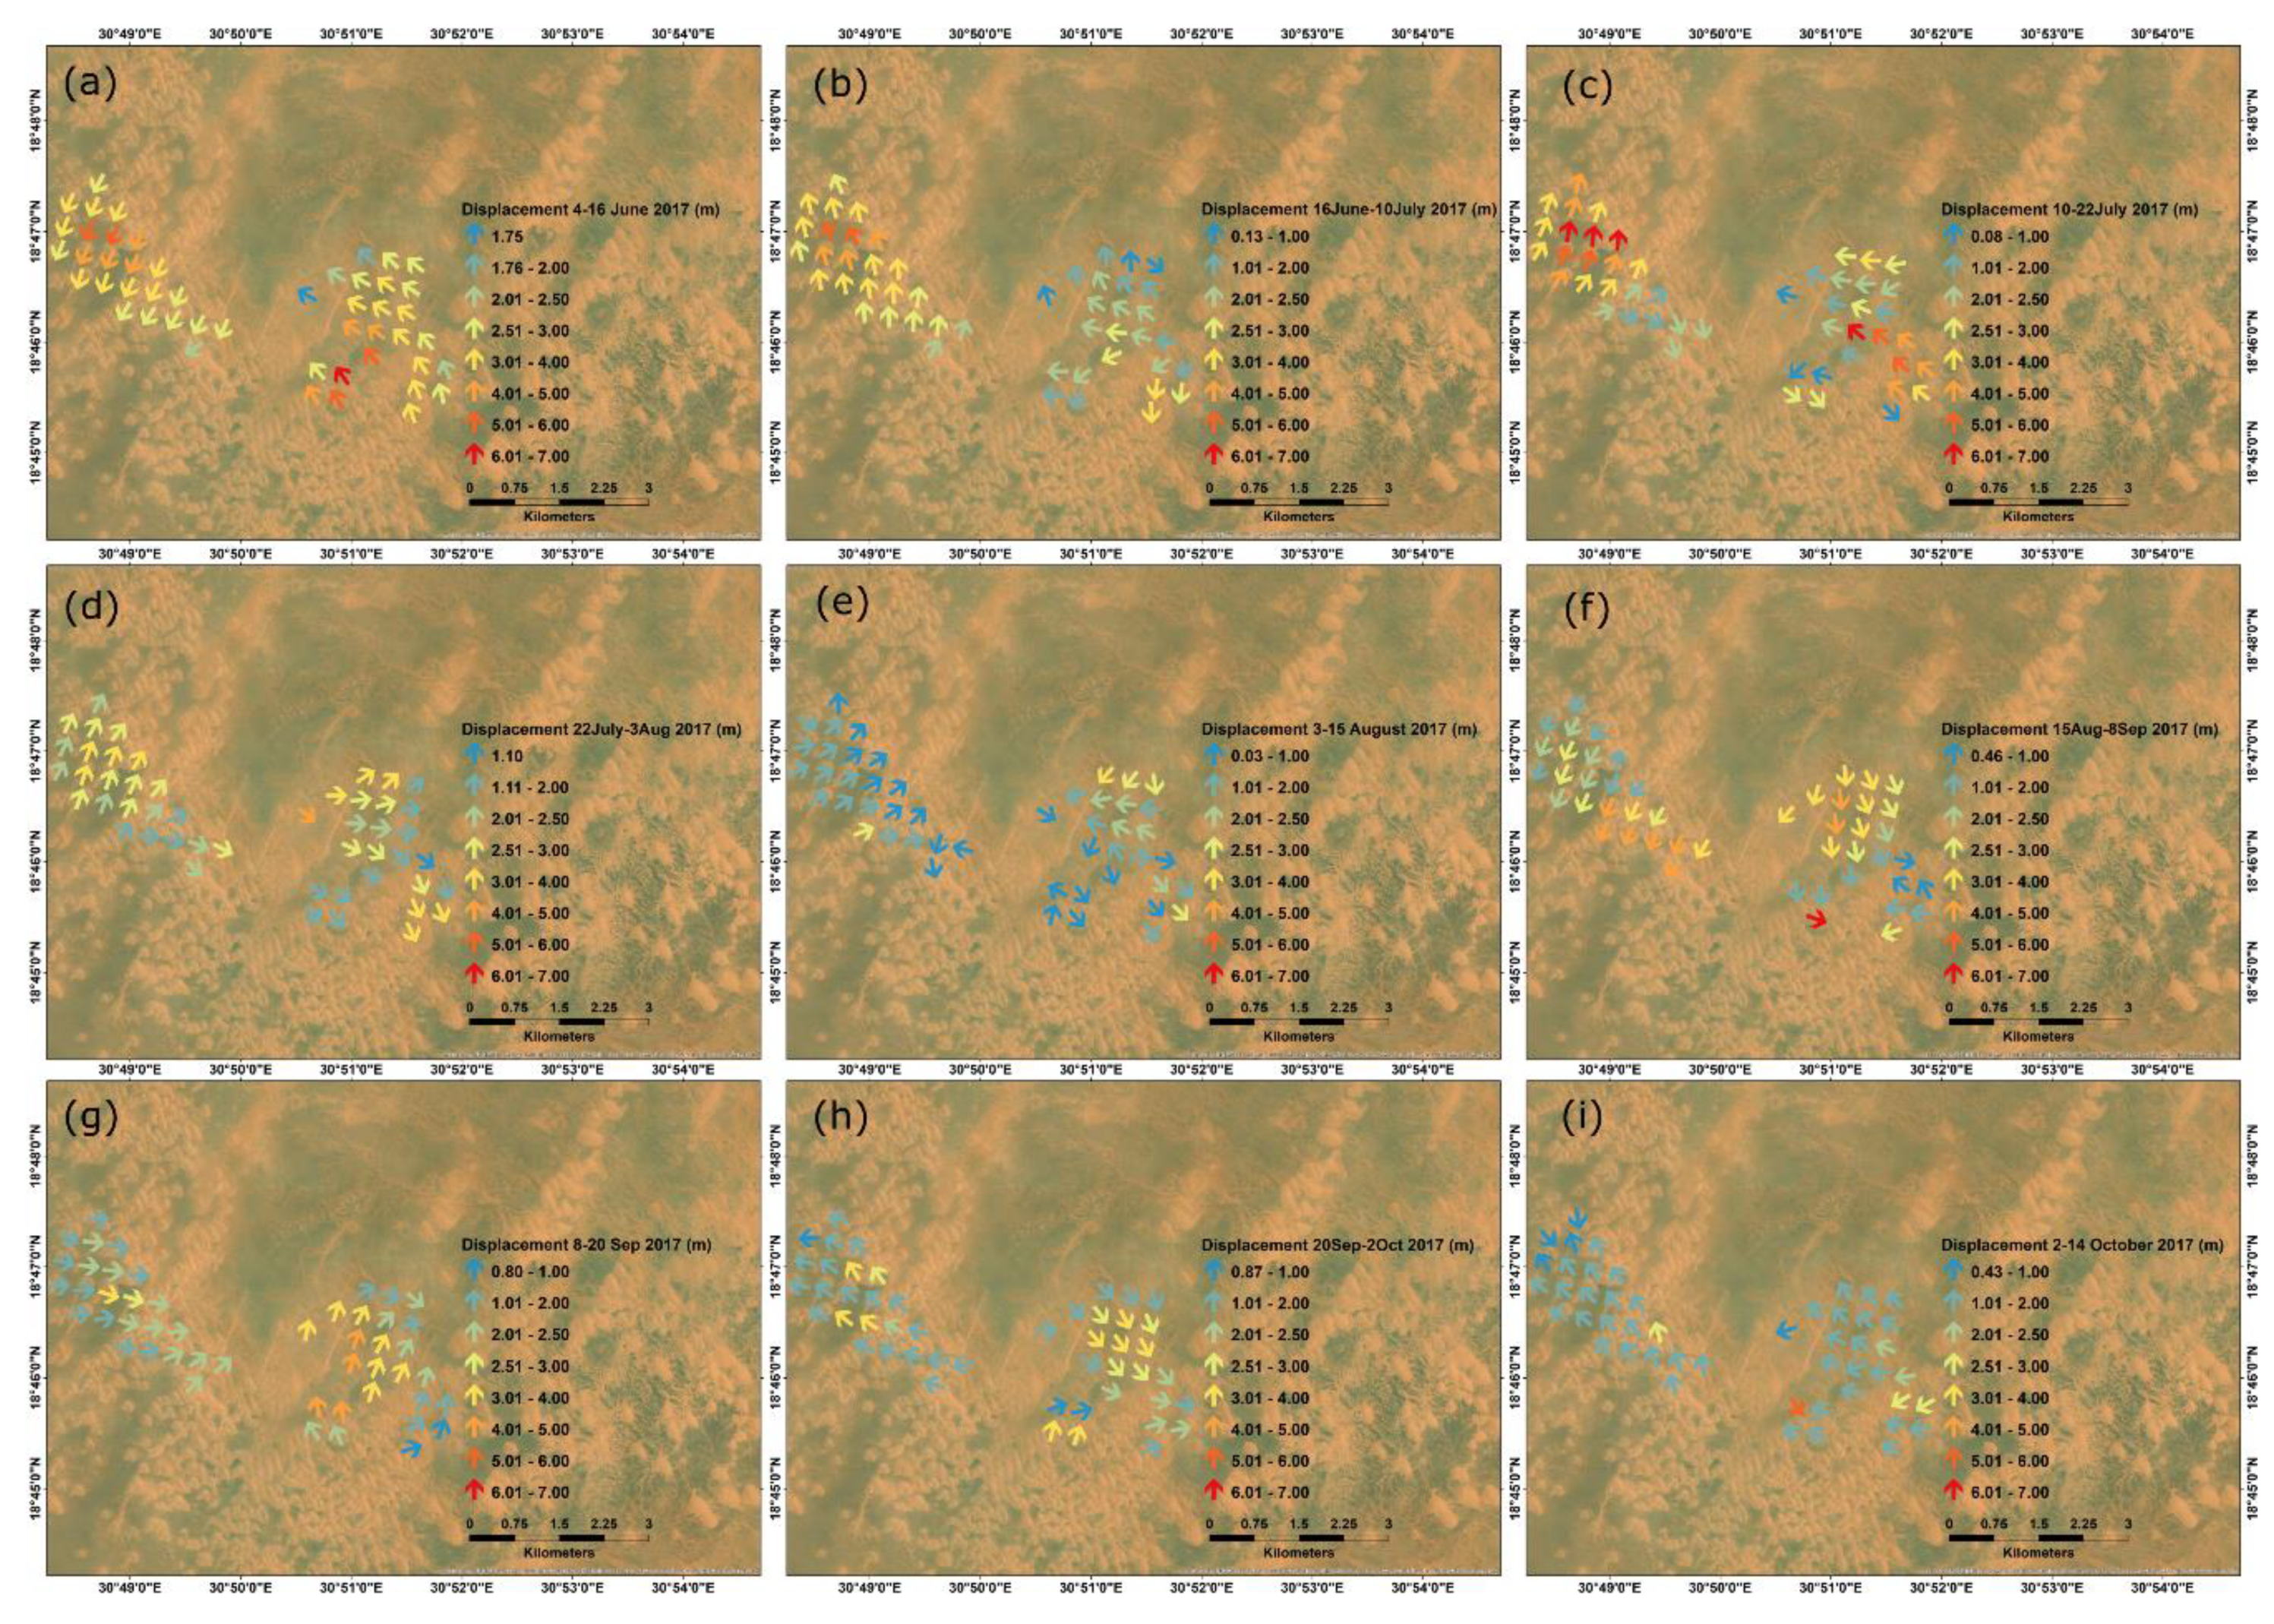
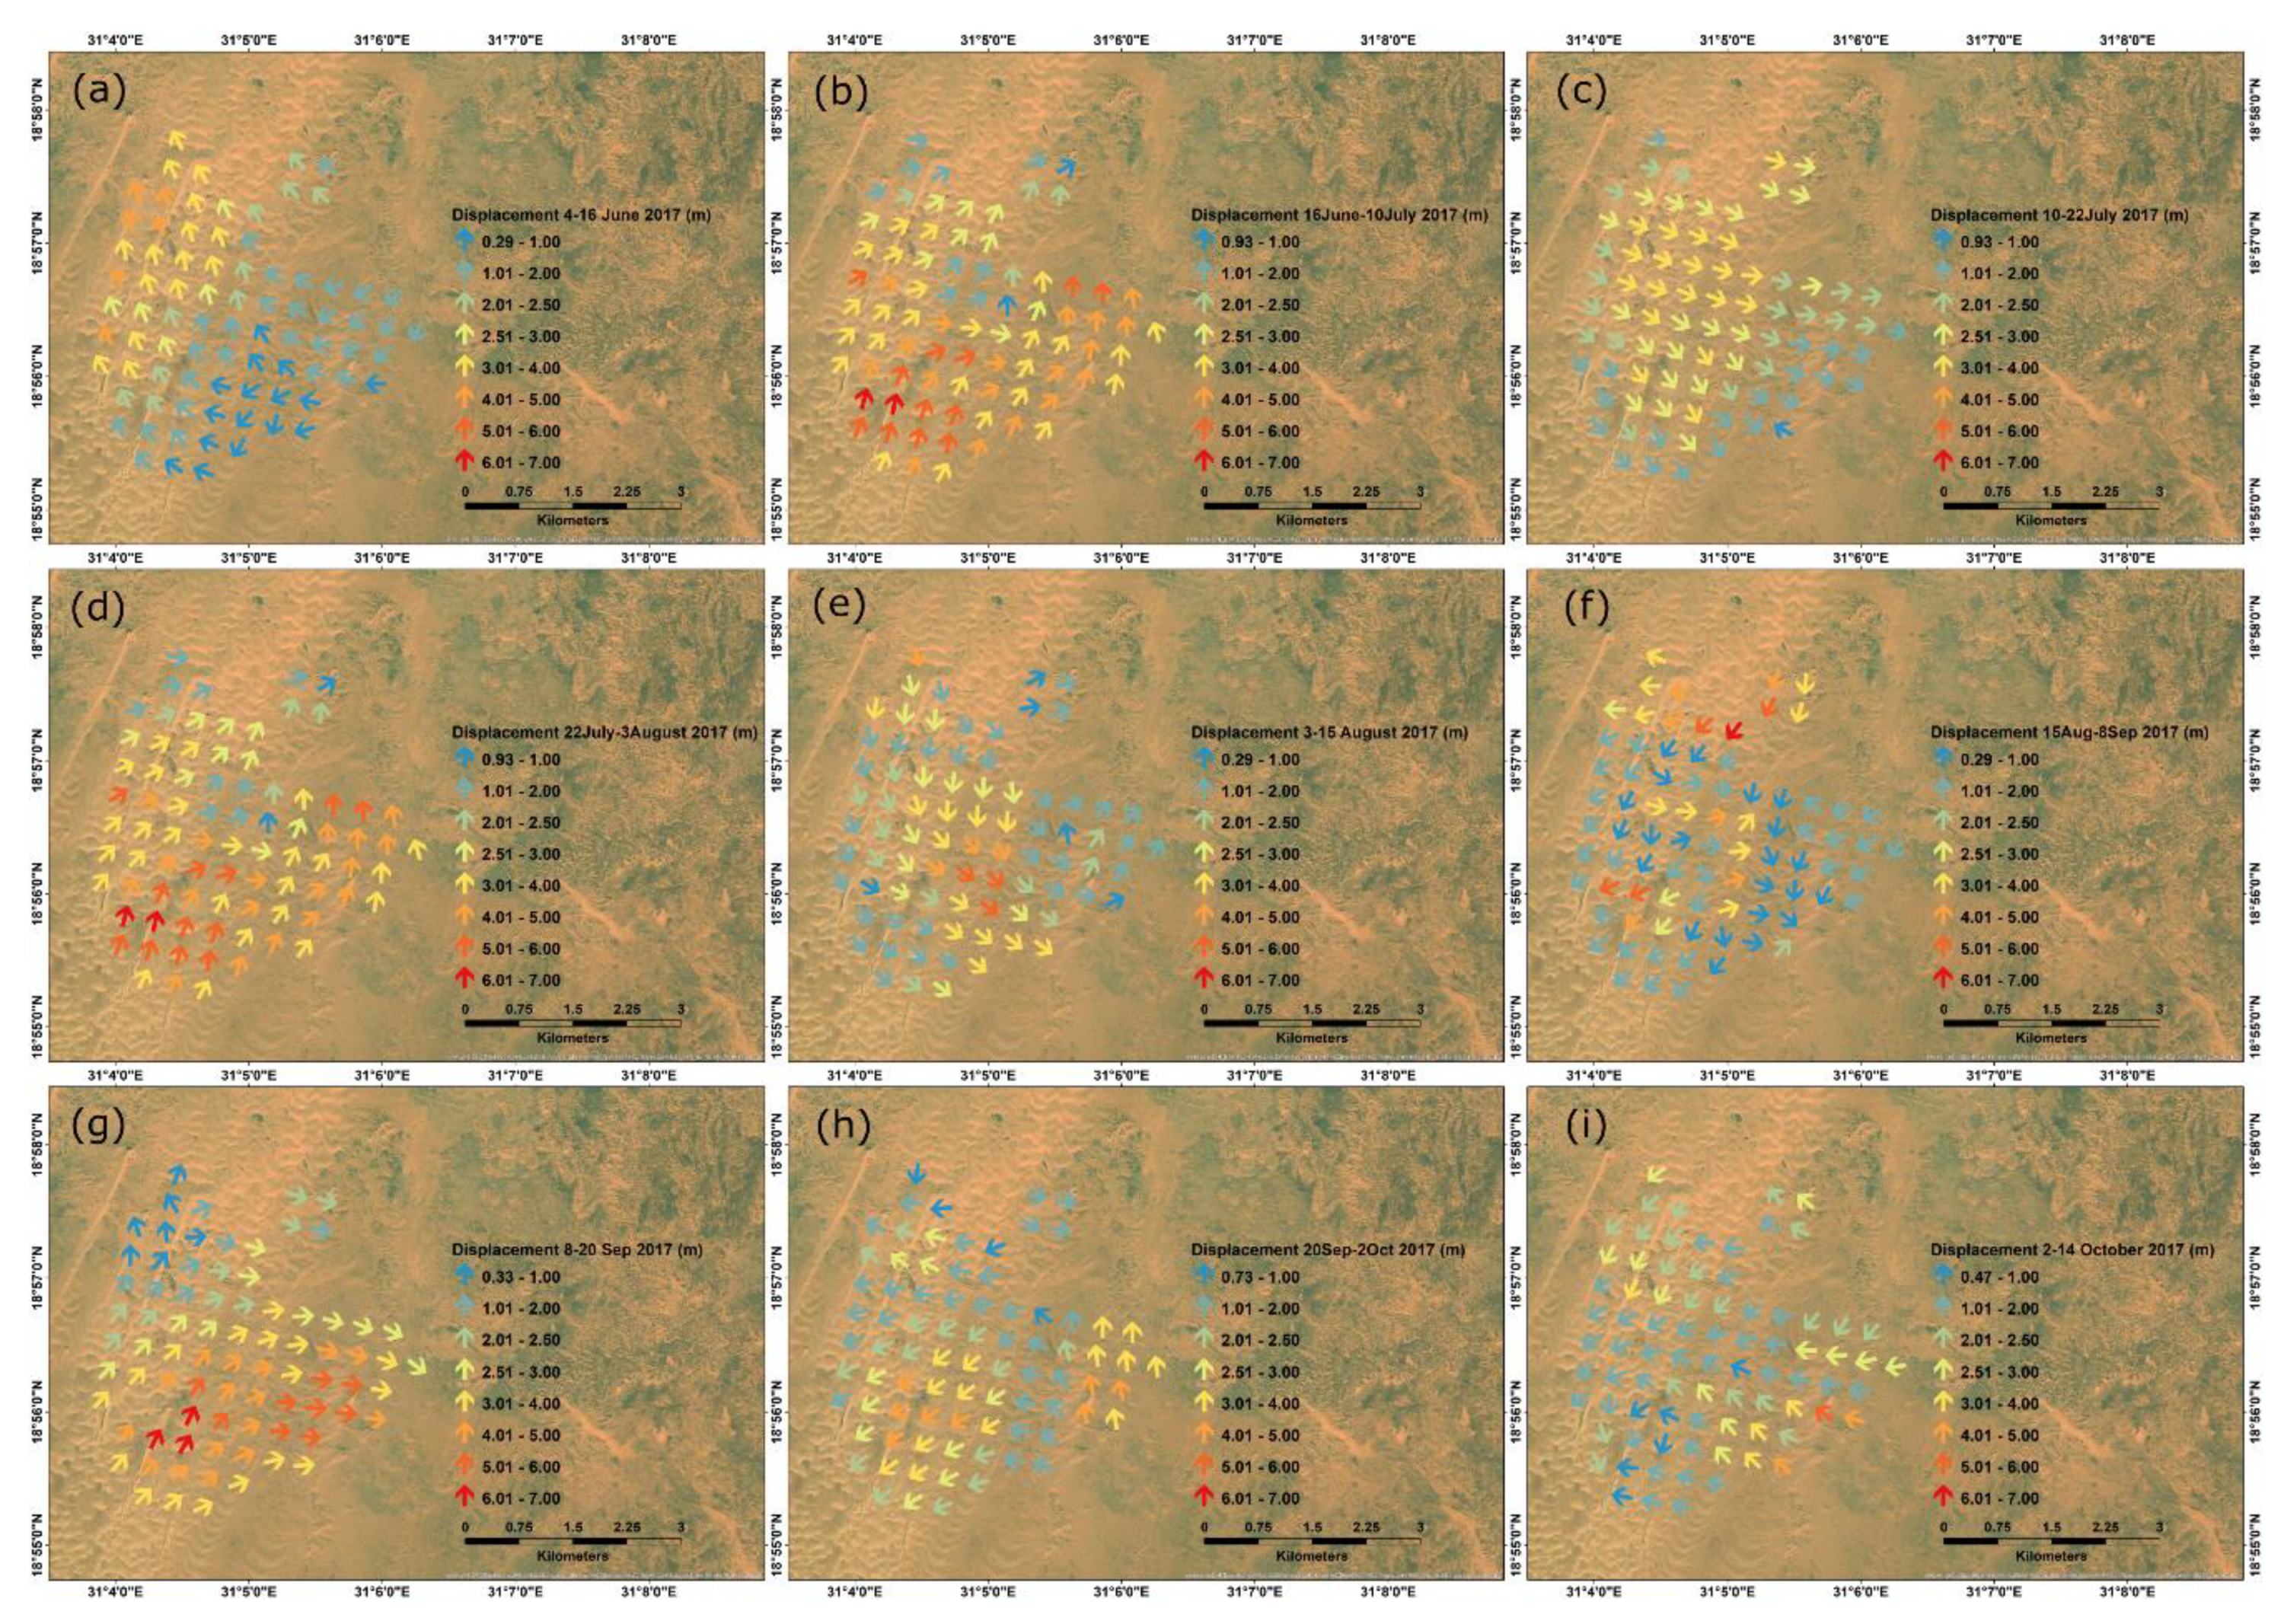
4.1. Displacement of Sand Dunes
4.2. Impact of Wind Speed and Direction on Sand Dune Movement
4.3. Impact of Vegetation
5. Discussion
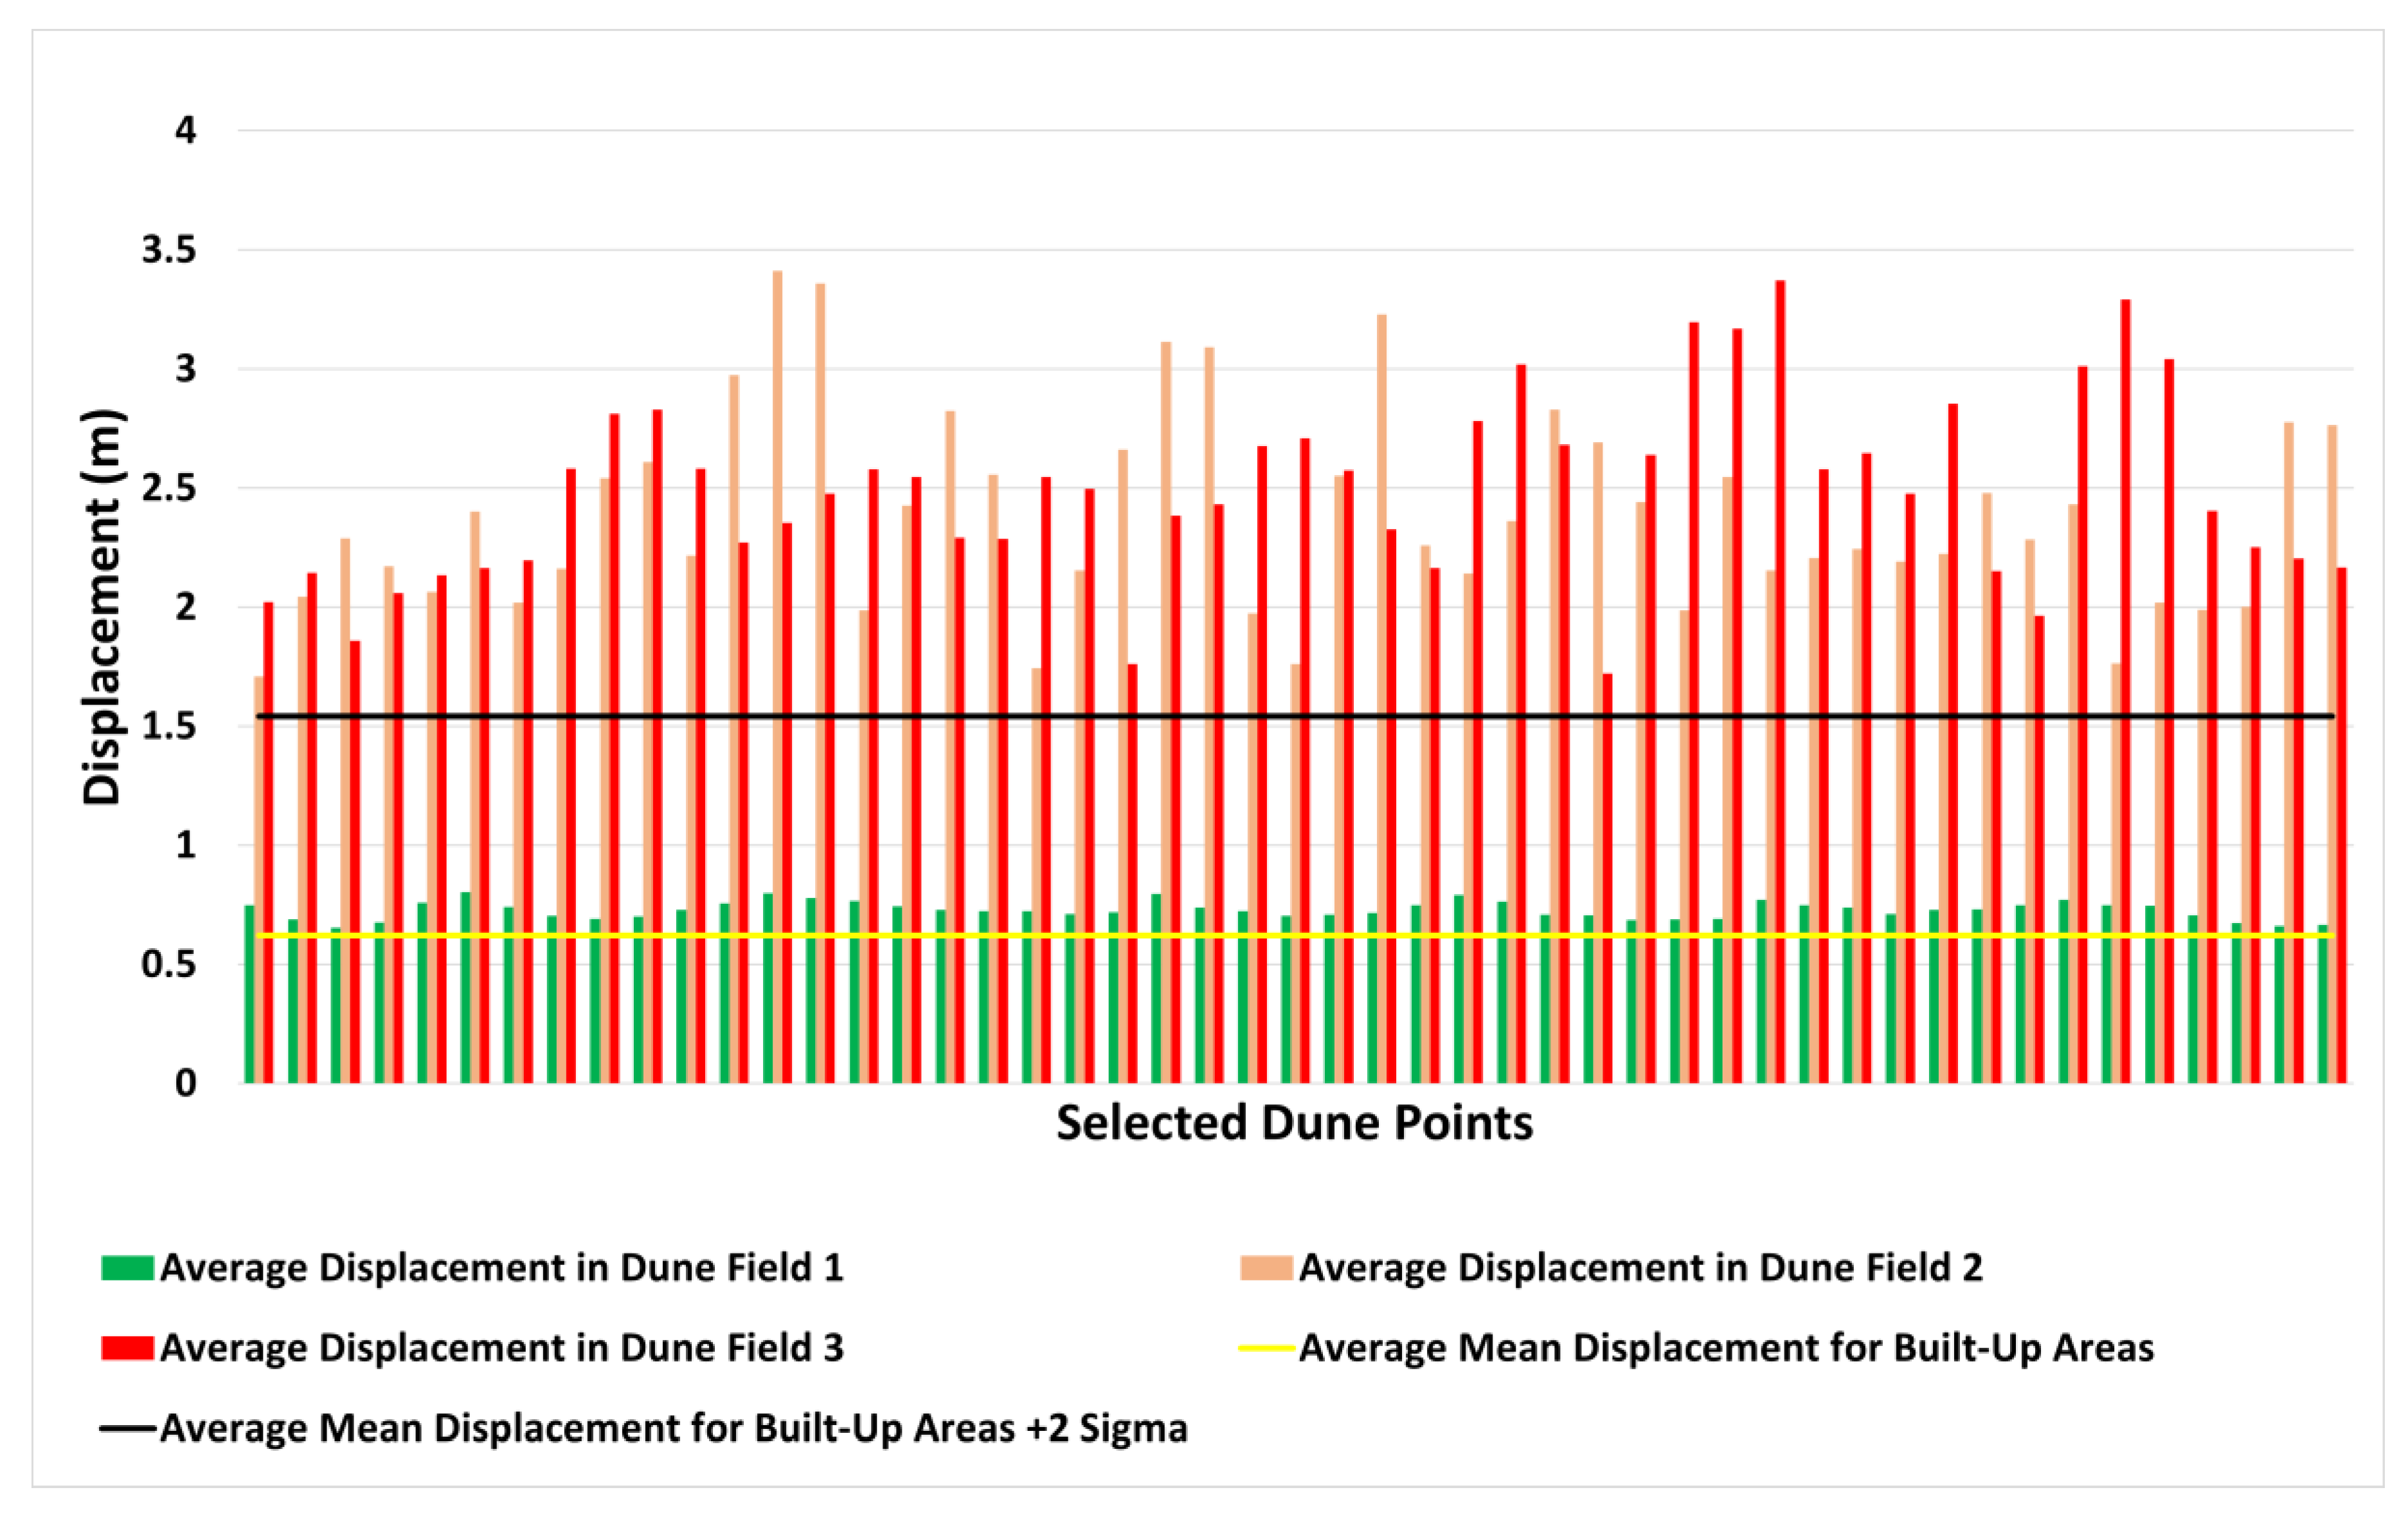
5.1. Analysis of Dune Displacement
5.2. Reflection on Other Studies
5.3. Limitations
5.4. Regional Impact
6. Conclusions
Supplementary Materials
Author Contributions
Funding
Acknowledgments
Conflicts of Interest
References
- Munro, R.; Ibrahim, M.A.M.; Abuzied, H.; el-Hassan, B. Aeolian sand landforms in parts of the Sudan and Nubia. Origins and impacts on past and present land use. Sudan & Nubia. Sudan Archeol. Res. Soc. 2012, 16, 140–154. [Google Scholar]
- Latif, M.A.A.; Elhag, M.M. Combating Desertification in Sudan. Environment and Ecology at the Beginning of 21st Century. 2015, p. 256. Available online: https://www.researchgate.net/publication/291832376 (accessed on 6 September 2020).
- El Moghraby, A.I.; Ali, O.; el Seed, M.T. Desertification in Western Sudan and strategies for rehabilitation. Environ. Conserv. 1987, 14, 227–231. [Google Scholar] [CrossRef]
- Eljack, E.; Csaplovics, E.; Adam, H. Mapping and assessment of sand encroachment on the Nile River northern Sudan, by means of remote Sensing and GIS. In Proceedings of the Conference on International Research on Food Security, Natural Resource Management and Rural Developmentl, Zurich, Switzerland, 14–16 September 2010. [Google Scholar]
- Lancaster, N. Geomorphology of Desert Dunes; Routledge: London, UK, 1995. [Google Scholar]
- Gómez, D.; Salvador, P.; Sanz, J.; Casanova, C.; Casanova, J.-L. Detecting areas vulnerable to sand encroachment using remote sensing and GIS techniques in Nouakchott, Mauritania. Remote Sens. 2018, 10, 1541. [Google Scholar]
- Pye, K.; Tsoar, H. Aeolian Sand and Sand Dunes; Springer Science & Business Media: Heidelberg/Berlin, Germany, 2008. [Google Scholar]
- Zhou, X.; Chang, N.-B.; Li, S. Applications of SAR interferometry in earth and environmental science research. Sensors 2009, 9, 1876–1912. [Google Scholar] [CrossRef] [PubMed] [Green Version]
- Balzter, H.; Rowland, C.S.; Saich, P. Forest canopy height and carbon estimation at Monks Wood National Nature Reserve, UK, using dual-wavelength SAR interferometry. Remote Sens. Environ. 2007, 108, 224–239. [Google Scholar] [CrossRef]
- Tosi, L.; Strozzi, T.; Da Lio, C.; Teatini, P. Regional and local land subsidence at the venice coastland by TERRASAR-X PSI. In NISOLS 2015 (Ninth Symposium on Land Subsidence); Copernicus Publications: Göttingen, Germany, 2015. [Google Scholar]
- Massonnet, D.; Feigl, K.L. Radar interferometry and its application to changes in the Earth’s surface. Rev. Geophys. 1998, 36, 441–500. [Google Scholar] [CrossRef] [Green Version]
- Pedersen, R.; Sigmundsson, F. Temporal development of the 1999 intrusive episode in the Eyjafjallajökull volcano, Iceland, derived from InSAR images. Bull. Volcanol. 2006, 68, 377–393. [Google Scholar] [CrossRef]
- Cai, J.; Wang, C.; Mao, X.; Wang, Q. An adaptive offset tracking method with SAR images for landslide displacement monitoring. Remote Sens. 2017, 9, 830. [Google Scholar] [CrossRef] [Green Version]
- Refice, A.; Capolongo, D.; Pasquariello, G.; Addabbo, A.; Bovenga, F.; Nutricato, R.; Lovergine, F.P.; Piatrenera, L. SAR and InSAR for flood monitoring: Examples with COSMO-SkyMed data. IEEE J. Sel. Top. Appl. Earth Observ. Rem. Sens. 2014, 7, 2711–2722. [Google Scholar] [CrossRef]
- Blumberg, D.G. Remote sensing of desert dune forms by polarimetric synthetic aperture radar (SAR). Remote Sens. Environ. 1998, 65, 204–216. [Google Scholar] [CrossRef]
- Maghsoudi, M.; Hajizadeh, A.; Nezammahalleh, M.A.; Seyedrezai, H.; Jalali, A.; Mahzoun, M. Interferometric Synthetic aperture radar (INSAR) technology and geomorphology interpretation. ISPRS Int. Arch. Photogramm. Remote Sens. Spat. Inf. Sci. 2013, 253–256. [Google Scholar] [CrossRef] [Green Version]
- Chang, X.; Guo, J.; Wang, X. Detecting the amount of eroded and deposited sand using DInSAR. Terr. Atmos. Ocean. Sci. 2011, 22, 187–194. [Google Scholar] [CrossRef] [Green Version]
- Havivi, S.; Amir, D.; Schvartzman, I.; August, Y.; Maman, S.; Rotman, S.R.; Blumberg, D.G. Mapping dune dynamics by InSAR coherence. Earth Surf. Process Landf. 2018, 43, 1229–1240. [Google Scholar] [CrossRef]
- Casu, F.; Manconi, A.; Pepe, A.; Lanari, R. Deformation time-series generation in areas characterized by large displacement dynamics: The SAR amplitude pixel-offset SBAS technique. IEEE Trans. Geosci. Remote Sens. 2011, 49, 2752–2763. [Google Scholar] [CrossRef]
- Riveros, N.; Euillades, L.; Moreiras, S.; Balbarani, S. Offset tracking procedure applied to high resolution SAR data on Viedma Glacier, Patagonian Andes, Argentina. Adv. Geosci. 2013, 35, 7–13. [Google Scholar] [CrossRef] [Green Version]
- Pepe, A.; Caló, F. A review of interferometric synthetic aperture RADAR (InSAR) multi-track approaches for the retrieval of Earth’s surface displacements. Appl. Sci. 2017, 7, 1264. [Google Scholar] [CrossRef] [Green Version]
- Strozzi, T.; Luckman, A.; Murray, T.; Wegmuller, U.; Werner, C.L. Glacier motion estimation using SAR offset-tracking procedures. IEEE Trans. Geosci. Remote Sens. 2002, 40, 2384–2391. [Google Scholar] [CrossRef] [Green Version]
- Wang, T.; Wei, S.; Jónsson, S. Coseismic displacements from SAR image offsets between different satellite sensors: Application to the 2001 Bhuj (India) earthquake. Geophys. Res. Lett. 2015, 42, 7022–7030. [Google Scholar] [CrossRef] [Green Version]
- Wang, T.; Jónsson, S. Improved SAR amplitude image offset measurements for deriving three-dimensional coseismic displacements. IEEE J. Sel. Top. Appl. Earth Obs. Remote Sens. 2015, 8, 1–8. [Google Scholar] [CrossRef] [Green Version]
- Ou, D.; Tan, K.; Du, Q.; Chen, Y.; Ding, J. Decision fusion of D-InSAR and pixel offset tracking for coal mining deformation monitoring. Remote. Sens. 2018, 10, 1055. [Google Scholar] [CrossRef] [Green Version]
- Ayoub, F.; Avouac, J.-P.; Newman, C.; Richardson, M.; Lucas, A.; Leprince, S.; Bridges, N. Threshold for sand mobility on Mars calibrated from seasonal variations of sand flux. Nat. Commun. 2014, 5, 5096. [Google Scholar] [CrossRef] [Green Version]
- Thomas, N.; Nigam, S. Twentieth-century climate change over Africa: Seasonal hydroclimate trends and Sahara desert expansion. J. Clim. 2018, 31, 3349–3370. [Google Scholar] [CrossRef]
- NASA. Dust Storm over Sudan and the Red Sea. Available online: https://modis.gsfc.nasa.gov/gallery/individual.php?db_date=2017-08-17 (accessed on 6 December 2019).
- Dee, D.P.; Uppala, S.M.; Simmons, A.J.; Berrisford, P.; Poli, P.; Kobayashi, S.; Andrae, U.; Balmaseda, M.A.; Balsamo, G.; Bauer, P.; et al. The ERA-Interim reanalysis: Configuration and performance of the data assimilation system. Q. J. R. Meteorol. Soc. 2011, 137, 553–597. [Google Scholar] [CrossRef]
- Copernicus Climate Change Service Climate Data Store (CDS). ERA5: Fifth Generation of ECMWF Atmospheric Reanalyses of the Global Climate. Available online: https://cds.climate.copernicus.eu/cdsapp#!/software/app-era5-explorer?tab=overview (accessed on 6 December 2019).
- Hoffmann, L.; Günther, G.; Li, D.; Stein, O.; Wu, X.; Griessbach, S.; Heng, Y.; Konopka, P.; Müller, R.; Vogel, B.; et al. From ERA-Interim to ERA5: The considerable impact of ECMWF’s next-generation reanalysis on Lagrangian transport simulations. Atmos. Chem. Phys. Discuss. 2019, 19, 3097–3124. [Google Scholar] [CrossRef] [Green Version]
- Kok, J.F.; Parteli, E.J.R.; Michaels, T.; Karam, D.B. The physics of wind-blown sand and dust. Rep. Prog. Phys. 2012, 75, 106901. [Google Scholar] [CrossRef] [PubMed] [Green Version]
- Abuzied, H. Mapping and Assessment of Wind Erosion in Central Northern State, Sudan. Ph.D. Thesis, Desertification and Desert Cultivation Studies Institute, University of Khartoum, Khartoum, Sudan, 2009. [Google Scholar]
- Berte, C.J. Fighting Sand Encroachment: Lessons from Mauritania; Food and Agriculture Organization of the United Nations (FAO): Rome, Italy, 2010. [Google Scholar]
- Koja, S.F. Sand Dune Movement and its Impact on Human Activities in the North Western Coast Region of Libya. An Analysis of the Sediment Characteristics of Sand Dunes, and Their Movement Using Satellite Images, and the Effects of Encroachment on Farms Assessed by a Questionnaire Survey; University of Bradford: Bradford, UK, 2012. [Google Scholar]
- Durán, O.; Moore, L.J. Vegetation controls on the maximum size of coastal dunes. Proc. Natl. Acad. Sci. USA 2013, 110, 17217–17222. [Google Scholar] [CrossRef] [PubMed] [Green Version]
- Salih, A.A.; Ganawa, E.-T.; Elmahl, A.A. Spectral mixture analysis (SMA) and change vector analysis (CVA) methods for monitoring and mapping land degradation/desertification in arid and semiarid areas (Sudan), using Landsat imagery. Egypt. J. Rem. Sens. Space Sci. 2017, 20, S21–S29. [Google Scholar] [CrossRef]
- Liu, B.; Coulthard, T.J. Mapping the interactions between rivers and sand dunes: Implications for fluvial and aeolian geomorphology. Geomorphology 2015, 231, 246–257. [Google Scholar] [CrossRef]
- Fallourd, R.; Harant, O.; Trouve, O.; Nicolas, J.-M.; Gay, M.; Walpersdorf, A.; Mugnier, J.-L.; Serafini, J.; Rosu, D.; Bombrun, L.; et al. Monitoring temperate glacier displacement by multi-temporal TerraSAR-X images and continuous GPS measurements. IEEE J. Sel. Top. Appl. Earth Obs. Remote Sens. 2011, 4, 372–386. [Google Scholar] [CrossRef]


| Image Pairs | Primary Image | Secondary Image |
|---|---|---|
| Image Pair 1 | 4 June 2017 | 16 June 2017 |
| Image Pair 2 | 16 June 2017 | 10 July 2017 |
| Image Pair 3 | 10 July 2017 | 22 July 2017 |
| Image Pair 4 | 22 July 2017 | 3 August 2017 |
| Image Pair 5 | 3 August 2017 | 15 August 2017 |
| Image Pair 6 | 15 August 2017 | 8 September 2017 |
| Image Pair 7 | 8 September 2017 | 20 September 2017 |
| Image Pair 8 | 20 September 2017 | 2 October 2017 |
| Image Pair 9 | 2 October 2017 | 14 October 2017 |
| Parameter | Values |
|---|---|
| Grid Range and Azimuth Spacing (in meters) | 400 × 400 |
| Total GCP Points | 31,648 |
| Registration Window Width and Height | 128 × 128 |
| Cross-Correlation Threshold | 0.1 |
| Average Box Size | 5 |
| Max Velocity (m/d) | 5.0 |
| Radius for Hole Filling | 4 |
| Date | Minimum Displacement (m) | Maximum Displacement (m) | Mean Displacement (m) | Standard Deviation (m) |
|---|---|---|---|---|
| 4–16 June 2017 | 0.34 | 0.88 | 0.64 | 0.15 |
| 16 June–10 July 2017 | 0.32 | 0.98 | 0.64 | 0.20 |
| 10–22 July 2017 | 0.52 | 0.82 | 0.68 | 0.08 |
| 22 July–3 August 2017 | 0.73 | 1.20 | 0.94 | 0.13 |
| 3–15 August 2017 | 0.04 | 0.80 | 0.35 | 0.18 |
| 15 August–8 September 2017 | 0.23 | 0.89 | 0.54 | 0.18 |
| 8–20 September 2017 | 0.45 | 0.77 | 0.61 | 0.10 |
| 20 September–2 October 2017 | 0.20 | 0.60 | 0.37 | 0.10 |
| 2–14 October 2017 | 0.51 | 1.11 | 0.82 | 0.21 |
| Dune Field | Pearson Correlation Coefficient (r) | |
|---|---|---|
| E | N | |
| Dune Field 1 | 0.42 | −0.36 |
| Dune Field 2 | 0.02 | 0.30 |
| Dune Field 3 | 0.62 | 0.30 |
Publisher’s Note: MDPI stays neutral with regard to jurisdictional claims in published maps and institutional affiliations. |
© 2020 by the authors. Licensee MDPI, Basel, Switzerland. This article is an open access article distributed under the terms and conditions of the Creative Commons Attribution (CC BY) license (http://creativecommons.org/licenses/by/4.0/).
Share and Cite
Mahmoud, A.M.A.; Novellino, A.; Hussain, E.; Marsh, S.; Psimoulis, P.; Smith, M. The Use of SAR Offset Tracking for Detecting Sand Dune Movement in Sudan. Remote Sens. 2020, 12, 3410. https://doi.org/10.3390/rs12203410
Mahmoud AMA, Novellino A, Hussain E, Marsh S, Psimoulis P, Smith M. The Use of SAR Offset Tracking for Detecting Sand Dune Movement in Sudan. Remote Sensing. 2020; 12(20):3410. https://doi.org/10.3390/rs12203410
Chicago/Turabian StyleMahmoud, Ahmed Mutasim Abdalla, Alessandro Novellino, Ekbal Hussain, Stuart Marsh, Panagiotis Psimoulis, and Martin Smith. 2020. "The Use of SAR Offset Tracking for Detecting Sand Dune Movement in Sudan" Remote Sensing 12, no. 20: 3410. https://doi.org/10.3390/rs12203410