1. Introduction
In recent years, forest bathing [
1] is becoming more and more popular. Therefore forest-based eco-tourism has been developing to promote the sustainability of the island around the world [
2]. Beside the benefits of eco-tourism, forests participate in regulating climate, protecting soil, and conserving biodiversity [
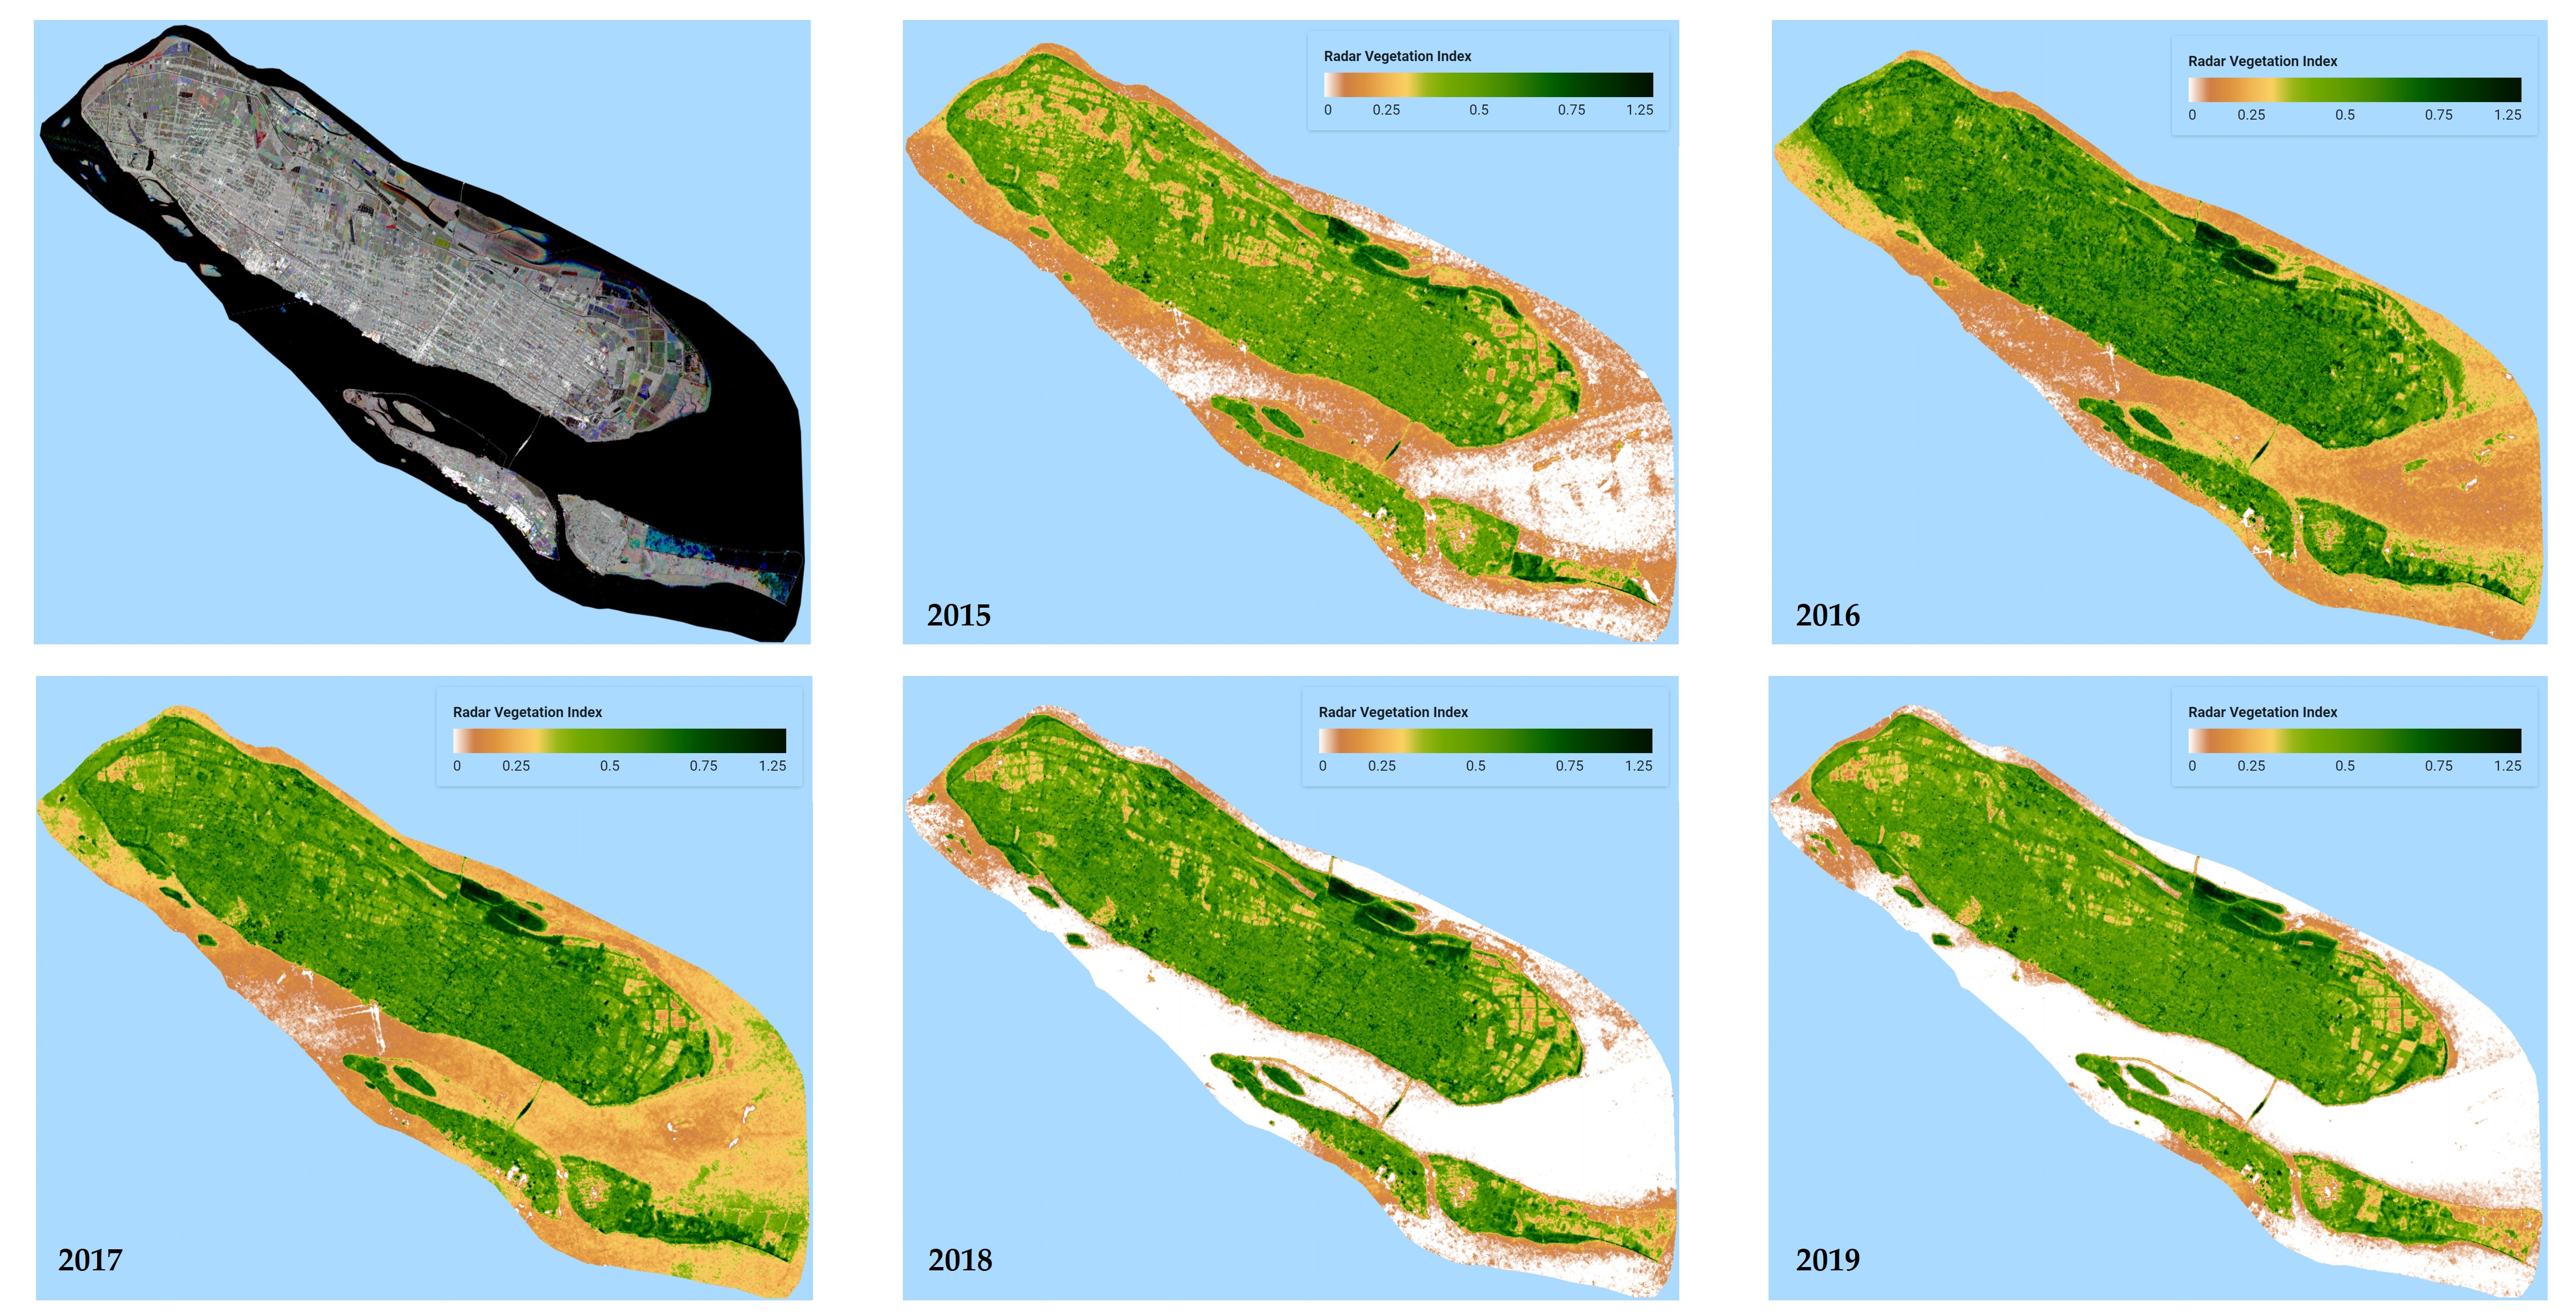
3]. Located at the north of Shanghai, Chongming island is the largest alluvial island in China and has a large swath of un-parceled land. As one of the least industrialized and populated areas, Chongiming island is the only place in the Shanghai metropolitan region for the development of one of the biggest eco-islands and perfect tourist destinations in the world [
4]. Thus, the Shanghai government and Chongming local government have issued the Chongming eco-island master plan since 2005 [
4], to develop forest and wetland parks for eco-tourism.
In 2006, forests covered approximately 17.0 % of the land surface of Chongming island [
5,
6]. The Chongming local government has continuously planted trees and afforested, and therefore the forest coverage rate reached 27.4% by the end of 2019 [
7]. According to the general land-use plan of Chongming district, Chongming’s forest coverage rate will reach 30 % by the end of 2020, and will reach 35% by 2035 [
7]. These large-scale man-made forests require a large labor force to participate in the conservation and use of advanced forest management methods [
8,
9,
10,
11,
12], thereby promoting employment, increasing forest-based eco-tourism income, and achieving the sustainable development of Chongming island [
13,
14].
Unfortunately, the ecological environment of Chongimng island is vulnerable. Chongming island is located in the borderlands between fresh- and saltwater environments, where the Yangtze River meets the East China Sea. Hence, the ecological environment of Chongming is mixed from freshwater streams and rivers with salty ocean tides, and is also affected by climate and human activity [
15,
16,
17]. These natural and anthropic driven factors pose a huge challenge for managing and ensuring the sustainability of the forest on Chongming island [
18,
19,
20].
To this end, estimating and monitoring forest change within Chongming island is required for the sustainable management of forest resources and forest-based eco-tourism as timely as possible. Optical satellites can be used for estimating forest canopy. In [
21], multispectral images collected from the GeoEye satellite were applied to identify, segment, and map canopy palms in the Amazon forest. Unfortunately, optical satellite sensors are affected by cloud cover and moisture. Clouds reduce and even mask the spatial and radiometric correction of satellite images and also decrease the useful area on each image, making it difficult to monitor forest changes. Therefore, Sanchez et al. performed a comparative study to determine the most suitable cloud detection algorithm for the Amazon rainforest on Sentinel-2 images [
22]. In [
23], some Landsat satellite cloud free images acquired during the dry season for detecting landscape pattern changes in Chongming island.
For collecting cloud-free data, active satellite-based techniques [
24] such as space-borne synthetic aperture radar(SAR) [
25] and global navigation satellite system (GNSS) [
26], have been developed for the retrieval of forest biomass. Thanks to Copernicus Sentinel program coordinated by the European Space Agency (ESA), high quality SAR radar and optical sensors data are free, full, and open access [
27]. Recently, Hansen et al. [
28] applied a support vector machine (SVM) classifier on Sentinel-1 SAR data to extract six partially forested areas in Alaska, Colombia, Finland, Florida, Indonesia, and the UK. In another study, a Sentinel-1 SAR-based detection method was developed to map water cover in wetlands by using the WEKA k-means clustering algorithm, producing a good connection between the Sentinel-1 C-SAR, Landsat 8, and Sentinel-2 results [
29]. Tricht et al. [
30] developed a random forest-based crop mapping approach and tested on 12-day Sentinel-1 backscatter mosaics and 10-daily Sentinel-2 smoothed mosaics over Belgium during the growing season in 2017. Agapiou successfully used Sentinel-1 SAR and Sentinel-2 data for estimating the proportion of vegetation cover [
31]. Heckel et al. [
32] demonstrated the potential of joint radar/optical imagery for predicting forest cover in temperate dense mixed forests in Germany and open savanna woody vegetation and forest plantations in South Africa. Hirschmugl et al. [
33] also combined a dense time series of optical (Sentinel-2 and Landsat 8) and Sentinel-1 SAR data for forest disturbance mapping at test sites in Peru and Gabon. In the work by Niculescu et al., a random forest-based method was used to Sentinel-1 SAR data, the Sentinel-2 optical data, Pleiades, and in situ observations for discrimination and mapping of reed against submerged aquatic vegetation, emergent macrophytes, some floating broad-leaved plants communities, and floating vegetation of delta lakes [
34]. Mahdianpari et al. [
35] developed both pixel-based and object-based random forest (RF) classifications implemented on the Google Earth Engine platform, and used multi-year summer Sentinel-1 SAR and optical Sentinel-2 data composites to study the spatial distribution of five wetland and three non-wetland classes on the island of Newfoundland. Based on combined Landsat 8 OLI, ALOS-1 PALSAR, Sentinel-1, and LiDAR-derived topographic metrics, LaRocque et al. [
36] specifically mapped wetland for southern New Brunswick, Canada, pointing towards future potential for the synergistic use of radar and optical satellite imagery. Musthafa et al. [
37] used L-band ALOS/PALSAR and ALOS-2/PALSAR-2 fully polarimetric data to explore the dynamics of homogeneous and heterogeneous forest compartments having single and multiple species composition, respectively. In the study by Akhtar et al. [
38], Pleiades high-resolution passive optical and ALOS PALSAR satellite imagery were applied for aboveground biomass estimation in the subtropical mountainous Chir Pine (Pinus roxburghii) forest in Murree Forest Division, Punjab, Pakistan.
The goal of this study is to develop an approach to quantify detailed snapshots of current man-made forest change in the Chongming eco-island using Sentinel-1 SAR data for continuous mapping and monitoring. This will provide insight into forest change dynamics and concurrently capture the impacts of human activity on Chongming forest resource distribution. However, the consistent mapping on a relatively small local scale on Chongming island with short-duration growth events of forest canopies over multiple years is not a trivial challenge. To address these challenges, techniques for dual-polarization data information extraction are explored on cloud computing platforms. The proposed techniques will have a better understanding of forest change and view it through different representations.
4. Discussion
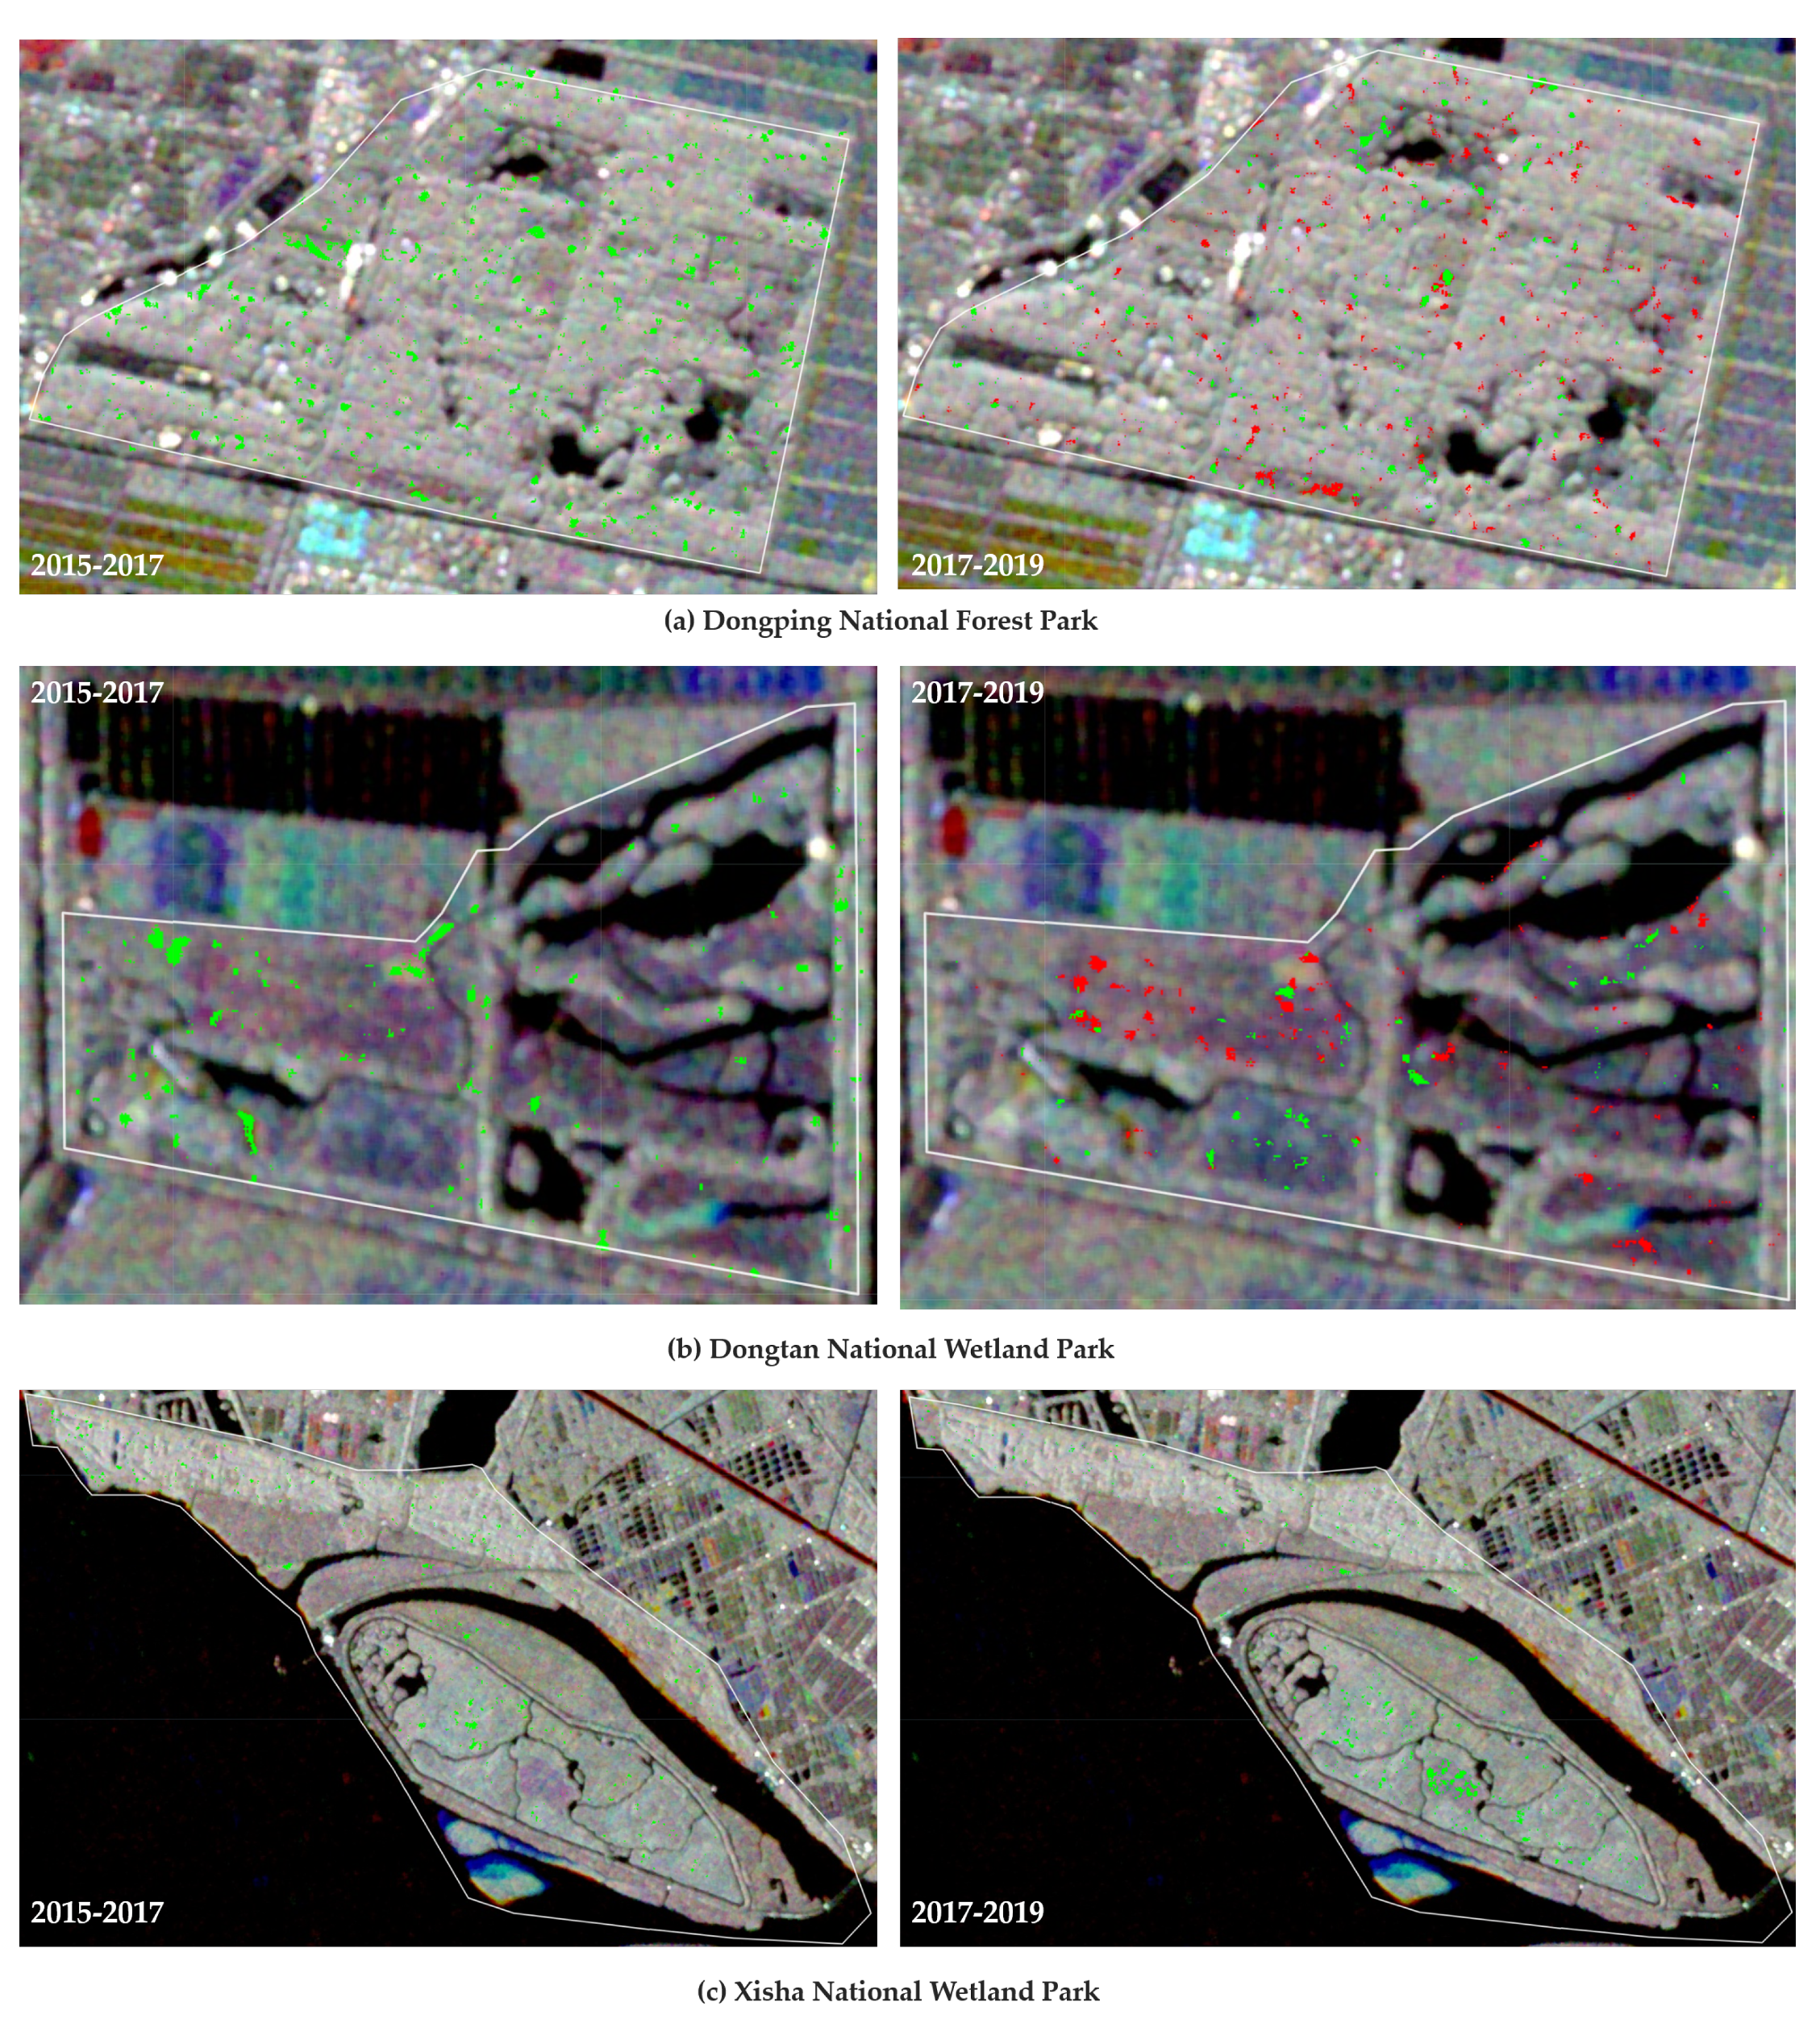
This study results reflect forest change driven by both climate and human activity in Chongming island. The Shanghai government has established its ambition to build Chongming island into a world-class ecological island. From 2016 to 2018, large-scale afforestation began on Chongming island [
39,
40,
41,
42]. For existing forest parks, the method of local adjustment and replanting of forests has been adopted to increase forest coverage [
56,
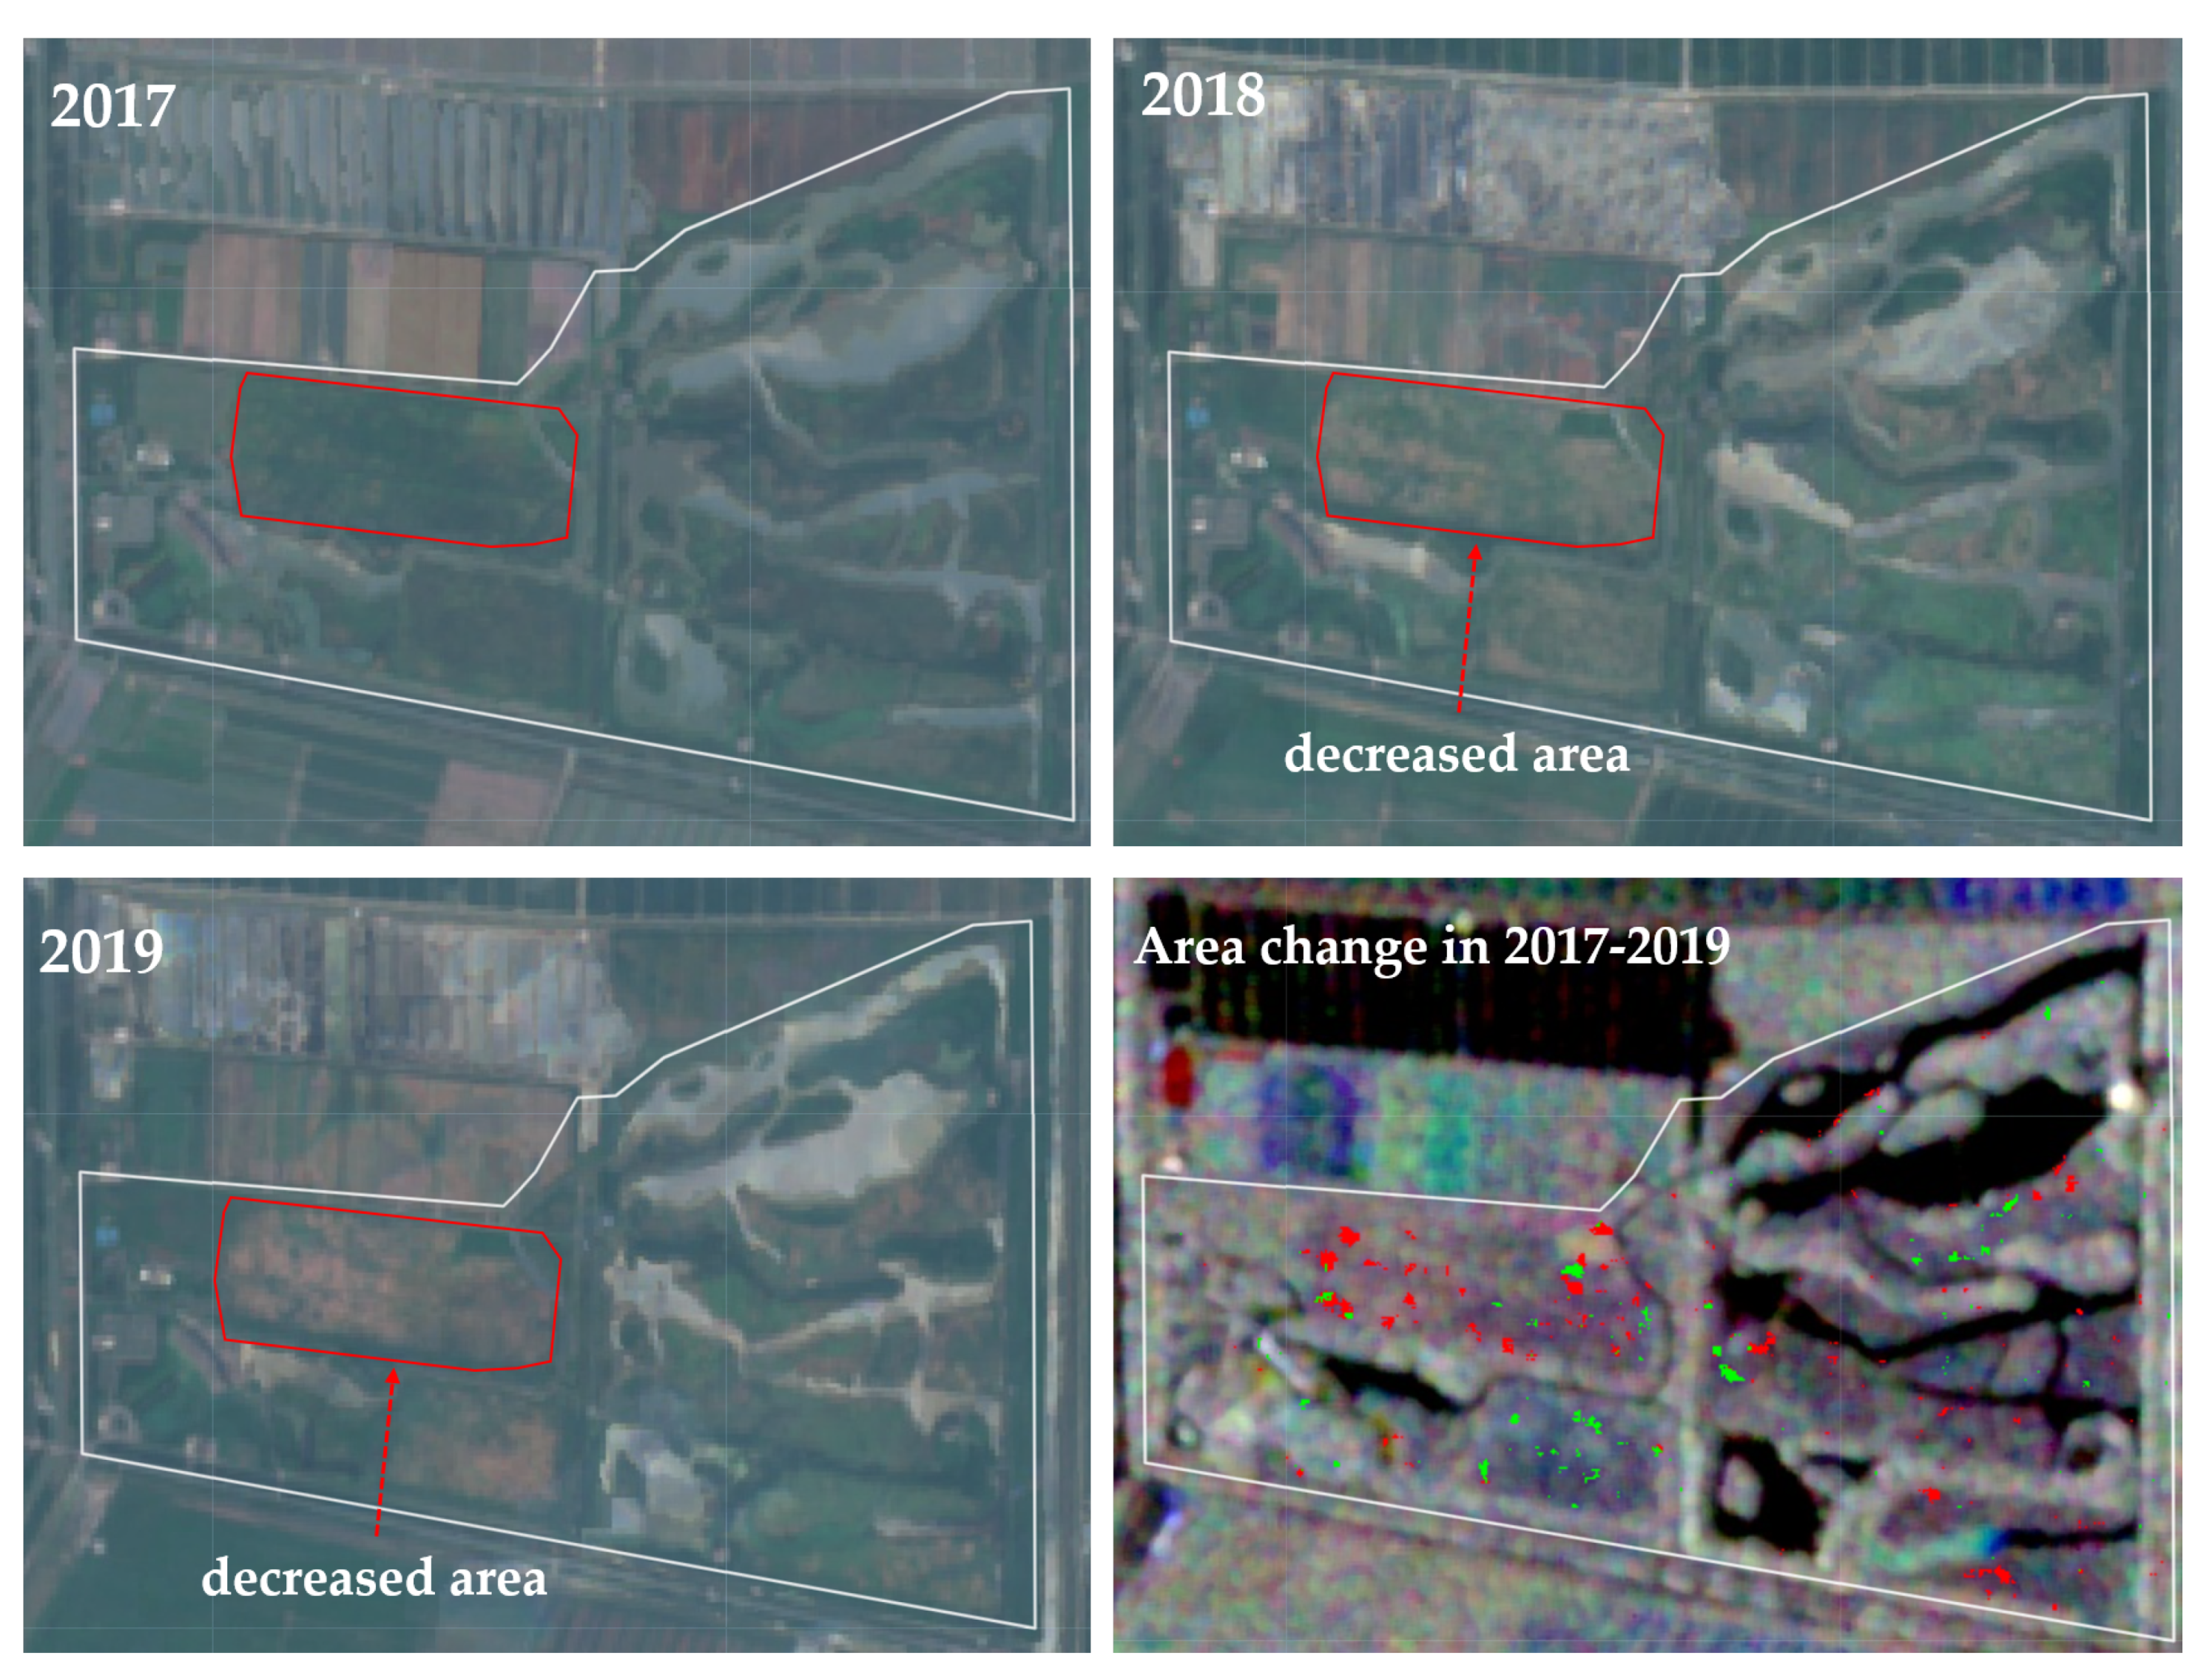
57]. Our research results are consistent with that the implementation of local government policies has increased the forest area, and the erosion of the river under the special ecological environment of the Yangtze River estuary has led to the reduction of forests.
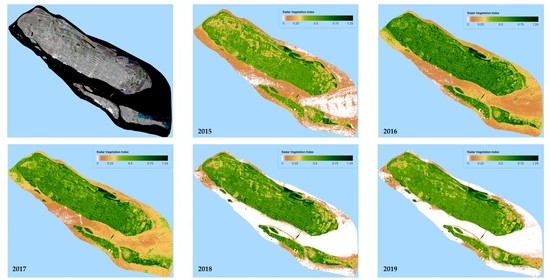
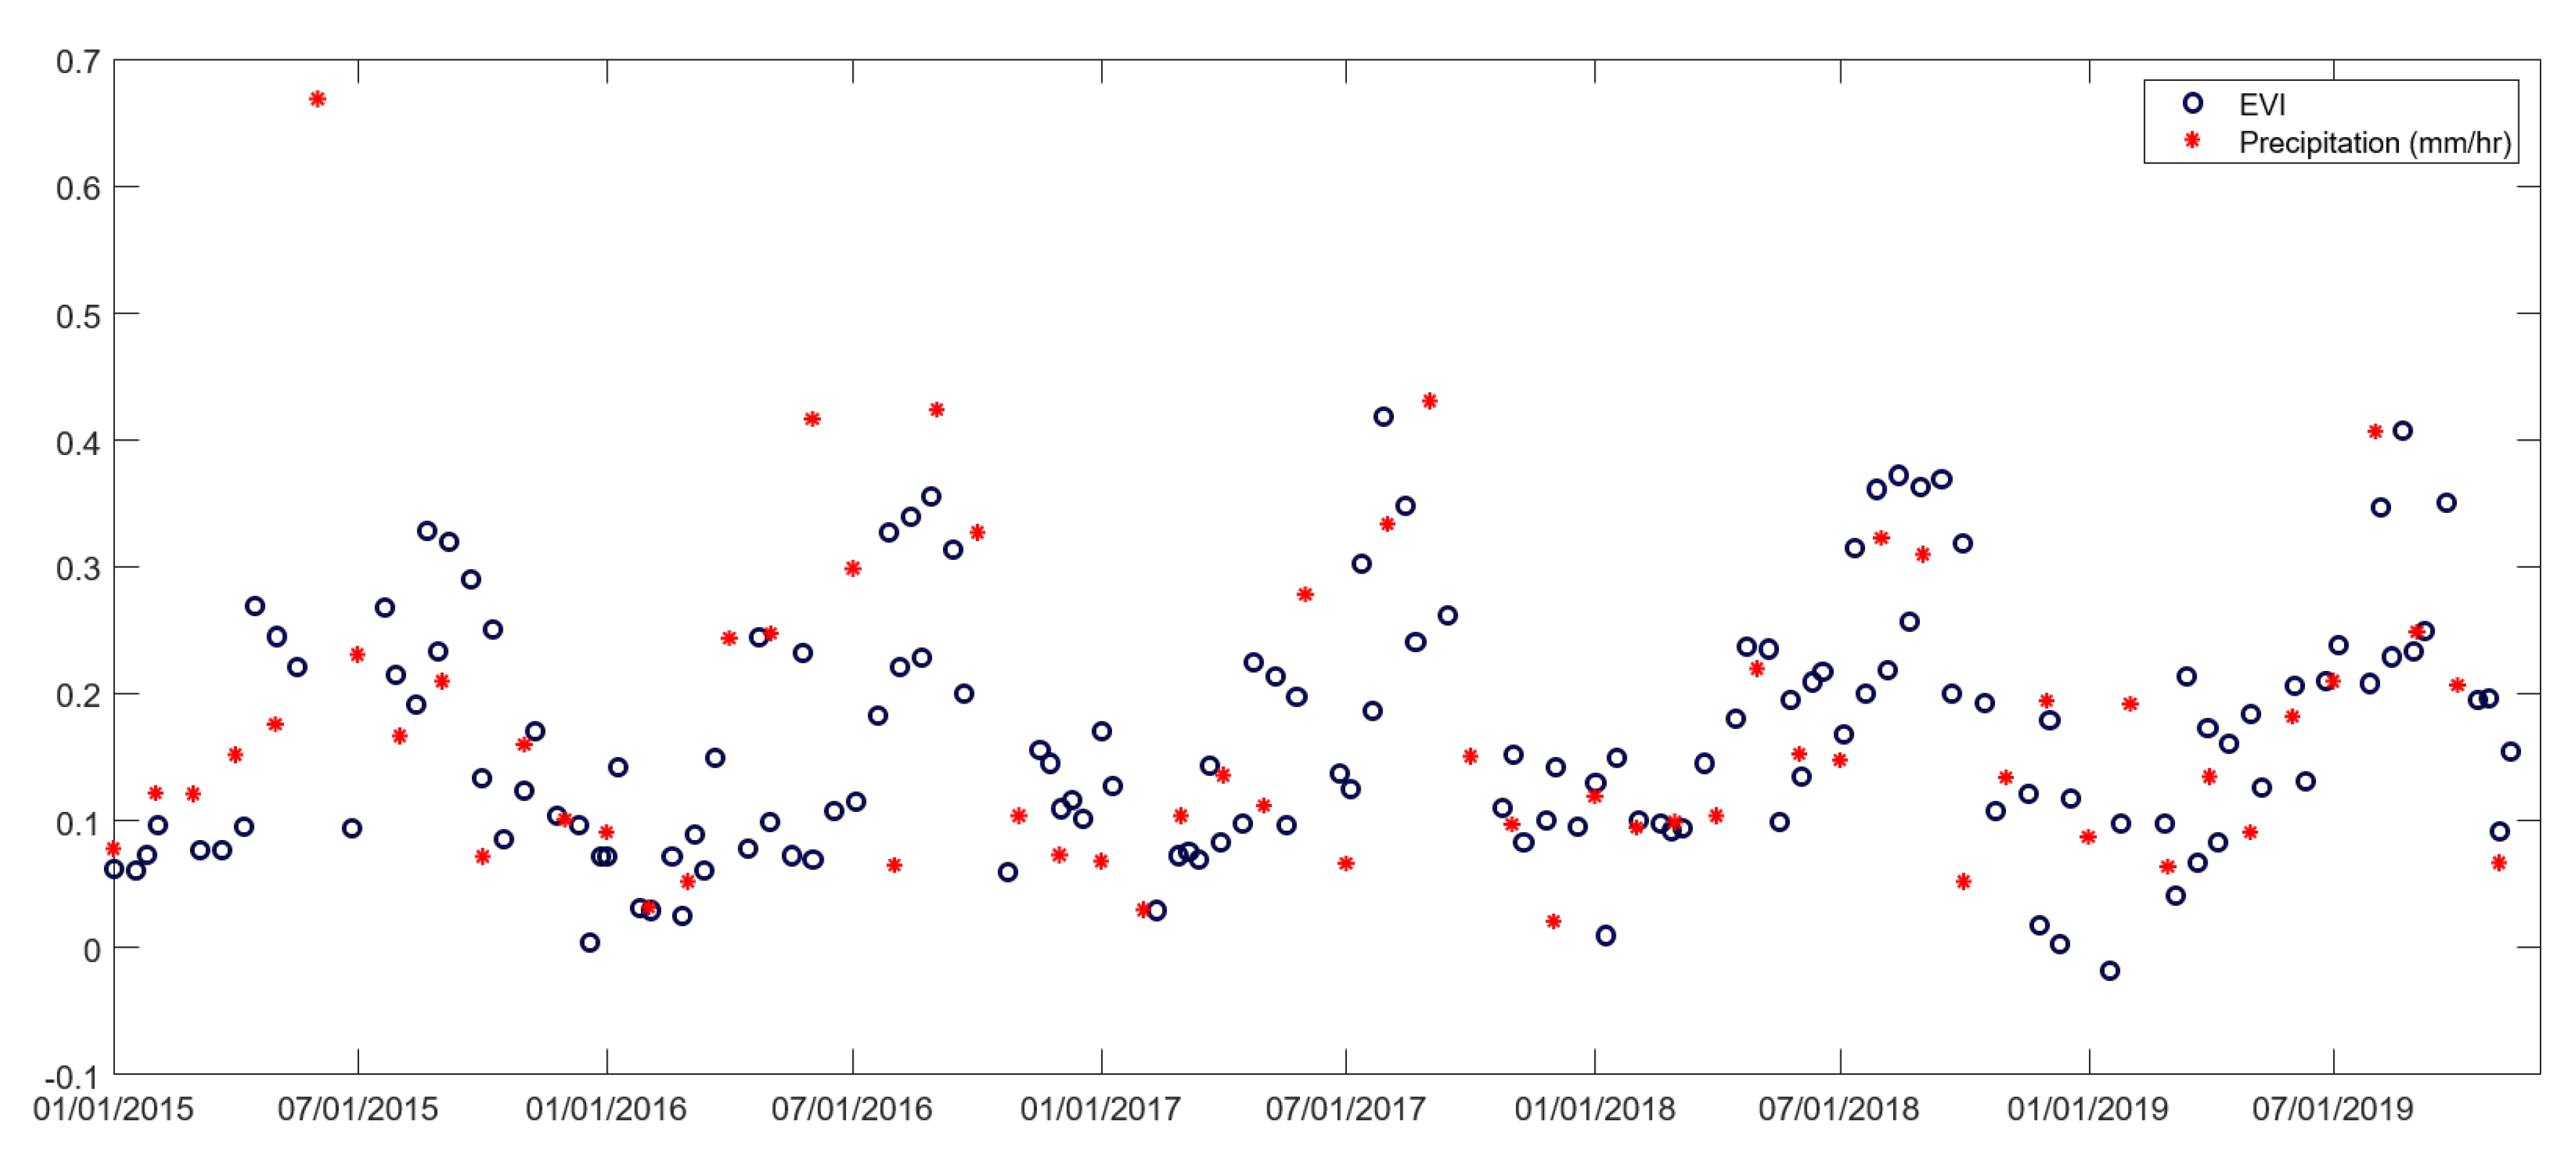
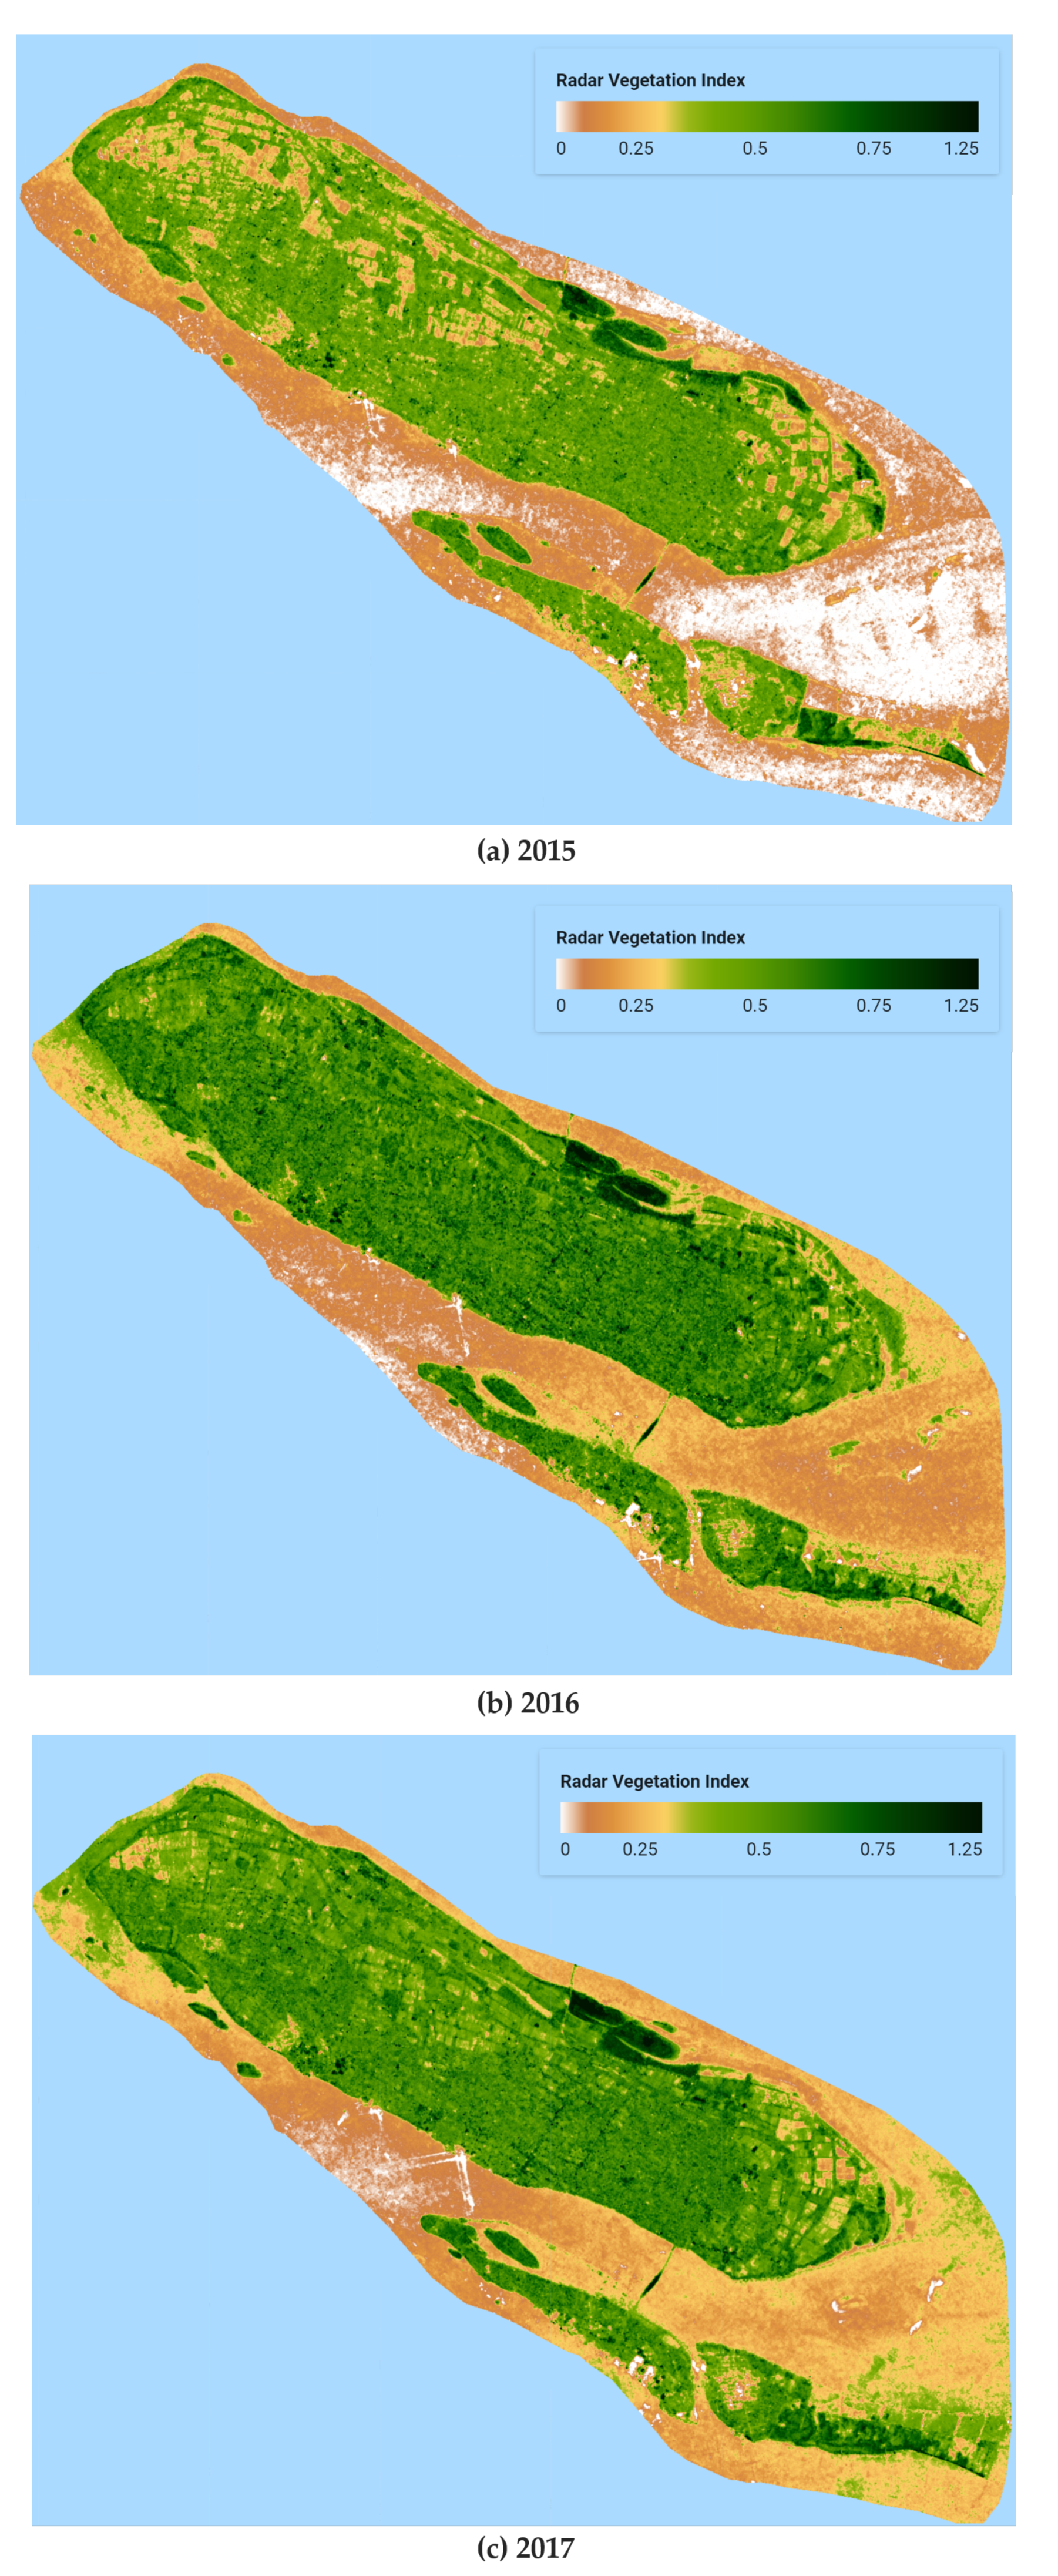
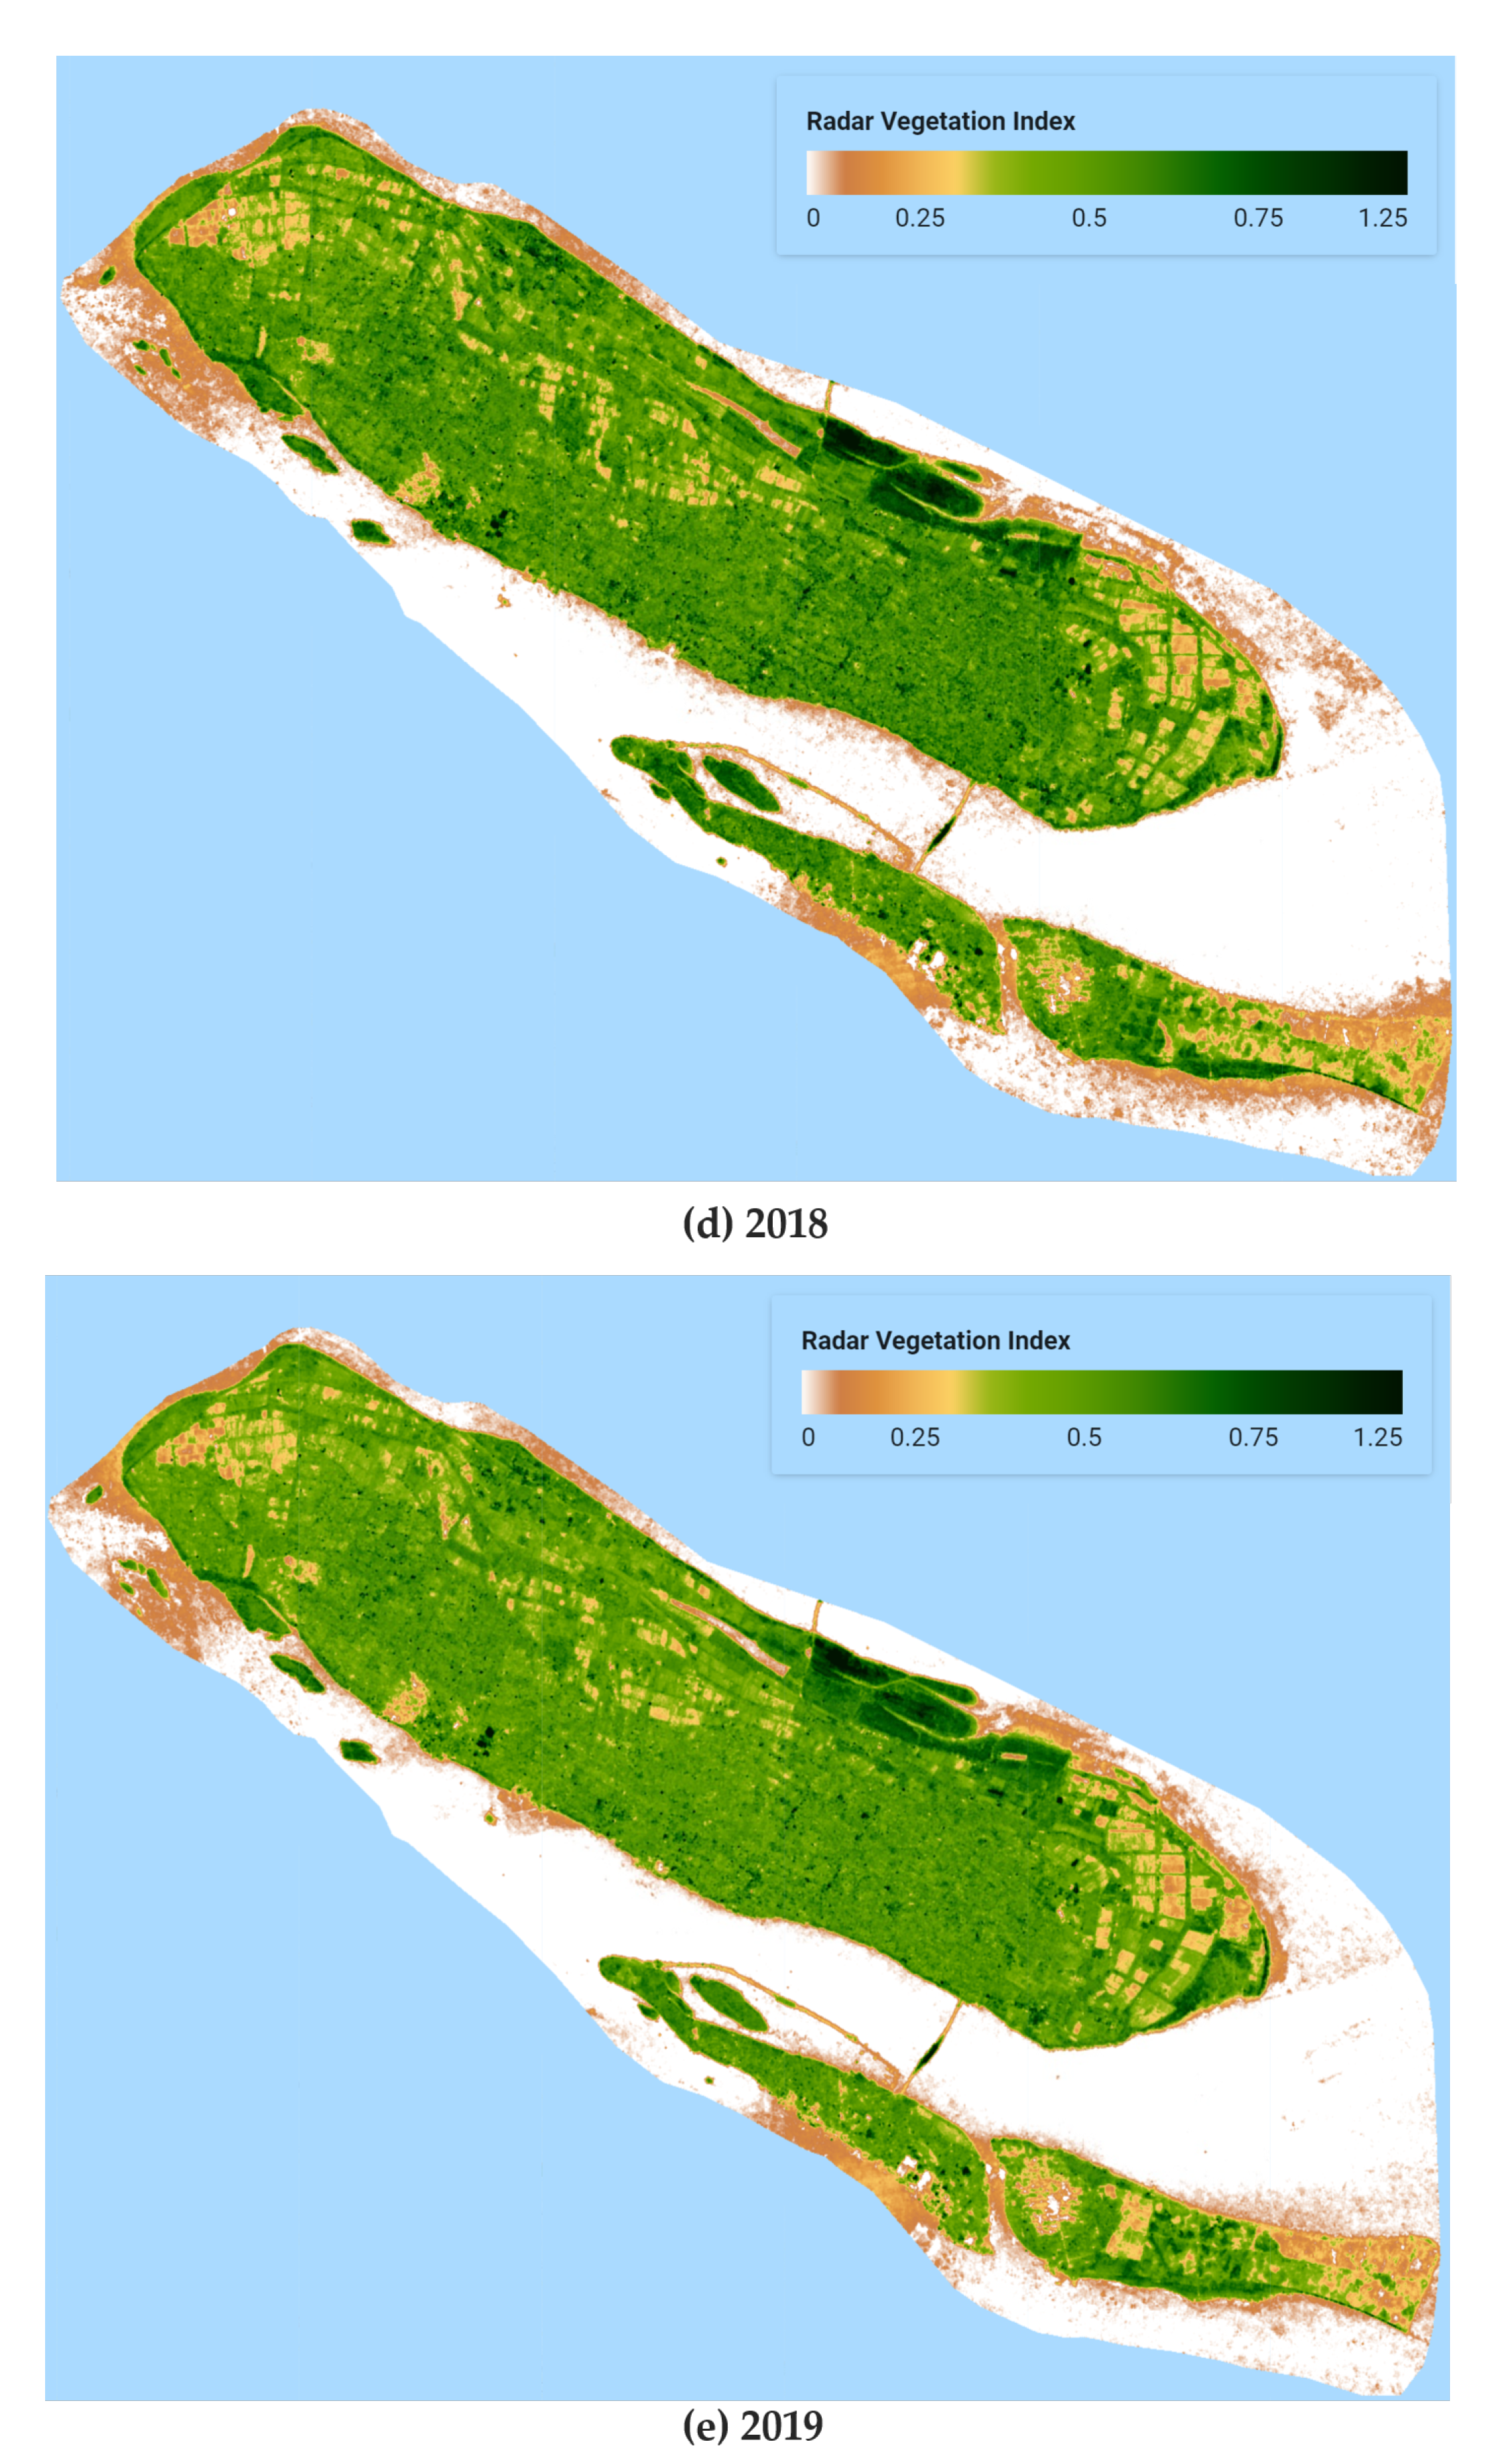
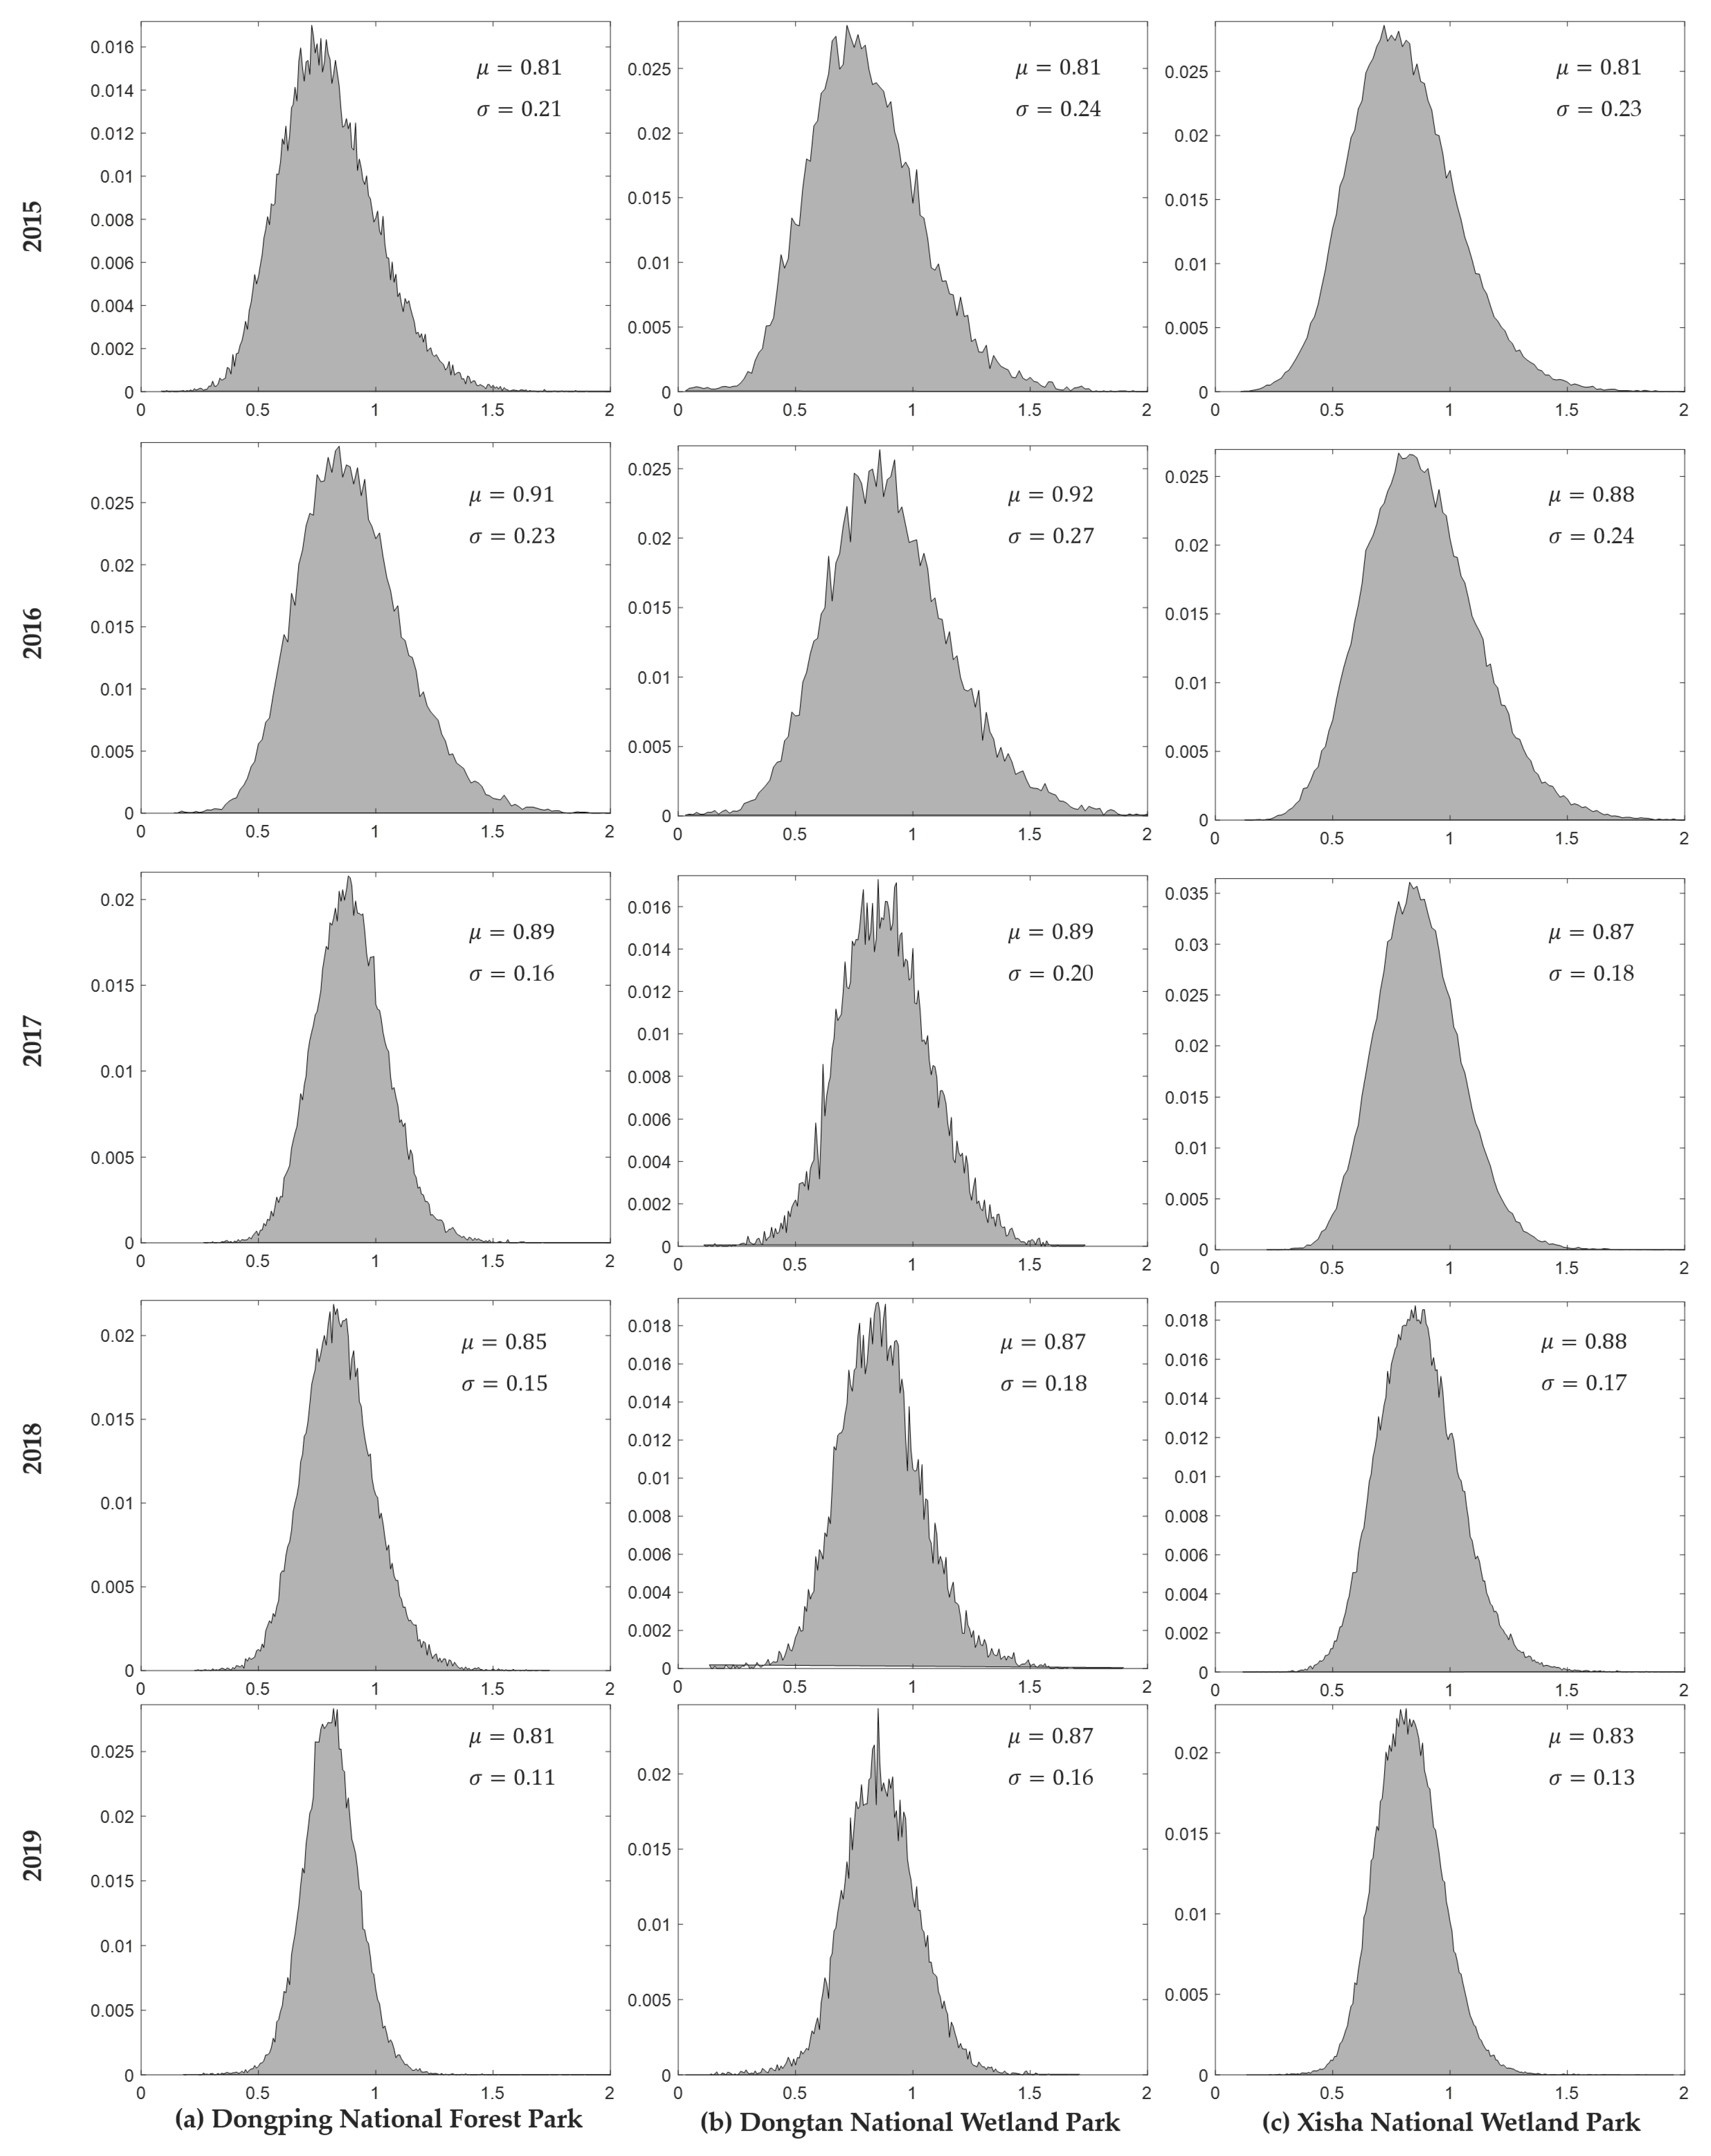
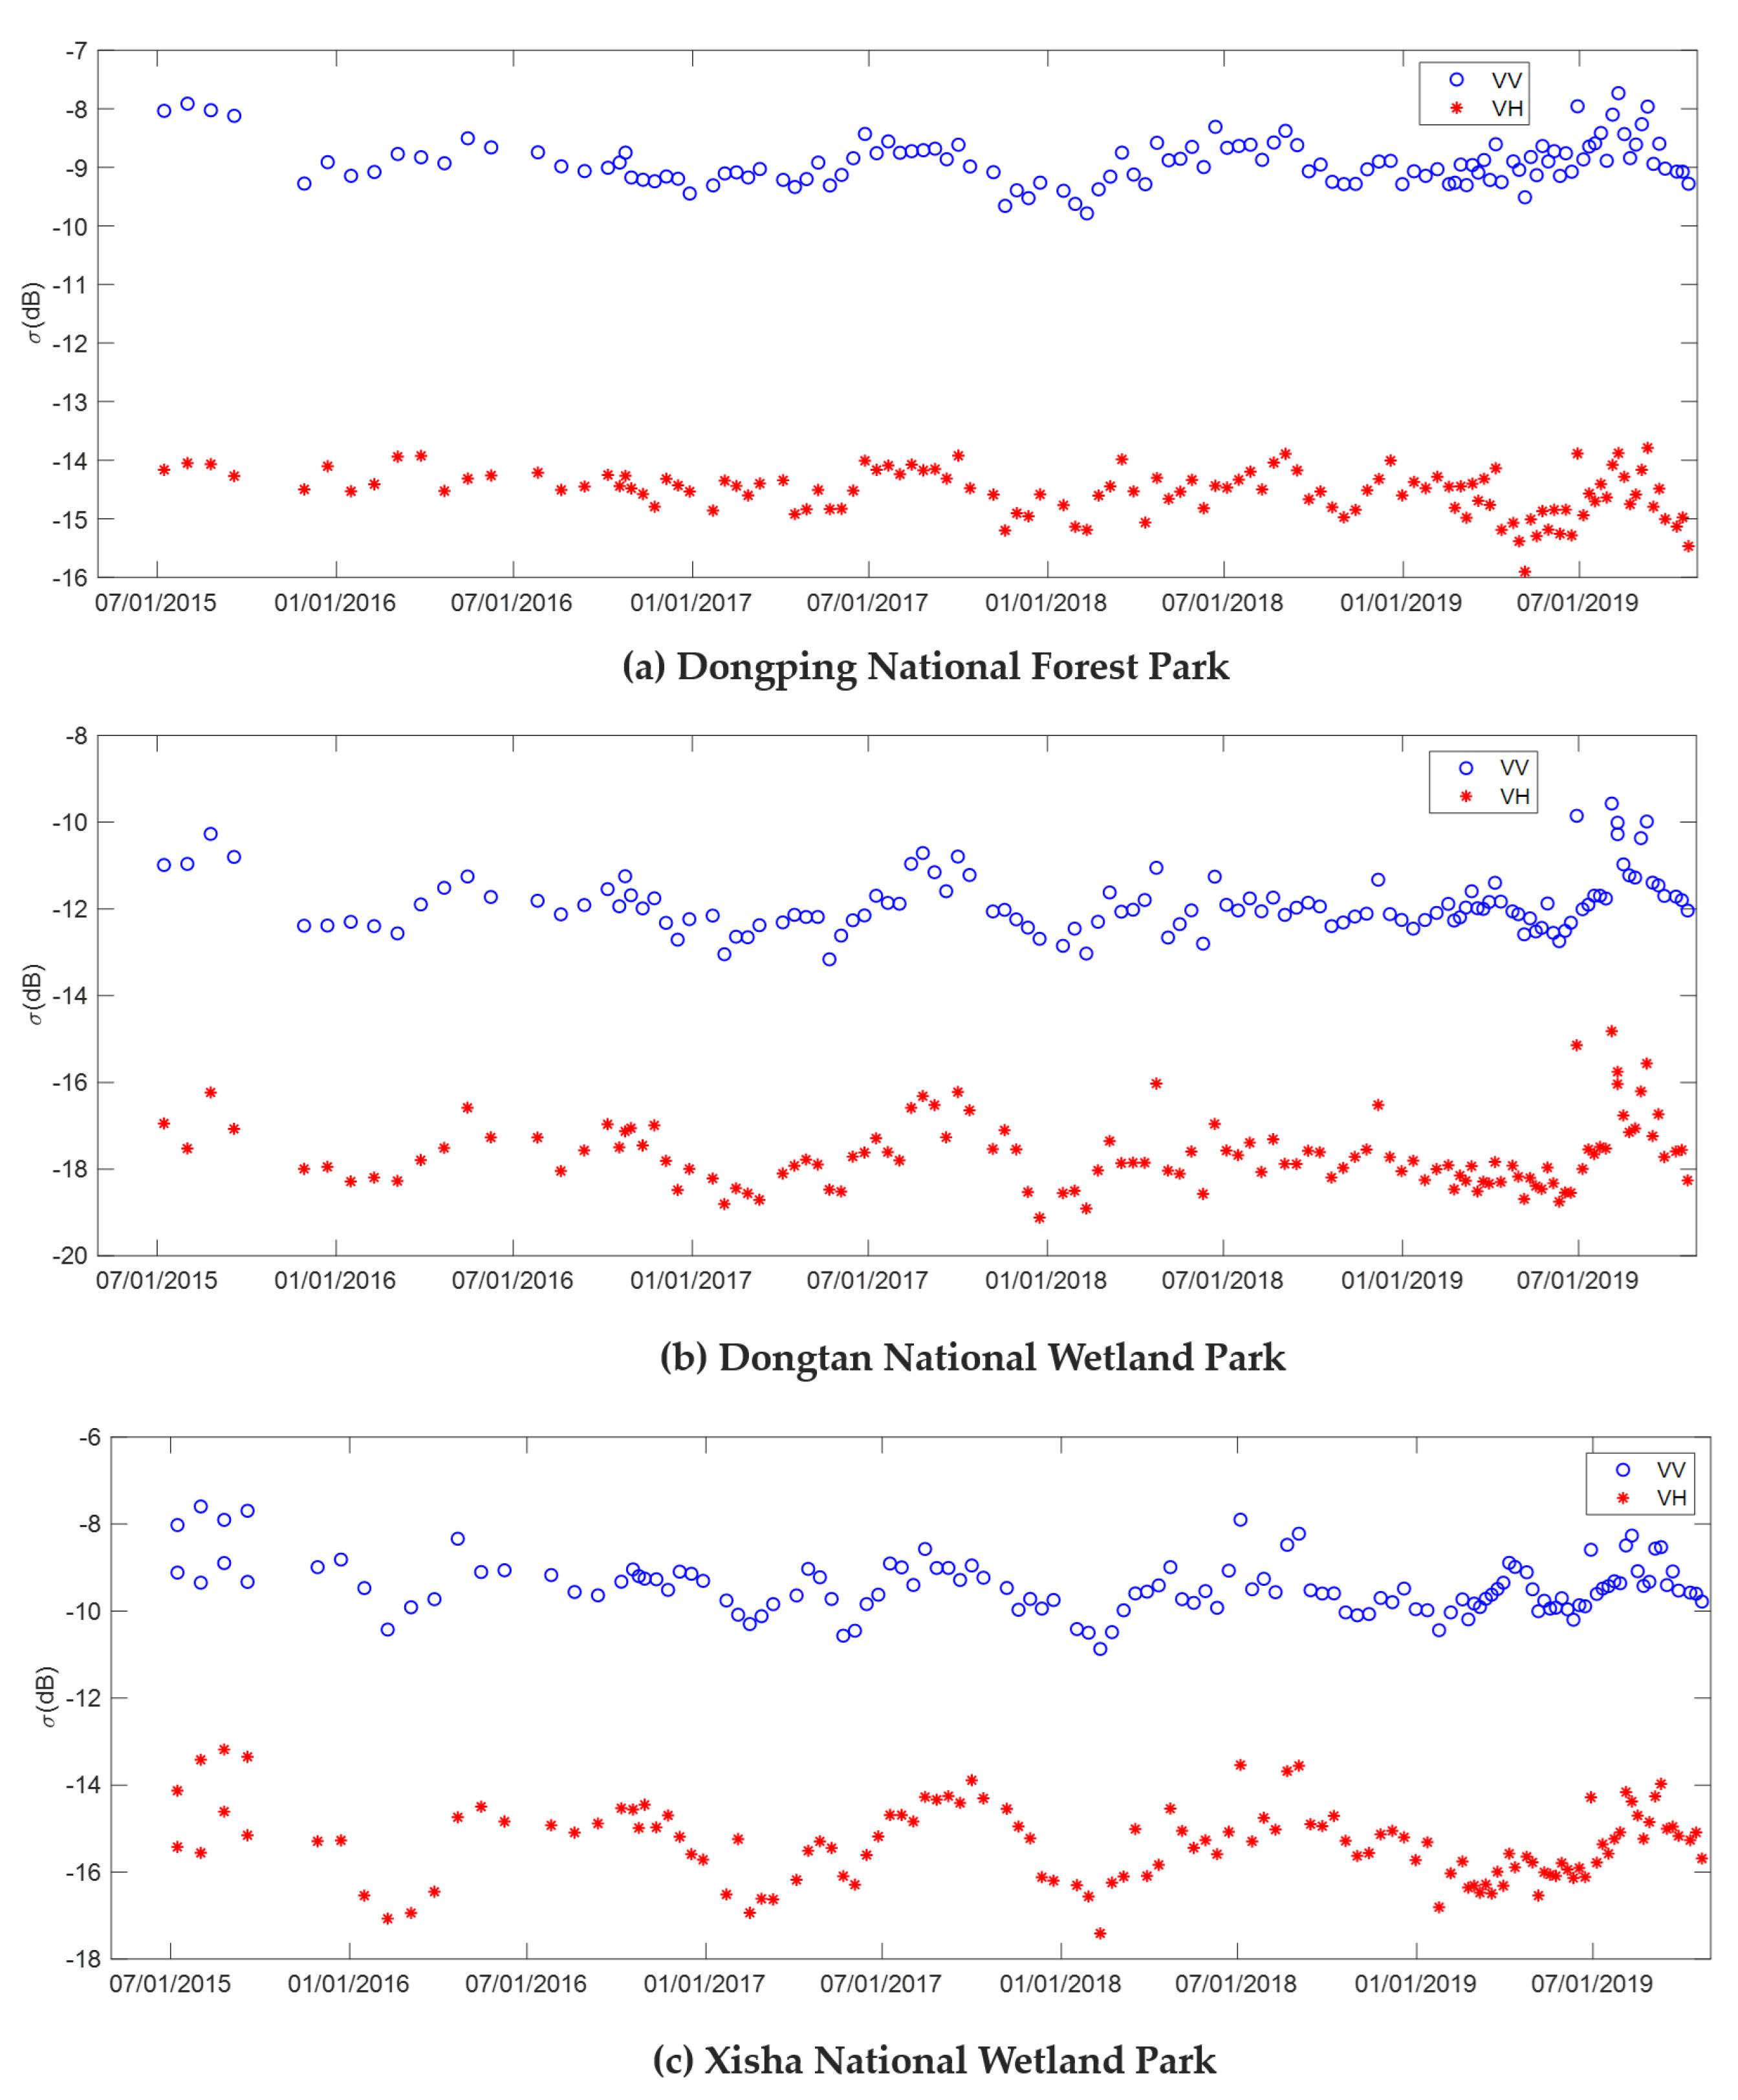
The potential use of Sentinel-1 SAR time series data can derive radar vegetation index for estuary such as Chongming island. Statistics of RVI distributions was helpful for indicating forest change. The exception is the averaged RVI in 2015, due to that fewer data was available in 2015. To illustrate this, all the available VV and VH data were plotted in
Figure 14. In the wet season, it is very challenging to retrieve the RVI, although SAR is a cloud-free system. Precipitation will affect the radar scattering on forest [
43,
58]. Therefore, increasing the number of observations can produce a more reliable average, thereby reducing the impact of precipitation conditions.
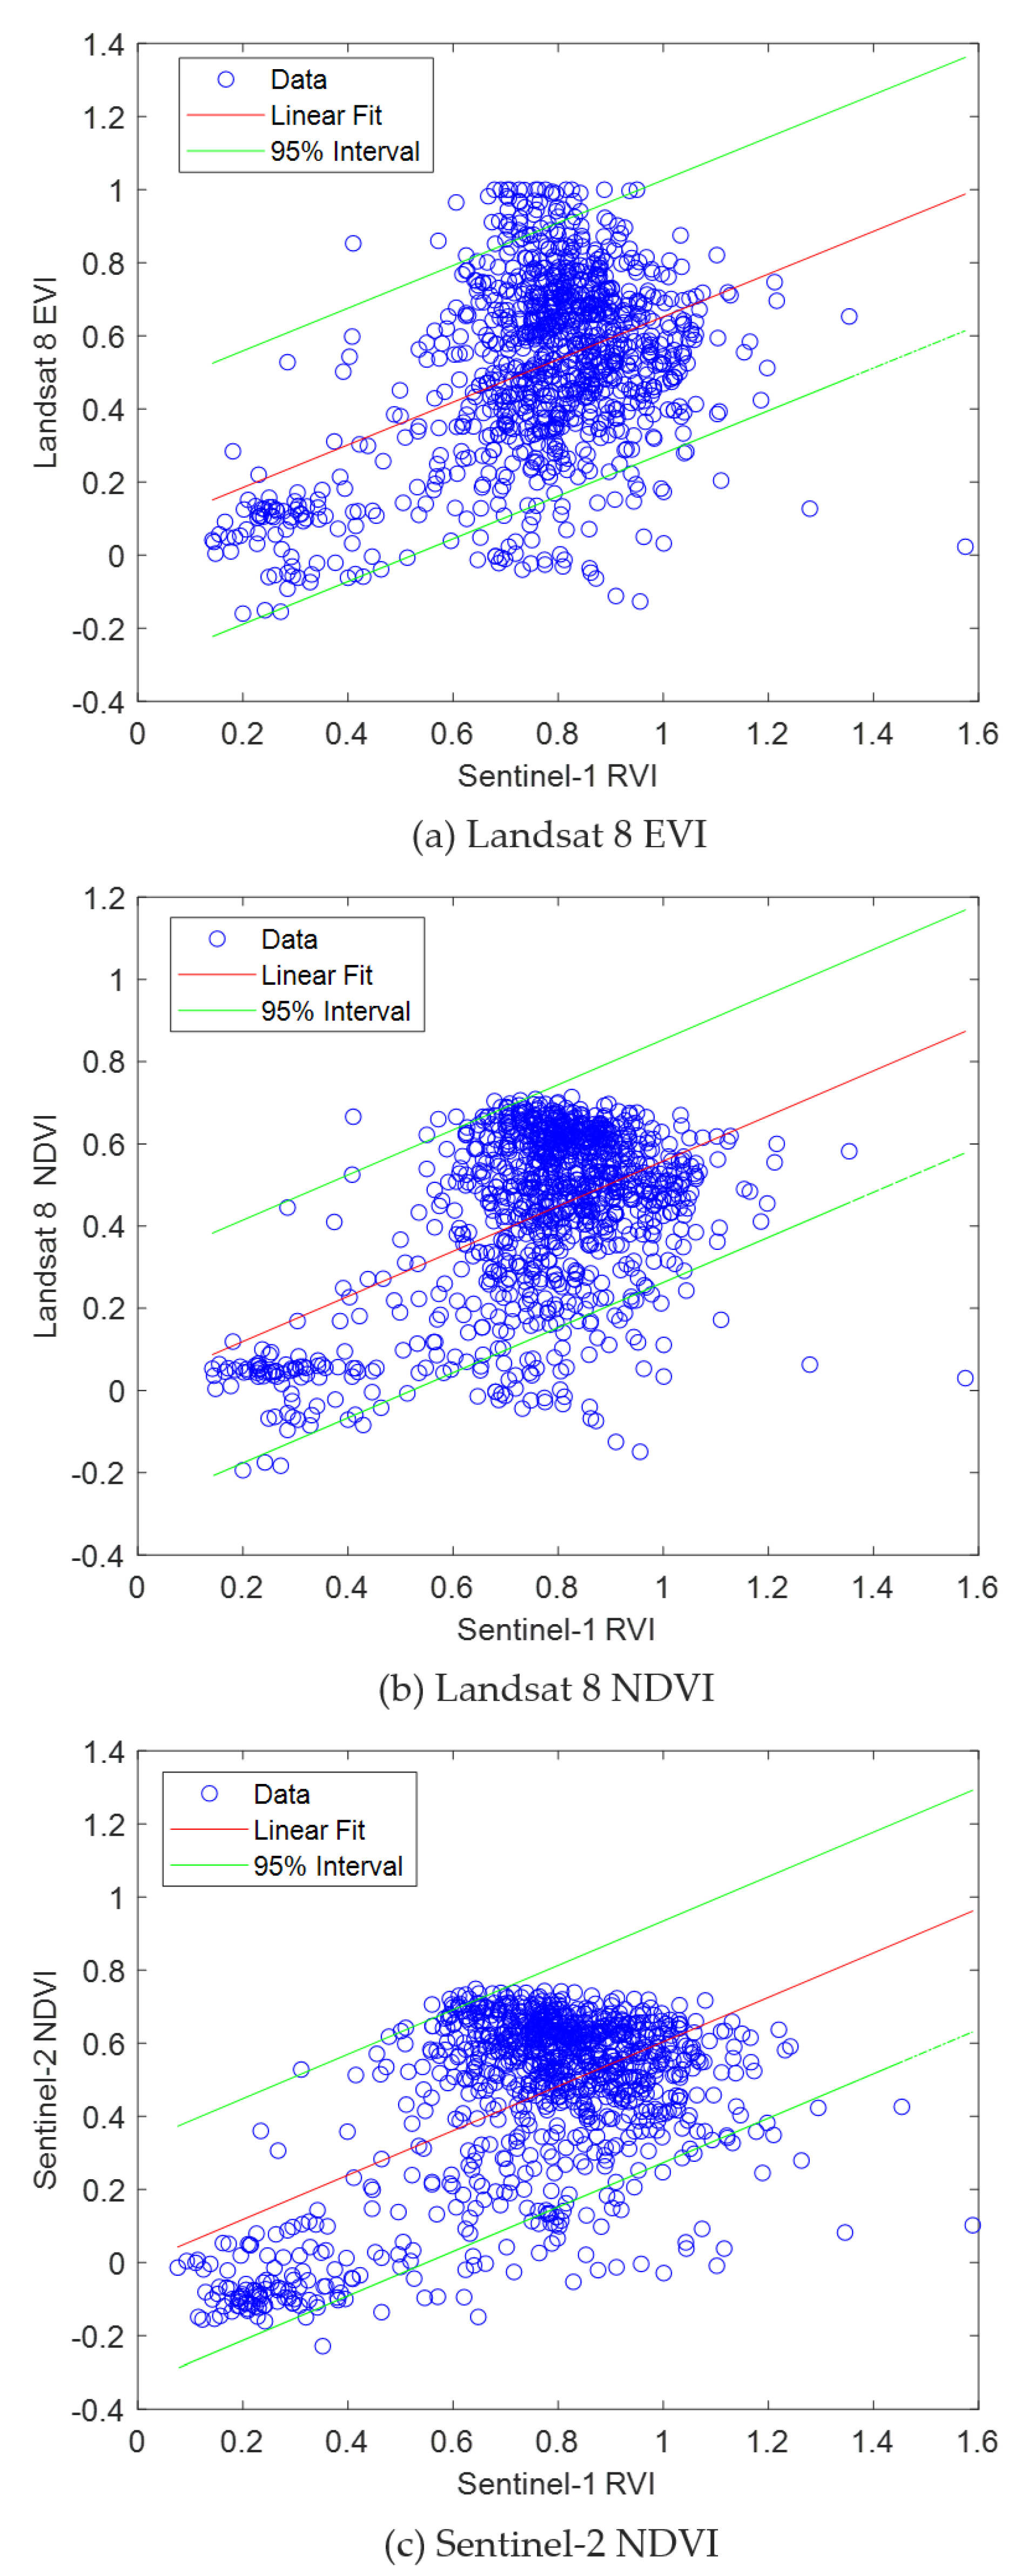
Linear regression results showed relatively good correlations between the RVI and optical vegetation index. The accuracy of the RVI can be improved by using full polarization data. The existing studies find that the main sources backscatter are the HV and VH cross-polarization band in the forest [
43]. However, the power of VV polarization data was larger than that of volume scattering component VH band in the forest regions, as plotted in
Figure 12. Hence, one of our future study will focus on the use of full polarization data to improve the accuracy of the RVI.
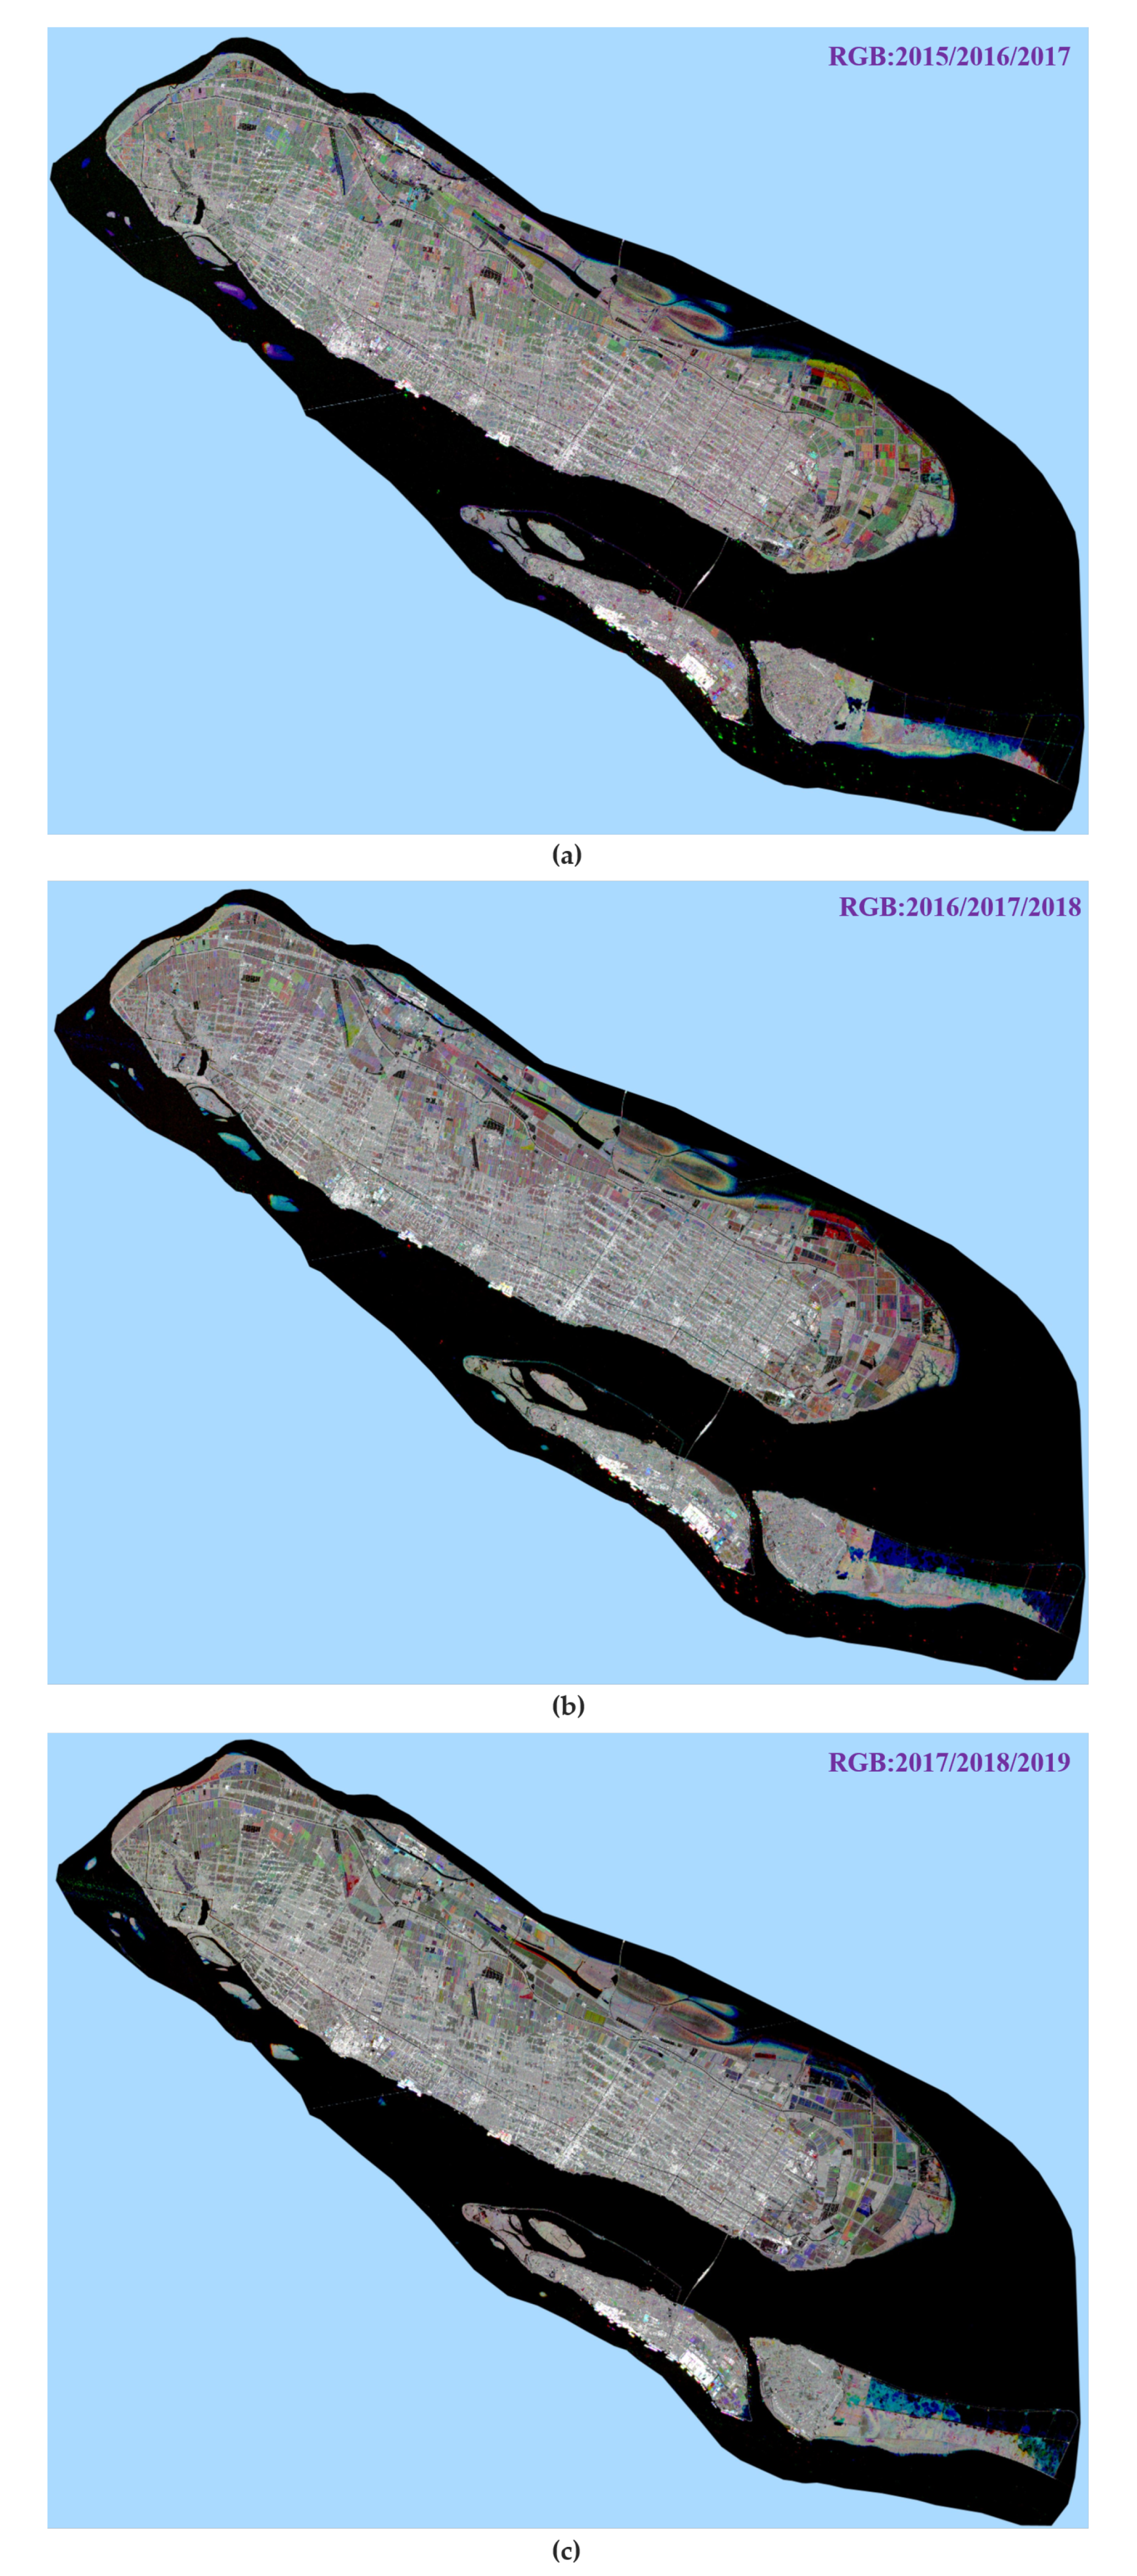
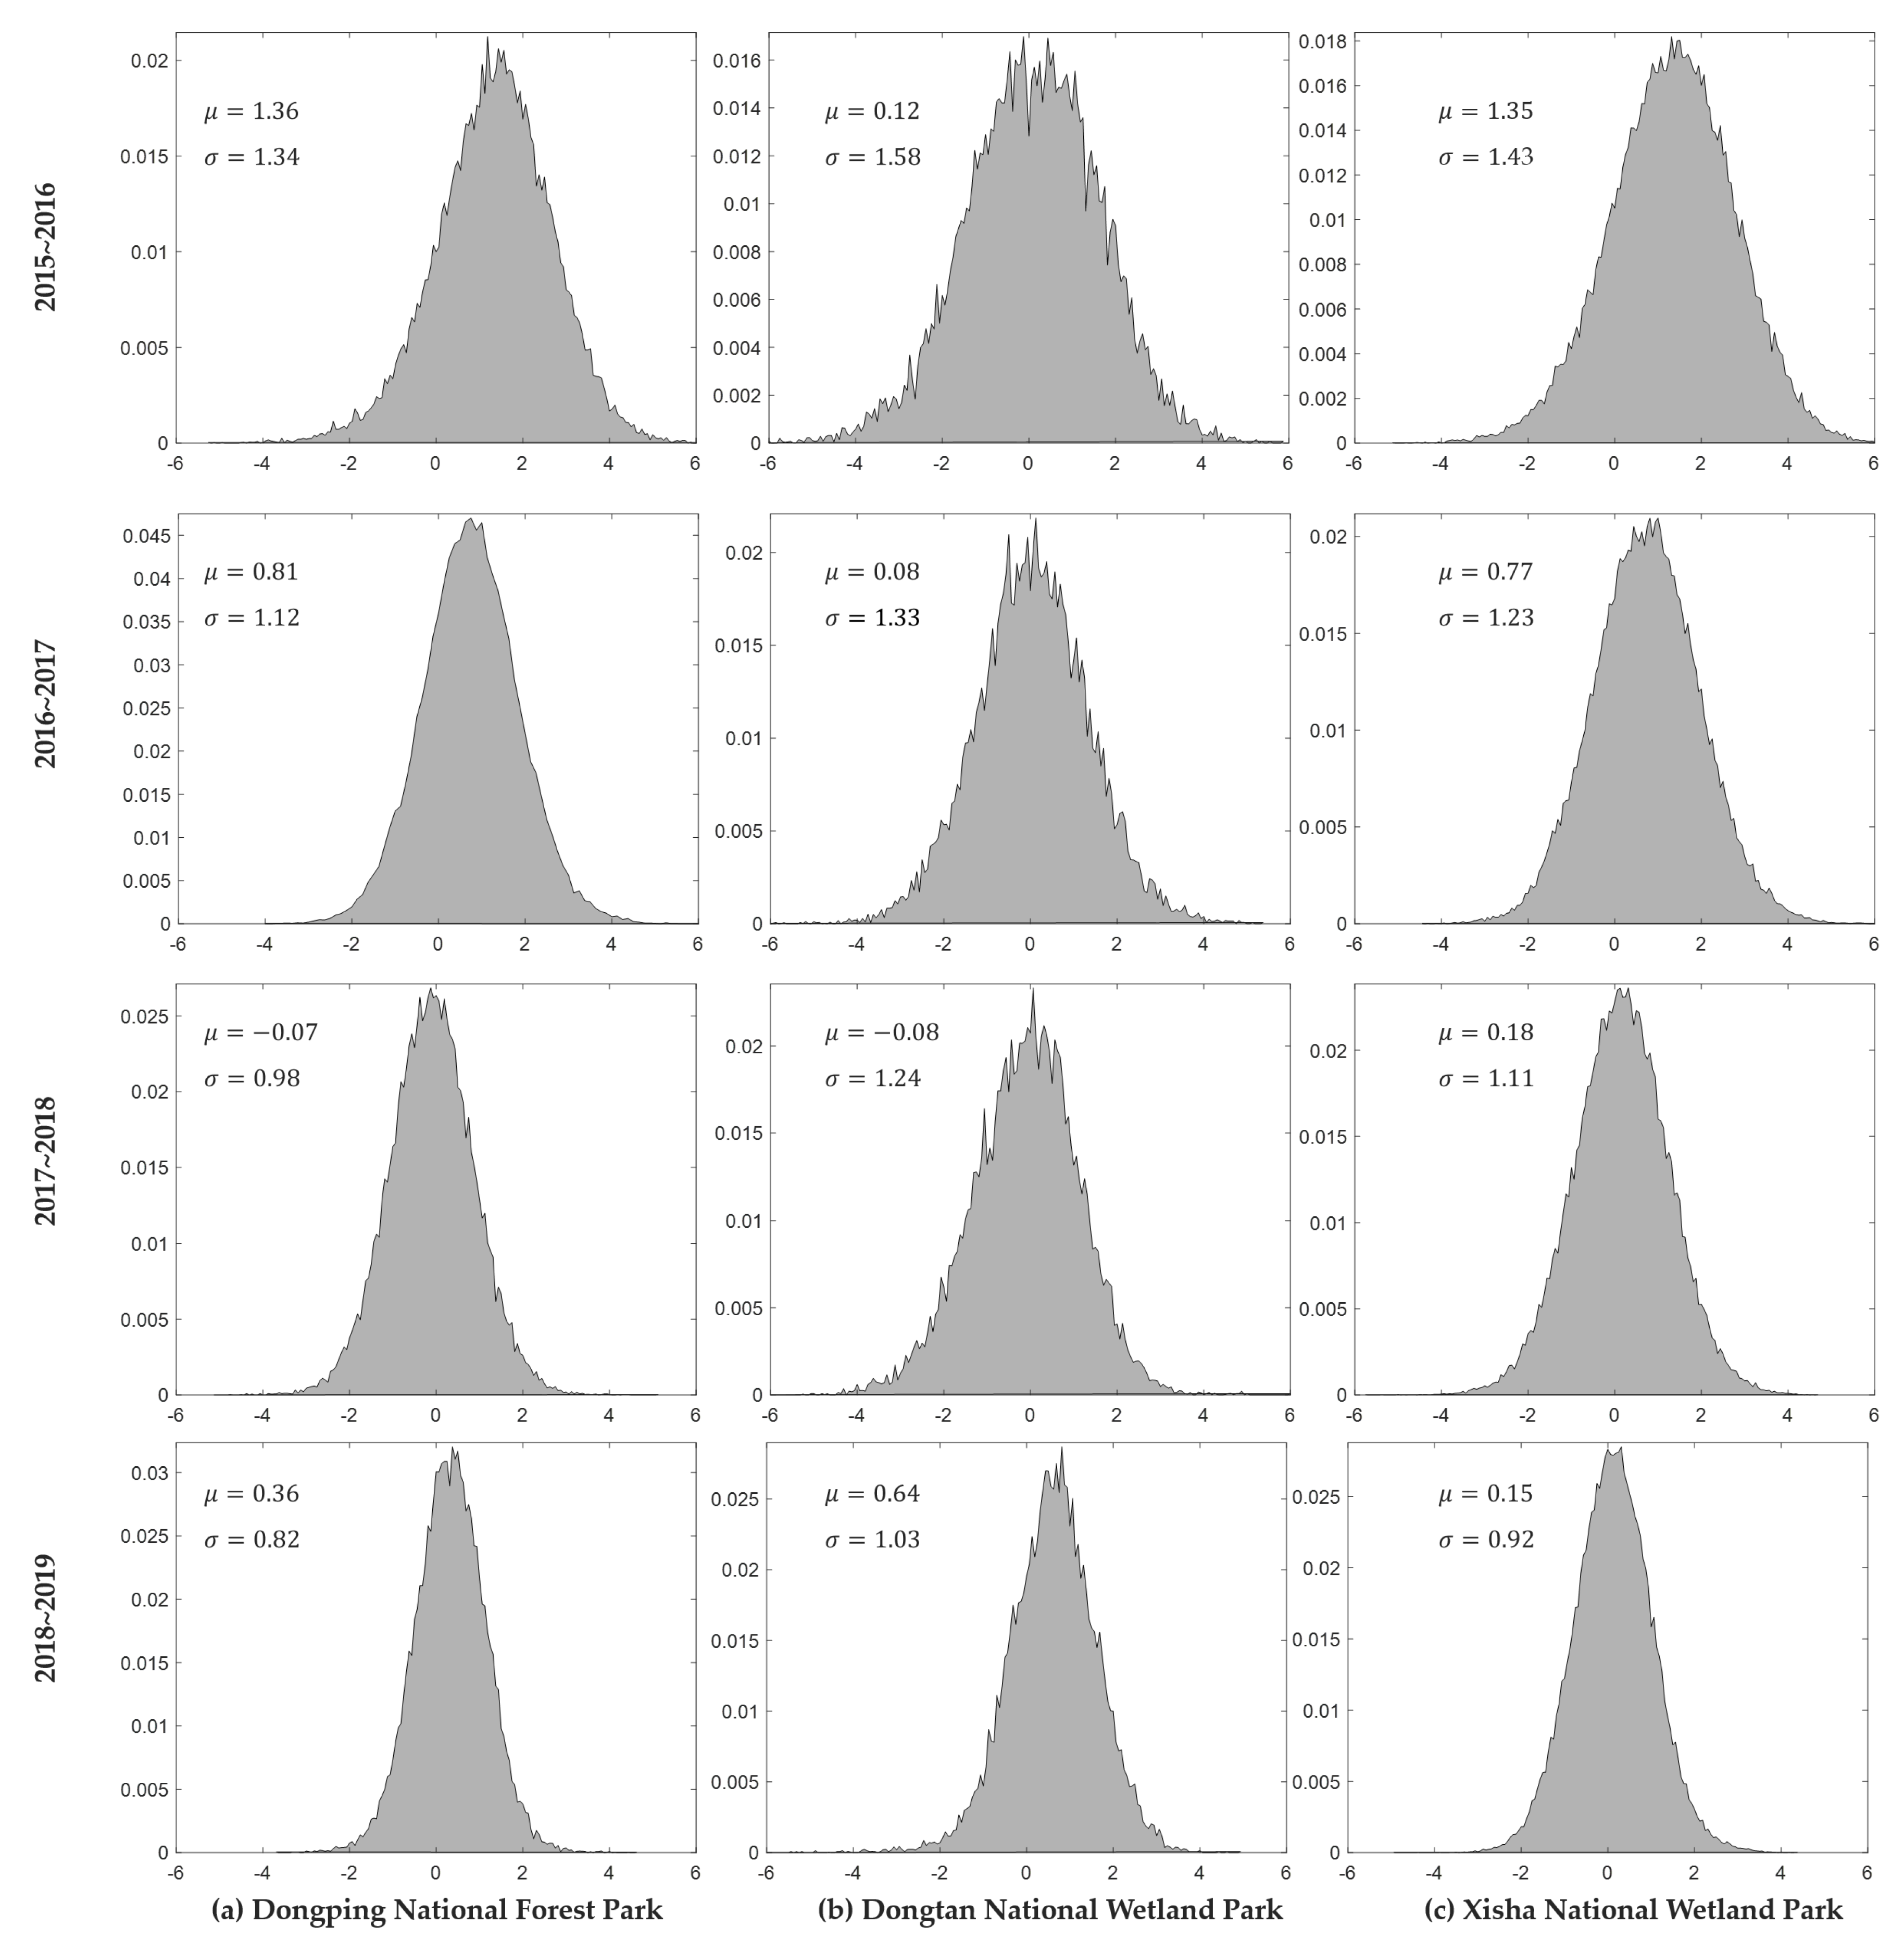
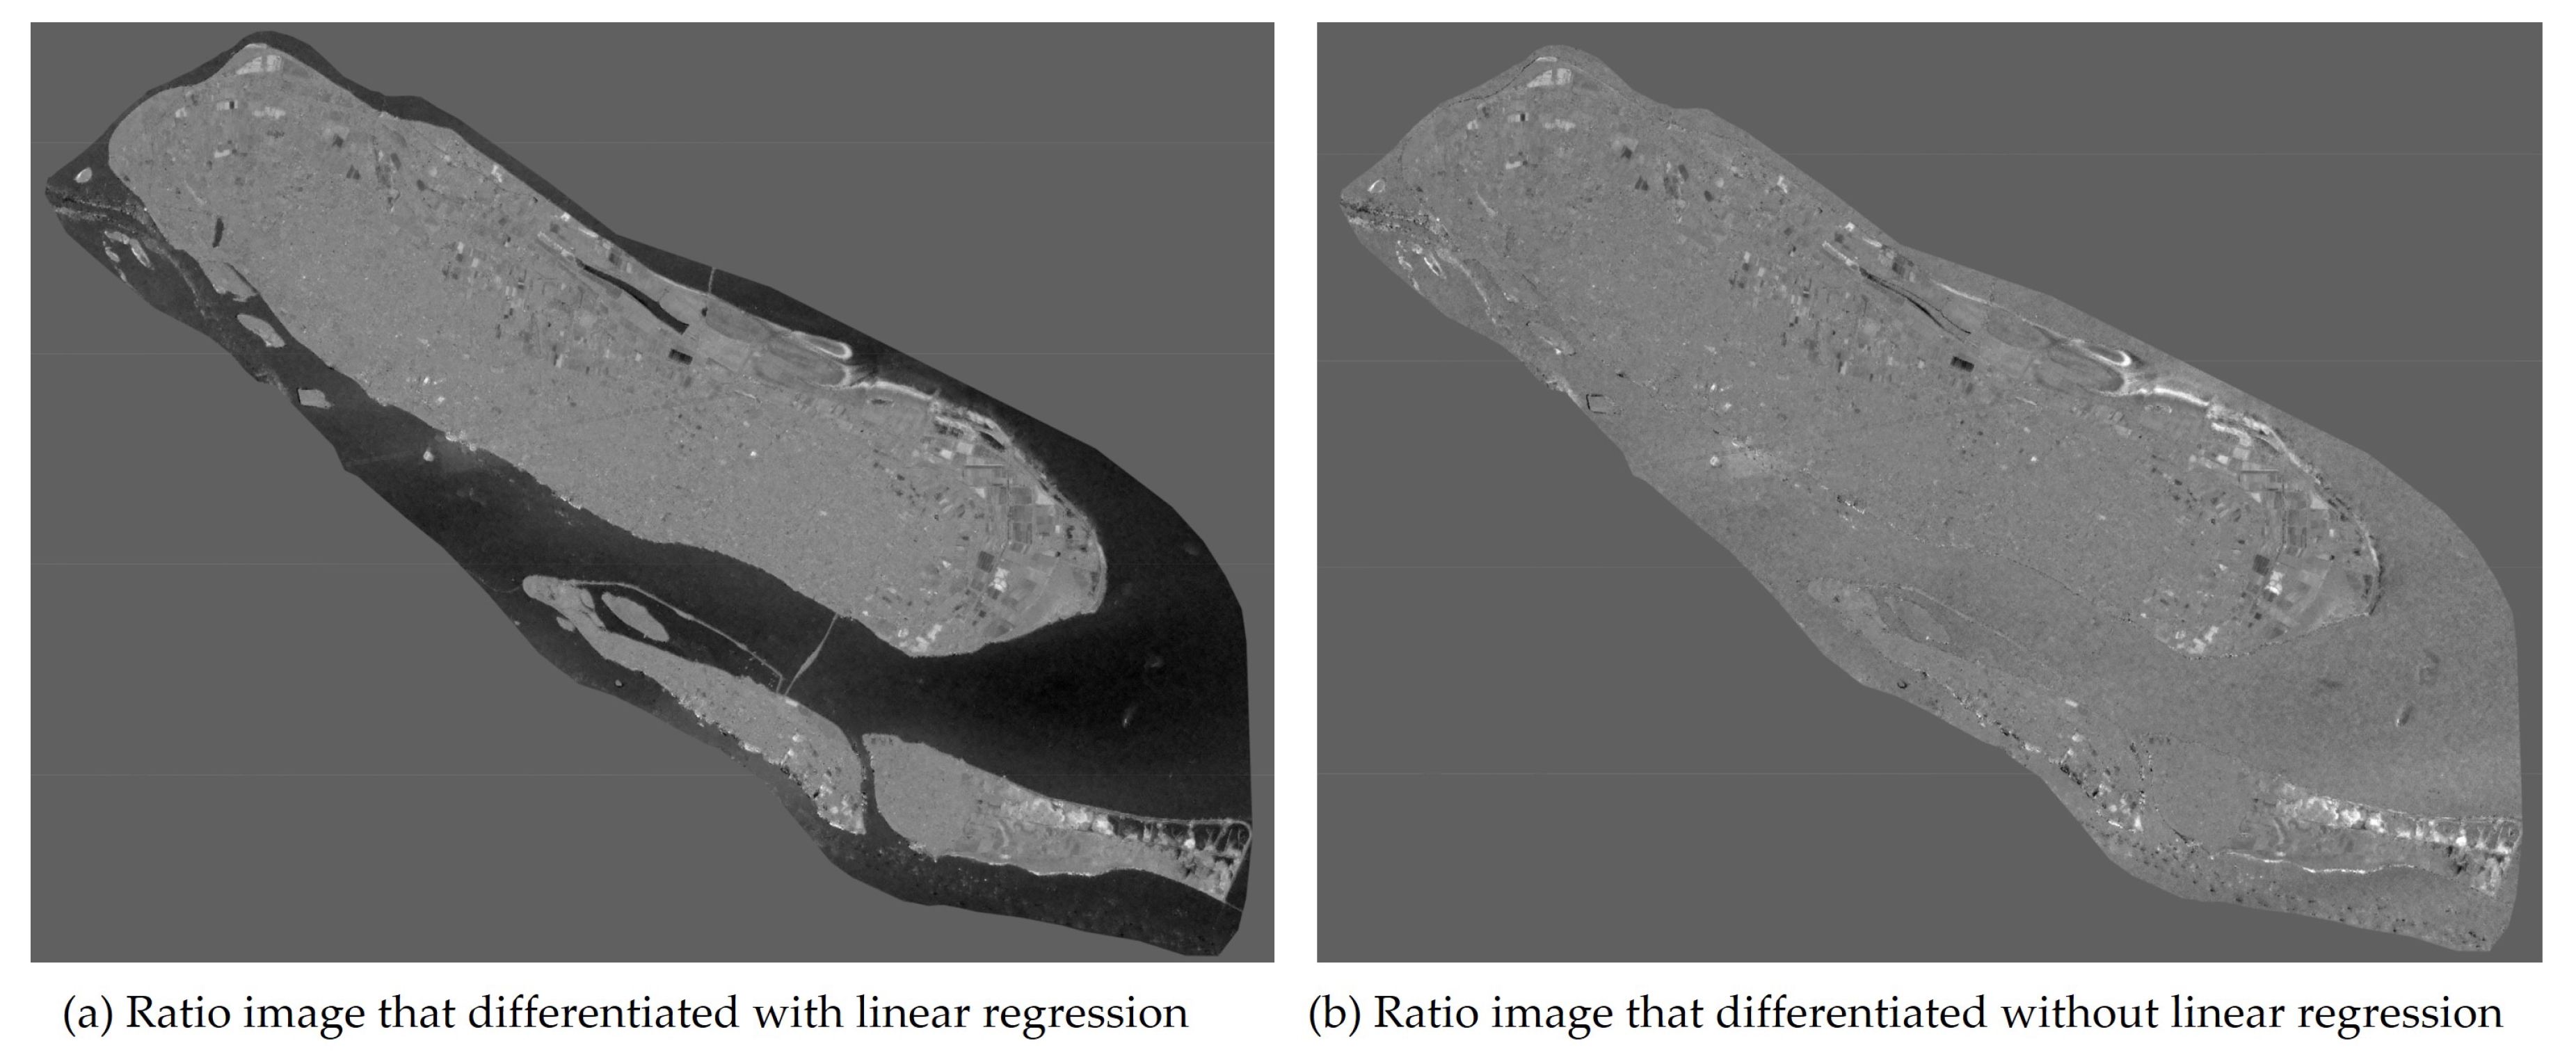
Our study used image regression to reduce the effect of seasonal rainfall on radar forest scattering, and performed the rationing method to quantify the forest change in Chongming eco-island. As demonstrated in
Figure 15, there are perturbations in the water regions in the ratio image without linear regression. It is also indirectly verified that the negative effects of precipitation can be suppressed to some extent by the proposed approach.
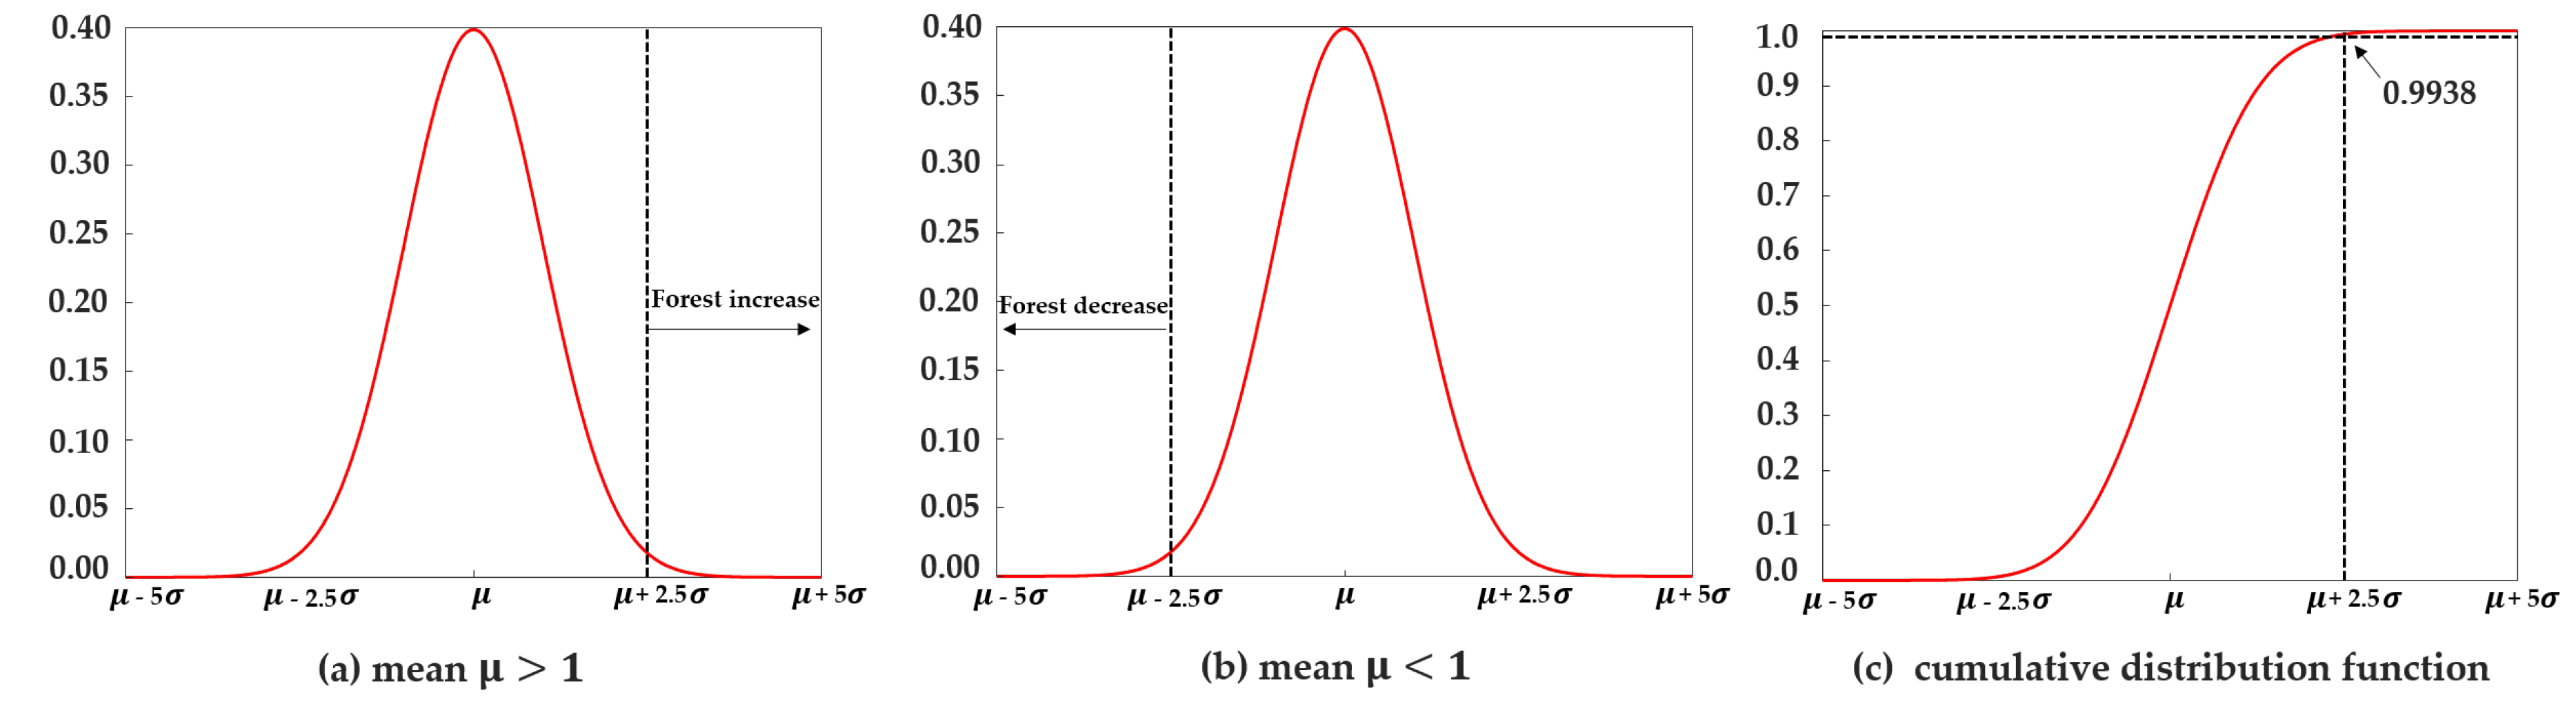
Since the threshold is important for mapping the change area, various automatic threshold calculation approaches have been proposed. Otsu’s classic thresholding method involves exhaustive search for the threshold that minimizes a weighted sum of variances of the change and background classes [
59]. Similar to Otsu’s method, another classic Kapur’s method [
60] searches a gray-level picture threshold using the entropy of the histogram. Both Otsu’s and Kapur’s method perform a relatively good performance if the histogram has bimodal distribution and a sharp valley between two peaks. However, if the ratio images are Guassian distributed there will be an incorrect threshold computed by using these adaptive methods [
61]. In this study, an absolute threshold technique was used to map the forest change. It is not adaptive but simple and effective for mapping the forest change. According to
Figure 9, the ratio images are almost Gaussian distributed. This threshold provides a high confidence level of 99.38% to determine the forest change.
Another issue is the speckle effect on forest change detection. Radar volume scattering increases the number of scatters, comparing with surface scattering. We have conducted some despeckling experiments using a morphological mean filter that is provided in the GEE platform. Although this filtering method can smooth the speckle noise, it leads to the loss of image texture information, which in turn affects the sensitivity of RVI and forest change detection.
There are some limitations of this study. On-site measurements or historical ground truth data are not available for validating the area forest change in relative small wetland or forest parks in Chongming eco-island. From this perspective, our study can provide the evidence of forest change in Chongming eco-island, and inform forest management decision making.
5. Conclusions
Monitoring the change of man-made forests is essential for the sustainable management of forest-based eco-tourism on ecological islands. In this study, we developed an effective method for quantifying forest change on a local scale in the Chongming eco-island, using Sentinel-1 SAR.
An approximate version of radar vegetation index, retrieved by Sentinel-1 SAR data, could indicate the forest growth level of Chongming island. There were good connections between Sentinel-1 radar vegetation index and optical vegetation index.
Although SAR is independent of cloud, the observed errors could be introduced by volume scattering in the precipitation conditions [
58], different incident angles, and radar calibration for forest change detection. Image regression method was applied to reduce observed errors for better image rationing operation. The proposed absolute threshold provided a high confidence level of 99.38% for mapping the forest change. In general, the statistical data of the ratio images indicated the level of forest change, which also matched the statistical parameters of the annual radar vegetation index. The results of forest area change in Chongming island were consistent with the facts. These facts were the implementation of Shanghai government policies that increased the forest area from 2016 to 2018 [
39,
40,
41,
42], and the erosion of the river under the special ecological environment of the Yangtze River estuary, which led to the reduction of forests.
There are some limitations of this study for quantifying forest change on Chongming island using Sentinel-1 data, as highlighted by dual polarization data for the derivation of radar vegetation index and lack of on-site measurements ground truth data for validation.
Future work should involve using quad polarization data, such as RADARSAT-2 data in a fully polarimetric mode, to improve the accuracy of radar vegetation index. Due to that, this initial study was not comprehensive enough to fully investigate correlations between radar vegetation index and Landsat 8 vegetation index over Chongming eco-island. In addition, in situ observations data should also be collected to further improve the evaluation of forest change area estimation.


