3.3.2. ABC-Based Hypergraph Evolutionary Clustering
This section proposes a new hypergraph evolutionary clustering method. This method uses multiple populations to collaboratively search for multiple hypergraphs, where one population is responsible to search for one hypergraph. The hypergraph information is obtained through interaction between these populations. The purpose of interaction is to reduce the number of common vertices and isolated vertices, and guide different populations to search for different hypergraphs. Firstly, the encoding strategy and the optimization index used in the clustering method are given.
(1) Encoding strategy and optimization index
This paper uses a multi-population ABC algorithm to optimize hypergraphs, where the number of populations (N) is equal to or bigger than the number of hypergraphs to be optimized. The dimension of each individual or food source in all populations is equal to the number of vertices, and the binary encoding is used to describe the position of each food source, where “0” means that the current vertex is not selected, and “1” means that it is selected.
Hypergraph clustering usually uses an affinity matrix to calculate the weights of hyperedges. Common indicators used to describe the affinity of data include Euclidean distance, cosine distance, etc. However, it is difficult for these indicators to accurately judge the similarity between data when dealing with high-dimension data. Focused on this, the reference [
40] gives a correlation index to measure the similarity between selected bands. Considering the
i-th and
j-th vertices,
and
, in the hypergraph, their affinity value is as follows:
where,
represents the dot product between
a and
b.
For a hypergraph containing
l vertices, the affinity values between all vertices are calculated in turn. On the basis of their mean value, the hyperedge weight of the hypergraph (
w) can be determined. Since the hypergraph clustering method needs to maximize the weight of the hyperedge of each hypergraph, the weight of the hyperedge of the
k-th hypergraph is used as the objective function, which is optimized by the
k-th population:
(2) Multi-population coordination strategy
In the proposed algorithm, one population is only used to search one hypergraph. To prevent multiple populations from searching for the same hypergraph, this section proposes a multi-population coordination strategy to remove common vertices and isolated vertices. After each iteration of ABC, each population selects the optimal solution obtained so far, noted by . This optimal solution is the optimal hypergraph obtained by the population so far. Based on this, the N populations can get N hypergraphs. Then, common vertices and isolated vertices are identified from all N hypergraphs, and are re-assigned to a unique hypergraph. The specific strategy is as follows:
Case 1: Isolated vertices
An isolated vertex is the one not included in any existing hypergraphs. The strategy of dealing with an isolated vertex is as follows: firstly, calculate the hyperedge weight of each existing hypergraph, and record the hyperedge weight of the i-th hyper graph as . Secondly, allocate the isolated vertex to all hypergraphs respectively, and re-calculate their hyperedge weights. The new hyperedge weight of the i-th hypergraph is recorded as . Then, compare the difference, , and determine the hypergraph with the maximum difference, note the maximum difference by . When , allocate the isolated vertex into the hypergraph with the largest difference.
Taking the case of 4 populations as the example,
Figure 8 illustrates the process of dealing with isolated vertices.
Figure 8a shows the hypergraph obtained by the 4 populations after iterations, namely,
. We can see that the second and fourth vertices are not selected by any hypergraph (their corresponding values are all 0), so they are isolated vertices. Supposing that the hyperedge weight of
achieves the most improvement when adding the isolated vertex
, then
is only inserted into
, that is,
. However, the weights of all hyperedges are not improved by adding
, so we do not do anything about it.
Case 2: Common vertices existing in multiple hypergraphs
A common vertex is the one that appears in multiple hypergraphs at the same time. For each common vertex found, firstly, find all the hypergraphs containing it, and calculate their hyperedge weights, denoted by . Secondly, remove the common vertex from these hypergraphs, and re-calculate the hyperedge weights of these hypergraphs, denoted by . Next, calculate the attenuation degree of each hypergraph before and after removing the common vertex, ; following that, find the hypergraph with the greatest attenuation, denoted by the k-th hypergraph. When , put the common vertex back to the k-th hypergraph; Otherwise, it is completely removed from all the hypergraphs, and becomes an isolated vertex.
Figure 9a shows the hypergraphs obtained by the 4 populations. It can be seen that the vertex
is selected by three hypergraphs at the same time, the vertex
is selected by two hypergraphs at the same time, so they are common vertices. Supposing that the hyperedge weight of
gets the maximum attenuation after the vertex
is deleted, the vertex remains in
, but is deleted from
and
. After deleting the vertex
from
and
, their hyperedge weights all become better; that is, their attenuation values are all less than 0. Therefore, the vertex
needs to be completely deleted from the two hypergraphs, and becomes an isolated vertex.
After the above operations, if the optimal hypergraph of a population () is updated, and the hyperedge weight of the updated hypergraph () becomes big, will be used to replace the worst food source in the population; otherwise, delete .
(3) Steps of the proposed hypergraph evolutionary clustering algorithm
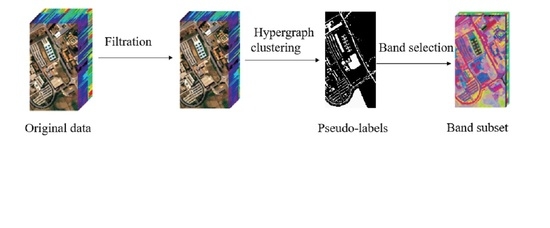
Based on the above work, Algorithm 1 gives the detailed steps of the proposed hypergraph evolutionary clustering based on ABC. Firstly, initialize the parameters of SLIC, and normalize the data to 0–255 (Line 1); secondly, use the method proposed in
Section 3.2 to remove noise and irrelevant bands (Line 2); next, use the super-pixel segmentation technology to divide the image into multiple super-pixel blocks, and select the center of each super-pixel block as its representative (Line 3); then, using selected super-pixel centers as the super-vertices, and the proposed multi-population ABC is implemented to search the
N optimal hypergraphs (Lines 6–13). Here,
represents the current iterations, and
represents the maximum iterations of the algorithm.
Furthermore, inspired by the idea of particle swarm optimization, an optimal solution guided update strategy is proposed to improve the search speed of employed bee:
where,
is the position of a food source in the
i-th population,
is the optimal food source in the population,
and
are two random food sources in the
i-th population,
. In the phases of onlooker bees and scout bees, traditional methods are still used to update the positions of food sources.
| Algorithm 1: The proposed hypergraph evolutionary clustering based on ABC, HC-ABC. |
| Input: Hyperspectral image data, X; |
| Output: Optimal solution set, ; |
| 1. Initialize the parameters of SLIC, and normalize the X to 0–255; |
| 2. Filter out irrelevant or noise bands by the method in Section 3.2; |
| 3. Execute the method in Section 3.3.1 to get the super-pixel centers; |
| 4. Initialize the parameters of ABC, and randomly initialize the N populations; |
| 5. While () |
| 6. For % Simultaneously update the food sources in the N populations. |
| 7. Calculate the fitness value of each food source in the population by formula (10), |
| and find the optimal solution, ; |
| 8. Employed bee phase: Update all the food sources by formula (11); |
| 9. Onlooker bee phase: Update the selected food sources by formula (3); |
| 10. Scout bee phase: Reinitialize the stagnant food sources by formula (6); |
| 11. End for |
| 12. Execute the multi-population coordination strategy, update the of each population; |
| 13. ; |
| 14. End while |
| 15. Output the obtained by every population. |


