Article

An Algorithm to Retrieve Total Precipitable Water Vapor in the Atmosphere from FengYun 3D Medium Resolution Spectral Imager 2 (FY-3D MERSI-2) Data

1
MOA Key Laboratory of Agricultural Remote Sensing, Institute of Agro-Resources and Regional Planning, Chinese Academy of Agricultural Sciences, Beijing 100081, China
2
National Satellite Meteorological Center, China Meteorological Administration, Beijing 100081, China
3
School of Geography and Planning, Guangxi Teachers Education University, Nanning 530001, Guangxi, China
4
Jiangsu Center for Collaborative Innovation in Geographical Information Resource Development and Application, School of Geography and Ocean Science, Nanjing University, Nanjing 210023, Jiangsu, China
*
Author to whom correspondence should be addressed.
Remote Sens. 2020, 12(21), 3469; https://doi.org/10.3390/rs12213469
Submission received: 21 August 2020 / Revised: 27 September 2020 / Accepted: 19 October 2020 / Published: 22 October 2020
(This article belongs to the Special Issue Remote Sensing of the Water Cycle)

Abstract

:
The atmosphere has substantial effects on optical remote sensing imagery of the Earth’s surface from space. These effects come through the functioning of atmospheric particles on the radiometric transfer from the Earth’s surface through the atmosphere to the sensor in space. Precipitable water vapor (PWV), CO2, ozone, and aerosol in the atmosphere are very important among the particles through their functioning. This study presented an algorithm to retrieve total PWV from the Chinese second-generation polar-orbiting meteorological satellite FengYun 3D Medium Resolution Spectral Imager 2 (FY-3D MERSI-2) data, which have three near-infrared (NIR) water vapor absorbing channels, i.e., channel 16, 17, and 18. The algorithm was improved from the radiance ratio technique initially developed for Moderate-Resolution Imaging Spectroradiometer (MODIS) data. MODTRAN 5 was used to simulate the process of radiant transfer from the ground surfaces to the sensor at various atmospheric conditions for estimation of the coefficients of ratio technique, which was achieved through statistical regression analysis between the simulated radiance and transmittance values for FY-3D MERSI-2 NIR channels. The algorithm was then constructed as a linear combination of the three-water vapor absorbing channels of FY-3D MERSI-2. Measurements from two ground-based reference datasets were used to validate the algorithm: the sun photometer measurements of Aerosol Robotic Network (AERONET) and the microwave radiometer measurements of Energy’s Atmospheric Radiation Measurement Program (ARMP). The validation results showed that the algorithm performs very well when compared with the ground-based reference datasets. The estimated PWV values come with root mean square error (RMSE) of 0.28 g/cm2 for the ARMP and 0.26 g/cm2 for the AERONET datasets, with bias of 0.072 g/cm2 and 0.096 g/cm2 for the two reference datasets, respectively. The accuracy of the proposed algorithm revealed a better consistency with ground-based reference datasets. Thus, the proposed algorithm could be used as an alternative to retrieve PWV from FY-3D MERSI-2 data for various remote sensing applications such as agricultural monitoring, climate change, hydrologic cycle, and so on at various regional and global scales.

Graphical Abstract

1. Introduction

The total precipitable water vapor (PWV) in the atmosphere is an important variable to determine the dynamics of the atmospheric movements. PWV is also required for quantitative remote sensing, such as land surface temperature (LST) retrieval from thermal infrared data [1,2]. This is because the radiance transferring from the ground to the sensor in space is strongly affected by the atmosphere, in which PWV plays a critical role in the atmosphere even though it only contains a small proportion in comparison to the total atmospheric mass. Generally, there are two ways through which PWV affects the satellite remote sensing of the Earth’s ground surface: First, water vapor is an important absorber to the radiance at several spectral ranges for remote sensing. Second, the emittance of the atmosphere in the thermal infrared range is closely related to the content of PWV in that the atmosphere has at the specific moment of the satellite overpass. Therefore, retrieval of PWV has been an important study area for quantitative remote sensing [3,4,5,6,7]. Accurate information of PWV in the atmosphere can help to improve the understanding of weather patterns, climate change, hydrological cycles, atmospheric dynamics and the chemical composition of aerosols [8,9].
There are several ways to estimate PWV from ground-based stations such as radiosonde observations, upward-looking microwave radiometers, sun photometer, and so on. Lower spatial resolution (i.e., point features) of ground-based PWV measurements limits its application over regional and global scales. To overcome this inconvenience, several remote sensing satellites such as the Moderate-Resolution Imaging Spectroradiometer (MODIS) [10,11], Advanced Very High-Resolution Radiometer (AVHRR) [12] and FengYun (FY-3C and FY-3D) have been launched in recent decades to monitor Earth’s processes. Using the data from the above-mentioned remote sensing satellites, we can estimate the PWV at both regional and global scales for various remote sensing applications. Several studies have been published on PWV retrieval from MODIS data over land, cloud, and oceans [13,14,15].
Since launch, the Aqua and Terra instruments carried by MODIS have successfully been in operation in an orbit for more than 18 and 21 years, respectively, which were originally designed for 6 years. Even so, both instruments of MODIS and their onboard calibration devices have been functional up-to-now and can be expected to continue operation for the near future. However, the remote sensing community always look forward to alternative data resources to enhance the earth observations at better temporal and spatial scales. Chinese second-generation polar-orbiting meteorological satellite FY-3D onboard with MERSI-2 can be an alternative data source for global observations since it is already in-service to provide data since November 2018. FY-3D MERSI-2 is equipped with three near-infrared (NIR) water vapor absorption channels (channel 16, 17, and 18) and one neighboring non-absorption channel 4, which confirms the basic requirements for PWV estimation. The spatial resolution of these channels is 250 m for channel 4 and 1000 m for channel 16, 17, and 18. However, very few studies are published on PWV estimation from FY-3D MERSI-2 data.
There are several methods to calculate PWV from satellite data, such as ratio technique, regression slope, split-window difference of the thermal bands, look-up table derived from atmospheric radiative transfer models and the HITRAN2000 spectroscopic database [1,11,13,14,16]. As stated in Sobrino et al. [14], the methods for PWV estimation from remote sensing data should meet the following three essential requirements: first, it can minimize the sensibility among various types of the ground surfaces; second, it can minimize the sensibility to the noise resulted from the variations of different channels; third, it can minimize the sensibility caused by variations in other components of the atmosphere [14]. Considering these requirements, this study utilized the ratio technique to develop an algorithm for PWV estimation from FY-3D MERSI-2 data. The differential absorption method assumes that transmission in a single water vapor absorption channel can be calculated considering the radiance values of both absorbing and non-absorbing channels.
Similarly, for the development of this algorithm, the ratio of three NIR channels and the neighboring non-absorbing channel were used to estimate atmospheric PWV. The work of Sobrino et al. [14] successfully showed the application of the algorithm utilizing such ratio technique with MODTRAN code and the reflectance data of different ground surfaces for the MODIS satellite and archived accuracy with root mean square error (RMSE) of 0.48 g/cm2 [17]. The detailed description of the ratio technique and its applications have been validated and described in several studies [17,18,19].
Based on abovementioned foundation, the main objective of this study was to develop an algorithm to retrieve PWV from FY-3D MERSI-2 data. Since FY-3D MERSI-2 has slightly similar NIR water vapor absorbing bands and a neighboring non-absorbing band to those of MODIS for atmospheric water vapor monitoring, we intended to propose an algorithm similar to that for MODIS to retrieve PWV from FY-3D MERSI-2 data. In order to have a logical presentation of the study, we structured the remaining part of the paper as follows: Section 2 outlines the data and methodology; Section 3 describes the results and analysis, especially the validation with two ground-based reference datasets; discussion and conclusion are given in Section 4 and Section 5, respectively.

2. Data and Methodology

2.1. The FY-3D MERSI-2 Data

FY-3D is the fourth satellite in the FY-3 series, which was launched in November 2017 and began to provide data in November 2018. The satellite was designed to operate as a primary afternoon orbiting over an altitude of 836 km above the Earth’s surface. Its orbital inclination angle is 98.75° to the equator. FY-3D completes 14 orbital observations of the Earth’s surface at global scales twice a day. The MERSI-2 instrument onboard with FY-3D has been greatly improved from MERSI-1, with a higher accuracy of onboard and lunar-calibration capabilities. MERSI-2 is equipped with 25 channels: 6 visible, 3 shortwave IR, 10 visible/NIR, and 6 thermal IR channels with the scanning range of +55.4°. The spectral range of MERSI-2 is between 0.412 µm and 12.0 µm, and its spatial resolution at nadir is 250 m for channels 1–4 and 24–25, and 1000 m for the remaining channels. The capability of daily global observation makes it a very high potential satellite with many applications at both regional and global scales, such as climate change, numerical weather prediction, space weather prediction, and ecosystem monitoring. An algorithm to accurately and quickly retrieve PWV from MERSI-2 data is beneficial to the above-mentioned applications.
In this study, 4 bands of MERSI-2 are used to estimate PWV: band 4 (0.86–0.92 µm) as non-absorbing, band 16 (0.87–0.93 µm), band 17 (0.91–0.95 µm), and band 18 (0.89–0.99 µm) as absorbing bands. To MODIS, band 2 is a non-absorbing band, while bands 17, 18, and 19 are the absorbing bands. Figure 1 compares the spectral response functions of FY-3D MERSI-2 bands with the corresponding ones of MODIS: (a) FY-3D band 4 against MODIS band 2; (b) band 16 against band 17; (c) band 17 against band 18; (d) band 18 against band 19. It can be observed from Figure 1 and Table 1 that the spectral range and center wavelengths of both sensors are slightly similar, which implies that it may be possible to develop an algorithm similar to MODIS for FY-3D MERSI-2 by using its spectral information in MODTRAN. The Level-1B radiance data of FY-3D MERSI-2 was used in this study, which were downloaded via the Fengyun Satellite Data Archiving and Order Portal (http://satellite.nsmc.org.cn) over the period of August–December 2019.

2.2. Theoretical Basis for PWV Algorithm Development

In order to obtain PWV, the solar radiation reflected by the surface, the absorption and scattering characteristics of the atmosphere and the surface around 1 µm region of wavelength must be taken into account, because absorption and scattering vary with wavelength and viewing angle. The total radiance at a downward looking sensor geometry can be written in a simplified form, as Fraser and Kaufman [20] and Hansen and Travis [21]:
L S e n s o r λ   =   L P a t h λ + L S u n λ ρ λ   τ λ
where λ is the wavenumber/wavelength, L S e n s o r λ   is total radiance reached at sensor, L P a t h λ is the path scattered radiance, L S u n λ   is above atmosphere solar radiance, ρ λ   is bi-directional surface reflectance and τ(λ) is combined/total transmittance, considered as the total atmospheric transmittance resulted from sun to surface and surface to sensor [11].

2.3. The Ratio Technique for PWV Estimation

The ratio technique is simply detecting the attenuation of the reflected solar radiation which is affected by the water vapor absorption by passing through the atmosphere. A number of atmospheric elements, i.e., carbon monoxide, carbon dioxide, ozone, nitrogen oxide, methane and other gases, are relatively un-changeable in the atmosphere; such atmospheric elements are controlled by default standard atmospheric profiles of MODTRAN 5. However, PWV is the most important element in the atmosphere. Hence, the changing of atmospheric transmittance directly related to changing of PWV in the profile. So, Equation (1) can be written as:
τ λ   =   L s e n s o r λ   L s u n λ ρ λ L p a t h λ   L s u n λ ρ λ
In Equation (2), the L p a t h λ is directly reflected solar radiation which is usually a few percent because the Rayleigh scattering is negligible near the 1µm region. So, Equation (2) can be further simplified as:
τ λ   =   L s e n s o r λ   L s u n λ ρ λ
where L s e n s o r λ   is a Level-1B sensor radiance of MERSI-2 and ρ λ   is a surface reflectance. The total transmittance τ(λ) can be calculated if the L s u n λ is known. Gao and Kaufman [22], Kaufman and Gao [11] and Sobrino et al. [14] used the non-absorption/window channel to replace L s u n λ   ρ λ , which makes the ratio technique the only possible way to get the total atmospheric transmittance τ(λ) of absorption bands. In this way the PWV can be computed by building a linear relationship between simulated radiance ratios and PWV with the help of radiative transfer code MODTRAN 5. It is clearly observed from Figure 2 that the MERSI-2 channel 4 at the wavelength range of 0.865 µm is a window channel, and the channels at wavelength range of 0.935, 0.94, and 0.905 µm are water absorption channels.

2.4. Algorithm Development for PWV Estimation

In the ratio technique it was supposed that the surface reflectance differs almost linearly with wavelength for various ground surface types around the water absorption spectra. Therefore, the reflectance values of 10 surface types such as forest, snow cover, desert, farm, old grass, cloud deck, ocean, maple leaf, burnt grass, and decayed grass were used as the input parameters in MODTRAN 5. The range of PWV from 0.3 to 3.5 g/cm2 with a step size of 0.3 g/cm2 was set as the input for the simulation, the water vapor value 0.3 g/cm2 reveals drier atmospheres and 3.5 g/cm2 is for wet atmospheres [14]. The radiances of NIR channels are mainly affected by volume of PWV, so the remaining parameters are set as the default in six standard atmospheres of Earth, including mid-latitude summer and winter, sub-Arctic summer and winter, tropical, and 1976 U.S. standard in MODTRAN. The R16, R17 and R18 are the ratios of channel 16, 17 and 18 as follows:
R 16   =   L 16 / L 4
R 17   =   L 17 / L 4
R 18   =   L 18 / L 4
where Li are the simulated radiances for MERSI-2 channel 4, 16, 17, and 18 using six standard atmospheres and 10 ground surface types. After the 960 simulations of MODTRAN 5, a look-up table was generated, and then the polynomial expressions (Figure 3) were developed with the help of statistical regression analysis as follows:
W16 = 27.298 − 61.336 R16 + 34.754 R216
W17 = 7.723 − 27.945 R17 + 26.136 R217
W18 = 11.541 − 34.942 R18 + 27.143 R218
where W16, W17, and W18 are polynomial expressions for MERSI-2 bands 16, 17, and 18, respectively.
As the PWV absorption is a function of wavelength, it can vary between each of the MERSI-2 NIR channels. Considering this issue, the sensitivity of each NIR channel under similar atmospheric conditions could be different. For example, the channel 17 is most sensitive under dry conditions due to its strong absorption, while channel 16 has weak absorption and it is most sensitive under humid conditions [11]. Hence, under the same atmospheric condition, the amount of PWV from the three NIR channels cannot be the same. Therefore, the mean PWV value was obtained according to the following equation:
W = f16W16 + f17W17 + f18W18
where f16, f17, and f18 are weighting functions defined according to:
f i   =   η i η i
η i   =   Δ τ i Δ W   ( i   =   16 ,   17   and   18 )
where Δτi and ΔW are a difference (maximum and minimum) of transmissivities and water vapor in channel (i) from the six standard atmospheres of Earth [11].
The values obtained for fi are f16 = 0.208, f17 = 0.433 and f18 = 0.359, respectively. Finally, Equation (10) can be written as:
W = 0.208W16 + 0.433W17 + 0.359W18
Equation (13) is a final equation that we developed to estimate the total PWV from MERSI-2 images.

2.5. Framework and Technical Procedures

The framework of the study is described in Figure 4 with the detailed steps of PWV estimation from MERSI-2 data in the development of the algorithm. The primary approach of the study was based on following steps: first, the MODTRAN 5 [23] radiative transfer model to simulate sensor reaching total radiance in absorption and non-absorptions bands for different surface types and atmospheric conditions. The important input parameters were configured to drive MODTRAN 5 shown in Table 2, while other less important parameters, which were not shown in Table 2, were set as default. Second, determination of the coefficients for polynomial expressions using the output information of the MODTRAN 5 by statistical regression analysis was carried out; then, the weight of each band was estimated using the maximum and minimum values of water vapor and atmospheric transmittance. Finally, we performed a validation analysis for the retrieved water vapor to evaluate the applicability and suitability of the algorithm.

2.6. Validation of the Algorithm

In order to assure the accuracy of the proposed algorithm, we compared the retrieved PWV amounts with ground-based datasets, using the following assessment criteria: root mean square error (RMSE), bias, and error percentage (EP), generally computed as follows:
R M S E   =     i   =   1 N E s t i m a t e d i A c t u a l i N
B i a s   =     i   =   1 N E s t i m a t e d i A c t u a l i N
E P   =     i   =   1 N E s t i m a t e d i A c t u a l i A c t u a l i N
Two ground-based datasets were used for validation of the algorithm: the upward looking microwave radiometer data provided by the U.S. Department of Energy’s Atmospheric Radiation Measurement Program (ARMP) and the sun-photometer data of Aerosol Robotic Network (AERONET). The ARMP’s microwave radiometer measurements were conducted at the Southern Great Plains (SGP) in Oklahoma, USA [24]. The microwave radiometer instrument measured the radiation emitted by the atmospheric water vapor and liquid water at frequencies of 23.8 and 31.4 GHz [25]. The microwave radiometer measurement is one of the most precise methods to determine the water vapor from the ground. The uncertainty of the measured water vapor from microwave radiometer data is expected to be in the range of 0.3 mm [26].
The sun photometer measurements of AERONET were used for validation, which were downloaded from http://aeronet.gsfc.nasa.gov. The retrieval produced water vapor values with a consistent dry bias of approximately 5–6% and an estimated uncertainty of 12–15% [27]. The AERONET program is a federation of ground-based remote sensing aerosol networks established by NASA and PHOTONS [28]. The details of sixteen sun photometer sites shown in Table 3 were used for validation, which were randomly selected from the different regions of North America over different types of land covers.

2.7. Sensitivity Analysis

In this section, the sensitivity analysis of the MERSI-2 algorithm was performed on the basis of different surface types and atmospheric conditions applied to Equation (13) as follows:
σ T o t a l   W   = 1 N i = 16 N f i Δ W i 2
where the change in water vapor (ΔWi) of each channel is equal to:
Δ W 16 =   61.336   Δ R 16   +   69.508   R 16 Δ R 16
Δ W 17 =   27.945   Δ R 17   +   52.272   R 17 Δ R 17
Δ W 18 =   34.942   Δ R 18   +   54.286   R 18 Δ R 18
The change in the radiance ratio (ΔRi) was obtained according to Kaufman and Gao [11] as,
Δ R i   =     σ   R i   3.5   g / cm 2 R i   3.5   g / cm 2 R i   0.3   g / cm 2
where σ[Ri] is the standard deviation of radiance ratios (Ri) for all surface covers which are considered in simulation; the denominator Ri (3.5 g/cm2) and Ri (0.3 g/cm2) are the mean value of radiance ratios for wet and dry atmospheres from surface covers considered. To this end, the sensitivity analysis applied to Equation (13) gives a standard deviation of 0.356 g/cm2 for wet atmospheres to 0.11 g/cm2 for dry atmospheres.

3. Results and Validation

3.1. Precipitable Water from FY-3D NIR Algorithm

The newly developed algorithm was practically applied to retrieve PWV from FY-3D MERSI-2 data. Figure 5 explains an example of PWV retrievals from the MERSI-2 NIR bands. These subsets of images were randomly selected from different lower and higher elevated regions of North America, which include different kinds of land covers. The left panel of Figure 5a,c shows a set of the true color composited images of MERSI-2 bands centered at 0.645 µm (red), 0.86 µm (green), and 0.47 µm (blue). The right panel of Figure 5b,d shows a set of ‘‘pixel-based’’ PWV images processed by the newly developed algorithm. It is easy to demonstrate the spatial distribution of PWV; the most remarkable movement of water vapor can be observed, especially over coastal and mountainous regions as compared to the lower elevated areas. The spatial patterns of water vapor distributions for every location were drastically different.

3.2. Validation and Error Analysis

For the better validation of the newly developed algorithm, the FY-3D images between August and December 2019 were used, which mostly cover the sixteen AERONET and single microwave radiometer (MWR) sites referred to in Section 2.6. The programming script was developed to read the data from images by using latitude/longitude as a control condition, matching with the observation data. If the value of PWV extracted by the proposed algorithm is comparable to the PWV obtained from the ground station, we set that pixel as a center pixel, and get the values for positioning pixel 3 × 3 matrix. It is worth mentioning that in some cases, the comparison with ground-based observational data points far from the estimated PWV values. However, this situation was found near cloudy areas, and for this reason, each image was deeply studied because there is not any available cloud mask product to detect the cloudy pixels for better validation. The algorithm proposed in this study is only applicable over clear land surface pixels, except the clouds and oceans with sun-glint. Far from the clouds, 1206 data points for sun-photometer and 103 for microwave radiometer were obtained from 410 satellite images. The validation results are shown in Figure 6 and Figure 7. In each figure, the frequency distribution of error, RMSE, offset and slope of the linear regression, bias, correlation coefficient, and the sample size as the number of data points are shown.
In the left panel of Figure 6, the comparison of the retrieved PWV from the proposed algorithm and the ground-based microwave radiometer measurements is shown; only 100% valid pixels of FY-3D MERSI-2 were considered, to exclude the influence of clouds. It was observed that the microwave radiometer dataset shows almost perfect agreement, even the sample size is relatively low due to cloud contamination. All 103 matched samples were presented in this section based on scatterplots and histogram, which can clearly depict the difference in the distribution of the PWV values. We find that the scatter fitted line is closer to the 1:1 line when the water vapor values are between 1.5 and 2.5 g/cm2. On the other hand, the deviations of the PWV become very large when the values of PWV are higher than 2 g/cm2. The validation results with microwave radiometer measurements (Figure 6) produce an RMSE of 0.28 g/cm2 (12.6%), a bias of 0.072 g/cm2, and a correlation coefficient of 0.95.
The comparison between retrieved PWV and sun photometer observational values are shown in Figure 7. Here, again, only 100% valid pixels of FY-3D MERSI-2 were considered. Moreover, there was a large number of available samples which enhanced the validation analysis. Compared to the results of the microwave radiometer in Figure 6, the scatters in Figure 7 are much more focused around the 1:1 line, and the frequency exhibits a much narrower and higher distribution. Furthermore, the deviations in retrieved PWV become very large when the observational values are higher than 1.2 g/cm2. The validation results produced a very good consistency with sun-photometer measurements with RMSE of 0.26 g/cm2, a bias of 0.096 g/cm2, and a correlation coefficient of 0.93.

3.3. Comparison with MOD05 Water Vapor Product of MODIS

In order to validate the accuracy of the proposed algorithm, the pixel-based water vapor comparison was performed with the most widely used water vapor product (MOD05) of MODIS satellite. Figure 8 shows the inter-comparison results of PWV between the MOD05 NIR product and the newly developed algorithm of FY-3D MERSI-2. The data acquired for comparison were investigated over North America on 21 August 2019, at UTC 20:45 for FY-3D MERSI-2 and UTC 18:25 for MODIS. Both sensors have almost similar spatial resolution, but their image acquisition time was slightly different. In the upper panel of Figure 8, the retrieved PW data of FY-3D MERSI-2 are plotted against the MODIS product, which reveals significant differences. The comparison shows a larger scatter and wider histogram in the data against the MOD05 PWV product, as evidenced by the lower correlation coefficients 0.58 and increased RMSE up to 0.52 g/cm2. A bias of −0.112 g/cm2 was found, which produces large RMSEs over the North American conditions.

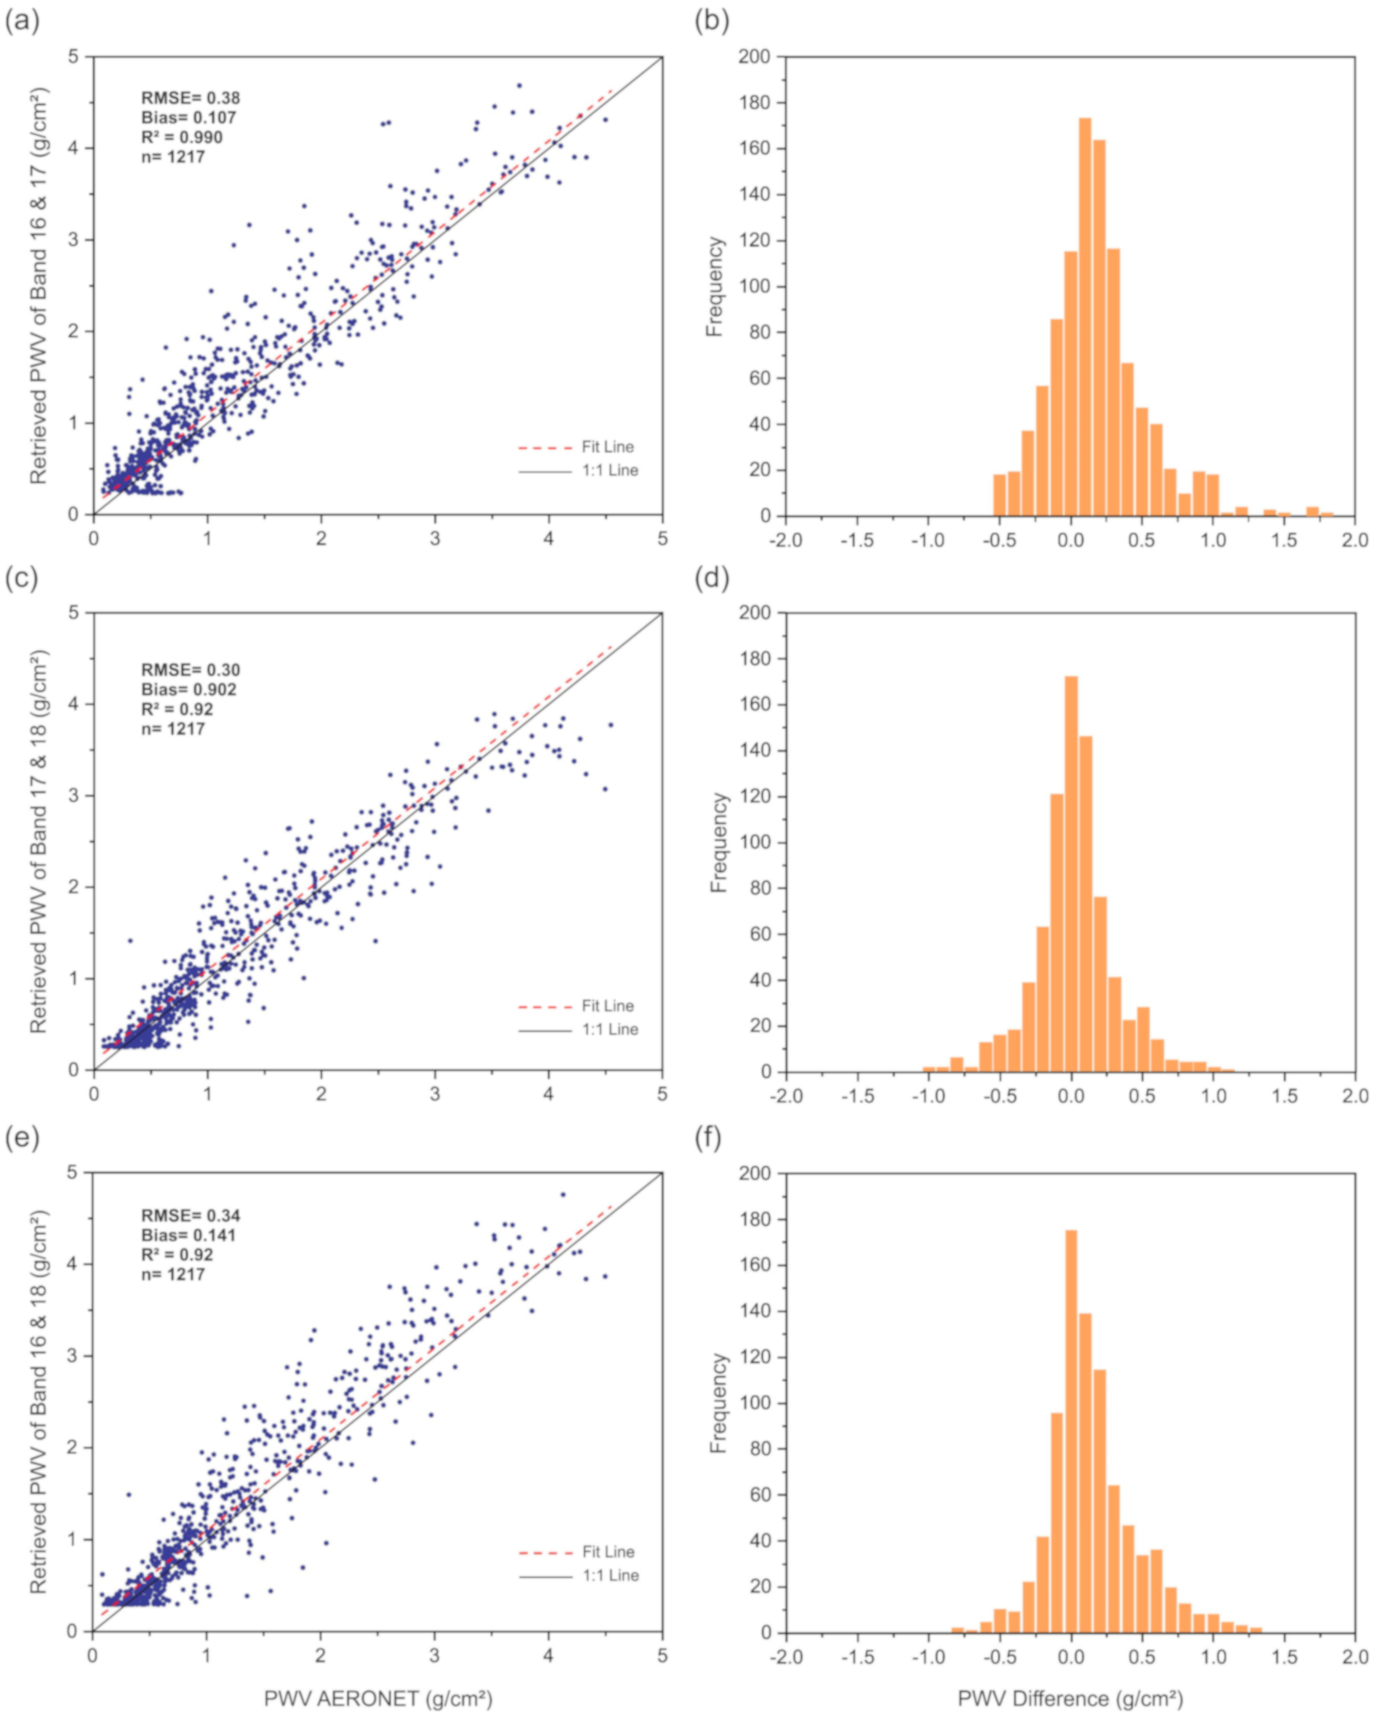
3.4. Comparison with Other Combinations

The FY-3D MERSI-2 satellite equipped with three NIR water vapor channels is discussed in Section 2.1. Equation (13) was made with a combination of three NIR channels, and the retrieved water vapors were compared with two kinds of in-situ ground datasets to see how well the algorithm would perform. In this section, we further investigate the accuracy of three other combinations of NIR channels, such as:
W = 0.210W16 + 0.431W17
W = 0.431W17 + 0.360W18
W = 0.210W16 + 0.360W18
Similar AERONET ground-based stations were used in this section, which were initially investigated for the validation of the three-channel NIR algorithm. The comparisons of three different combinations of NIR channels such as band 16 with 17, band 17 with 18, and band 16 with 18 were shown in Figure 9. The RMSE of 0.38, 0.28 and 0.34 g/cm2 was found for band 16 with 17, band 17 with 18, and band 16 with 18, respectively, which are equated to be in the range between 28 and 64% of error. The line representing a 1:1 correspondence is included in each plot to illustrate slopes or offsets which may exist between the data in the comparisons, and the histogram shows how data are frequently distributed.

4. Discussion

This study presents an applicable algorithm to estimate PWV from FY-3D MERSI-2 data over clear sky land pixels. The suitability of the proposed algorithm in terms of the error percentage, compared to different ground-based stations and MODIS water vapor product, was investigated. The results showed that the agreement between MERSI-2 and in-situ ARMP and AERONET measurements was acceptable, with an RMSE of 0.28 g/cm2 (12.6%) and 0.26 g/cm2 (23.7%), respectively. These findings were comparable to the accuracy obtained for the MODIS institutional product, MOD05, reported by Gao and Kaufman [22] with a 5–10% error range. Similarly, Sobrino et al. [14] reported ~21% accuracy from a validation study conducted for the MODIS NIR algorithm using the ratio technique. A bias of 0.09 g/cm2, confirmed by Gao and Kaufman [22] and Sobrino et al. [14] for MODIS PWV validations, was also comparable to our proposed method’s biases (0.072 to 0.097 g/cm2). During the pixel-based comparison between the MOD05 water vapor product and FY-3D MERSI-2 algorithm, the RMSE reached up to 0.52 g/cm2, which was relatively higher than other comparisons and far from the acceptable limits. The number of possible reasons can explain this larger RMSE: First, the three-channel NIR algorithm used in this study and the MOD05 NIR algorithm differ slightly. The MODIS water vapor product was developed by ratios of apparent reflectance in the NIR channels, rather than ratios of measured radiance as utilized in this study. Second, the MOD05 NIR algorithm was developed by consideration of two non-absorbing channels (0.865 and 1.240) rather than MERSI-2, which utilized only a single non-absorbing channel [17]. Third, both instruments, MERSI-2 and MODIS, look at the surface from different angles, and their spectral response functions are slightly different. These differences lead to slightly different results from each of the respective algorithms which do not provide the best inter-comparison results between the MERSI-2 and MODIS. It was observed that the three-channel algorithm is the best way to calculate PWV with acceptable limits from FY-3D MERIS-2 data. This is also because under a similar atmosphere, every NIR band has different water vapor sensitivities. Another finding of this study suggested that the strong absorption band 17 is most sensitive in a moisture deficient environment, while the weak absorption band 16 is most sensitive in humid environmental conditions [11]. Furthermore, there were numerous sources of errors for PWV retrieval from NIR bands that were reported in the literature by Kaufman and Gao [11]; Gao et al. [10]; Bouffies et al. [29]; Gao et al. [30]. Along with the uncertainties in the spectral reflectance of the surface, these errors include spectral calibrations and sensor radiometric, pixel registration and so on. Through the sensitivity analysis of FY-3D data, it was revealed that the amount of deviations depends on the surface targets in different atmospheres.

5. Conclusions

FY-3D is a second generation polar-orbiting meteorological satellite of China. FY-3D has provided various products to the remote sensing community. However, estimations of water vapor from the FY-3D MERSI-2 data attained were less focused. This study provides an algorithm to retrieve PWV from FY-3D MERSI-2 data over clear sky land surface pixels. During the development of the ratio technique, the simulated radiance values of three water vapor absorbing channels and one non-absorbing channel were used. The simulation of radiance from the ground surface to the sensor in space was investigated through the MODTRAN 5 radiative transfer model. From the output information of MODTRAN, a look-up table was generated and then polynomial expression were developed with the help of regression analysis. Several regression equations were constructed based on various combinations of the ratios against the PWV estimation, and the best one was then selected as the possible algorithm as W = 0.208W16 + 0.433W17 + 0.359W18, where W16, W17, and W18 are polynomial expressions of PWV estimation for FY-3D MERSI-2 bands 16, 17, and 18, respectively.
Additionally, two ground-based datasets, ARMP and AERONET, were used in the study to validate the proposed algorithm. The results of the validation showed that the proposed algorithm has acceptable accuracy. The estimated PWV values come with an RMSE of 0.28 g/cm2 (12.6%) for ARMP measurements and 0.26 g/cm2 (23.7%) for AERONET measurements. Moreover, the proposed algorithm is very easy to apply and reproducible. It only requires the Level 1B radiance data of NIR bands from FY-3D MERSI-2 for PWV retrieval. In this sense, the proposed algorithm can be used as an alternative to retrieve PWV from FY-3D MERSI-2 data at global scales for various remote sensing applications. The future line of work is to develop an advanced method to retrieve PWV over land, oceans and clouds with more detailed validation analysis throughout the Earth.

Author Contributions

Conceptualization and methodology, Z.Q., J.F., B.A.; validation, B.A., Q.H., W.D., S.Z., C.Z.; formal analysis, B.A., S.L.; writing—original draft preparation, B.A., Z.Q.; writing—review and editing, B.A., J.F., Q.H., S.Z, C.Z.; supervision, Z.Q., J.F. All authors have read and agreed to the published version of the manuscript.

Funding

This study was supported by the National Key Research and Development Project (2016YFA0600302) and the National Natural Science Foundation of China (Grant No. 41771406, 41921001, 41661090)

Acknowledgments

We sincerely thank M. Gao and C. Zhao from the Chinese Academy of Agricultural Sciences for their assistance in image preprocessing and statistics for the study.

Conflicts of Interest

The authors declare no conflict of interest. The funders had no role in the design of the study; in the collection, analyses, or interpretation of data; in the writing of the manuscript, or in the decision to publish the results.

References

  1. Zhang, T.; Wen, J.; Van der Velde, R.; Meng, X.; Li, Z.; Liu, Y.; Liu, R. Estimation of the Total Atmospheric Water Vapor Content and Land Surface Temperature Based on AATSR Thermal Data. Sensors 2008, 8, 1832–1845. [Google Scholar] [CrossRef] [PubMed] [Green Version]
  2. Du, B.; Ji, D.; Shi, J.; Wang, Y.; Lei, T.; Zhang, P.; Letu, H. The Retrieval of Total Precipitable Water over Global Land Based on FY-3D/MWRI Data. Remote Sens. 2020, 12, 1508. [Google Scholar] [CrossRef]
  3. Held, I.M.; Soden, B.J. Robust Responses of the Hydrological Cycle to Global Warming. J. Clim. 2006, 19, 5686–5699. [Google Scholar] [CrossRef]
  4. Niell, A.E.; Coster, A.J.; Solheim, F.S.; Mendes, V.B.; Toor, P.C.; Langley, R.B.; Upham, C.A. Comparison of Measurements of Atmospheric Wet Delay by Radiosonde, Water Vapor Radiometer, GPS, and VLBI. J. Atmos. Ocean. Technol. 2001, 18, 830–850. [Google Scholar] [CrossRef] [Green Version]
  5. Roman, J.; Knuteson, R.; August, T.; Hultberg, T.; Ackerman, S.; Revercomb, H. A global assessment of NASA AIRS v6 and EUMETSAT IASI v6 precipitable water vapor using ground-based GPS SuomiNet stations. J. Geophys. Res. Atmos. 2016, 121, 8925–8948. [Google Scholar] [CrossRef]
  6. Trenberth, K.E.; Fasullo, J.; Smith, L. Trends and variability in column-integrated atmospheric water vapor. Clim. Dyn. 2005, 24, 741–758. [Google Scholar] [CrossRef]
  7. Zhang, L.; Wu, L.; Gan, B. Modes and Mechanisms of Global Water Vapor Variability over the Twentieth Century. J. Clim. 2013, 26, 5578–5593. [Google Scholar] [CrossRef]
  8. Reichardt, J.; Wandinger, U.; Serwazi, M.; Weitkamp, C. Combined Raman lidar for aerosol, ozone, and moisture measurements. Opt. Eng. 1996, 35, 1457–1465. [Google Scholar] [CrossRef]
  9. Chen, B.; Dai, W.; Liu, Z.; Wu, L.; Xia, P. Assessments of GMI-Derived Precipitable Water Vapor Products over the South and East China Seas Using Radiosonde and GNSS. Adv. Meteorol. 2018, 2018, 1–12. [Google Scholar] [CrossRef]
  10. Gao, B.-C.; Goetz, A.F.H. Column atmospheric water vapor and vegetation liquid water retrievals from Airborne Imaging Spectrometer data. J. Geophys. Res. Space Phys. 1990, 95, 3549–3564. [Google Scholar] [CrossRef]
  11. Kaufman, Y.J.; Gao, B.-C. Remote sensing of water vapor in the near IR from EOS/MODIS. IEEE Trans. Geosci. Remote Sens. 1992, 30, 871–884. [Google Scholar] [CrossRef]
  12. Sobrino, J.A.; Raissouni, N.; Simarro, J.; Nerry, F.; Petitcolin, F. Atmospheric water vapor content over land surfaces derived from the AVHRR data: Application to the Iberian Peninsula. IEEE Trans. Geosci. Remote Sens. 1999, 37, 1425–1434. [Google Scholar] [CrossRef]
  13. Mao, K.; Shen, X.; Zuo, Z.; Ma, Y.; Liu, G.; Tang, H. An Advanced Radiative Transfer and Neural Network Scheme and Evaluation for Estimating Water Vapor Content from MODIS Data. Atmosphere 2017, 8, 139. [Google Scholar] [CrossRef] [Green Version]
  14. Sobrino, J.A.; El Kharraz, J.; Li, Z.-L. Surface temperature and water vapour retrieval from MODIS data. Int. J. Remote Sens. 2003, 24, 5161–5182. [Google Scholar] [CrossRef]
  15. Li, C.; Liu, Y.; Zhu, R. An Improved Algorithm for Retrieving Atmospheric Water Vapor Using MODIS Near-Infrared Data. In Proceedings of the 2nd International Conference on Remote Sensing, Environment and Transportation Engineering (RSETE) Nanjing, Jiangsu, China, 1 June 2012; pp. 1–4. [Google Scholar] [CrossRef]
  16. Hu, J.; Tang, S.; Liu, H.; Min, M. An Operational Precipitable Water Vapor Retrieval Algorithm for Fengyun-2F/VLSSR Using a Modified Three-Band Physical Split-Window Method. J. Meteorol. Res. 2019, 33, 276–288. [Google Scholar] [CrossRef]
  17. McAtee, B.K.; Maier, S.W. A comparison of algorithms for Near-Real Time water vapour retrieval from MODIS. Int. J. Remote Sens. 2006, 27, 5145–5163. [Google Scholar] [CrossRef]
  18. Varamesh, S.; Hosseini, S.M.; Rahimzadegan, M. Estimation of atmospheric water vapor using MODIS data 1. (case study: Golestan province of Iran). J. Mater. Environ. Sci. 2017, 8, 1690–1695. [Google Scholar]
  19. Moradizadeh, M.; Momeni, M.; Saradjian, M.R. Estimation and validation of atmospheric water vapor content using a MODIS NIR band ratio technique based on AIRS water vapor products. Arab. J. Geosci. 2013, 7, 1891–1897. [Google Scholar] [CrossRef]
  20. Fraser, R.; Kaufman, Y. The Relative Importance of Aerosol Scattering and Absorption in Remote Sensing. IEEE Trans. Geosci. Remote Sens. 1985, 625–633. [Google Scholar] [CrossRef]
  21. Hansen, J.E.; Travis, L.D. Light scattering in planetary atmospheres. Space Sci. Rev. 1974, 16, 527–610. [Google Scholar] [CrossRef]
  22. Gao, B.-C.; Kaufman, Y.J. Water vapor retrievals using Moderate Resolution Imaging Spectroradiometer (MODIS) near-infrared channels. J. Geophys. Res. Space Phys. 2003, 108, 1–10. [Google Scholar] [CrossRef]
  23. Berk, A. Voigt equivalent widths and spectral-bin single-line transmittances: Exact expansions and the MODTRAN®5 implementation. J. Quant. Spectrosc. Radiat. Transf. 2013, 118, 102–120. [Google Scholar] [CrossRef]
  24. Atmospheric Radiation Measurement (ARM). User Facility 2011, updated hourly. MWR Retrievals (MWRRET1LILJCLOU). 2019-08-01 to 2019-12-31, Southern Great Plains (SGP) Central Facility, Lamont, OK (C1). Compiled by K. Gaustad and L. Riihimaki. ARM Data Center. Available online: http://dx.doi.org/10.5439/1285691 (accessed on 20 March 2020).
  25. Turner, D.D.; Clough, S.A.; Liljegren, J.C.; Clothiaux, E.E.; Cady-Pereira, K.E.; Gaustad, K.L. Retrieving Liquid Water Path and Precipitable Water Vapor from the Atmospheric Radiation Measurement (ARM) Microwave Radiometers. IEEE Trans. Geosci. Remote. Sens. 2007, 45, 3680–3690. [Google Scholar] [CrossRef]
  26. Turner, D.D.; Lesht, B.M.; Clough, S.A.; Liljegren, J.C.; Revercomb, H.E.; Tobin, D.C. Dry Bias and Variability in Vaisala RS80-H Radiosondes: The ARM Experience. J. Atmos. Ocean. Technol. 2003, 20, 117–132. [Google Scholar] [CrossRef] [Green Version]
  27. Sano, I.; Mukai, S.; Yamano, M.; Takamura, T.; Nakajima, T.; Holben, B. Calibration and validation of retrieved aerosol properties based on AERONET and SKYNET. Adv. Space Res. 2003, 32, 2159–2164. [Google Scholar] [CrossRef]
  28. Holben, B.; Eck, T.; Slutsker, I.; Tanré, D.; Buis, J.; Setzer, A.; Vermote, E.; Reagan, J.; Kaufman, Y.; Nakajima, T.; et al. AERONET—A Federated Instrument Network and Data Archive for Aerosol Characterization. Remote Sens. Environ. 1998, 66, 1–16. [Google Scholar] [CrossRef]
  29. Bouffiès, S.; Bréon, F.M.; Tanre, D.; Dubuisson, P. Atmospheric water vapor estimate by a differential absorption technique with the polarisation and directionality of the Earth reflectances (POLDER) instrument. J. Geophys. Res. Space Phys. 1997, 102, 3831–3841. [Google Scholar] [CrossRef]
  30. Gao, B.-C.; Goetz, A.F.H.; Westwater, E.R.; Conel, J.E.; Green, R.O. Possible Near-IR Channels for Remote Sensing Precipitable Water Vapor from Geostationary Satellite Platforms. J. Appl. Meteorol. 1993, 32, 1791–1801. [Google Scholar] [CrossRef] [Green Version]
Figure 1. Comparison of spectral response functions of FY-3D MERSI-2 NIR bands against the MODIS near-infrared (NIR) bands. (a) FY-3D band 4 against MODIS band 2, (b) band 16 against band 17, (c) band 17 against band 18, and (d) band 18 against 19.
Remotesensing 12 03469 g001
Figure 2. Total atmospheric water vapor transmittance for a spectral range of 0.8–1.4 µm covering the FY-3D MERSI-2 NIR bands 4, 16, 17, and 18, respectively. The values were computed for a tropical atmosphere at downward looking geometry, the green line represents the position of non-absorption/window channel, and the blue line represents water vapor absorption channels as a function of wavelength.
Remotesensing 12 03469 g002
Figure 3. An example of simulated radiance obtained by MODTRAN 5, radiance ratios of two bands (absorption band/window band) as a function of PWV. (a) Tropical atmosphere, (b) mid-latitude summer, (c) mid-latitude winter, (d) sub-Arctic summer, (e) sub-Arctic winter, (f) U.S. standard, and (g) average of six atmospheres.
Remotesensing 12 03469 g003
Figure 4. The framework representing the regression steps in the development of the algorithm.
Remotesensing 12 03469 g004
Figure 5. An example of PWV retrievals from FY-3D MERSI-2 NIR channels. The left panel shows a set of the true color images of FY-3D covering different kinds of land covers over North America. The right panel shows the water vapor images derived from the proposed algorithm. The FY-3D MERSI-2 scenes were acquired on (a,b) 12 August 2019, (c,d) 25 September 2019. The color ramp shows water vapor intensity from the lowest (blue) to highest (red).
Remotesensing 12 03469 g005
Figure 6. The scatterplot (a) depicts the retrieved PWV values from the proposed algorithm versus ground-based microwave radiometer measurements where the black line is the ratio of 1:1; the red dotted line is the line fitted based on all the matched points and (b) the frequency distribution of the difference between the retrieved PWV and ground-based measurements.
Remotesensing 12 03469 g006
Figure 7. The scatterplot (a) depicts the retrieved PWV values from the proposed algorithm versus ground-based sun-photometer measurements where the black line is the ratio of 1:1 line; the red dotted line is the line fitted based on all the matched points and (b) the frequency distribution of the difference between the retrieved PWV and ground-based measurements.
Remotesensing 12 03469 g007
Figure 8. Inter comparisons of MOD05 and FY-3D MERSI-2 water vapor data over North America on 21 August, 2019, at UTC 20:45 for FY-3D MERSI-2 and UTC 18:25 for MODIS.
Remotesensing 12 03469 g008
Figure 9. Scatterplots show retrieved PWV values. (a,b) Band 16 with band 17, (c,d) band 17 with band 18 and (e,f) band 16 with band 18 versus ground-based sun-photometer measurements.
Remotesensing 12 03469 g009
Table 1. Comparison of FY-3D MERSI-2 bands with the corresponding ones of MODIS required for precipitable water vapor (PWV) estimation.
MODIS BandPosition, µmFY-3D BandPosition, µm
20.86540.865
170.905160.905
180.936170.936
190.940180.940
Table 2. The arrangement of important parameters configured to run MODTRAN 5 radiative transfer code for the simulation of the synthetic dataset.
ParameterValueInstruction
MODEL1, 2, 3, 4, 5, 6MLS, TR, MLW, SAS, SAW and US.
ITYPE2 Vertical path between two altitudes.
IEMSCT3Radiance/scattering model.
Column H2O0.3, 1.3, 2.3, 3.5 Defined column water vapor value g/cm2.
Reflectance−1, −2, −3, −4, −6, −8, −9, −10, −22, −40Snow cover, forest, farm, desert, ocean, burnt grass, maple leaf, decayed grass, cloud deck, and old grass.
IMULT−1Multiple scattering.
LLFLTNMMERSI2.fltUser-defined MERSI-2 FY-3D sensor filter function.
IHAZE1RURAL extinction, default VIS = 23 km.
GNDALT0Altitude of surface relative to sea level (km).
H1ALT100Altitude of the FY-3D satellite (km).
OBSZEN180Sensor zenith angle (°).
V110,000Initial wavenumber (cm).
V213,000Final wavenumber (cm).
PARM45Solar zenith angle (°).
MLS = mid-latitude summer, TR = tropical, MLW = mid-latitude winter, US = 1976 U.S. standard, SAW = sub-Arctic winter and SAS = sub-Arctic summer.
Table 3. Details of the Aerosol Robotic Network (AERONET) ground-based stations used for validation of retrieved PWV from FY-3D MERSI-2 over North America.
Station NameLatitudeLongitude
UACJ_UNAM_ORS31.743106.432W
Yuma32.644114.583
Goldstone35.233116.792
NEON_SRER31.911110.835
USGS_Flagstaff_ROLO35.215111.634
Modesto37.642120.994
NEON_OSBS29.68981.993
IMPROVE-Mammoth Cave37.13286.148
NASA_Ames37.420122.057
ARM_SGP36.60597.486
NEON_UKFS39.04095.192
Univ_of_Houston29.71895.342
NEON_LENO31.85488.161
NEON-CPER40.812104.744
NEON_NIWO40.054105.582
White_Sands_HELSTF32.635106.338
Publisher’s Note: MDPI stays neutral with regard to jurisdictional claims in published maps and institutional affiliations.

