Article

A Combined Machine Learning and Residual Analysis Approach for Improved Retrieval of Shallow Bathymetry from Hyperspectral Imagery and Sparse Ground Truth Data

by
Evangelos Alevizos
National Oceanography Centre, European Way, Southampton SO14 3ZH, UK
Remote Sens. 2020, 12(21), 3489; https://doi.org/10.3390/rs12213489
Submission received: 30 September 2020 / Revised: 20 October 2020 / Accepted: 21 October 2020 / Published: 23 October 2020
(This article belongs to the Section Ocean Remote Sensing)

Abstract

:
Mapping shallow bathymetry by means of optical remote sensing has been a challenging task of growing interest in recent years. Particularly, many studies exploit earlier empirical models together with the latest multispectral satellite imagery (e.g., Sentinel 2, Landsat 8). However, in these studies, the accuracy of resulting bathymetry is (a) limited for deeper waters (>15 m) and/or (b) is being influenced by seafloor type albedo. This study explores further the capabilities of hyperspectral satellite imagery (Hyperion), which provides several spectral bands in the visible spectrum, along with existing reference bathymetry. Bathymetry predictors are created by applying the semi-empirical approach of band ratios on hyperspectral imagery. Then, these predictors are fed to machine learning regression algorithms for predicting bathymetry. Algorithm performance is being further compared to bathymetry predictions from multiple linear regression analysis. Following the initial predictions, the residual bathymetry values are interpolated by applying the Ordinary Kriging method. Then, the predicted bathymetry from all three algorithms along with their associated residual grids is used as predictors at a second processing stage. Validation results show that by using a second stage of processing, the root-mean-square error values of predicted bathymetry is being improved by ≈1 m even for deeper water (up to 25 m). It is suggested that this approach is suitable for (a) contributing wide-scale, high-resolution shallow bathymetry toward the goals of the Seabed 2030 program and (b) as a coarse resolution alternative to effort-consuming single-beam sonar or costly airborne bathymetric laser surveying.

Graphical Abstract

1. Introduction

Studying the bathymetry of shallow seafloor at coastal areas with optically transparent waters is a developing sector in remote sensing that in recent years has received more and more attention. The remote sensing of coastal seafloor assists in improving our knowledge about sensitive benthic ecosystems such as coral reefs, macro-algae habitats, and soft substrates, which play a significant environmental and economical role for coastal communities [1,2,3,4] and serves as a baseline for coastal processes and coastal risk analysis studies [1,5]. The main techniques applied in optically derived bathymetry include airborne and space-borne multispectral imagery often coupled with sonar-based/airborne laser bathymetry and at a lesser extent with in situ spectral measurements. Earlier studies of [6] and [7] provided the basis for empirical modeling of bathymetry using multispectral data. Furthermore, optical models have been suggested by [8] and [9] for deriving bathymetry and inherent optical properties (IOPs) of shallow water from model inversion applied on hyperspectral imagery. In more recent studies, there has been an increasing use of multispectral imagery (mainly Sentinel2 and Landsat sensors) along with established approaches for bathymetry retrieval. [10] combined multispectral satellite imagery with optical modeling for estimating bathymetry at a wider depth range up to 30 m of water depth with their results showing a root-mean-square error (RMSE) between 1 and 2 m. [11] proposed a method for deriving bathymetry first by clustering multispectral satellite imagery and then by applying empirical models [6,7] and a support vector machine (SVM) algorithm to each cluster separately. This approach minimized significantly the influence of bottom variability in deriving bathymetry resulting in mean absolute errors between 0.2 and 0.5 m. However, these bathymetry errors correspond to seafloor shallower than 5 m of water depth. Their RMSE reached up to 2 m for depths deeper than 5 m. [12] applied a semi-empirical bio-optical model on Sentinel2 imagery which outputs wide depth zones instead of continuous bathymetry. Furthermore, [13] introduced a novel method that is based on the Google Earth Engine cloud computing platform for deriving bathymetry using Sentinel2 imagery. They implemented four empirical models [7,14,15,16], and they obtained bathymetry predictions with RMSE values between 1 and 3 m for various nearshore locations in Greece. Furthermore, they calculated the spatial distribution of bathymetry residuals for analyzing their potential relationship with reference depth and/or seafloor type. They suggest that the spatial modeling of residuals should be implemented in future studies for improving the results of satellite-derived bathymetry. The aforementioned studies have shown potential in bathymetric mapping of wide areas of shallow seafloor up to an average depth of 15 m. Beyond this depth, there is a significant decrease in bathymetric accuracy. This limitation is mainly due to the restricted spectral resolution of multispectral sensors [17], which usually provide 3–4 spectral bands in the visible spectrum.
Optically derived bathymetry relies on wavelengths (spectra) of the visible spectrum that are less absorbed by water. These wavelengths range from 400 nm (violet) to 650 nm (red). According to Beer’s law, longer wavelengths are being absorbed faster as they travel through the water column, while shorter wavelengths penetrate at greater depths. The water penetration of different wavelengths is further affected by seawater contents such as chlorophyll and suspended matter concentrations that absorb specific wavelengths [8]. In contrast to multispectral imagery, there are other sensors that record at finer spectral resolution (5–20 nm) in the visible spectrum providing hyperspectral imagery with numerous bands. Such imagery is provided by the Hyperion sensor (EO1 mission: 2002–2016) with a spatial resolution of 30 m offering more than 20 spectral bands in the visible spectrum.
In order to obtain better results from multispectral imagery, some recent studies tested also machine learning techniques for deriving bathymetry. [18] applied an artificial neural network (ANN) approach on Landsat imagery with promising results even for predicting depths greater than 20 m. Furthermore, [19] tested two ANN algorithms on IKONOS and Landsat imagery that outperformed the optical modeling and the regression trees techniques. By using several hundreds of training data points, they obtained bathymetry predictions with RMSE values of less than 1.5 meter for a depth range between 0 and 18 m. [20] applied a SVM algorithm on Landsat imagery using more than a thousand training points; however, the RMSE values they yielded were more than 2 m for a depth range between 0 and 22 m. [21] developed a new approach for deriving bathymetry from IKONOS-2 multispectral imagery. They modified an SVM model to perform training only on a localized level (e.g., neighborhood scale) and by using the full size of training dataset (≈720 training points per km-2), they obtained bathymetry with RMSE values less than one meter for up to a depth of 16 m. Their approach proved relatively robust when they reduced the amount of training data by 90%, and they obtained an RMSE value of 1.3 m. In addition, [21] emphasized the effect of residuals autocorrelation that is produced by global training approaches when a regression model is being applied. They suggest that a locally trained algorithm tackles better the various sources of error in the bathymetric prediction process.
Until now, the applicability of hyperspectral imagery for deriving bathymetry has been mainly tested with numerical optical models and with in situ spectral libraries [8,9,22,23] showing variable results that are valid only for very shallow water depths. Optical models require computational power and expert knowledge for model tuning, and in situ spectral libraries require time-consuming field surveys. In this study, we combine the strengths of empirical models with the applicability of machine learning and geostatistical analyses for improving bathymetry predictions from hyperspectral imagery in a more efficient way. Machine learning algorithms are quite successful in identifying the complex relationship between high-dimensional datasets, and they have been implemented within most geographic information systems (GIS) software. The aim of this study is to assess the performance of machine learning algorithms in conjunction with hyperspectral imagery for deriving shallow bathymetry over a wide range of depths and seafloor types by exploiting a restricted amount of ground truth bathymetry data. The rationale of the study is that hyperspectral data provide a greater number of input variables that describe optical depth variability more effectively. In addition, considering the conclusions from [13], we incorporate the bathymetry residuals in the suggested workflow for maximizing the accuracy of satellite-derived bathymetry (SDB).

2. Materials and Methods

The areas shown in Figure 1 were selected for this study according to the availability of hyperspectral imagery and reference bathymetry along with suitability due to water transparency. Caribbean sea waters are classified as Jerlov type IA [24] suggesting maximum light transmission (i.e., very low absorption) and thus increased water clarity. This is mainly due to the highly oligotrophic character of Caribbean waters, which results in a low concentration of chlorophyll in the water column [25]. In this way, the task of deriving bathymetry from optical data is better constrained, primarily to the effects of water depth and seafloor type albedo. Sparse points extracted from airborne laser bathymetry [26] acquired in 2006 were used as a reference for guiding the analysis of hyperspectral data. In addition, existing ground truth samples of benthic cover [27] from part of the study area were used for examining the relation of SDB errors with seafloor type.
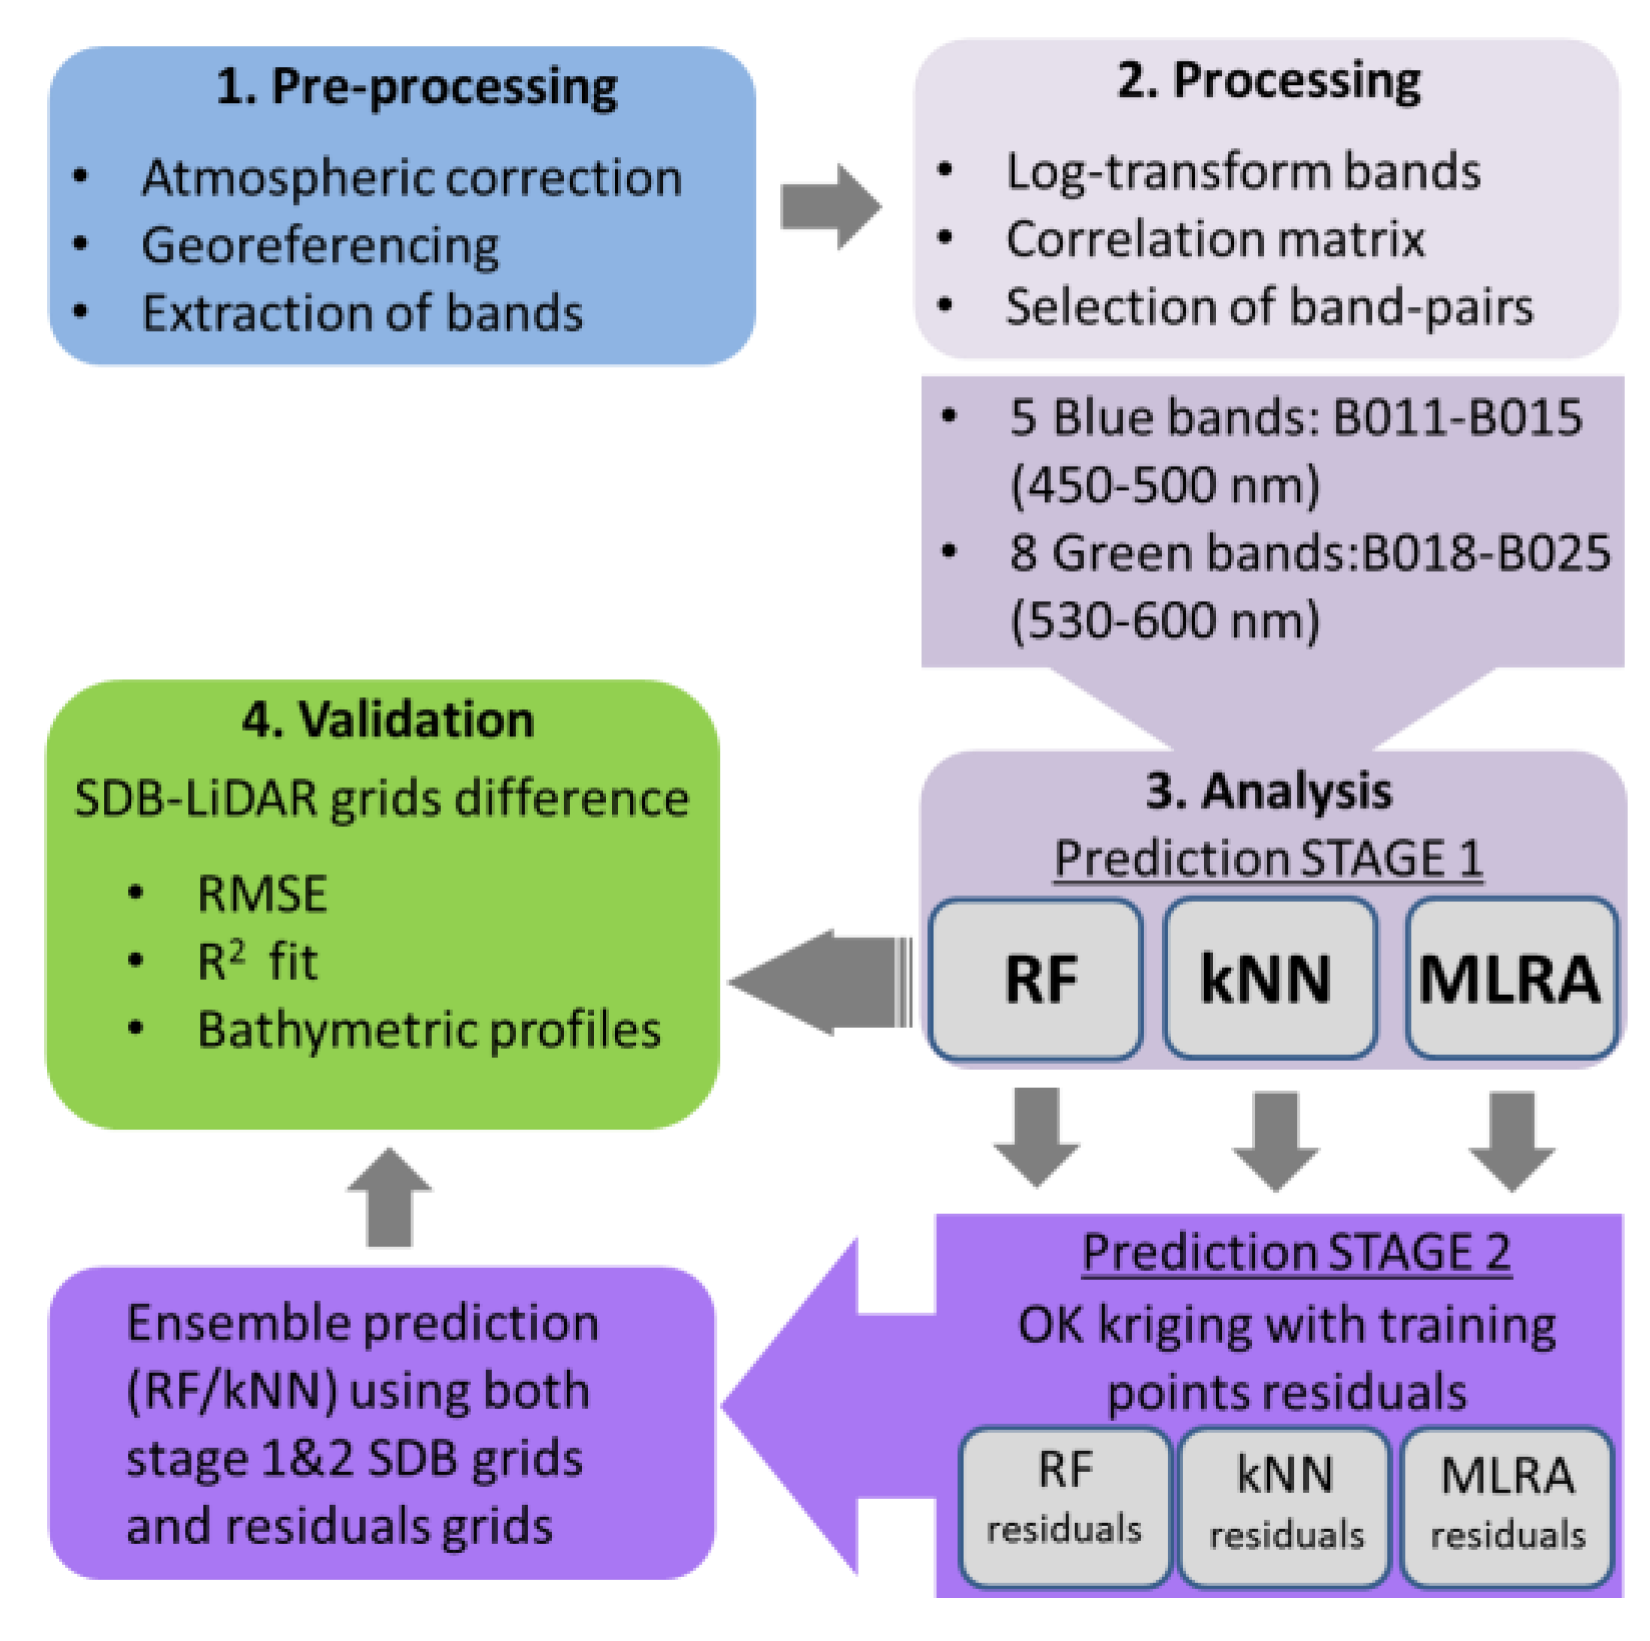
The study area comprises of two sub-areas (PR1 and PR2) representing two different Hyperion datasets (Figure 1, Table 1) that were processed and analyzed separately. In each case, 5 bands (B011-B015) from the blue (430–480 nm) and 8 bands (B018–B025) from the green (500–610 nm) ranges of the visible spectrum were used. The overall steps of the workflow followed in this study are shown in Figure 2. Hyperion L1R level products were corrected for atmospheric effects using the FLAASH© model in ENVI© software. The pixel values of L1R products are radiometrically corrected at-sensor (top of atmosphere or TOA) radiances in digital number (DN) units. The atmospheric model was set to represent atmospheric conditions in the tropics and to take into account the effect of maritime aerosol. Afterwards, the natural logarithm was calculated for each of the 14 bands, and a set of band ratios was built following the approach of [7]. This approach was chosen since it is regarded as less sensitive to bottom-type variations [11]. In order to select the most appropriate band ratios for predicting bathymetry, we calculated the correlation coefficient between band ratios and reference bathymetry. Band ratios showing a correlation coefficient of more than 0.5 were selected as inputs to the process for deriving bathymetry using two machine learning algorithms (kappa nearest neighbor (kNN) and random forest (RF), regression models) and multiple linear regression analysis (MLRA).
In this study, two machine learning algorithms were tested against a multiple linear regression analysis (MLRA) approach. The machine learning algorithms do not require any assumptions regarding the distribution of input variables, and they are capable of resolving complex relationships between the independent variables (predictors) and the dependent variable.
The RF is a machine learning algorithm developed by [28], and it is applied for the classification of categorical values or for the regression of continuous variables. The concept of the RF algorithm is based on the use of multiple random subsets of the explanatory variables (predictors) for generating a model (classification/regression trees) describing the variability of the dependent variable. Thus, a set of training data is mandatory in the RF process, and it should capture as much of the data variability in the area. During the model building, the RF will reserve randomly selected parts of the training data for internal cross-validation of the results (out-of-bag sample). At each iteration, one explanatory variable is neglected, and its importance score is calculated by assessing the prediction error. The variable importance calculation is considered one of the main advantages of the RF algorithm. The RF has been successfully applied so far in benthic habitat mapping and seafloor characterization studies [29,30,31]. In a more recent study from [32], they applied the RF algorithm on multi-temporal Landsat8 imagery for estimating bathymetry at various locations around the world (5–25 m of water depth). They used several hundreds of training points per square kilometer at each location, and they obtained results with RMSE values from 1 to 2.5 m in general.
The kNN is another widely applied machine learning algorithm characterized by simplicity in its implementation. The algorithm has a dual functionality allowing for either classification or regression applications. The kNN regression is applied for predicting the values of a continuous variable by using the values of independent variables from k samples in space [33]. The method makes use of a training dataset for producing predictions for unknown independent variables by averaging the values of the k nearest known independent variables based on a distance metric [34]. Similarly to the RF, the kNN also requires a sufficient amount of training data that best describe the overall variability of the variables under examination. The kNN algorithm has been applied in various marine mapping projects [35,36,37] and recently, [38] utilized Worldview-3 imagery and the kNN regression algorithm for predicting bathymetry over variable seafloor types and up to a depth of 30 m. In their study, the kNN method produced bathymetric predictions with relatively small RMSE values (1–1.5 m) even for deeper waters. However, these results were obtained by using a relatively large training dataset of 1500 reference bathymetry points over a study area of approximately 1 km−2.
The MLRA is one of the most widely used techniques in predicting a dependent variable (continuous) by using a set of explanatory variables (Equation (1)). The greater the correlation of determination (R2) between the explanatory and the dependent variable, the better the prediction result. As with the machine learning techniques, part of the data are used for training the algorithm and building a model by using several predictors that have the form of Equation (2) [7]:
yi01xi12xi2+…+βpxip
where for i = n observations, yi = dependent variable, xi = explanatory variables, β0 = y-intercept (constant term), βp = slope coefficients for each explanatory variable, and ϵ = the model’s error term (also known as the residuals).
z= m1(lnBi/lnBj) − m0
where z = depth, m1 = user-defined scaling factor, m0 = fixed depth offset, Bi = pixel value of i wavelength band, Bj = pixel value of j wavelength band, providing that i < j.
MLRA has been amongst the first techniques applied for estimating bathymetry using multispectral imagery [6,14]. The MLRA was further applied in various optical bathymetry studies under different model adaptations [7,11,15,20,39].
The presented method was based on extending the empirical approach from [7] to the spectral range of hyperspectral data between 430 and 610 nm (Equation (3). According to [40], the calibration between the band-ratio values and the reference bathymetry is a critical step in the SDB models. The model from [7] is based on Equation (2), according to which the ratio of a log-transformed blue band and a log-transformed green band is taken. The dividend should be a band with shorter wavelength than the divisor (e.g., near the blue spectrum). Generally, the divisor is a band chosen from the green or the red range of the spectrum, depending on the average depths of the study area. [40] suggest that blue/green ratios show better results for deriving greater depths, while blue/red ratios are more suited for deriving shallow depths. Consequently, five blue hyperspectral bands were combined with nine green hyperspectral bands. By applying the [7] model to hyperspectral imagery, a larger number of bathymetry predictors is being produced, and thus, a better approximation of actual bathymetry may be achieved. The correlation coefficient (R2) of all ratios with bathymetry was examined. Consequently, a number of 40 band ratios with a correlation coefficient greater than 0.5 with airborne laser bathymetry were used as input to three algorithms: (a) MLRA, (b) kNN regression, and (c) RF. A randomly created set of 300 bathymetric points was used for training the algorithms in each area. This number was selected for resembling a sparse bathymetric dataset.
By taking Equation (2) for several band ratios, we obtain:
z = β0 + β1(lnBi1/lnBj1) + β2(lnBk2/lnBl2) +… + βp(lnBmp/lnBnp) + ϵ
where for 1:n band ratios, z = depth, β0= y-intercept (constant term), β1..p=slope coefficients for each explanatory variable, Bi,k,m= blue bands, Bj,l,n= green bands, and ϵ=the model’s error term
An additional processing stage was considered for improving the RMSE between the predicted and reference bathymetry. The main idea is that output bathymetry grids from the previous stage may be potentially combined for providing a final grid with better bathymetric predictions. In order to strengthen this concept, we considered including the residual errors in a way similar to that applied in geostatistical analysis studies [29,41]. Once the residuals of each algorithm output were calculated (at each training point), then we applied the Ordinary Kriging algorithm (SAGA GIS spatial and Geostatistics tools) [42] for producing an interpolated surface describing the spatial distribution of bathymetric residuals. The amount and even distribution of training points in the areas (see Results section) assure that the interpolated residual grid provides a quite representative result regarding the actual distribution of bathymetric errors. In total, six predictive layers (three output bathymetry grids from stage 1 along with their interpolated residual grids) were utilized at the second stage of predictive mapping using only the machine learning algorithms (kNN and RF). These were chosen as more suitable techniques in retrieving bathymetry from unconventional predictors that show a non-linear relationship with reference bathymetry.

3. Results

3.1. First Stage

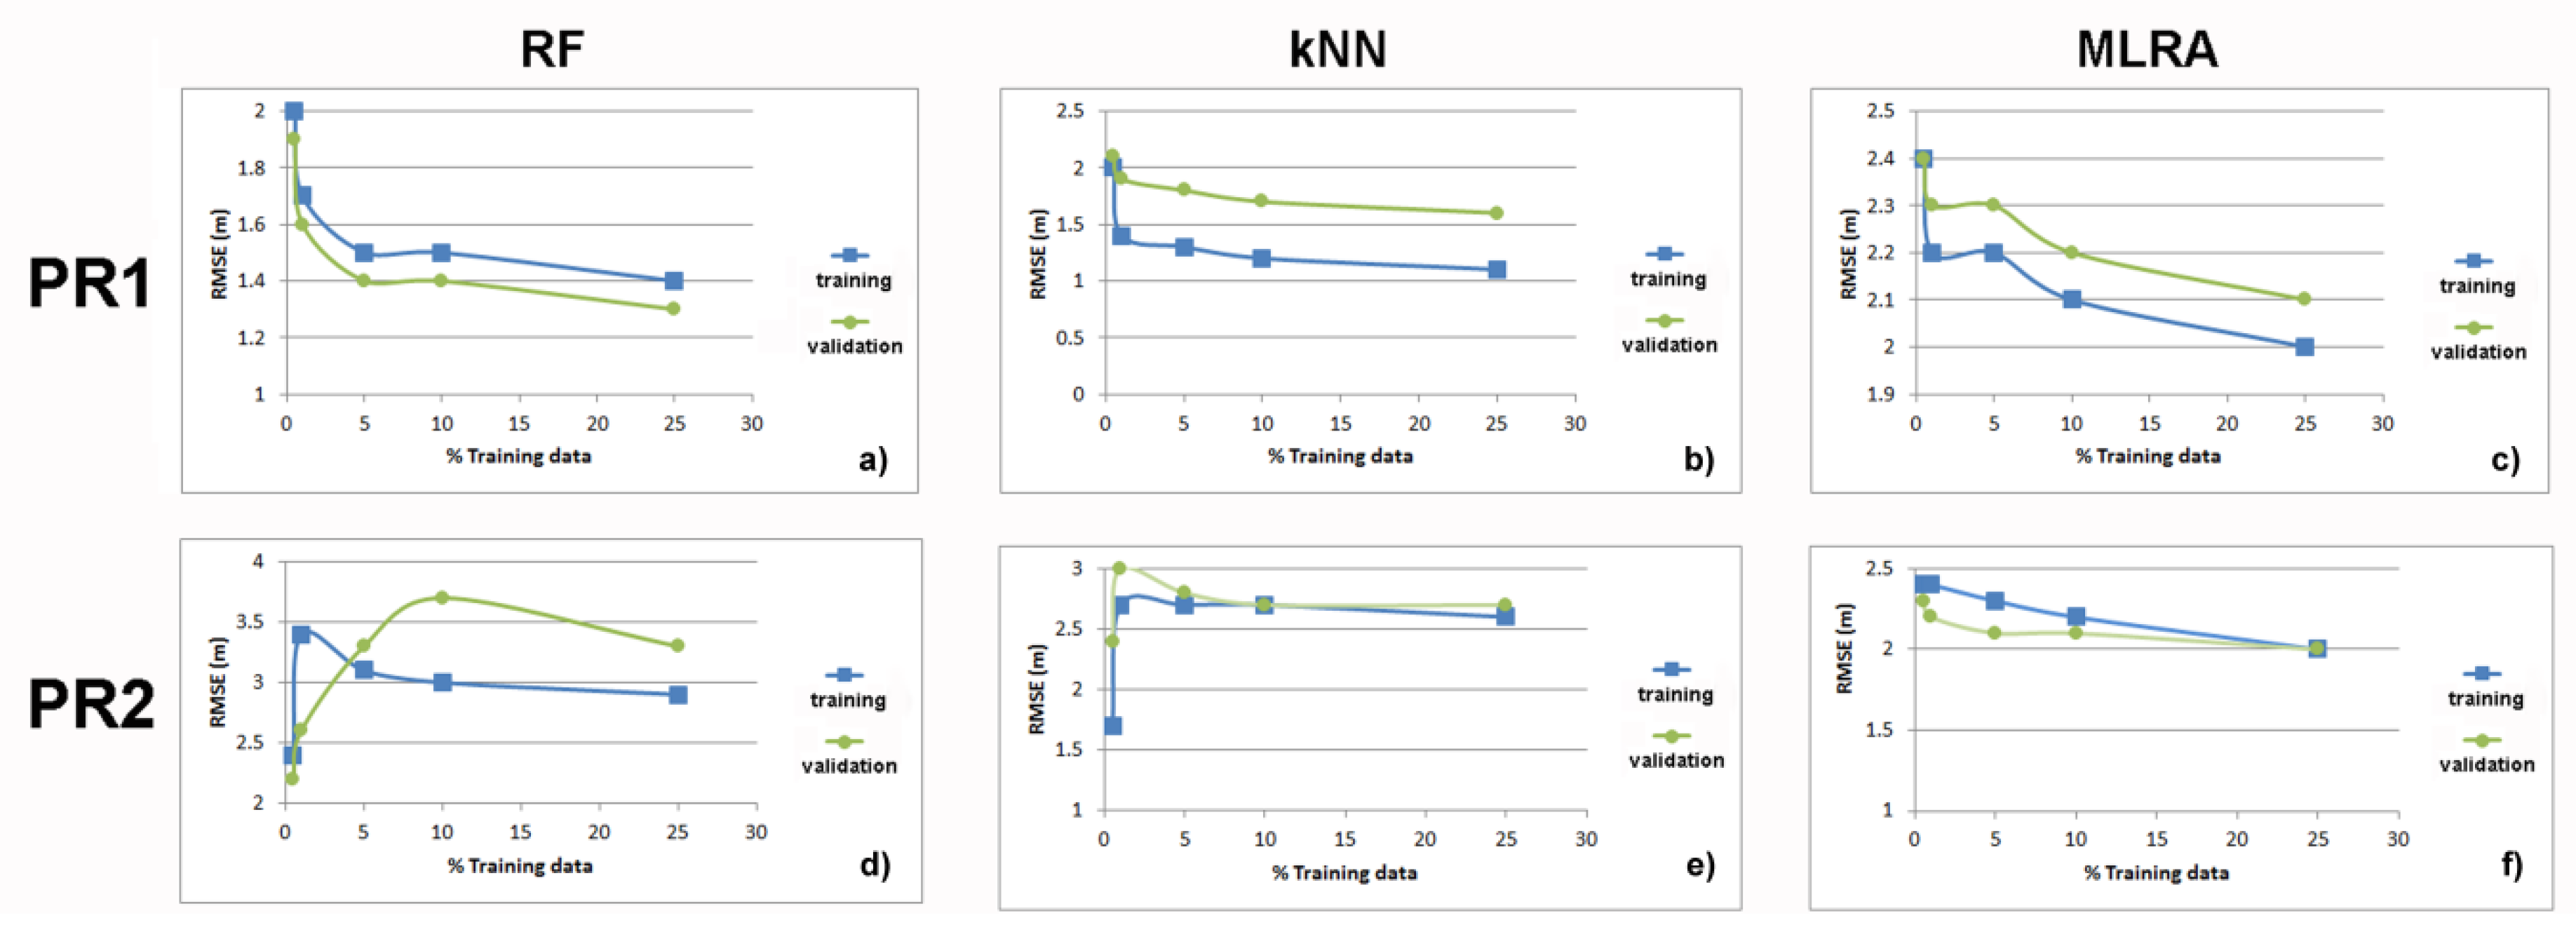
All algorithms were trained using several fractions of the corresponding airborne laser bathymetry data in each sub-area. The learning curves are presented in Figure A1 (Appendix A). An upper limit of 25% training data points was used, since it was observed that the RF and the kNN algorithms were not performing optimally for larger training sizes. According to the learning curves in Figure A1 (Appendix A), it may be inferred that in general, an increase of the training data does not minimize the prediction error significantly. Furthermore, it is observed that in some instances (Figure A1a,f), the training error is larger than the validation error, indicating some form of bias resulting in under-fitting of the training data. The concept of this study is based on the exploitation of sparse bathymetric data for mapping remote coastal areas; thus, only the SDB using the minimum training size (i.e., 0.5% or ≈300 data points) is presented below. The resulting SDB for area PR1 is shown in Figure 3. Regarding area PR1, the RF performed better than the kNN and MLRA algorithms in terms of correlation with reference bathymetry and the RMSE of the residuals (Figure 3(ai,aii), Table 2). It has to be noted that for an overall assessment of predicted bathymetry, the residuals were calculated on a per-pixel basis (prediction grid minus the reference bathymetry grid) and not only extracted from the training samples. The RMSE for area PR1 using the RF is 1.9 m, and depth residuals are not related to a particular depth range (Figure 4). It has to be noted that the MLRA utilized a small fraction (see Discussion) out of the total number of band ratios provided compared to the kNN and RF algorithms. Regarding area PR2, all algorithms predicted bathymetry relatively well in terms of correlation with reference bathymetry (i.e., R2 > 0.85); however, the RMSE for all algorithm outputs was greater than 2 m (Table 2). Nevertheless, the MLRA model showed the best performance regarding PR2 with an RMSE value of 2.2 m (Figure 3(cxi,cxii), Table 2).

3.2. Second Stage

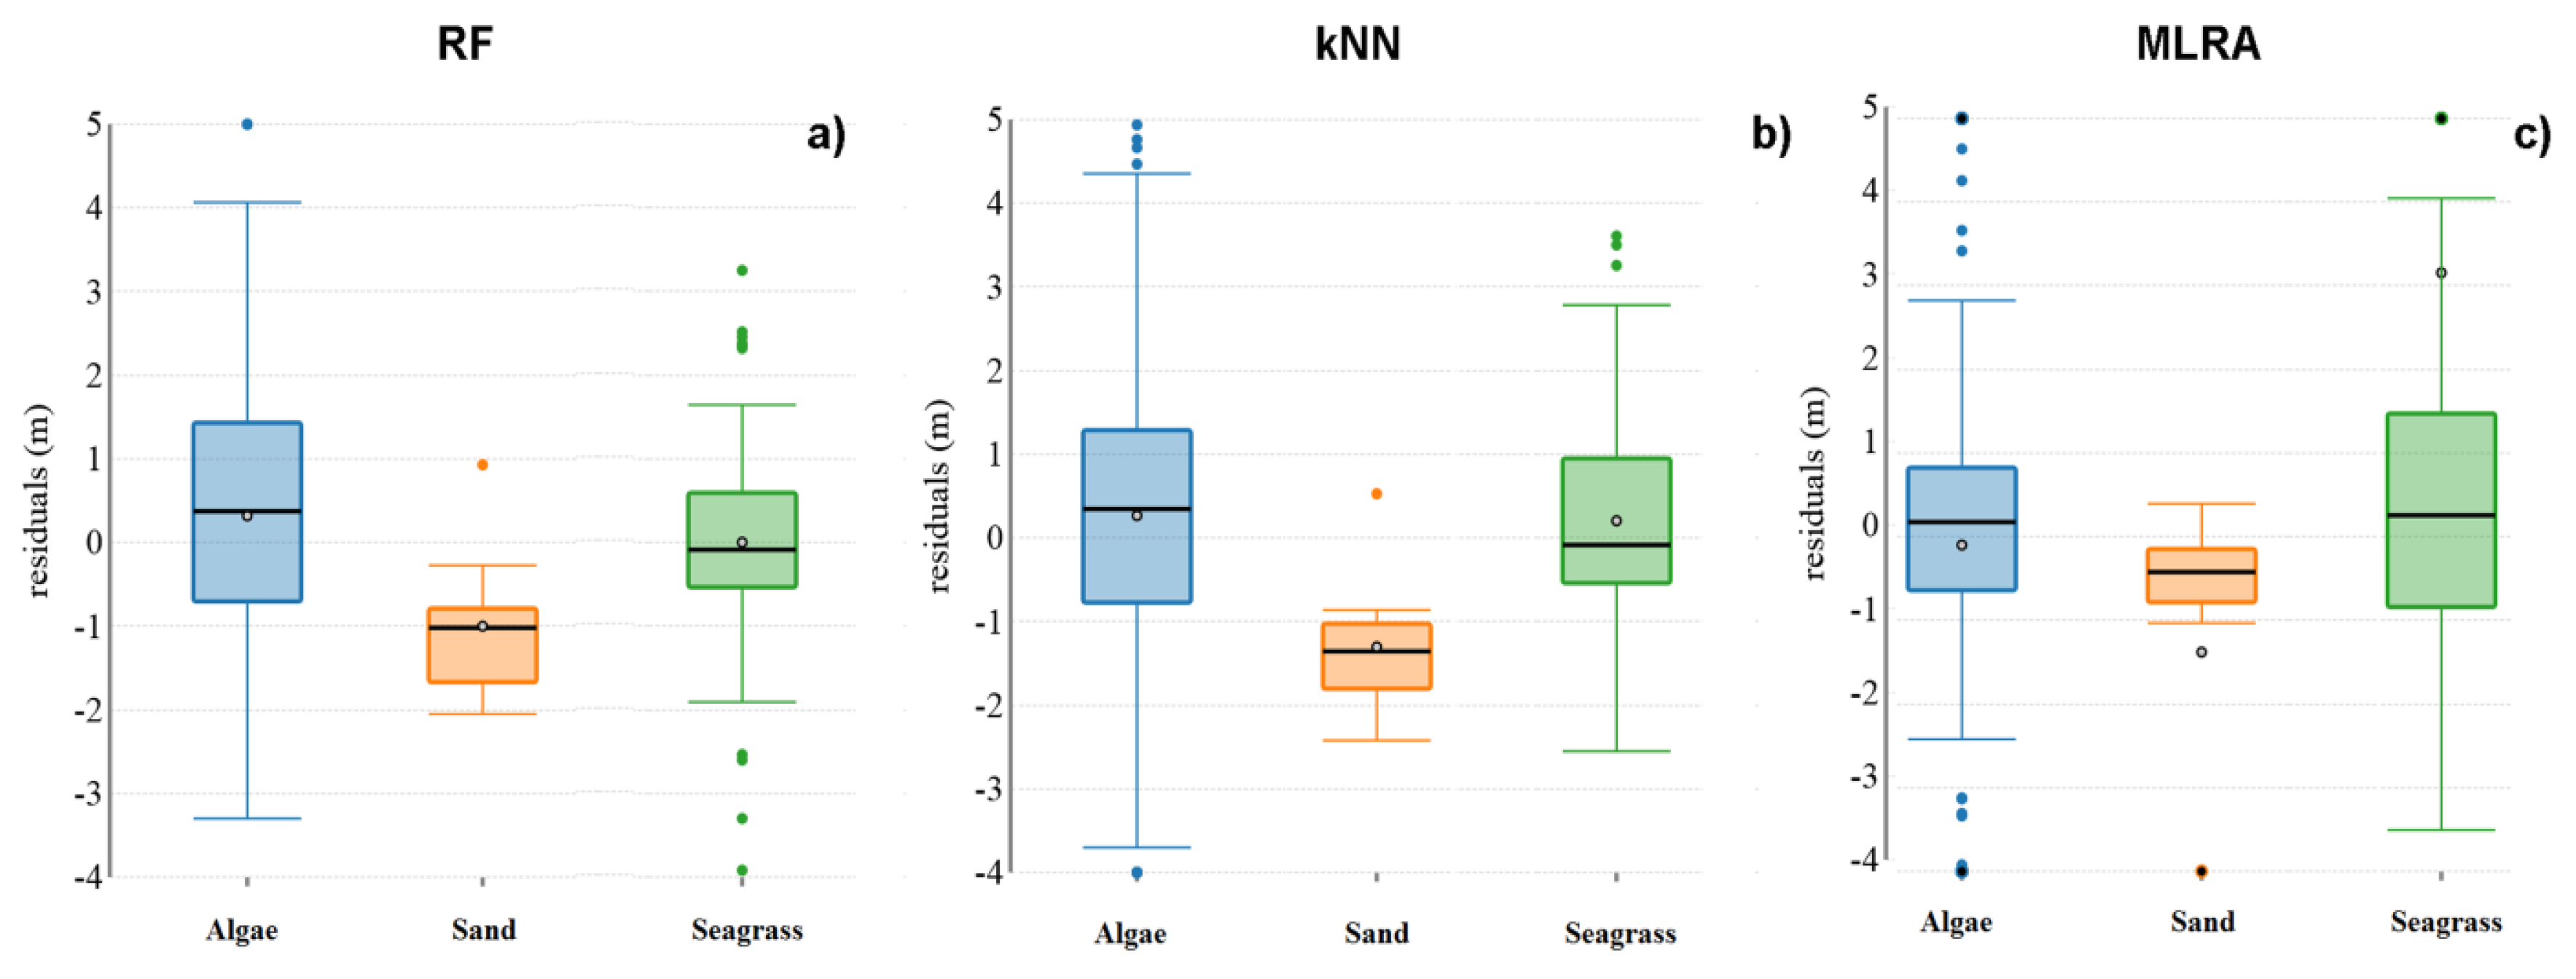
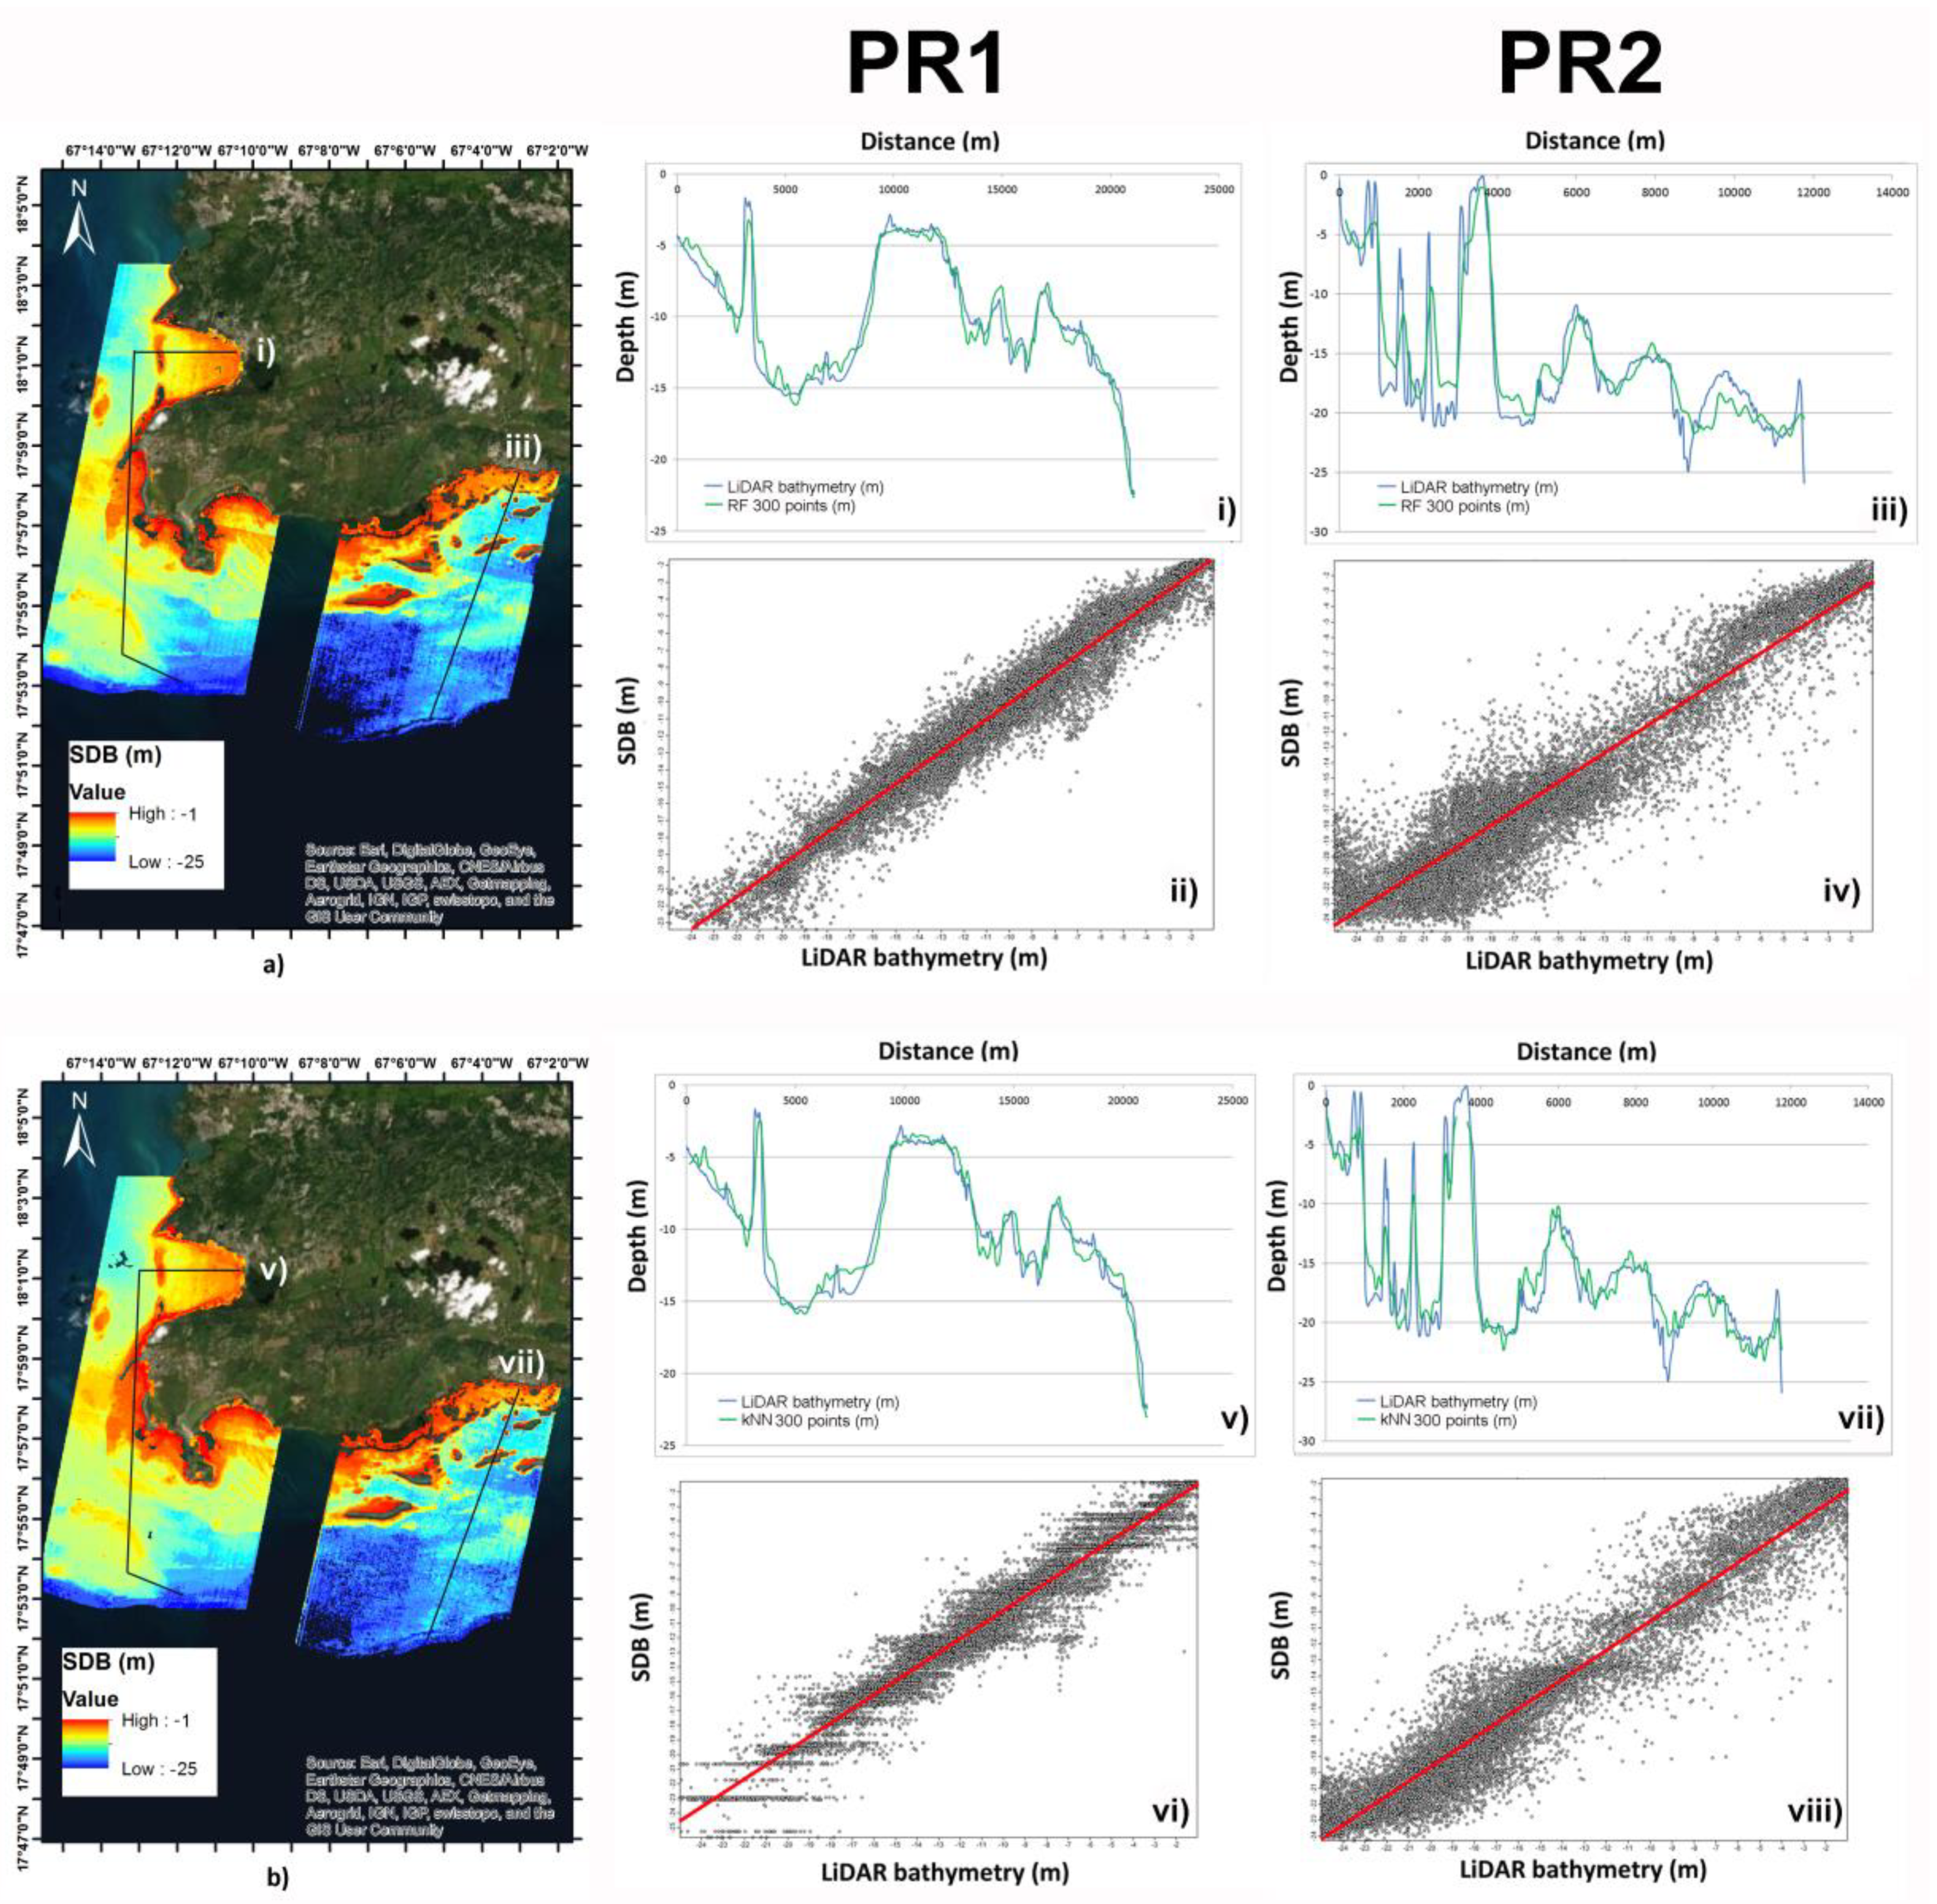
At the second stage, once the residuals from each algorithm output were calculated at each training point (Figure 4), the Ordinary Kriging method was used for modeling their spatial distribution. The residuals were fitted with a function that showed the highest variogram determination score. In general, it was observed that at the first stage, each algorithm performed in a slightly different way judging by the error distribution (Figure 4), and there was not any particular relation of residuals with depth or any seafloor cover (Figure 4 and Figure 5). The RF and kNN algorithms provided more accurate bathymetric predictions (Figure 6, Table 3) than in the first stage, reducing the RMSE values approximately by one meter. In the second stage, the RF performed slightly better than the kNN in terms of RMSE values, and both algorithms achieved a high correlation coefficient with reference bathymetry (Figure 6(ai–aiv), Table 3).

4. Discussion

4.1. Algorithm Performance

MLRA was set to perform a step-wise selection of predictor grids with a p-value of 5%. Regarding the PR1 area, three predictors were selected out of 40 input variables, whereas in the PR2 area, the MLRA selected seven predictors out of 40 input variables. The MLRA predictor selection suggests that it is not the entire number of hyperspectral bands that is crucial for deriving bathymetry, but it is rather a portion of effective bands within the range of 430–610 nm. One possible explanation for this discrepancy between PR1 and PR2 might be the fact that PR1 has a median depth of 12 m, while PR2 has a median depth of 18 m. The relatively shallower depths over PR1 area possibly require a smaller number of blue/green band ratios for bathymetric prediction. In contrast, deeper waters of PR2 require a larger number of blue/green band combinations for accurate bathymetry retrieval. Considering the output importance scores from the RF algorithm, there was not observed any particular pattern on the most important band ratios for any of the sub-areas.
Both areas show an overall RMSE close to 10% of predicted depth. The slightly increased RMSE values for PR2 may also be attributed to error contributions due to the greater median depth of the area.
Geostatistical modeling of residuals assisted in further minimizing the RMSE values for both areas using the kNN and RF regression algorithms. Modeling the spatial trend of residuals has been proposed in [13] as a complementary task in future studies regarding satellite-derived bathymetry. In order to better understand the error distribution, we examined the residuals against data from existing seafloor classes about PR2 [27]. Boxplots in Figure 5 show that all classes (algae, sand, and seagrass) include residuals with approximately zero mean, suggesting that there is no clear relation between extreme residual values and a particular seafloor type. Nevertheless, sandy seafloor appears to hold less spread residuals, meaning that bathymetry predictions over sand are more accurate than those over algae or seagrass. The relatively homogeneous distribution of residuals and their independence from seafloor type (Figure 4 and Figure 5) suggests that these may be attributed to sensor noise and/or widespread contributions from water column or sun-glint effects. It is hypothesized that the imagery from PR2 is probably mildly influenced by sun-glint, which was not possible to remove in the preprocessing steps.
The training set of random points used in this study consists of ≈4 training points per km2 in each area, and each point has a minimum distance of 90 m with (i.e., three times the cell size) to avoid autocorrelation effects. This study yielded accuracy results comparable to that of similar studies, although a significantly lower amount of training points was used. This is attributed to the effectiveness of hyperspectral data that contribute further in describing most of the data variability. It is hypothesized that by increasing the input data (i.e., the number of bands in the visible spectrum), less training data are required. If this study was to use the same amount of training points as earlier studies do, then we should have used at least hundreds of times more data points per square kilometer. In reality though, this is a rather unrealistic scenario and thus not practical when remote or uncharted areas need to be mapped. Our approach is assumed to be more compatible with the multi-purpose use of unmanned underwater vehicles (UUVs) and autonomous underwater/surface vehicles (AUVs, ASVs), taking advantage of their remote capabilities for collecting ad hoc sparse bathymetric data without the need for dedicated bathymetric surveys. This is a more effective way for fusing ground-truth depths with satellite imagery and producing more accurate wide-scale shallow bathymetry.

4.2. Comparison with Other SDB Methods Using Hyperspectral Imagery

This study shows that band ratios from hyperspectral imagery produce bathymetric maps with vertical errors falling within 10% of water depth or less. This apparently seems to be a general rule in earlier studies using hyperspectral imagery for deriving bathymetry [22,23]. Furthermore, [9] applied several radiative transfer models on airborne hyperspectral imagery for deriving bathymetry and seafloor types. Some of the models (i.e., BRUCE) performed significantly well in producing bathymetry for depths between 0 and 15 m with RMSE values of less than one meter. However, the majority of the bathymetry retrievals for depths greater than 10 m contained RMSE values between 1 and 4 m. [43] introduced a novel empirical model based on the concept of [7], but instead of using the ratio of two bands, they suggest using the ratio of similarity and correlation coefficients with reference onshore spectra. These coefficients are supposed to account better for the influence of water depth and bottom type on the reflectance values of imagery. Their study shows promising results with RMSE values varying between 1 and 2 m. [44] utilized hyperspectral imagery from the Compact Airborne Spectrographic Imager (CASI) sensor for deriving bathymetry and benthic habitats up to 10 m of water depth by applying a set of reference spectral classes produced using the Hydrolight © optical model. Their approach outputs narrow depth zones rather than continuous bathymetric data, and their results show a declining accuracy with increasing depth.
In this study, hyperspectral imagery contributes several predictor variables (i.e., band ratios), each one fitting a portion of particular depths for the given seafloor cover. By combining the descriptive ability of as many predictors as possible in a machine learning regression workflow, a more complete bathymetric prediction can be achieved even for areas with complex seafloor types and water depths by utilizing a restricted amount of ground truth bathymetry data.
Compared to earlier approaches, another important output of this study is that the residuals are spread uniformly toward all depths. This shows that hyperspectral imagery and the band ratios have a good potential in producing shallow seafloor bathymetry with more homogeneous errors even for depths greater than 10 m. In addition, the presented approach utilizes primarily openly available datasets and software; thus, it is more applicable to a wider number of users. The only task that required the use of a commercial software was the atmospheric correction. However, there are some alternative techniques for performing crude atmospheric correction [45] without the need of commercial software, and thus, the overall approach is considered as largely open-source.

5. Conclusions

This study has demonstrated that the use of hyperspectral imagery is vital for producing accurate bathymetry by utilizing a sparse set of reference data. Hyperspectral imagery contributes more information about shallow water optical properties, and thus, it is a more suitable input to machine learning regression algorithms for deriving bathymetry. In addition, the usefulness of band ratios is extended by using a larger amount of blue/green band combinations and thus producing bathymetry descriptors that are less sensitive to seafloor type albedo over wider depth ranges. By including bathymetry residuals from initial predictions to an additional processing stage, a much higher accuracy is being achieved. This approach is quite robust in that it produces relatively low RMSE values by using a very limited amount of training data. It is suggested that the approach described in this paper is easily implemented; thus, it has good potential in contributing new high-resolution (30 × 30 m) bathymetry to international bathymetry mapping projects, such as the Seabed 2030 project.

Funding

This research was funded by the NERC CLASS NC programme (NE/R015953/1) and the GCRF grant SOLSTICE-WIO (NE/P021050/1)

Acknowledgments

This open-access publication has been supported by the National Oceanographic Library at National Oceanography Centre Southampton, UK.

Conflicts of Interest

The author declares no conflict of interest

Appendix A

Figure A1. Learning curves of the algorithms used for predicting SDB in this study. Sub-area PR1: (a) Random forest, (b) kappa nearest neighbors, (c) multiple linear regression analysis. Sub-area PR2: (d) Random forest, (e) kappa nearest neighbors, (f) multiple linear regression analysis.
Remotesensing 12 03489 g0a1

References

  1. Wang, Y. Remote sensing of coastal environments. In Remote Sensing Applications; Taylor and Francis Series; CRC Press: Boca Raton, FL, USA, 2010; ISBN 978-1-42-009442-8. [Google Scholar]
  2. Hamylton, S. Hyperspectral remote sensing of the geomorphic features and habitats of the Al Wajh Bank reef systems, Saudi Arabia, Red Sea. In Seafloor Geomorphology as Benthic Habitat; Harris, P.T., Baker, E.K., Eds.; Elsevier: London, UK, 2012; pp. 357–365. [Google Scholar]
  3. Roelfsema, C.; Kovacs, E.; Ortiz, J.C.; Wolff, N.H.; Callaghan, D.; Wettle, M.; Ronan, M.; Hamylton, S.M.; Mumby, P.J.; Phinn, S. Coral reef habitat mapping: A combination of object-based image analysis and ecological modelling. Remote Sens. Environ. 2018, 208, 27–41. [Google Scholar] [CrossRef]
  4. El Mahrad, B.; Newton, A.; Icely, J.D.; Kacimi, I.; Abalansa, S.; Snoussi, M. Contribution of remote sensing technologies to a holistic coastal and marine environmental management framework: A review. Remote Sens. 2020, 12, 2313. [Google Scholar] [CrossRef]
  5. Li, R.; Liu, J.K.; Felus, Y. Spatial modeling and analysis for shoreline change detection and coastal erosion monitoring. Mar. Geod. 2001, 24, 1–12. [Google Scholar] [CrossRef]
  6. Lyzenga, D.R. Passive remote sensing techniques for mapping water depth and bottom features. Appl. Opt. 1978, 17, 379–383. [Google Scholar] [CrossRef] [PubMed]
  7. Stumpf, R.P.; Holderied, K.; Sinclair, M. Determination of water depth with high-resolution satellite imagery over variable bottom types. Limnol. Oceanogr. 2003, 48, 547–556. [Google Scholar] [CrossRef]
  8. Kutser, T.; Miller, I.; Jupp, D.L.B. Mapping coral reef benthic substrates using hyperspectral space-borne images and spectral libraries. Estuar. Coast. Shelf Sci. 2006, 70, 449–460. [Google Scholar] [CrossRef]
  9. Dekker, A.G.; Phinn, S.R.; Anstee, J.; Bissett, P.; Brando, V.E.; Casey, B.; Fearns, P.; Hedley, J.; Klonowski, W.; Lee, Z.P.; et al. Intercomparison of shallow water bathymetry, hydro-optics, and benthos mapping techniques in Australian and Caribbean coastal environments. Limnol. Oceanogr. Methods 2011, 9, 396–425. [Google Scholar] [CrossRef] [Green Version]
  10. Eugenio, F.; Marcello, J.; Martin, J. High-resolution maps of bathymetry and benthic habitats in shallow-water environments using multispectral remote sensing imager. IEEE Trans. Geosci. Rem. Sens. 2015, 53, 3539–3549. [Google Scholar] [CrossRef]
  11. Geyman, E.C.; Maloof, A.C. A simple method for extracting water depth from multispectral satellite imagery in regions of variable bottom type. Earth Space Sci. 2019, 6, 527–537. [Google Scholar] [CrossRef]
  12. Mavraeidopoulos, A.K.; Oikonomou, E.; Palikaris, A.; Poulos, S. A hybrid bio-optical transformation for satellite bathymetry modeling using sentinel-2 imagery. Remote Sens. 2019, 11, 2746. [Google Scholar] [CrossRef] [Green Version]
  13. Traganos, D.; Poursanidis, D.; Aggarwal, B.; Chrysoulakis, N.; Reinartz, P. Estimating satellite-derived bathymetry (SDB) with the Google Earth Engine and sentinel-2. Remote Sens. 2018, 10, 859. [Google Scholar] [CrossRef] [Green Version]
  14. Lyzenga, D.R. Shallow-water bathymetry using combined lidar and passive multispectral scanner data. Int. J. Remote Sens. 1985, 6, 115–125. [Google Scholar] [CrossRef]
  15. Dierssen, H.M.; Zimmerman, R.C.; Leathers, R.A.; Downes, T.V.; Davis, C.O. Ocean color remote sensing of seagrass and bathymetry in the Bahamas Banks by high-resolution airborne imagery. Limnol. Oceanogr. 2003, 48, 444–455. [Google Scholar] [CrossRef]
  16. Traganos, D.; Reinartz, P. Mapping Mediterranean seagrasses with Sentinel-2. Mar. Pollut. Bull. 2017, 134, 197–209. [Google Scholar] [CrossRef] [Green Version]
  17. Kobryn, H.T.; Wouters, K.; Beckley, L.E.; Heege, T. Ningaloo reef: Shallow marine habitats mapped using a hyperspectral sensor. PLoS ONE 2013, 8, e70105. [Google Scholar] [CrossRef] [Green Version]
  18. Gholamalifard, M.; Kutser, T.; Esmaili-Sari, A.; Abkar, A.A.; Naimi, B. Remotely sensed empirical modeling of bathymetry in the Southeastern Caspian Sea. Remote Sens. 2013, 5, 2746–2762. [Google Scholar] [CrossRef] [Green Version]
  19. Liu, S.; Gao, Y.; Zheng, W.; Li, X. Performance of two neural network models in bathymetry. Remote Sens. Lett. 2015, 6, 321–330. [Google Scholar] [CrossRef]
  20. Misra, A.; Vojinovic, Z.; Ramakrishnan, B.; Luijendijk, A.; Ranasinghe, R. Shallow water bathymetry mapping using Support Vector Machine (SVM) technique and multispectral imagery. Int. J. Remote Sens. 2018. [Google Scholar] [CrossRef]
  21. Wang, L.; Liu, H.; Su, H.; Wang, J. Bathymetry retrieval from optical images with spatially distributed support vector machines. GISci. Remote Sens. 2018. [Google Scholar] [CrossRef]
  22. McIntyre, M.L.; Naar, D.F.; Carder, K.L.; Donahue, B.T.; Mallinson, D.J. Coastal bathymetry from hyperspectral remote sensing data: Comparisons with high resolution multibeam bathymetry. Marine Geophys. Res. 2006, 27, 128–136. [Google Scholar] [CrossRef]
  23. Lee, Z.; Casey, B.; Arnone, R.; Weidemann, A.; Parsons, R.; Montes, M.J.; Gao, B.C.; Goode, W.; Davis, C.; Dye, J. Water and bottom properties of a coastal environment derived from Hyperion data measured from the EO-1 spacecraft platform. J. Appl. Remote Sens. 2007, 1, 011502. [Google Scholar]
  24. Johnson, L.J. The Underwater Optical Channel. 2012, pp. 1–18. Available online: https://www.researchgate.net/publication/280050464_The_Underwater_Optical_Channel/citation/download (accessed on 15 July 2020).
  25. Gomez, A.R. Spectral reflectance analysis of the Caribbean Sea. Geofís. Int. 2014, 53, 385–398. [Google Scholar] [CrossRef] [Green Version]
  26. NOAA, National Oceanic and Atmospheric Administration (NOAA). Digital Coast Data Access Viewer. Custom processing of 2006 NOAA Bathymetric Lidar: Puerto Rico; NOAA Office for Coastal Management: Charleston, SC, USA, 2006. Available online: https://coast.noaa.gov/dataviewer (accessed on 7 April 2020).
  27. Bauer, L.J.; Edwards, K.; Roberson, K.K.W.; Kendall, M.S.; Tormey, S.; Battista, T. Shallow-Water Benthic Habitats of Southwest Puerto Rico; NOAA Technical Memorandum NOAA NOS NCCOS 155: Silver Spring, MD, USA, 2012.
  28. Breiman, L. Random forests. Mach. Learn. 2001, 45, 5–32. [Google Scholar] [CrossRef] [Green Version]
  29. Diesing, M.; Green, S.L.; Stephens, D.; Lark, R.M.; Stewart, H.A.; Dove, D. Mapping seabed sediments: Comparison of manual, geostatistical, object-based image analysis and machine learning approaches. Cont. Shelf Res. 2014, 84, 107–119. [Google Scholar] [CrossRef] [Green Version]
  30. Zhang, C. Applying data fusion techniques for benthic habitat mapping and monitoring in a coral reef ecosystem. ISPRS J. Photogramm. Remote Sens. 2015, 104, 213–223. [Google Scholar] [CrossRef]
  31. Alevizos, E.; Greinert, J. The hyper-angular cube concept for improving the spatial and acoustic resolution of MBES backscatter angular response analysis. Geosciences 2018, 8, 446. [Google Scholar] [CrossRef] [Green Version]
  32. Sagawa, T.; Yamashita, Y.; Okumura, T.; Yamanokuchi, T. Satellite derived bathymetry using machine learning and multi-temporal satellite images. Remote Sens. 2019, 11, 1155. [Google Scholar] [CrossRef] [Green Version]
  33. King, R.D.; Feng, C.; Sutherland, A. Statlog: Comparison of classification algorithms on large real-world problems. Appl. Artif. Intell. 1995, 9, 289–333. [Google Scholar] [CrossRef]
  34. Imandoust, S.B.; Bolandraftar, M. Application of K-nearest neighbor (KNN) approach for predicting economic events: Theoretical background. Int. J. Eng. Res. Appl. 2013, 3, 605–610. [Google Scholar]
  35. Lucieer, V.; Hill, N.A.; Barrett, N.S.; Nichol, S. Do marine substrates ‘look’ and ‘sound’ the same? Supervised classification of multibeam acoustic data using autonomous underwater vehicle images. Estuar. Coast. Shelf Sci. 2013, 117, 94–106. [Google Scholar] [CrossRef]
  36. Lacharité, M.; Brown, C.J.; Gazzola, V. Multisource multibeam backscatter data: Developing a strategy for the production of benthic habitat maps using semi-automated seafloor classification methods. Mar. Geophys. Res. 2018, 39, 307–322. [Google Scholar] [CrossRef]
  37. Zelada Leon, A.; Huvenne, V.A.; Benoist, N.M.; Ferguson, M.; Bett, B.J.; Wynn, R.B. Assessing the repeatability of automated seafloor classification algorithms, with application in marine protected area monitoring. Remote Sens. 2020, 12, 1572. [Google Scholar] [CrossRef]
  38. Kibele, J.; Shears, N.T. Nonparametric empirical depth regression for bathymetric mapping in coastal waters. IEEE J. Sel. Top. Appl. Earth Obs. Remote Sens. 2016, 9, 5130–5138. [Google Scholar] [CrossRef]
  39. Bierwirth, P.; Burne, R.V. Shallow sea-floor reflectance and water depth derived by unmixing multispectral imagery. Photogramm. Eng. Remote Sens. 1993, 59, 331–338. [Google Scholar]
  40. Caballero, I.; Stump, P.R.; Meredith, A. Preliminary assessment of turbidity and chlorophyll impact on bathymetry derived from Sentinel-2A and Sentinel-3A satellites in South Florida. Remote Sens. 2019, 11, 645. [Google Scholar] [CrossRef] [Green Version]
  41. Lark, R.M.; Dove, D.; Green, S.L.; Richardson, A.E.; Stewart, H.; Stevenson, A. Spatial prediction of seabed sediment texture classes by cokriging from a legacy database of point observations. Sediment. Geol. 2012, 281, 35–49. [Google Scholar] [CrossRef] [Green Version]
  42. Conrad, O.; Bechtel, B.; Bock, M.; Dietrich, H.; Fischer, E.; Gerlitz, L.; Wehberg, J.; Wichmann, V.; Böhner, J. System for Automated Geoscientific Analyses (SAGA) v. 2.1.4. Geosci. Model Dev. 2015, 8, 1991–2007. [Google Scholar] [CrossRef] [Green Version]
  43. Ma, S.; Tao, Z.; Yang, X.; Yu, Y.; Zhou, X.; Li, Z. Bathymetry retrieval from hyperspectral remote sensing data in optical-shallow water. IEEE Trans. Geosci. Remote Sens. 2014, 52, 1205–1212. [Google Scholar] [CrossRef]
  44. Leiper, I.A.; Phinn, S.R.; Roelfsema, C.M.; Joyce, K.E.; Dekker, A.G. Mapping coral reef benthos, substrates, and bathymetry, using compact airborne spectrographic imager (CASI) data. Remote Sens. 2014, 6, 6423–6445. [Google Scholar] [CrossRef] [Green Version]
  45. Lyzenga, D.R.; Malinas, N.P.; Tanis, F.J. Multispectral bathymetry using a simple physically based algorithm. IEEE Trans. Geosci. Remote Sens. 2006, 44, 2251–2259. [Google Scholar] [CrossRef]
Figure 1. Overview of the wider study area displaying subareas PR1 and PR2 corresponding to different Hyperion imagery stripes. Imagery data are overlaid on airborne laser bathymetry.
Remotesensing 12 03489 g001
Figure 2. Schematic diagram of the workflow followed in this study.
Remotesensing 12 03489 g002
Figure 3. Satellite-derived bathymetry from stage 1 using (a) the random forest (RF), (b) the kappa nearest neighbor (kNN), and (c) the multiple linear regression analysis (MLRA) algorithms. PR1: Bathymetric profile comparison and scatterplot between airborne laser bathymetry and SDB using: RF (i,ii); kNN (v,vi) and MLRA (ix,x). PR2: Bathymetric profile comparison and scatterplot between airborne laser bathymetry and SDB using: RF (iii,iv); kNN (vii,viii) and MLRA (xi,xii).
Remotesensing 12 03489 g003
Figure 4. Training data points for both sub-areas PR1: (a–c) and PR2: (d–f) with residual depth values resulting from RF (a,d), kNN (b,e), and MLRA (c,f).
Remotesensing 12 03489 g004
Figure 5. Box-plots of seafloor-type classes and bathymetry residuals from each resulting satellite-derived bathymetry (SDB) using (a) RF, (b) kNN, and (c) MLRA. Seafloor types available only for PR2 [27].
Remotesensing 12 03489 g005
Figure 6. Satellite-derived bathymetry from stage 2 using (a) the RF algorithm and (b) the kNN algorithm. PR1: Bathymetric profile comparison and scatterplot between airborne laser bathymetry and stage 2 SDB using RF (i,ii) and kNN (v,vi). PR2: Bathymetric profile comparison and scatterplot between airborne laser bathymetry and stage 2 SDB using RF (iii,iv) and kNN (vii,viii).
Remotesensing 12 03489 g006
Table 1. Hyperion data details.
Product NameAcquisition Date/TimeBand SubsetSub-Area
EO1H0050472011264110TE_1R21-Sep-2011/14:20 UTC B011-B025 PR1
EO1H0050472013022110T5_1R22-Jan-2013/14:34 UTC B011-B025 PR2
Table 2. Bathymetry prediction accuracy (RMSE and correlation coefficient R2 with reference bathymetry) for stage 1.
STAGE 1Predictors: Band Ratios
AreaDepth RangeRFkNNMLRA
PR10–25 mRMSE: 1.9 m
R2: 0.85
RMSE: 2.1 m
R2: 0.79
RMSE: 2.4 m
R2: 0.91
PR20–25 mRMSE: 2.3 m
R2: 0.88
RMSE: 2.4 m
R2: 0.87
RMSE: 2.2 m
R2: 0.89
Table 3. Bathymetry prediction accuracy (RMSE and correlation coefficient R2 with reference bathymetry) for stage 2.
STAGE 2Predictors: SDB from Stage 1 and Residuals
AreaDepth RangeRFkNN
PR10–25 mRMSE: 1.1 m
R2: 0.95
RMSE: 1.2 m
R2: 0.94
PR20–25 mRMSE: 1.1 m
R2: 0.89
RMSE: 1.8 m
R2: 0.92
Publisher’s Note: MDPI stays neutral with regard to jurisdictional claims in published maps and institutional affiliations.