Technical Note

Controls of Climate and Land-Use Change on Terrestrial Net Primary Productivity Variation in a Subtropical Humid Basin

1
Chongqing Key Laboratory of Karst Environment & School of Geographical Sciences, Southwest University, Chongqing 400715, China
2
Department of Geosciences, University of Oslo, N-0316 Oslo, Norway
*
Author to whom correspondence should be addressed.
Remote Sens. 2020, 12(21), 3525; https://doi.org/10.3390/rs12213525
Submission received: 26 September 2020 / Revised: 21 October 2020 / Accepted: 27 October 2020 / Published: 28 October 2020

Abstract

:
Knowledge of vegetation dynamics in relation to climatic changes and human activities is essential for addressing the terrestrial carbon cycle in the context of global warming. Scientific detection and quantitative attribution of vegetation dynamic changes in different climatic zones and human activities are the focus and challenge of the relevant research. Taking the Poyang Lake basin as the research area, this study aimed to reveal how climate and land use drive changes in net primary productivity (NPP) in the subtropical humid basin. Change patterns of vegetation NPP and their relationships with meteorological factors across the basin were first investigated based on the estimation of 18 year (2000–2017 year) NPP by using a typical light energy utilization model, the Carnegie-Ames-Stanford Approach (CASA) model. Quantitative analysis was then conducted to explicitly distinguish the driving effects of climate change and land-use change on NPP dynamics in two different periods. Results show that annual NPP and total production (TP) of the Poyang Lake basin increased significantly from 2000 to 2017. During this period, land-use change in the basin was driven by the process of urbanization expansion and the efforts of ecological protection. Climatically, the temperature is the major influencing climatic factor in determining vegetation productivity in the subtropical humid basin, followed by precipitation and solar radiation. In addition, our investigation also revealed that with comparison to the period of 2000s, the increased TP of the Poyang Lake basin due to climate change in 2010s was much bigger than the decreased TP due to land-use change. However, in the areas where the land-use change occurred, the decreased TP was mainly attributed to the impact of land-use change, even though climate change showed a positive effect of increasing productivity.

1. Introduction

The terrestrial ecosystem, which links the land and atmosphere, can well reflect and elaborate the energy exchange, carbon cycle, and the effect of human activities on the earth’s surface [1,2,3]. The net primary productivity (NPP) of the terrestrial ecosystem refers to the remaining fraction of absorbed carbon by vegetation through photosynthesis in unit time after the carbon loss of plant respiration. It is a fundamental indicator of ecosystem health and productivity, which is of great significance in determining the carbon source/sink function of the ecosystem and regulating the ecological process [4]. Studies on NPP variation of the terrestrial ecosystem is critical to the acknowledgment of carbon balance [5,6]. However, at present, there is still a lack of clear understanding of the driving factors on NPP change in different regions [7]. As a key link of the biogeochemical carbon cycle, the spatial and temporal variations of NPP are determined by the complex interactions among vegetation, soil, and atmosphere, and strongly influenced by human activities and global environmental changes [8,9,10]. In the context of global change, estimation of NPP and in-depth understanding of the relationship between NPP and various control factors are of great significance to acknowledge the temporal and spatial pattern of carbon source/sink in the terrestrial ecosystem, and to correctly predict future climate change. In recent years, research on the dynamics of the terrestrial ecosystem represented by NPP has received increasing attention from the scientific community [11,12,13].
Because of the importance of vegetation NPP in the terrestrial carbon cycle, an accurate estimation of vegetation NPP is essential. Because it is impossible to measure the regional NPP comprehensively on a large scale, the indirect estimation of vegetation NPP based on relevant models has been widely used in regional or global studies. In recent years, a series of remote-sensing-based NPP estimation models have emerged, which brought new vitality for regional and global scale NPP estimation and related applied research. Generally, the NPP estimation models can be categorized into four types [14]: climate-related statistical models (e.g., Miami, Thornthwaite Memorial, and Chikugo), ecosystem process models (e.g., BIOME-BGC, BEPS, etc.), light energy utilization models (e.g., GLO-PEM, Carnegie-Ames-Stanford Approach (CASA), etc.) and ecological and remote sensing coupling models (e.g., GLOPEM-CEVSA). Among them, the CASA (Carnegie-Ames-Stanford Approach) model was considered to be one of the most recognized mature models for NPP estimation. The model is easy to master and requires few parameters. Because most of the parameters can be obtained by remote sensing technology, the model can achieve continuous simulation of vegetation NPP in time and space [15,16,17]. Up to now, the CASA model has been widely applied in NPP estimation in different regions and scales due to its convenient application and high accuracy [17,18,19,20].
The process of vegetation dynamics is quite complicated due to the interaction of various influencing factors, such as the changes of climatic variables and underlying land use/cover, the construction of ecological engineering, the expansion of urbanization, and so on [10,21,22,23]. DeJong et al. [24] pointed out that climate change can only explain about 54% of the changes in vegetation activity in recent decades, and the rest may be attributed to human activities. How climate change and land use/cover change affect the carbon cycle of the terrestrial ecosystem has become one of the core issues in the research of global change [21,25,26,27]. Meteorological factors determine the regional hydrothermal conditions, which directly affect vegetation growth [28]. Previous studies revealed that temperature shows a positive correlation with vegetation growth [29], while the effect of precipitation varies with the wetness of the area [30]. In arid and semi-arid regions, vegetation growth is mainly controlled by precipitation, and the influence of temperature and radiation is relatively weak [10,31,32]. The effects of climatic factors on the NPP of different vegetation types varied significantly in time and space [10,20,33]. In terms of mechanism, the effect of climate change on ecosystem productivity is mainly realized by affecting the processes of photosynthesis, respiration, and decomposition of soil organic carbon [34,35]. On the other hand, land use/cover of the earth’s surface changed a lot in some places due to the rapid growth of population and urbanization process, especially in those developing countries. The change of land use/cover will alter the type and structure of the ecosystem, thus affect vegetation productivity significantly. Over the past two centuries, a study revealed that the potential photosynthetic capacity of the earth’s ecosystems has decreased by 5% due to the changes in land use/cover [36]. In the United States, land-use change in the process of urbanization has caused a carbon loss of 0.04 Pg C·a−1 [37]. In the urban areas of the Yangtze River Delta, China, the urbanization process has caused a −4.7 gC·m−2·a−1 decrease during 1999−2010 [38]. In addition, Jiang et al. [39] revealed that the NPP of the Guangdong Province, one of the most developed provinces in China, has lost 1.05 Tg C during 2000−2010 due to land use transformation. Xu et al. [40] showed that NPP in the resettlement area of the Three Gorges project decreased by 8% in 2000−2010, and the main driving mechanism was land-use change.
The change in vegetation NPP is mainly driven by climate and human activities. Scientific assessment of the relative impacts of the two forces is helpful to the understanding of the human influence on ecosystems [38,41,42]. However, due to the complexity of potential interactions, the estimation and separation of the relative contributions of the driving factors in NPP variation are quite difficult [38,43]. In addition, land vegetation and meteorological variables vary greatly in different years and the indicators used for the contribution separation are various and uneven, which also leads to the lack of well-established procedures for the quantitative analysis [44,45]. In general, three methods can achieve the quantified attribution analysis on NPP variation: the regression model, the residual trend analysis, and the biophysical model. In the first method, the quantified attribution analysis was mainly based on the establishment of the regression model between vegetation NPP and the potential driving factors [46,47]. The second method indirectly estimates the impact of human activities (normally land-use change) by simulating NPP differences under the scenarios with and without human interference [48]. The third method is usually based on the estimated potential NPP and the actual NPP by biophysical models to determine the relative impacts of climate change and human activities [10,38]. Recently, Jiang et al. [39] adopted the threshold segmentation method to evaluate the relative contribution of climate change and ecological programs on NPP changes in the agro-pastoral transitional zone of northern China. The threshold segmentation method is based on the statistical correlation analysis. Although it can distinguish the main factors affecting NPP change, it cannot reveal the quantitative result of the contribution rate of climate change and human activities. It is worth noting that each method has its advantages and disadvantages, which need to be carefully considered in practical application. In addition, climate change may also have a certain impact on NPP dynamics in those areas where land-use change occurs. However, there are still many deficiencies in relevant methods in quantifying the impact of climate change and human activities on NPP dynamics in those land-use change areas.
Knowledge of vegetation dynamics related to climatic changes and human activities is very important for developing adaptation strategies to cope with the challenges posed by climatic changes and human activities on ecosystems. Previously, much research has been performed to investigate vegetation dynamics and its driving mechanism in those arid and semi-arid areas, as well as in those ecologically fragile areas [10,31,48,49]; however, studies on elucidating climate-oriented and human-oriented NPP variations in typical humid areas were rare. Furthermore, land-use change is quite common in those developing countries due to rapid urbanization and population growth. Attribution analysis of vegetation dynamic change will promote the management of local landscape under the changing environment. Associated with this background, this study focuses on the vegetation NPP dynamics and responses to climatic factors and human activities in a subtropical basin. Specifically, the objectives of this study were: (1) to estimate vegetation NPP by using the CASA model and analyze its spatiotemporal variations in recent two decades in a large lake basin, (2) to examine land-use change and its link with NPP variation under the background of urbanization, (3) to explore the correlations between vegetation NPP and meteorological factors in the subtropical humid area, and (4) to quantify the relative impacts of climate and land-use changes on NPP variation at the basin scale. We believe that this study will improve the understanding of the driving mechanism of the terrestrial ecosystem carbon cycle in subtropical humid areas, and promote the management of local landscape under the changing environment.

2. Material and Methods
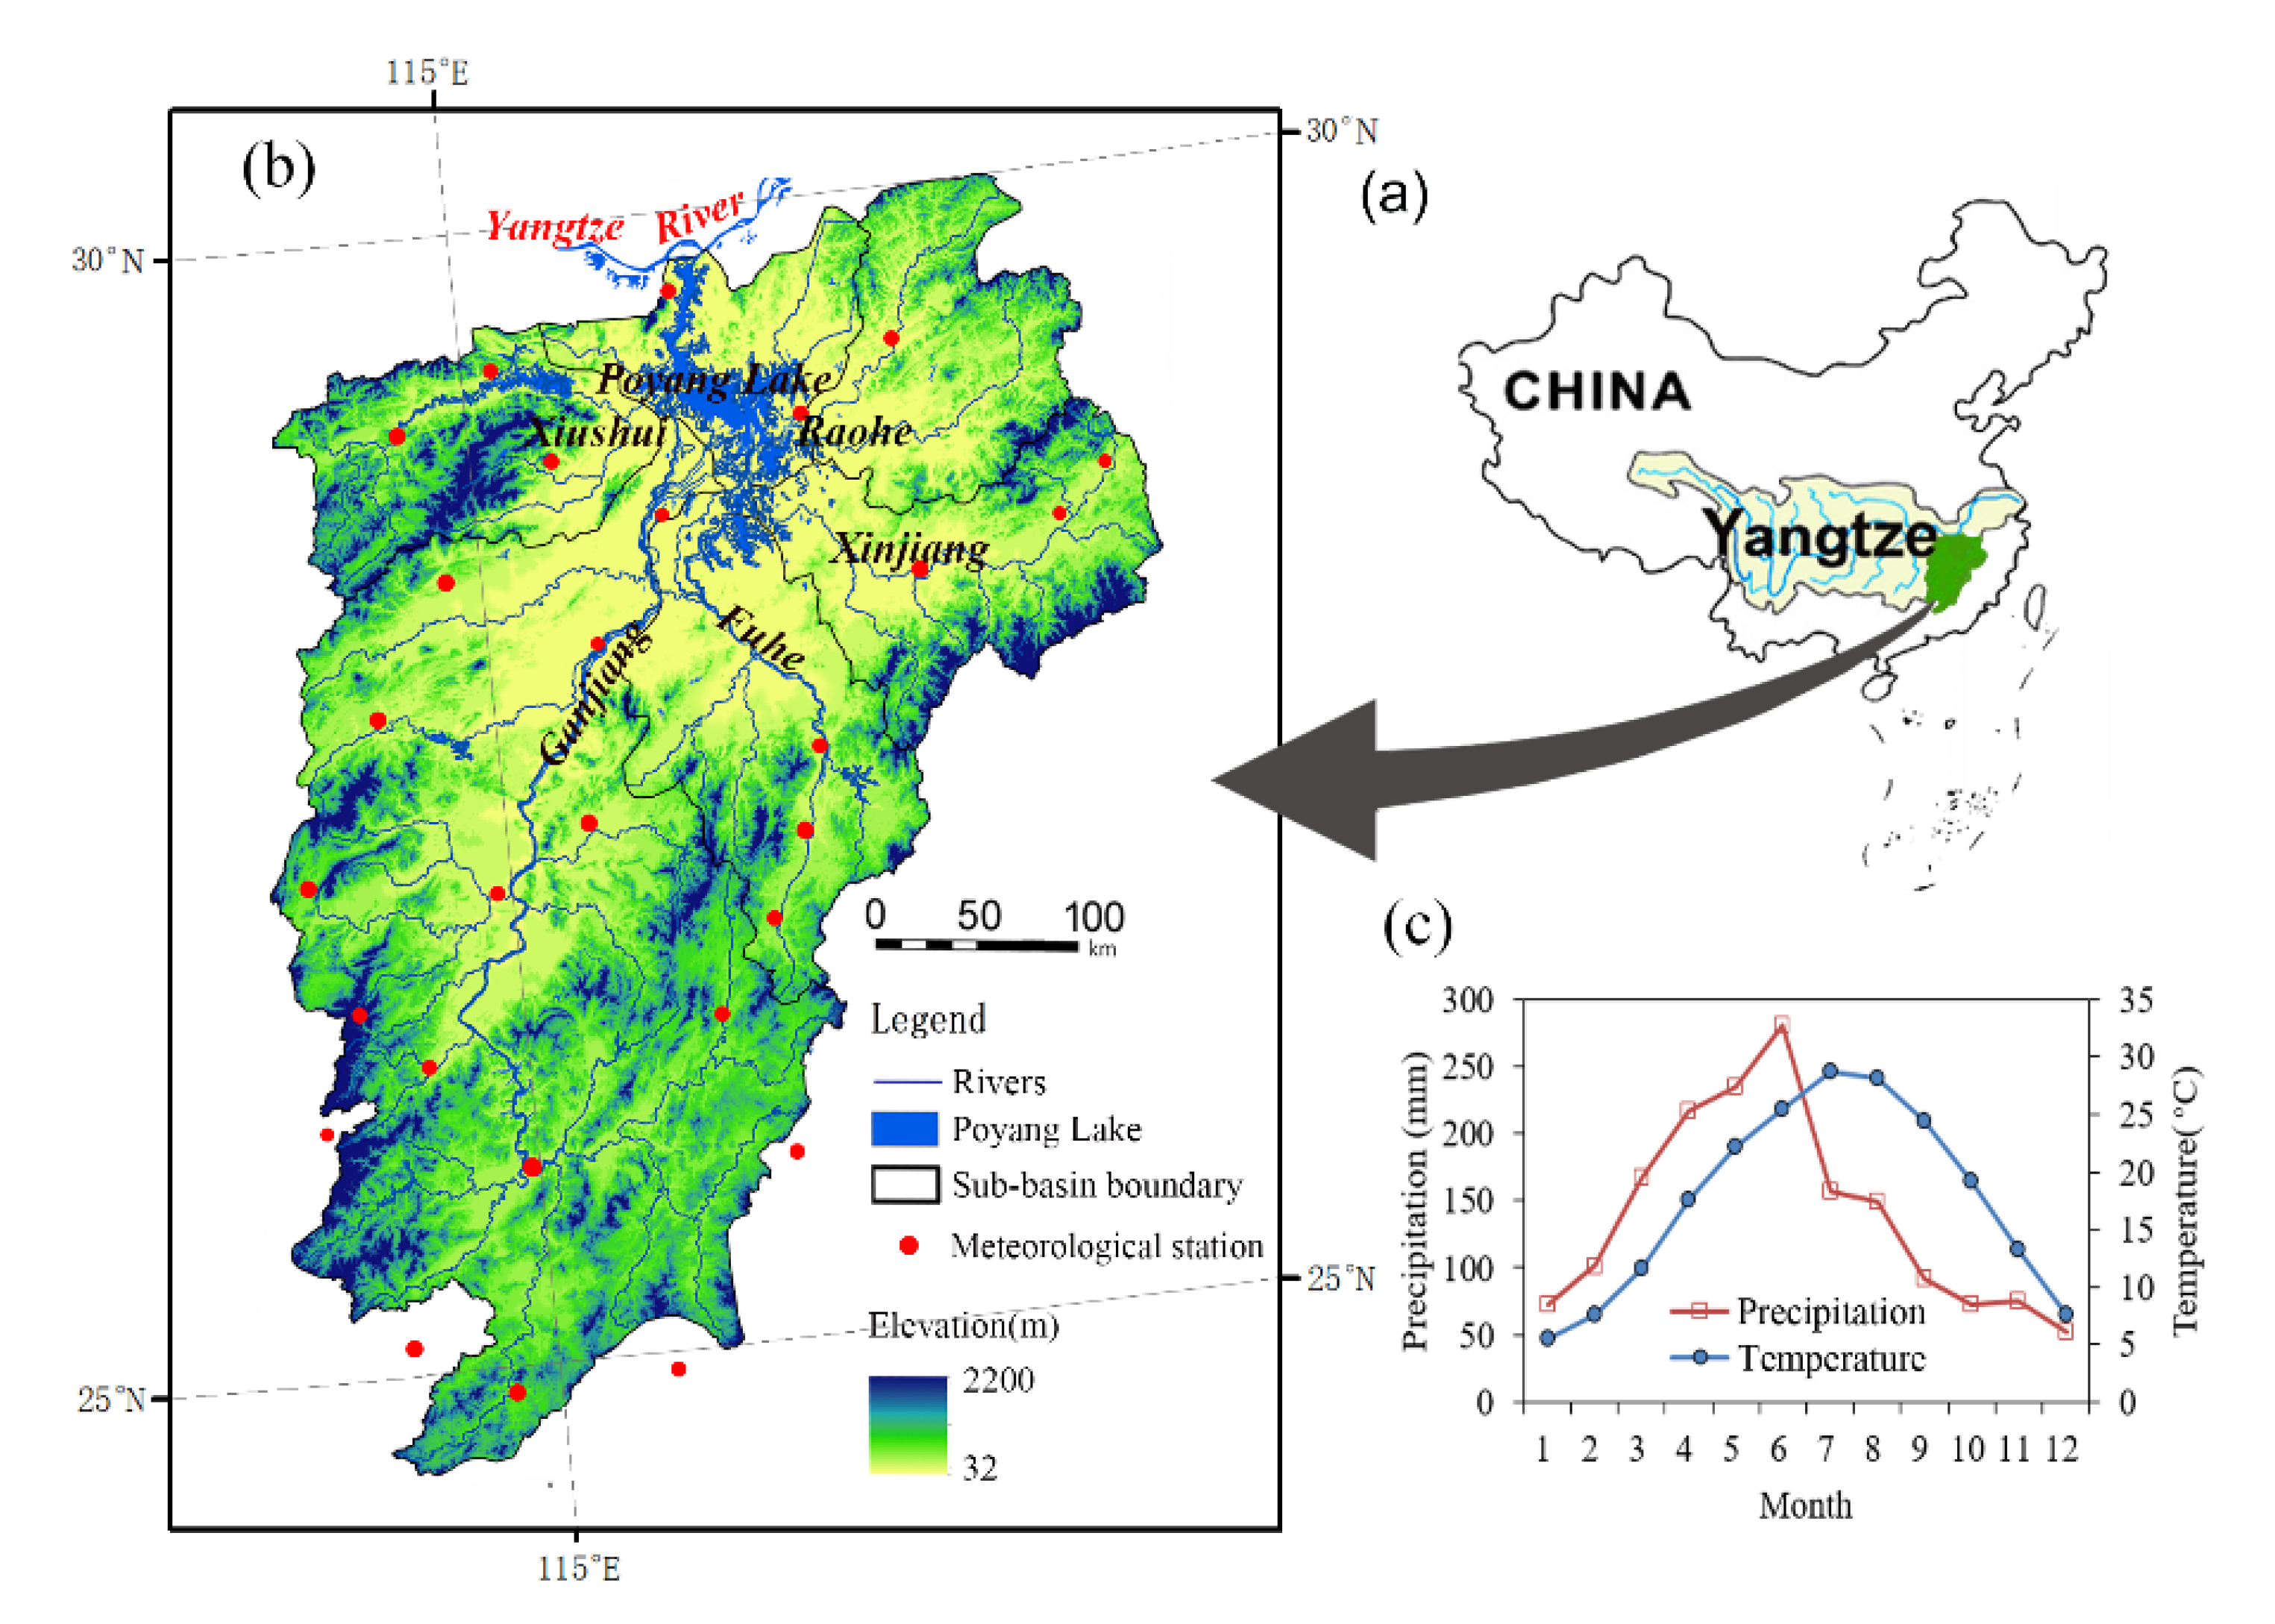
2.1. Study Area

In this study, the Poyang Lake basin was selected as the research area. The lake basin, located in the southeast of the Yangtze River basin (Figure 1a), is very representative in China’s humid region due to the “mountain–river–lake” integrated watershed system and special climate, geomorphology, and hydrological characteristics [50]. In addition, the lake basin is one of the 17 global key research transects of the Global Change and Terrestrial Ecosystem program (GCTE) of the International Geosphere Biosphere Program (IGBP), which has special significance to the study of terrestrial ecosystem dynamics associated with global change [51].
The Poyang Lake basin is surrounded by middle and low mountains in the south, east, and west, and tilts northward [52]. The drainage area of the basin is about 162,225 km2. The water system of the basin is mainly composed by five tributary sub-basins of Xiushui, Raohe, Xinjiang, Fuhe, and Ganjiang (Figure 1b). Poyang Lake in the north is the largest freshwater lake in China. The “Five Rivers” gather precipitation of the surrounding mountains from the east, south, and west to the relatively low-lying Poyang Lake area in the north, and finally discharges into the Yangtze River at the north end of the basin after being regulated and stored by the lake, forming an integrated basin system of “mountain–river–lake”. Climatically, the Poyang Lake basin is located in the subtropical monsoon climate zone. The average annual precipitation of the basin is about 1680 mm and the average annual temperature is about 17.6 °C (Figure 1c). Benefitting from good hydrothermal conditions, the Poyang Lake basin is rich in natural resources and with a diverse ecosystem (including farmland, forest, wetland, and other ecosystems) [50,53].

2.2. Available Data

The MODIS (Moderate-resolution Imaging Spectroradiometer) normalized difference vegetation index (NDVI) remote sensing data covering the study area during 2000–2017 were collected from NASA (https://modis.gsfc.nasa.gov/data/dataprod). The spatial resolution of the data is 1 km, and the time resolution is 16 days. All the NDVI data were preprocessed by geometric correction, radiation correction, and cloud removal before delivery. Before application, we applied the ENVI (The Environment for Visualizing Images) software to synthesize the NDVI data and the changing-weight filter method to reduce noise [54]. In addition, we used MRT (MODIS Reprojection Tool) to convert the image format and projection.
Meteorological datasets (including daily precipitation, temperature, and solar radiation) during 2000–2017 from 25 weather stations around the Poyang Lake basin were obtained from the National Climate Centre of China Meteorological Administration (CMA) (https://cmdp.ncc-cma.net/cn/index.htm). All the datasets have undergone strict quality control, and the time series are complete without any missing data. To match the spatial resolution of the NDVI data, we used the Kriging method to interpolate meteorological variables.
Two scenarios of land use data of the basin in 2005 and 2015 with a spatial resolution of 1 km were downloaded from the Resource and Environment Science and Data Center of the Chinese Academy of Sciences (http://www.resdc.cn/). The accuracy of the data was well examined by on-site verification before delivery [55]. According to the secondary classification criteria of LUCC (Land use/cover change), surface vegetation in the Poyang Lake basin was divided into seven categories: paddy field (PF), dry farmland (DF), forest (FT), shrub (SB), sparse forest (SF), grassland (GL), and water and construction land (WC) (see Figure 1).

2.3. Methodology

2.3.1. CASA Model

The CASA model, a typical light energy utilization model, was applied to estimate vegetation NPP in the Poyang Lake basin. The establishment of the model is based on the resource balance theory and is driven by meteorological, vegetation, and soil data [56]. In this model, vegetation NPP is mainly determined by two factors of absorbed photosynthetic active radiation ( APAR ) and actual light use efficiency ( ε ):
NPP ( i , t ) = APAR ( i , t ) × ε ( i , t )
where i is spatial location and t is time.
In the above equation, APAR ( i , t ) and ε ( i , t ) are further estimated by the following equations:
APAR ( i , t ) = S r ( i , t ) × FPAR ( i , t ) × 0.5
ε ( i , t ) = T ε 1 ( i , t ) × T ε 2 ( i , t ) × W ε ( i , t ) × ε m a x
In Equation (2), S r is the total solar radiation (MJ/m2) and FPAR is the fraction of photosynthetically active radiation which depends on land use type and coverage. Because NDVI can well reflect the vegetation coverage, the CASA model uses NDVI instead of FPAR in NPP estimation. T ε 1 and T ε 2 in Equation (3) represent the effect of temperature on ( ε ), W ε represents the effect of water stress on ( ε ), and ε m a x is the maximum light use efficiency. The constant 0.5 represents the proportion of solar radiation utilized by vegetation to total solar radiation. More details about the principle, structure, and calculation process of the CASA model can be found in Potter et al. [56].
In the CASA model, ε m a x is the most critical parameter affecting the estimation accuracy. A previous study from Potter et al. [54] demonstrated that average ε m a x of global vegetation is 0.389; however, ε m a x varies significantly in different vegetation types across the world. Based on measured vegetation NPP data and the CASA model, Zhu et al. [20] conducted a systematical analysis on ε m a x of different vegetation types (such as forest, shrub, meadow, cultivated land, swamp, etc.), and finally obtained the ε m a x of typical vegetation types in China. Due to the lack of measured biomass data, in this study, we directly followed the ε m a x values of different land-use types in Zhu et al. [20]: 0.542 for paddy field and dry farmland, 0.985 for forest land, 0.429 for shrubland, 0.475 for sparse forest land, and 0.542 for grassland.
Changes in land use are a continuous event in space and time; however, due to limited two scenarios of land use data, the following hypothesis was made: the calculated NPP of the Poyang Lake basin during 2000–2009 (2000s) was based on the land-use scenario in 2005, whereas the calculated NPP during 2010–2017 (2010s) was based on the land-use scenario in 2015.

2.3.2. Linear Regression Analysis

A simple linear regression model was used to detect the change rate of annual NPP during 2000–2017. The form of the linear regression equation is given as follows:
y = α t + b
where α is the slope of the line which estimates the change rate of annual NPP, b represents the intercept, t is the time and y is annual NPP from 2000 to 2017. In the above equation, the slope of α was obtained by the least-squares fitting. The change rate can be positive ( α > 0) or negative ( α < 0) to indicate increasing or decreasing linear trends of NPP. The significance of the trend was further evaluated by the Mann–Kendall test [57,58].

2.3.3. Correlation Analysis

Pearson correlation coefficient (R) was used to measure the degree of correlation between the two variables. The calculation formula of R is as follows:
R X Y = i = 1 n [ ( X i X ¯ ) × ( Y i Y ¯ ) ] i = 1 n ( X i X ¯ ) 2 i = 1 n ( Y i Y ¯ ) 2
where n is the number of years (in this study, n = 18); R X Y is the Pearson correlation coefficient of the two variables X and Y; X i and Y i are the values of X, Y series in the i-year. X ¯ and Y ¯ are the mean value of the two variables during the study period.
The value of R x y is between −1 and 1 The greater the absolute value of R x y , the stronger the correlation. The significance of the correlation was evaluated by the critical values of α = 0.468 (p < 0.05) and α = 0.590 (p < 0.01) based on t-test. That is, the correlation is significant at the 0.05 significance level if | R x y | ≥ 0.468 and at the 0.01 significance level if | R x y | ≥ 0.590. A meteorological factor is considered to be the limiting factor for the NPP variation if the correlation between NPP and the meteorological factor is significant. In this study, the Pearson correlation coefficient (R) and significance level (p < 0.05) between NPP and the three meteorological factors were estimated on annual and pixel scales with the Matlab software.

2.3.4. Estimation of the Impacts of Climate and Land Use Changes

Vegetation NPP is the production per unit of the terrestrial area. Therefore, total production (TP) can be calculated as:
TP = A × N P P
where A is area.
The change of TP in two different periods can be considered as:
TP = T P 2 T P 1 = A 2 × N P P 2 A 1 × N P P 1
Because A 2 = A 1 + A and N P P 2 = N P P 1 + N P P , then the above equation becomes
TP = ( A 1 + A ) × ( N P P 1 + N P P ) A 1 × N P P 1 = A 1 × N P P + A × N P P 1 + A × N P P
The subscripts in the above equations mean corresponding values in two different periods.
It is obvious that the right side of the above equation consists of three terms: A 1 × N P P , A × N P P 1 and A × N P P . Regarding the first period, TP is the sum of the NPP change-induced term plus the area change-induced term plus an interaction term. In the perspective of driving factors, the first term refers to climate change, the second term refers to land-use change, and the third one refers to the interaction between climate change and land use.
According to the above analysis, the relative contribution of the three terms to the change of TP (i.e., TP ) can be calculated as:
η c l i m = A 1 × N P P | TP | × 100 %
η l a n d = A × N P P 1 | TP | × 100 %
η i n t e r a c t = A × N P P | TP | × 100 %
where η c l i m , η l a n d and η i n t e r a c t are the contribution rates of climate change, land-use change, and the interaction term, respectively; | TP | expresses the absolute value of TP .

3. Results

3.1. Changes of NPP

Figure 2 presents the spatial distribution and linear trend of vegetation NPP across the Poyang Lake basin during 2000–2017. Spatially, NPP is high in the surrounding mountains, such as the southern of the Ganjing sub-basin, the eastern of the Raohe sub-basin, and the south of the Xinjiang sub-basin (Figure 2a). Low NPP areas are mainly distributed in those river alluvial plains. Especially, NPP is commonly low in the areas centered by the lakeside floodplain of the Poyang Lake (Figure 2a). Statistical results indicate that the average NPP of vegetated land in the Poyang Lake basin was 741.10 gC·m−2 with a maximum value of 1249 gC·m−2. Vegetation NPP in 35% area of the basin was ranged in 400–600 gC·m−2, and 28% area was ranged in 1100–1200 gC·m−2.
The results seen in Figure 2b indicates that the linear change rate of NPP across the Poyang Lake basin was ranged from −53.83 to 41.09 gC·m−2·a−1. The areas with increasing NPP were mainly distributed in the center and south of the Ganjiang sub-basin and north of the Xiushui sub-basin. In contrast, the areas with decreasing NPP were scattered in the lower alluvial plains of main tributary rivers, especially in the Ganjiang and Fuhe sub-basins. The statistical result indicates that NPP in 92% of the basin showed an increasing trend (slope > 0), while only 8% of the basin showed a decreasing trend (slope < 0). This result demonstrates that the overall status of land vegetation in the Poyang Lake basin is getting better over the past two decades.
For the whole basin, the average annual total production was 109.43 T gC. Over the past 18 years, both NPP and TP of the basin increased significantly (p < 0.05) (Figure 3). The linear change rate was about 5.49 gC·m−2·a−1 for NPP, and 0.85 T gC·a−1 for TP. The results in Figure 3 also indicate that both NPP and TP showed an obvious inter-annual fluctuation before 2012 and then turned to a monotonous increase after that year.

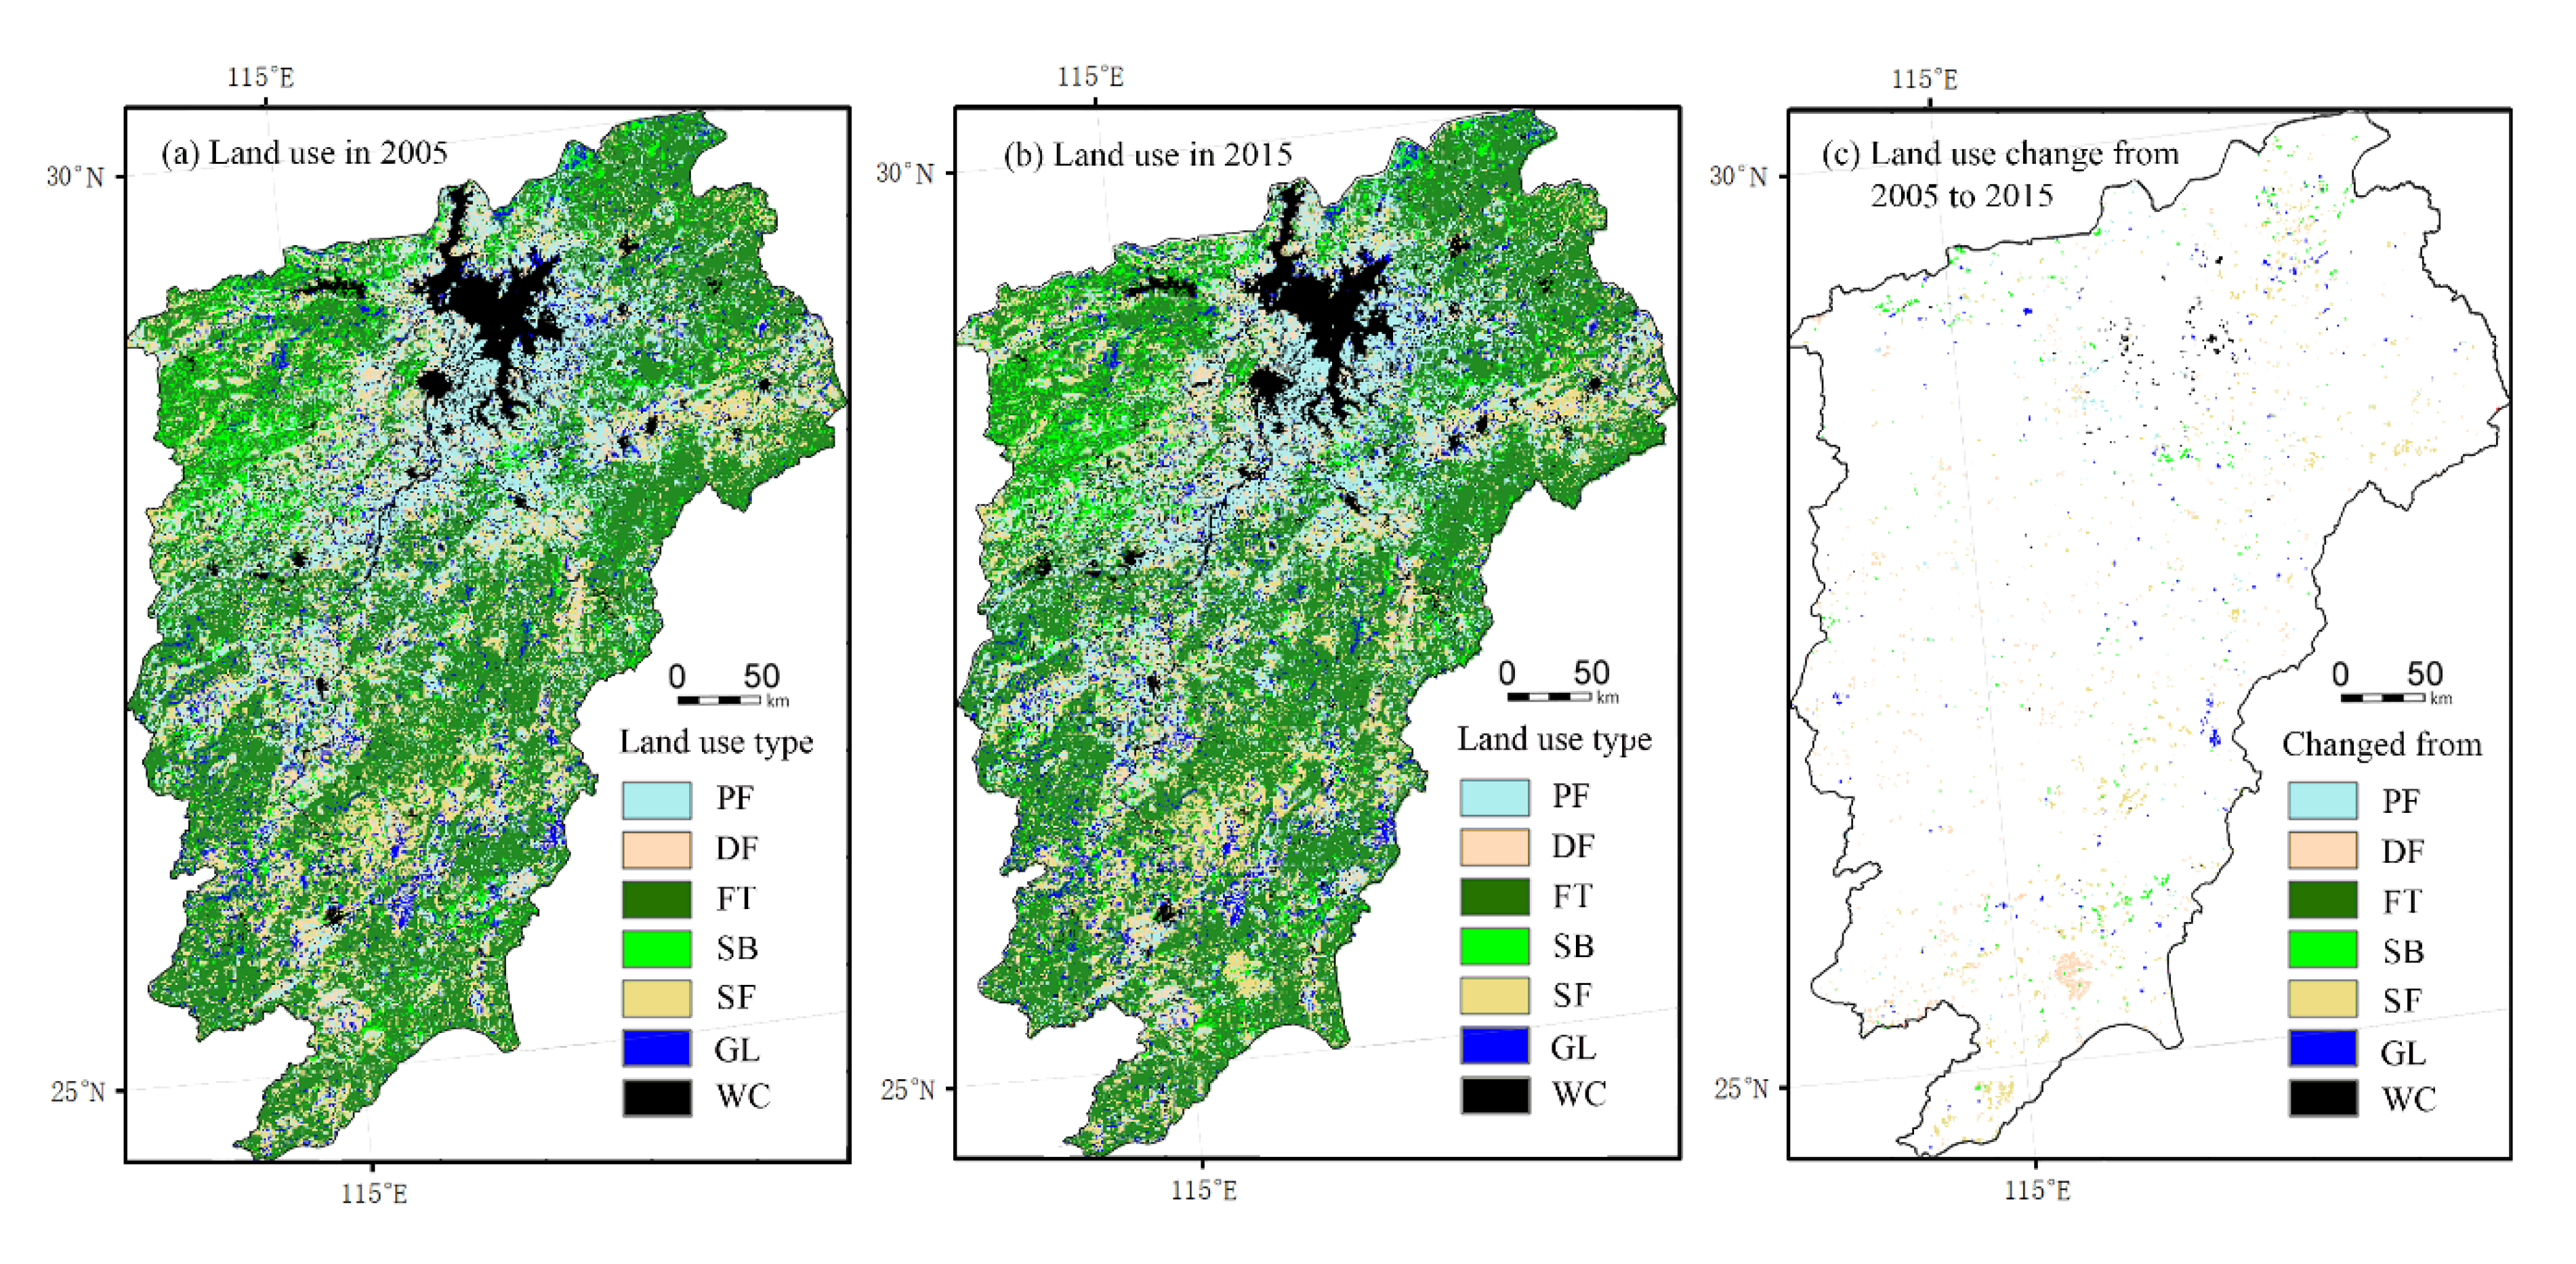
3.2. Changes of Land Use and Npp in Two Different Periods

Figure 4 displays the spatial distribution and changes of the two land-use scenarios in 2005 and 2015 across the Poyang Lake basin. The figure shows that land-use change in the basin mainly occurred in the area around the floodplain of Poyang Lake and the mountainous area in the south of the Ganjiang sub-basin (Figure 4c). The total land-use change area was about 4800 km2, accounting for 3% of the whole Poyang Lake basin. Specific land use transfer matrix from 2005 to 2015 was listed in Table 1. From which, complex mutual transformation among land-use types can be observed. Land use types with decreased area mainly include the cultivated land (PF and DF), shrub (SB), and sparse forest (SF). The area of construction land (WC), forest land (FT), and grassland (GL) has increased. All the land use types have been transformed into construction land in a certain area. Particularly, the area of cultivated land transferred to construction land is very obvious. In addition, the mutual transformation between forest (FT) and sparse forest (SF) was relatively prominent. In general, the characteristics of land-use change in the Poyang Lake basin during the past two decades are the remarkable increase of construction land (WC) and forest (FT), and the decrease of other land-use types.
Compared with the land-use change that only occurred in certain areas, vegetation NPP has changed with varying degrees across the entire basin during the past two decades. The results in Figure 5 indicate that an increasing trend of vegetation NPP can be observed in most areas of the basin. The areas where NPP declined were sparsely distributed in the middle-lower alluvial plains of the five tributaries and around the major cities across the lake basin (Figure 5c).

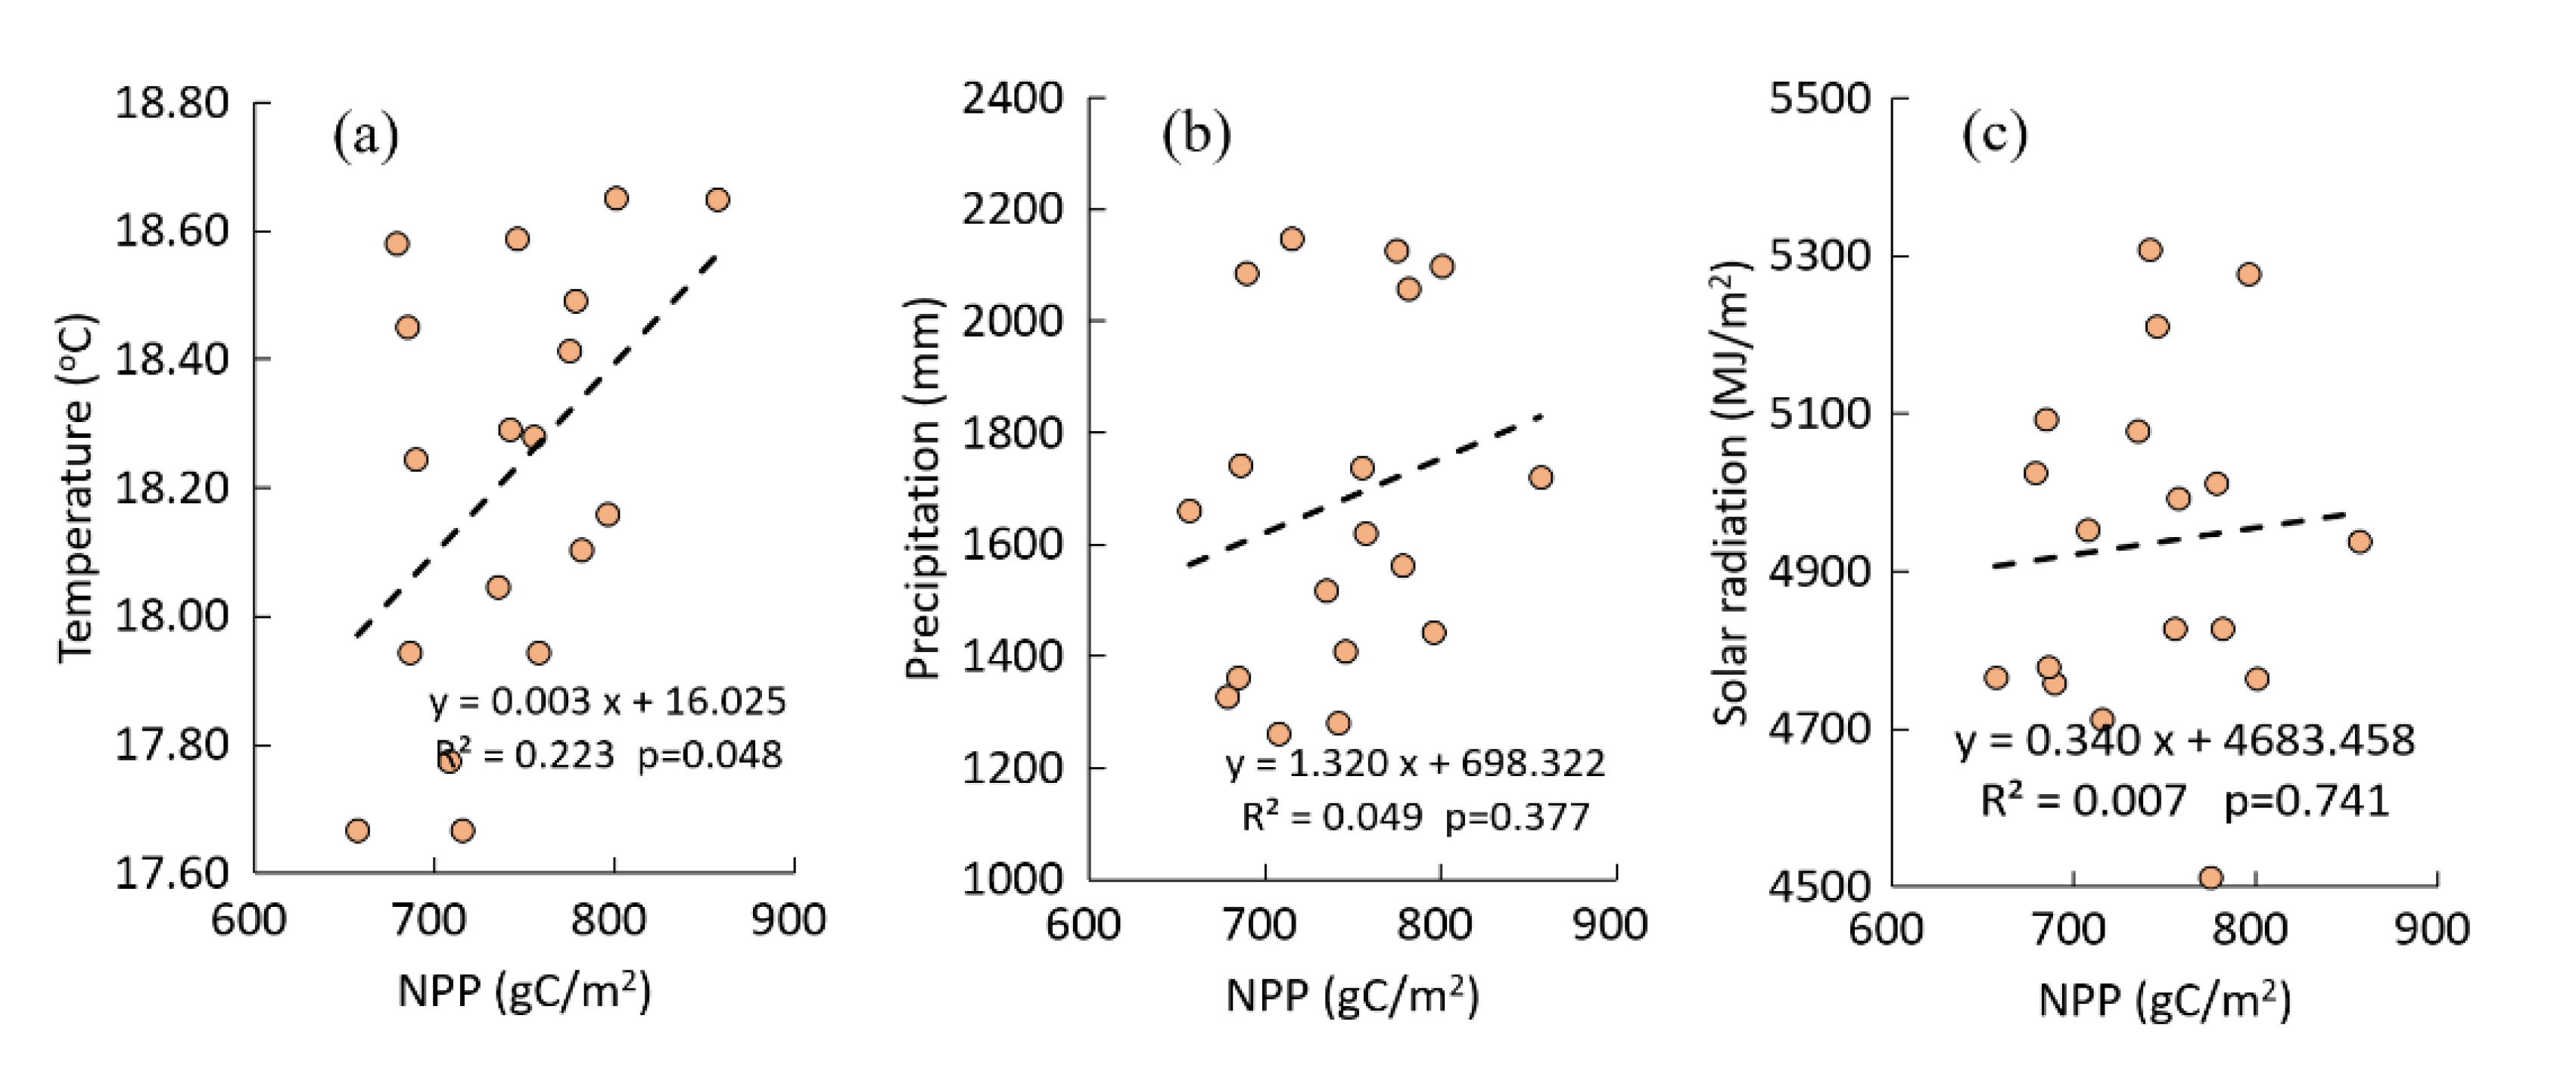
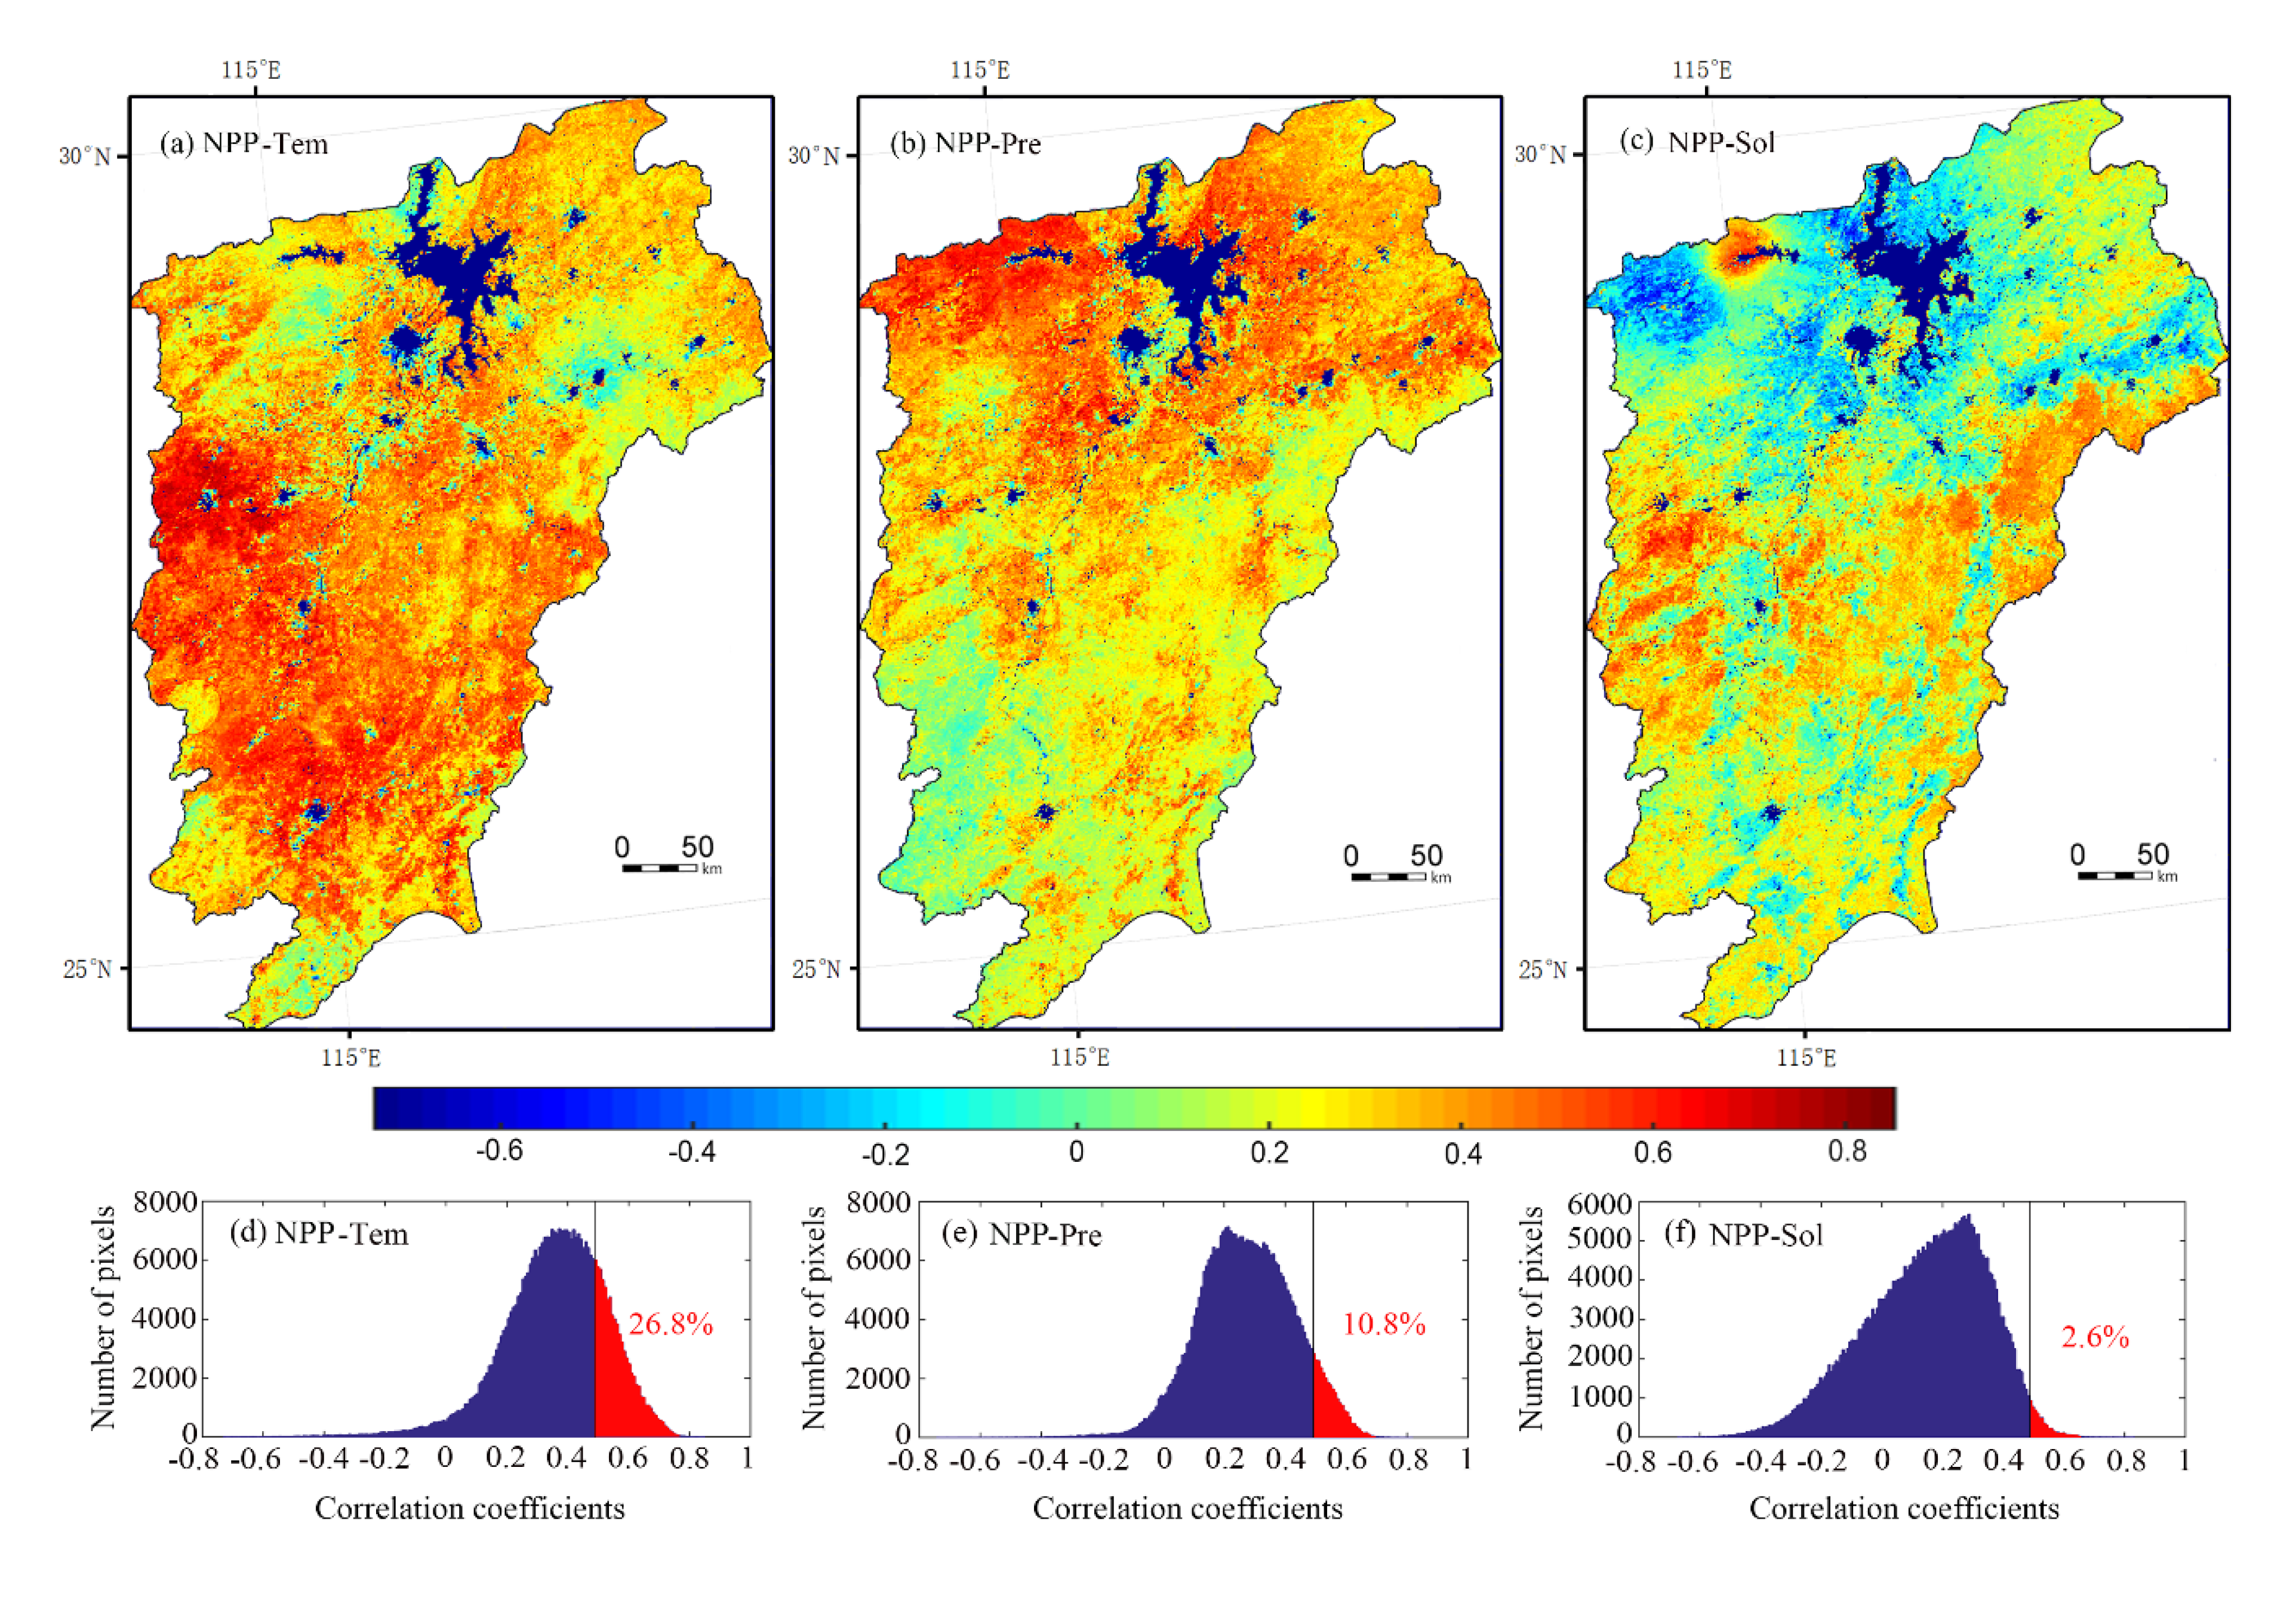
3.3. Correlations between NPP and Meteorological Factors

The calculation results show that the three major meteorological factors of temperature, precipitation, and total solar radiation showed different trends from 2000 to 2017, with linear change rates of 0.03 °C·a−1 (p < 0.05), 14.43 mm·a−1, and –8.23 MJ/m2·a−1, respectively. At the basin scale, NPP in the Poyang Lake basin was positively correlated with all three meteorological factors, and the correlation coefficients were 0.472 (p < 0.05), 0.221, and 0.084, respectively (Figure 6). However, only the correlation between NPP and temperature is significant.
Figure 7 shows the spatial distribution and statistical results of the correlation coefficients between NPP and major meteorological factors. It can be seen from the figure that the spatial distribution characteristics of correlation coefficients between NPP and the three meteorological factors across the basin are quite different. The correlation coefficient between NPP and temperature is higher in the center and south parts of the basin (Figure 7a). However, the opposite distribution can be observed for the correlation coefficient between NPP and precipitation (Figure 7b). For solar radiation, higher correlation coefficients are sparsely distributed in the middle strip of the basin (Figure 7c). The proportion of the area with positive correlations for annual temperature was 97.1% of the whole region, and for annual precipitation accounted for 96.3%, and annual solar radiation accounted for 76.3%. Statistical results further indicate that the area where NPP showed significant positive correlations with temperature, precipitation, and solar radiation accounts for 26.8%, 10.8%, and 2.6% of the whole basin, respectively (Figure 7d–f).
To better reflect the impacts of climatic changes on vegetation NPP, we used Maxwell color triangles to synthesize a map about significant correlations between NPP and the three meteorological factors (Figure 8). From visual inspection, the annual temperature had the widest effect on the vegetation NPP in the Poyang Lake basin. In addition, the figure indicates that NPP in some areas was significantly correlated with more than two meteorological factors simultaneously (Figure 8b–d), and the area accounts for about 1.8% of the basin. Considering the superposition of the three meteorological factors, the area where NPP has the strongest significant correlation with temperature accounts for 26.1% of the basin. The area where NPP has the strongest significant correlation with precipitation was about 10.4%, while this for solar radiation was only 1.9%.

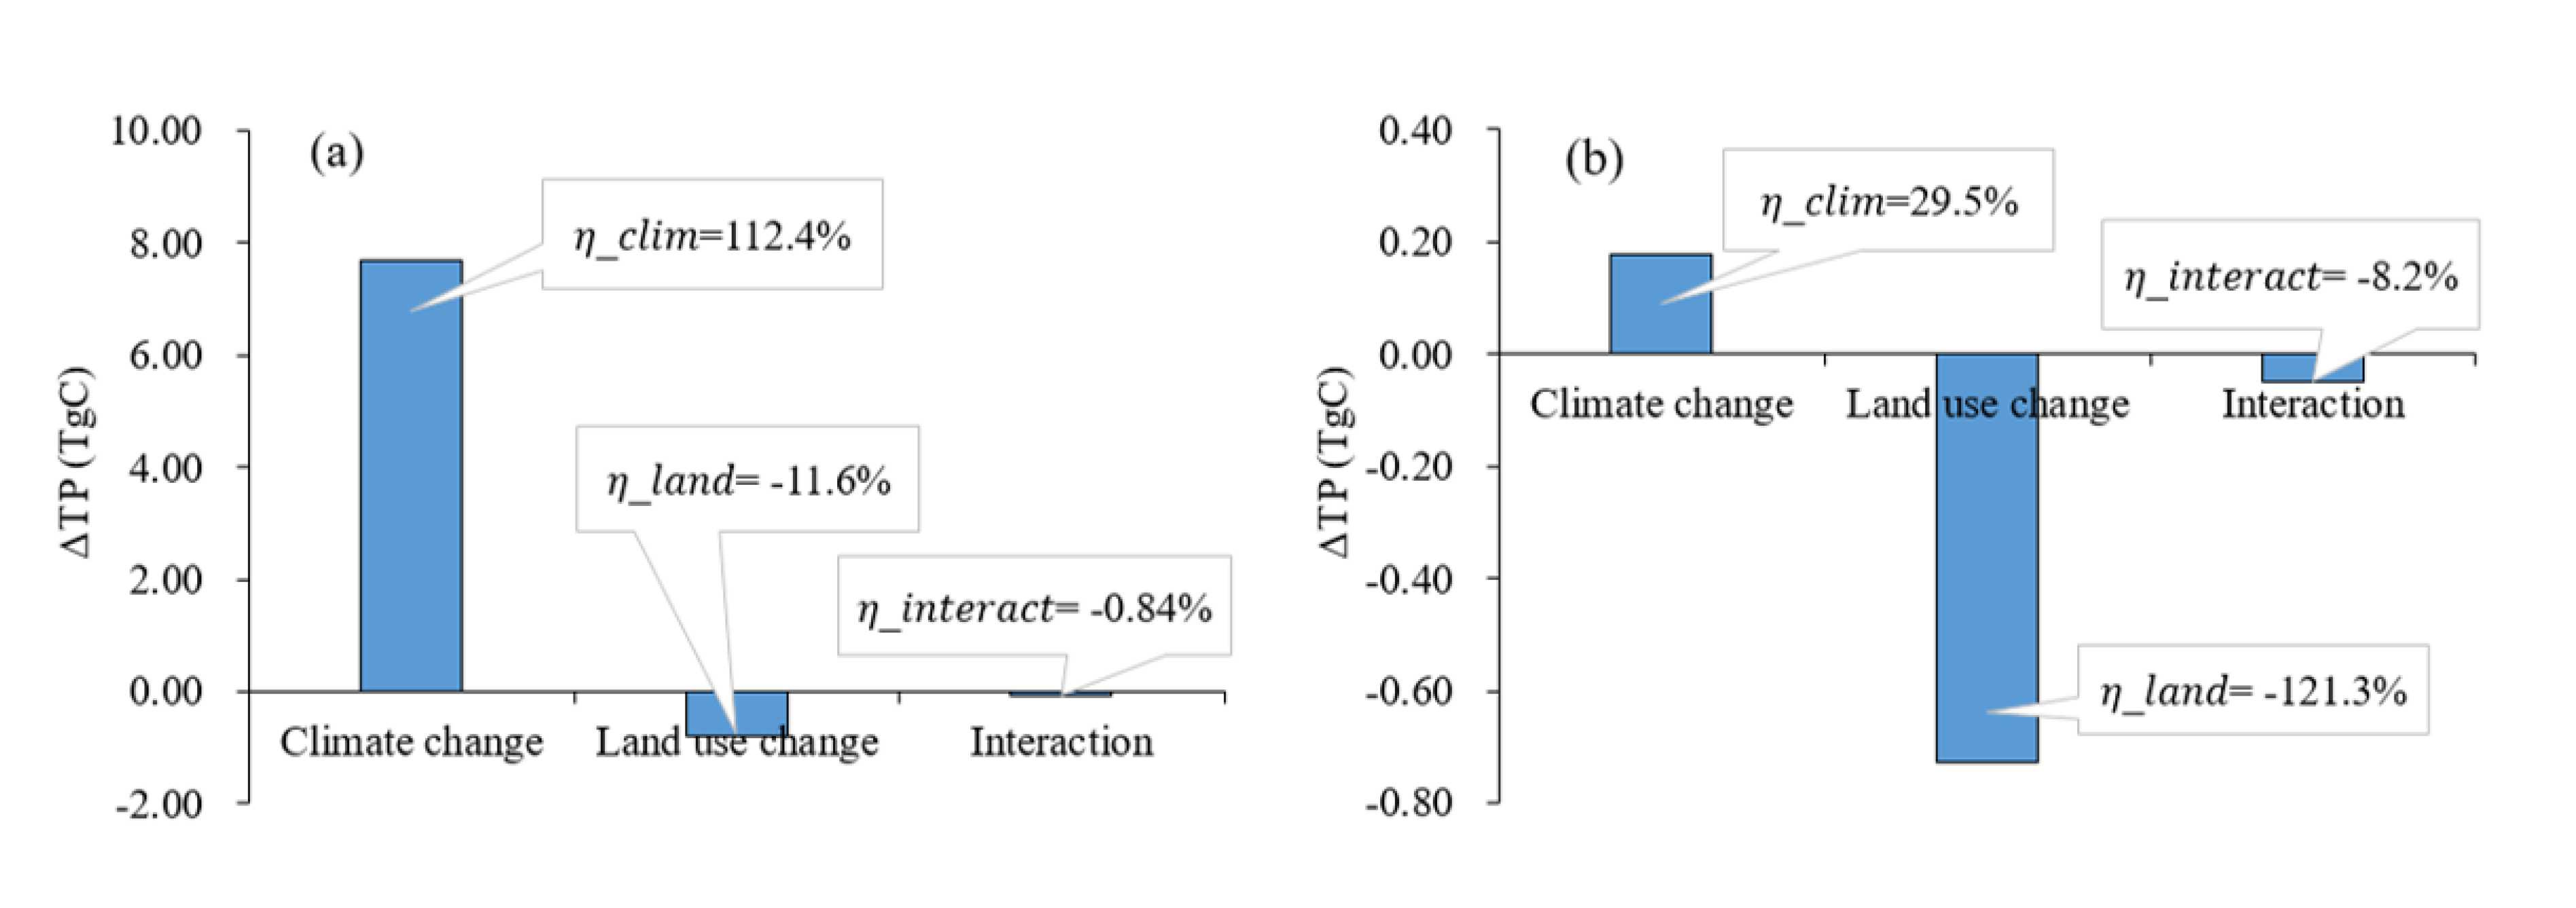
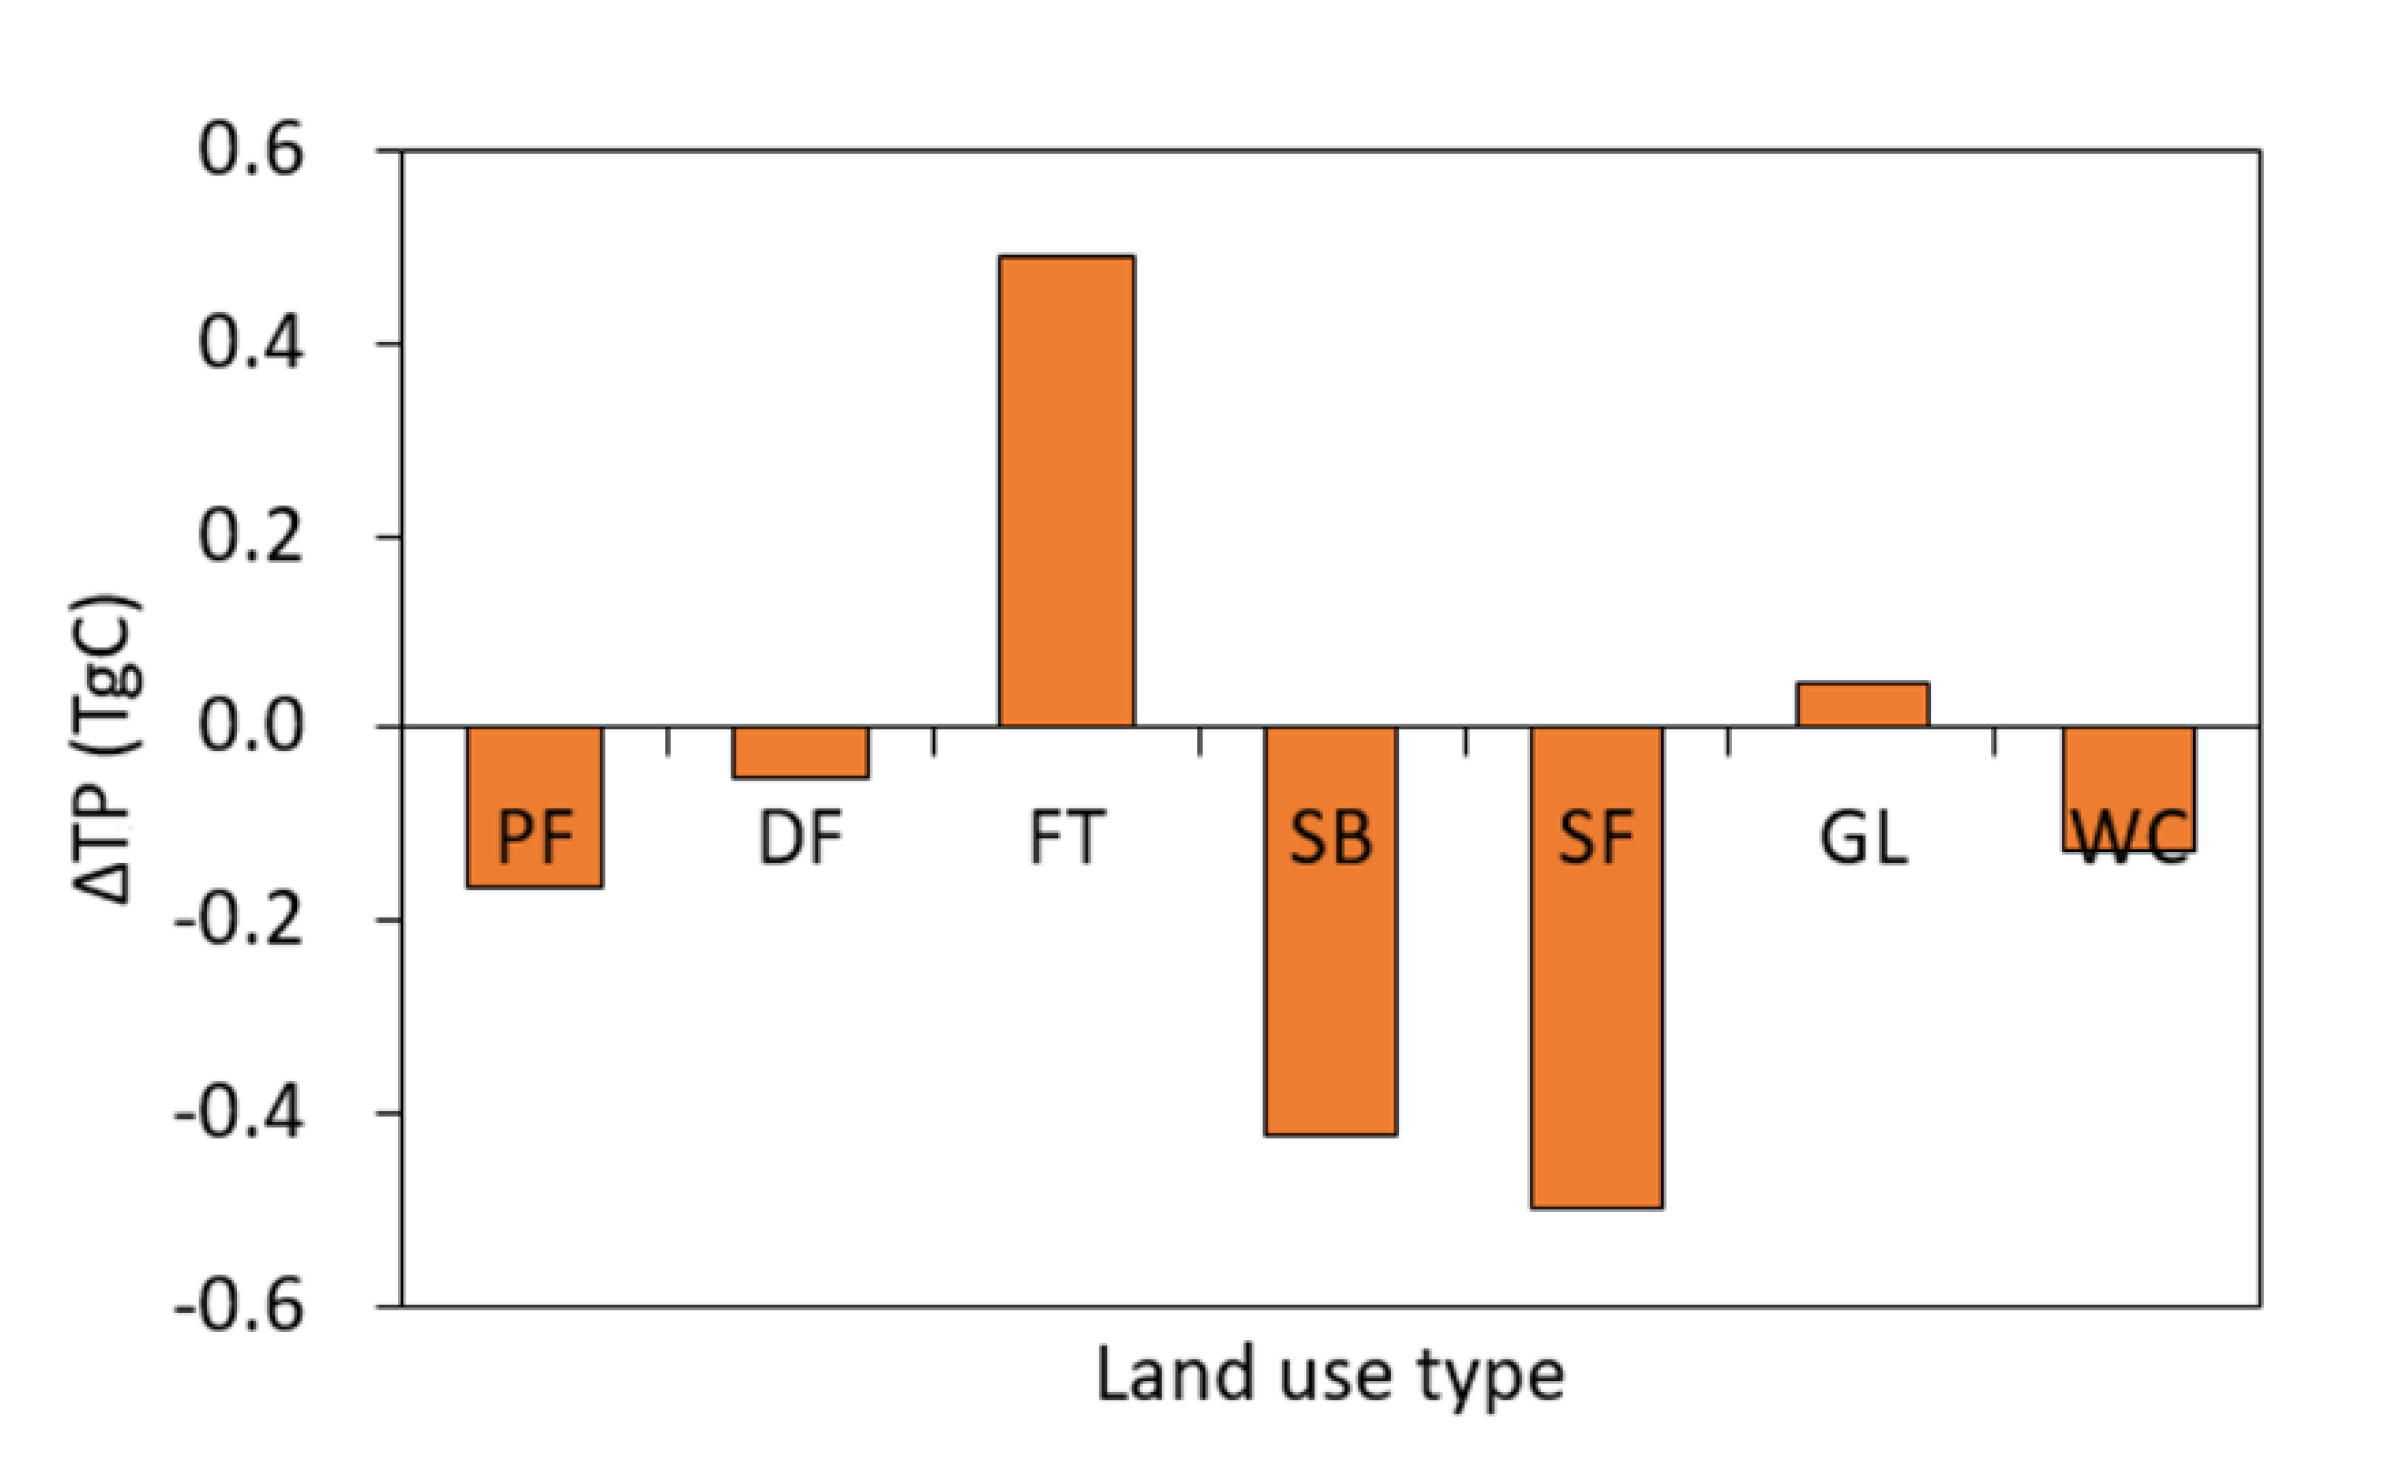
3.4. Controls of Climate and Land Use Change on TP

According to Equation (6), three driving factors determined the change of TP: climate change, land-use change, and the interaction term. Because the effects of the three driving factors are much different among the areas with land-use change and without land-use change, we first investigated the land-use composition in the areas without land-use change and the specific land-use change in the areas where the land-use change occurred according to the land-use scenarios in 2005 and 2015. The result in Table 2 shows that the areas with land-use change in the Poyang Lake basin only accounts for 3% of the whole basin. In those areas without land-use change, the percentage composition of land cover was as follows: 19% for PF, 7% for DF, 42% for FT, 6% for SB, 12% for SF, 4% for GL, and 7% for WC. In those areas where the land-use change occurred, the changes of different land-use types were as follows: PF decreased 414 km2, DF decreased 116 km2, FT increased 593 km2, SB decreased 500 km2, SF decreased 698 km2, GL increased 35 km2, and WC increased 1100 km2.
Based on the above analysis, the impacts of the three driving factors on TP were quantitatively distinguished for the whole Poyang Lake basin as well as the areas with land-use change. Our calculation indicates that the TP of the whole Poyang Lake basin increased 6.84 TgC during the 2010s with reference to the 2000s. The increased TP during the 2010s was dominated by the effect of climate change, and the contribution rate was about 112.4% (Figure 9a). Land-use change played a negative effect on the change of TP with a contribution rate of –11.6%. The contribution of the interaction term only accounts for −0.84%. For the areas where the land-use change occurred, TP decreased 0.79 T gC during the 2010s with reference to the 2000s. However, the change of TP was mainly attributed to the effect of land-use change with a contribution rate of −121.3% (Figure 9b). Climate change had a positive effect on increasing productivity, and the contribution rate was 29.5%. The effect of the interaction term was relatively prominent in these areas, and the contribution rate was −8.2%.
The impacts of different land-use types on TP in those areas where the land-use change occurred were further examined. Specifically, land-use change of PF, DF, SB, SF, and WC caused a decrease of production of 0.164, 0.052, 0.421, 0.499, and 0.186 T gC in the 2010s, respectively. However, land-use change of FT and GL caused an increase in production of 0.489 and 0.047 T gC (Figure 10).

4. Discussion

4.1. About the Verification of CASA Model

Comparative analysis and verification of simulation results are one of the indispensable premises in model simulation research. There are generally three kinds of references to evaluate the simulation accuracy of the NPP model: measured biomass data, estimates from other models, and remote sensing-based estimates [19,26,59]. Because there is no report about NPP simulation in the Poyang Lake basin previously, and it is difficult to conduct NPP monitoring of different vegetation types in such a large area [25], we choose to compare and verify the simulation results with relevant researches according to the above three methods. In addition, by considering the focus of this study, we mainly compared the average NPP of different land-use types estimated by various methods, while the more detailed spatial comparison of the results was not conducted.
Results in Table 3 show that the estimated NPP in the Poyang Lake basin is basically within the range of the observed values. In recent years, a large number of simulations on terrestrial NPP in China have been performed. Our results of NPP simulation are comparable to those simulated by CEVSA (Carbon Exchange between Vegetation, Soil, and the Atmosphere), IBIS (Integrated Biosphere Simulator), and CASA models in China. MODIS 17A3 is a remotely sensed data product, which provides continuous global monitoring of NPP product [60]. Previous studies have pointed out that the calculated NPP from MODIS 17A3 product fluctuates less among different vegetation types, however, it can well reflect the spatial variation characteristics of NPP [61]. Compared with this remote sensing dataset, our results fluctuate greatly in different land-use types.
Generally, the simulation results of each vegetation type are comparable with the references, indicating the estimated NPP by the CASA model in our study is reliable. Inevitably, there are some differences in NPP estimation by different methods, which may be related to the calculation algorithm of the model itself, the spatial-temporal scale of the study area, the different classification of land-use types, and the accuracy of data sources.

4.2. Impact of Climate Change on NPP

The productivity of the terrestrial ecosystem is significantly affected by climatic conditions. However, the relationship between vegetation NPP and meteorological factors varies with geographical location [39]. Studies have shown that in arid and semi-arid areas, vegetation growth is mainly limited by precipitation, while the effects of temperature and radiation are relatively weaker [10,32,49,63]. On the contrary, our investigation demonstrates that in the humid Poyang Lake basin, the temperature is the main meteorological driving factor affecting vegetation NPP, followed by precipitation and solar radiation. Previously, Nemani et al. [21] pointed out that vegetation growth on 40% of the earth’s surface is mainly limited by water, while the other 33% and 27% are limited by temperature and solar radiation, respectively. Tao et al. [7] revealed that the effects of temperature and precipitation on NPP variation vary in different regions of China, but on the whole, precipitation is the primary controlling factor, and the correlation between NPP and temperature is weak. In the Yangtze River basin, Qu et al. [22] concluded that temperature is the most critical limiting factor in vegetation greenness, while the effect of precipitation is relatively small. In terms of geographic pattern, precipitation matters most on vegetation dynamics in arid and semi-arid areas, while the relative effects of temperature and solar radiation are more prominent in those humid areas.
The mechanism behind the influence of climatic variables on vegetation NPP dynamics is complicated. Available water is essential for plant growth. The increase in precipitation can improve soil water supply conditions and enhance the photosynthetic rate, thereby increasing productivity [64]. However, the decrease of precipitation will lead to an increase in total respiration, Gross Primary Productivity, and respiration of leaves and roots [65]. The impact mechanism of temperature on vegetation NPP is more complicated, and mainly reflected in the following two aspects: on one hand, an increase of temperature can prolong the growing season, enhance the ability of plant photosynthesis, and thus promote the vegetation growth; on the other hand, an increase of temperature will strengthen evapotranspiration, accelerate soil dry out, and decrease photosynthesis rate [27]. Concerning those arid and semi-arid regions, the Poyang Lake basin is located in the subtropical humid zone with good hydrothermal conditions. The average annual precipitation and temperature of the basin are about 1680 mm and 17.6 °C, respectively. Although abundant precipitation is helpful to improve the water supply condition of the soil and increase vegetation photosynthetic rate, it also reduces the sensitivity of vegetation NPP to the change of precipitation. In addition, based on the precipitation background of the Poyang Lake basin, the positive effect of rising temperature on plant photosynthesis is much greater than that of the negative effect of potential drought induced by rising temperatures. A previous study also confirmed that vegetation resilience to drought stress in humid areas is stronger than that in other areas [66]. Therefore, this kind of climate condition in the Poyang Lake basin reduces the dependence of vegetation growth on precipitation and highlights the impact of temperature. Furthermore, our investigation also demonstrated that even inside the Poyang Lake basin, the impacts of the three meteorological factors on NPP also show great regional differences. Precipitation in the south of Poyang Lake Basin is larger than that in the north. Therefore, vegetation NPP in the south is more affected by temperature, while in the north is more affected by precipitation.
Generally, the increase of vegetation NPP in the Poyang Lake basin was dominated by the impact of climate change. This result was consistent with most of the similar studies in other regions, e.g., [10,38,39]. At the basin scale, our investigation indicates that the annual NPP of the Poyang Lake basin was positively correlated with the three meteorological factors. In recent decades, climate change in the Yangtze River Basin was obvious, especially the rise of temperature was significantly, and precipitation showed an increasing trend in some areas [67]. The projected results from climate models also indicate that that the temperature and precipitation in the Poyang Lake basin may increase to a certain extent in the near future according to global warming and continuous climate change in the Yangtze River basin [68,69]. This would have a positive effect on the enhancement of carbon sequestration capacity and improvement of ecosystem quality in this subtropical humid area.

4.3. Impact of Human Activities on NPP

Land use/cover change is one of the most important human driving factors affecting NPP variation among the underlying surface conditions. Our observation indicates that land-use change in the Poyang Lake basin was driven by urbanization expansion and the efforts of ecological protection during the past two decades. This was consistent with the rapid development of the social economy of China in recent decades. In this process, areas of some natural land-use types, such as cultivated land, shrub, and sparse forest were reduced to a certain extent, while the urbanization area increased remarkably. All these caused a decrease of 1.326T gC productivity in the Poyang Lake basin during the 2010s with reference to the 2000s. In contrast, the increased area of forest and grassland in the 2010s has led to an increase in the production of 0.563 T gC. The increased area of forest and grassland of the basin in the 2010s may benefit from the effect of the ecological restoration project, the “Mountain–River–Lake” engineering, in recent years [70].
In comparison to the increased total production (TP) of 7.68 T gC caused by climate change, land-use change induced decrease of vegetation total productivity (−0.79) in the basin was relatively small. On the contrary, in those regions where land use occurred, the relative impact of the land-use change was much bigger than that of climate change. Because of the complexity and lag of the land-use change impact on ecosystems, as well as the difficulty to obtain large-scale continuous land-use data, many human impacts (such as the ecological restoration project) on the local ecological environment cannot be quantified [71,72]. To better understand the changes of carbon sequestration capacity and ecological service function of the terrestrial ecosystem under the changing environment in those fast-developing regions, strengthen the research about the responses of vegetation productivity and ecosystem status to the changes of land use structure and function is quite necessary, and this leaves for future studies.

5. Conclusions

Taking the Poyang Lake basin as the study area, the current study investigated the change patterns and causes of vegetation NPP in a subtropical humid area. Our investigation indicates annual NPP and total production (TP) of the Poyang Lake basin experienced a significant increasing trend from 2000 to 2017. Meanwhile, land-use change in the basin was driven by urbanization expansion and the efforts of environmental protection in recent years. In terms of climatic influencing factors, the NPP of the Poyang Lake basin was positively correlated with temperature, precipitation, and solar radiation at the basin scale. Annual temperature significantly limits vegetation NPP variation for about 26.1% area of the Poyang Lake basin, while precipitation and solar radiation as the limiting factors only accounted for 10.4% and 1.9% of the basin. Attribution analysis further revealed that at the basin scale, the increased TP of the Poyang Lake basin during the 2010s was dominated by the effect of climate change with reference to the 2000s, while land-use change played a negative effect on the change of TP. However, in the areas where the land-use change occurred, the decreased TP was mainly attributed to the impact of land-use change, even though climate change showed a positive effect of increasing productivity.
Generally, the result of this study demonstrates that in contrast to those arid and semi-arid areas, the temperature is the major influencing climatic factor in determining vegetation productivity in the subtropical humid basin, followed by precipitation and solar radiation. Our investigation also quantified the impact of climate change and land-use change on NPP dynamics in those land-use change areas, which is an important advance that has not been considered in previous studies. According to the increasing trend of NPP, the overall vegetation status in the Poyang Lake basin has improved over the past two decades. It is anticipated that climate change and human disturbance will continue in the near future, further research on the influence and mechanism of key factors interaction on vegetation carbon and water processes at different scales are necessary. In addition, more attention should be paid to the response and functional changes in terrestrial ecosystems.

Author Contributions

Conceptualization, methodology, and supervision, X.-c.Y.; formal analysis, visualization and writing—original draft, F.-h.L.; data curation, X.-x.Y.; writing—review and editing, C.-Y.X. All authors have read and agreed to the published version of the manuscript.

Funding

This research was funded by the National Natural Science Foundation of China, grant number 42071028, and the Fundamental Research Funds for the Central Universities, grant number XDJK2019B074.

Conflicts of Interest

The authors declare no conflict of interest.

References

  1. Zhao, M.; Running, S.W. Drought-induced reduction in global terrestrial net primary production from 2000 through 2009. Science 2010, 329, 940–943. [Google Scholar] [CrossRef] [PubMed] [Green Version]
  2. Suzuki, R.; Masuda, K.; Dye, D.G. Interannual covariability between actual evapotranspiration and PAL and GIMMS NDVIs of northern Asia. Remote. Sens. Environ. 2007, 106, 387–398. [Google Scholar] [CrossRef]
  3. Tong, X.; Wang, K.; Brandt, M.; Yue, Y.; Liao, C.; Fensholt, R. Assessing future vegetation trends and restoration prospects in the Karst Regions of Southwest China. Remote. Sens. 2016, 8, 357. [Google Scholar] [CrossRef] [Green Version]
  4. Intergovernmental Panel on Climate Change (IPCC). Climate change 2001: The Scientific Basis. In Contribution of Working Group I to the Third Assessment Report of the IPCC; Houghton, J.T., Ding, Y., Griggs, D.J., Noguer, M., Vander Linden, P.J., Xiaosu, D., Eds.; Cambridge University Press: Cambridge, UK, 2001. [Google Scholar]
  5. Cao, M.; Woodward, F.I. Dynamic responses of terrestrial ecosystem carbon cycling to global climate change. Nature 1998, 393, 249–252. [Google Scholar] [CrossRef]
  6. Walther, G.R.; Post, E.; Convey, P.; Menzel, A.; Parmesan, C.; Beebee, T.J.; Fromentin, J.M.; Hoeghguldberg, O.; Bairlein, F. Ecological responses to recent climate change. Nature 2002, 416, 389–395. [Google Scholar] [CrossRef] [PubMed]
  7. Tao, B.; Li, K.R.; Shao, X.M.; Cao, M.K. Temporal and Spatial Pattern of Net Primary Production of Terrestrial Ecosystems in China. Acta Geogr. Sin. 2003, 58, 372–380. [Google Scholar]
  8. Eugster, W.; Rouse, W.R.; Pielke, R.A., Sr.; Mcfadden, J.P.; Baldocchi, D.D.; Kittel, T.G.F.; Chapin, F.S.; Liston, G.E.; Vidale, P.L.; Vaganov, E. Land-atmosphere energy exchange in Arctic tundra and boreal forest: Available data and feedbacks to climate. Glob. Chang. Biol. 2000, 6, 84–115. [Google Scholar] [CrossRef]
  9. Lobell, D.B.; Hicke, J.A.; Asner, G.P.; Field, C.B.; Tucker, C.J.; Loss, S.O. Satellite estimates of productivity and light use efficiency in United States agriculture, 1982–1998. Glob. Chang. Biol. 2002, 8, 722–735. [Google Scholar] [CrossRef]
  10. Jiang, H.L.; Xu, X.; Guan, M.X.; Wang, L.F.; Huang, Y.M.; Jiang, Y. Determining the contributions of climate change and human activities to vegetation dynamics in agro-pastural transitional zone of northern China. Sci. Total Environ. 2020, 718, 134871. [Google Scholar] [CrossRef]
  11. Arora, V. Modeling vegetation as a dynamic component in soil-vegetation-atmosphere transfer schemes and hydrological models. Rev. Geophys. 2008, 40, 1–3. [Google Scholar] [CrossRef] [Green Version]
  12. McLaughlin, D.; Cohen, M.J. Realizing ecosystem service: Wetland hydrologic function along a gradient of ecosystem condition. Ecol. Appl. 2013, 23, 1619–1631. [Google Scholar] [CrossRef] [PubMed]
  13. Zhao, X.; Zhou, W.Z.; Tian, L.; He, W.H.; Zhang, J.C.; Liu, D.H.; Yang, F. Effects of land-use changes on vegetation net primary productivity in the Three Gorges reservoir Area of Chongqing. Acta Ecol. Sin. 2018, 38, 7658–7668. (In Chinese) [Google Scholar]
  14. Zhu, Y.G.; Du, L.T.; Xie, Y.Z.; Liu, K.; Gong, F.; Dan, Y.; Wang, L.; Zheng, Q.Q. Spatiotemporal characteristics of grassland net primary production in Ningxia Province from 2000 to 2015 and its response to climate change. Acta Ecol. Sin. 2019, 39, 518–529. (In Chinese) [Google Scholar]
  15. Gower, S.T.; Krankina, O.; Olson, R.J.; Apps, M.; Linder, S.; Wang, C. Net primary production and carbon allocation patterns of boreal forest ecosystems: Global analysis of environmental and land use change effects. Ecol. Appl. 2001, 11, 1395–1411. [Google Scholar] [CrossRef]
  16. Mu, S.J.; Li, J.L.; Yang, H.F.; Gang, C.C.; Chen, Y.Z. Spatio-temporal variation analysis of grassland net primary productivity and its relationship with climate over the past 10 years in Inner Mongolia. Acta Pratacult. Sin. 2013, 22, 6–15. (In Chinese) [Google Scholar]
  17. Piao, S.L.; Fang, J.Y.; Guo, Q.H. Application of CASA model to the estimation of Chinese terrestrial net primary productivity. Acta Phytoecol. Sin. 2001, 25, 603–608. (In Chinese) [Google Scholar]
  18. Goroshi, S.; Pradhan, R.; Singh, R.P.; Parihar, J.S. Revisiting CASA ecosystem model for Global NPP study: A new perspective. In Proceedings of the National Climate Science Conference, Paris, France, 30 November–12 December 2015. [Google Scholar]
  19. Ye, X.; Meng, Y.; Xu, L.; Xu, C. Net primary productivity dynamics and associated hydrological driving factors in the floodplain wetland of China’s largest freshwater lake. Sci. Total Environ. 2019, 659, 302–313. [Google Scholar] [CrossRef]
  20. Zhu, W.Q.; Pan, Y.Z.; Zhang, J.S. Estimation of net primary productivity of Chinese terrestrial vegetation based on remote sensing. J. Plant Ecol. 2007, 31, 413–424. [Google Scholar]
  21. Nemani, R.R.; Keeling, C.D.; Hashimoto, H.; Jolly, W.M.; Piper, S.C.; Tucker, C.J.; Myneni, R.B.; Running, S.W. Climate-driven increases in global terrestrial net primary production from 1982 to 1999. Science 2003, 300, 1560–1563. [Google Scholar] [CrossRef] [Green Version]
  22. Qu, S.; Wang, L.C.; Lin, A.W.; Zhu, H.J.; Yuan, M.X. What drives the vegetation restoration in Yangtze River basin, China: Climate change or anthropogenic factors? Ecol. Indic. 2018, 90, 438–450. [Google Scholar] [CrossRef]
  23. Yao, R.; Wang, L.; Gui, X.; Zheng, Y.; Zhang, H.; Huang, X. Urbanization effects on vegetation and surface urban heat Islands in China’s Yangtze River Basin. Remote. Sens. 2017, 9, 540. [Google Scholar] [CrossRef] [Green Version]
  24. De Jong, R.; Schaepman, M.E.; Furrer, R.; De Bruin, S.; Verburg, P.H. Spatial relationship between climatologies and changes in global vegetation activity. Glob. Chang. Biol. 2013, 19, 1953–1964. [Google Scholar] [CrossRef] [PubMed]
  25. Chen, F.; Li, H.B.; Liu, Y.J. Spatio-temporal differentiation and influencing factors of vegetation net primary productivity using GIS and CASA: A case study in Yuanyang County, Yunnan. Chin. J. Ecol. 2018, 37, 2148–2158. (In Chinese) [Google Scholar]
  26. Liu, Y.B.; Ju, W.M.; He, H.L.; Wang, S.; Sun, R.; Zhang, Y. Changes of net primary productivity in China during recent 11 years detected using an ecological model driven by MODIS data. Front. Earth Sci. 2013, 7, 112–127. [Google Scholar] [CrossRef]
  27. Miao, Q.; Huang, M.; Li, R.Q. The Impacts of Climate Change on Vegetation Net Primary Productivity of the Yangtze River Basin. J. Nat. Resour. 2010, 25, 1296–1305. (In Chinese) [Google Scholar]
  28. Chen, C.; Park, T.; Wang, X.; Piao, S.; Xu, B.; Chaturvedi, R.K.; Fuchs, R.; Brovkin, V.; Ciais, P.; Fensholt, R. Others China and India lead in greening of the world through land-use management. Nat. Sustain. 2019, 2, 122–129. [Google Scholar] [CrossRef]
  29. Yu, K.; Hu, C. Changes in vegetative coverage of the Hongze Lake national wetland nature reserve: A decade-long assessment using MODIS medium-resolution data. J. Appl. Remote. Sens. 2013, 7, 302–313. [Google Scholar] [CrossRef] [Green Version]
  30. Xu, G.; Zhang, H.; Chen, B.; Zhang, H.; Innes, J.L.; Wang, G.; Yan, J.; Zheng, Y.; Zhu, Z.; Myneni, R.B. Changes in vegetation growth dynamics and relations with climate over China’s Landmass from 1982 to 2011. Remote. Sens. 2014, 6, 3263–3283. [Google Scholar] [CrossRef] [Green Version]
  31. Austin, A.T.; Vivanco, L.I.A. Plant litter decomposition in a semi-arid ecosystem controlled by photo degradation. Nature 2006, 442, 555–558. [Google Scholar] [CrossRef]
  32. O’Connor, T.G.; Haines, L.M.; Snyman, H.A. Influence of precipitation and species composition on phytomass of a semi-arid African grassland. J. Ecol. 2001, 89, 850–860. [Google Scholar] [CrossRef]
  33. Bai, Y.F.; Li, L.H.; Wang, Q.B.; Zhang, L.X.; Zhang, Y.; Chen, Z.Z. Changes in plant species diversity and productivity along gradients of precipitation and elevation in the Xilin river basin, inner Mongolia. Acta Phvtoecolottica Sin. 2000, 24, 667–673. (In Chinese) [Google Scholar]
  34. Chiew, F.H.S.; Whellon, P.H.; Memahon, T.A.; Pittock, A.B. Simulation of the impacts of climate change on runoff and soil moisture in Australian catchments. J. Hydrol. 1995, 167, 121–147. [Google Scholar] [CrossRef]
  35. Schreider, S.Y.; Jakemen, A.L.; Pittock, A.B.; Whetton, P.H. Estimation of possible climate change impacts on water availability, extreme flow event and soil moisture in Goulburn end Oven basins, Victoria. Clim. Chang. 1996, 34, 513–546. [Google Scholar] [CrossRef]
  36. DeFries, R.S.; Field, C.B.; Fung, I.; Collatz, G.J.; Bounoua, L. Combining satellite data and biogeochemical models to estimate global effects of human induced land cover change on carbon emissions and primary productivity. Glob. Biogeochem. 1999, 13, 803–815. [Google Scholar] [CrossRef]
  37. Imhoff, M.L.; Bounoua, L.; DeFries, R.; Lawrence, W.T.; Stutzer, D.; Tucker, C.J.; Ricketts, T. The consequences of urban land transformation on net primary productivity in the United States. Remote. Sens. Environ. 2004, 89, 434–443. [Google Scholar] [CrossRef]
  38. Wu, S.H.; Zhou, S.L.; Chen, D.X.; Wei, Z.Q.; Dai, L.; Li, X.G. Determining the contributions of urbanisation and climate change to NPP variations over the last decade in the Yangtze River Delta, China. Sci. Total Environ. 2014, 472, 397–406. [Google Scholar] [CrossRef]
  39. Jiang, C.; Wu, Z.F.; Cheng, J.; Li, S.Y.; Liu, Q. Relative Effects of Climatic Fluctuation and Land Cover Changes on Net Primary Productivity of Vegetation in Guangdong Province. J. Trop. Subtrop. Bot. 2016, 24, 397–405. (In Chinese) [Google Scholar]
  40. Xu, X.B.; Tan, Y.; Yang, G.S.; Li, H.P.; Su, W.Z. Impacts of China’s Three Gorges Dam Project on net primary productivity in the reservoir area. Sci. Total Environ. 2011, 409, 4656–4662. [Google Scholar] [CrossRef]
  41. Piao, S.L.; Yin, G.; Tan, J.; Cheng, L.; Huang, M.; Li, Y.; Liu, R.; Mao, J.; Myneni, R.B.; Peng, S. Detection and attribution of vegetation greening trend in China over the last 30 years. Glob. Chang. Biol. 2015, 21, 1601–1609. [Google Scholar] [CrossRef]
  42. Zhu, Z.; Piao, S.; Myneni, R.B.; Huang, M.; Zeng, Z.; Canadell, J.G.; Ciais, P.; Sitch, S.; Friedlingstein, P.; Arneth, A. Greening of the Earth and its drivers. Nat. Clim. Chang. 2016, 6, 791–795. [Google Scholar] [CrossRef]
  43. Buyantuyev, A.; Wu, J. Urbanization alters spatiotemporal patterns of ecosystem primary production: A case study of the Phoenix metropolitan region, USA. J. Arid Environ. 2009, 73, 512–520. [Google Scholar] [CrossRef]
  44. Gu, L.; Chen, J.; Xu, C.; Kim, J.; Chen, H.; Xia, J.; Zhang, L. The contribution of internal climate variability to climate change impacts on droughts. Sci. Total Environ. 2019, 684, 229–246. [Google Scholar] [CrossRef]
  45. Li, A.; Wu, J.; Huang, J. Distinguishing between human-induced and climate driven vegetation changes: A critical application of RESTREND in Inner Mongolia. Landsc. Ecol. 2012, 27, 969–982. [Google Scholar] [CrossRef]
  46. Mueller, T.; Dressler, G.; Tucker, C.; Pinzon, J.; Leimgruber, P.; Dubayah, R.; Hurtt, G.; Hning-Gaese, K.B.O.; Fagan, W. Human land-use practices lead to global long-term increases in photosynthetic capacity. Remote. Sens. 2014, 6, 5717–5731. [Google Scholar] [CrossRef] [Green Version]
  47. Xin, Z.; Xu, J.; Zheng, W. Spatiotemporal variations of vegetation cover on the Chinese Loess Plateau (1981–2006): Impacts of climate changes and human activities. Sci. China Ser. D Earth Sci. 2008, 51, 67–78. [Google Scholar] [CrossRef]
  48. Evans, J.; Geerken, R. Discrimination between climate and human-induced dryland degradation. J. Arid Environ. 2004, 57, 535–554. [Google Scholar] [CrossRef]
  49. Miao, L.; Jiang, C.; Xue, B.; Liu, Q.; He, B.; Nath, R.; Cui, X. Vegetation dynamics and factor analysis in arid and semi-arid Inner Mongolia. Environ. Earth Sci. 2015, 73, 2343–2352. [Google Scholar] [CrossRef]
  50. Ye, X.C.; Zhang, Q.; Liu, J.; Li, X.; Xu, C. Distinguishing the relative impacts of climate change and human activities on variation of streamflow in the Poyang Lake catchment, China. J. Hydrol. 2013, 494, 83–95. [Google Scholar] [CrossRef]
  51. Zhang, X.X.; Yang, D.A. Allocation and study on global change transects in china. Quatern. Sci. 1995, 1, 43–54. (In Chinese) [Google Scholar]
  52. Zhang, Q.; Ye, X.; Werner, A.D.; Li, Y.; Yao, J.; Li, X.; Xu, C. An investigation of enhanced recessions in Poyang Lake: Comparison of Yangtze River and local catchment impacts. J. Hydrol. 2014, 517, 425–434. [Google Scholar] [CrossRef] [Green Version]
  53. Xu, Y.; Zhong, Y.X.; Feng, X.H.; Hu, L.T.; Zheng, L. Ecological risk pattern of Poyang Lake basin based on land use. Acta Ecol. Sin. 2016, 36, 7850–7857. (In Chinese) [Google Scholar]
  54. Zhu, W.Q.; Pan, Y.Z.; He, H.; Wang, L.; Mou, M.; Liu, J. A changing-weight filter method for reconstructing a high-quality NDVI time series to preserve the integrity of vegetation phenology. Geosci. Remote Sens. IEEE Trans. 2012, 50, 1085–1094. [Google Scholar] [CrossRef]
  55. Liu, J.; Kuang, W.; Zhang, Z.; Xu, X.; Qin, Y.; Ning, J.; Zhou, W.; Zhang, S.; Li, R.; Yan, C.; et al. Spatiotemporal characteristics, patterns, and causes of land-use changes in China since the late 1980s. J. Geog. Sci. 2014, 24, 195–210. [Google Scholar] [CrossRef]
  56. Potter, C.S.; Randerson, J.T.; Field, C.B.; Matson, P.A.; Vitousek, P.M.; Mooney, H.A.; Klooster, S.A. Terrestrial ecosystem production: A process model based on global satellite and surface data. Glob. Biogeochem. 1993, 7, 811–841. [Google Scholar] [CrossRef]
  57. Mann, H.B. Nonparametric Tests against Trend. Econometrica 1945, 13, 245–259. [Google Scholar] [CrossRef]
  58. Kendall, M.G. Rank Correlation Methods; Griffin: London, UK, 1975. [Google Scholar]
  59. Yuan, Q.Z.; Wu, S.H.; Zhao, D.S.; Dai, E.F.; Chen, L.; Zhang, L. Modeling net primary productivity of the terrestrial ecosystem in China from 1961 to 2005. J. Geogr. Sci. 2014, 1, 3–17. [Google Scholar] [CrossRef]
  60. Zhao, M.; Heinsch, F.A.; Heinsch, R.R.; Nemani, S.W. Running. Improvements of the MODIS Terrestrial Gross and Net Primary Production Global Data Set. Remote Sens. Environ. 2005, 95, 164–176. [Google Scholar] [CrossRef]
  61. Li, D.K.; Wang, Z. The Characteristics of NPP of Terrestrial Vegetation in China Based on MOD17A3 Data. Ecol. Environ. Sci. 2018, 27, 397–405. (In Chinese) [Google Scholar]
  62. Song, F.Q.; Kang, M.Y.; Chen, Y.R.; Yang, P.; Liu, Y.; Wang, Q. Estimation of vegetation net primary productivity on North Shanxi Loess Plateau. Chin. J. Ecol. 2009, 8, 2311–2318. (In Chinese) [Google Scholar]
  63. Xie, B.N.; Qin, Z.F.; Wang, Y.; Chang, Q.R. Spatial and temporal variation in terrestrial net primary productivity on Chinese Loess Plateau and its influential factors. Trans. Chin. Soc. Agric. Eng. 2014, 11, 252–261. (In Chinese) [Google Scholar]
  64. Huang, L.; Xiao, T.; Zhao, Z.; Sun, C.; Liu, J.; Shao, Q.; Fan, J.; Wang, J. Effects of grassland restoration programs on ecosystems in arid and semiarid China. J. Environ. Manag. 2013, 117, 268–275. [Google Scholar] [CrossRef]
  65. Metcalfe, D.B.; Meir, P.; Aragão, L.E.O.C.; Lobo-do-Vale, R.; Galbraith, D.; Fisher, R.A.; Chaves, M.M.; Maroco, J.P.; da Costa, A.C.L.; de Almeida, S.S.; et al. Shifts in plant respiration and carbon use efficiency at a large-scale drought experiment in the eastern Amazon. New Phytologist. 2010, 187, 608–621. [Google Scholar] [CrossRef] [PubMed]
  66. Gazol, A.; Camarero, J.J.; Vicente-Serrano, S.M.; Sánchez-Salguero, R.; Gutiérrez, E.; de Luis, M.; Sangüesa-Barreda, G.; Novak, K.; Rozas, V.; Tíscar, P.A.; et al. Forest resilience to drought varies across biomes. Glob. Chang. Biol. 2018, 24, 2143–2158. [Google Scholar] [CrossRef] [PubMed]
  67. Tian, Q.; Yang, S. Regional climatic response to global warming: Trends in temperature and precipitation in the Yellow, Yangtze and Pearl River basins since the 1950s. Quatern. Int. 2016, 440, 1–11. [Google Scholar] [CrossRef]
  68. Zhang, Y.; Xu, Y.; Dong, W.; Cao, L.; Sparrow, M. A future climate scenario of regional changes in extreme climate events over China using the PRECIS climate model. Geophys. Res. Lett. 2006, 33, L24702. [Google Scholar] [CrossRef]
  69. Zeng, X.; Zhou, J.; Zhai, J.; Su, B.; Xiong, M. Research on Climate Projection for the Period 2011–2050 in the Yangtze River Basin. Adv. Clim. Chang. Res. 2011, 7, 116–122. (In Chinese) [Google Scholar]
  70. Dai, X.Z.; Luo, B.H. From “harnessing” to “enrichment”—Research of strategic upgrading of mountain-river-lake engineering: Providing strong support for development of Changjiang Economic Zone. Yangtze River 2016, 47, 1–6. (In Chinese) [Google Scholar]
  71. Caspersen, J.P.; Pacala, S.W.; Jenkins, J.C.; Hurtt, G.C.; Moorcroft, P.R.; Birdsey, R.A. Contributions of Land-Use History to Carbon Accumulation in U.S. For. Sci. 2000, 290, 1148–1151. [Google Scholar] [CrossRef]
  72. Vleeshouwers, L.M.; Verhagen, A. Carbon emission and sequestration by agricultural land use: A model study for Europe. Glob. Chang. Biol. 2010, 8, 519–530. [Google Scholar] [CrossRef]
Figure 1. Geographical environment of the Poyang Lake basin: (a) location of the basin in China; (b) monthly precipitation and temperature of the basin; (c) topography and water system of the basin with meteorological stations marked.
Remotesensing 12 03525 g001
Figure 2. Spatial distribution of (a) average annual net primary productivity (NPP) and (b) linear trend of the Poyang Lake basin during 2000–2017.
Remotesensing 12 03525 g002
Figure 3. Variations of annual net primary productivity (NPP) and total production (TP) of the Poyang Lake basin during 2000–2017.
Remotesensing 12 03525 g003
Figure 4. Spatial distribution of land use in (a) 2005 and (b) in 2015; (c) shows the change of land use between 2005 and 2015.
Remotesensing 12 03525 g004
Figure 5. Spatial distribution of net primary productivity (NPP) in (a) 2000s (2000–2009) and (b) in 2010s (2010–2017); (c) shows the change of NPP between 2000s and 2010s.
Remotesensing 12 03525 g005
Figure 6. Scatters and fitted linear correlations between annual NPP and (a) temperature, (b) precipitation, and (c) solar radiation at the basin scale.
Remotesensing 12 03525 g006
Figure 7. Correlation analysis between net primary productivity (NPP) and the three meteorological factors. (ac) are the spatial distribution of the correlation coefficients between annual net primary productivity (NPP) and temperature, precipitation, and solar radiation during 2000–2017 over the Poyang Lake basin; (df) are histograms of the correlation coefficients between annual net primary productivity (NPP) and the three meteorological factors at a pixel scale. The red parts in the histograms indicate significant positive correlations (p < 0.05) and their area percentages of the whole basin.
Remotesensing 12 03525 g007
Figure 8. Spatial distribution of significant correlation (p < 0.05) between annual vegetation net primary productivity (NPP) and the three meteorological factors. The subplots in the right column are the enlarged images of the area where the corresponding black dots are located in the left figure.
Remotesensing 12 03525 g008
Figure 9. The impacts of climate change, land-use change, and the interaction term on the change of TP ( TP ): (a) for the whole Poyang Lake basin; (b) for the areas with land-use change.
Remotesensing 12 03525 g009
Figure 10. The impacts of different land-use types on the change of TP ( TP ) in the areas with land-use change.
Remotesensing 12 03525 g010
Table 1. Transfer matrix of land-use change from 2005 to 2015 (unit: km2).
Land Use TypePFDFFTSBSFGLWC
PF30,46327543365588
DF1310,954190214226
FT566367,23525544331200
SB394459043251838
SF27371110119,25551207
GL3861789103646757
WC156327051610,646
Table 2. Composition and change of land use during the two periods in the Poyang Lake basin (Unit: km2).
Land-Use TypeAreas without Land-Use ChangeAreas with Land-Use ChangeChanged Area
2000s2010s
PF30,463714299−414
DF10,954290173−116
FT67,23512201813593
SB904353838−500
SF19,2551432734−698
GL646739142635
WC10,64621613161100
Total area154,06248004800
Table 3. Comparison of estimated net primary productivity (NPP) by different methods. (Unit: gC·m−2).
MethodLand-Use TypeStudy AreaStudy Period
PFDFFTSBSFGLWC
CASA in this study500.1546.51068.5448.4477.1498.4452.6Poyang Lake basin2000–2017
CEVSA from Tao et al. [7]606873423624348China1981–1998
IBIS from Yuan et al. [59]1072.1214.0278.2203China1961–2005
CASA from Zhu et al. [20]426.5985.8367.6465.0349.8347.1China1989–1993
MODIS 17A3528.3581.4628.3605.1588.3516.7556.6Poyang Lake basin2000–2017
Measured value239–760 a*910–1340 b*4–1200 c*200–2000 c*100–727 c*China
Note: a* indicates measured value from Song et al. [62]; b* indicates measured value from Tao et al. [7]; c* indicates measured value from Yuan et al. [59].
Publisher’s Note: MDPI stays neutral with regard to jurisdictional claims in published maps and institutional affiliations.

