Article

Exploring Impact of Spatial Unit on Urban Land Use Mapping with Multisource Data

1
MNR Key Laboratory for Geo-Environmental Monitoring of Great Bay Area and Guangdong Key Laboratory of Urban Informatics and Shenzhen Key Laboratory of Spatial Smart Sensing and Services and Research Institute for Smart Cities, Shenzhen University, Shenzhen 518060, China
2
School of Architecture and Urban Planning, Shenzhen University, Shenzhen 518060, China
*
Author to whom correspondence should be addressed.
Remote Sens. 2020, 12(21), 3597; https://doi.org/10.3390/rs12213597
Submission received: 9 October 2020 / Revised: 29 October 2020 / Accepted: 29 October 2020 / Published: 2 November 2020
(This article belongs to the Section Urban Remote Sensing)

Abstract

:
The ability to precisely map urban land use types can significantly aid urban planning and urban system understanding. In recent years, remote sensing images and social sensing data have been frequently used for urban land use mapping. However, there still remains a problem: what is the best basic unit for fusing remote sensing images with social sensing data? The aim of this study is to explore the impact of spatial units on urban land use mapping, with remote sensing images and social sensing data of Shenzhen City, China. Three different basic units were first applied to delineate urban land use types, and for each unit, a word dictionary was built by fusing natural–physical features from high spatial resolution (HSR) remote sensing images and the socioeconomic semantic features from point of interest (POI) data. The latent Dirichlet allocation (LDA) algorithm and random forest methods were then applied to map the land use of the Futian district—the core region of Shenzhen. The experiment demonstrates that: (1) No matter what kind of spatial unit, it is beneficial to fuse multisource data to improve the performance. However, when using different spatial units, the importances of features are different. (2) Using block-based spatial units results in the final map looking the best. However, a great challenge of this approach is that the scale is too coarse to handle mixed functional areas. (3) Using grid- and object-based units, the problem of mixed functional areas can be better solved. Additionally, the object-based land use map looks better from our visual interpretation. Accordingly, the results of this study could give other researchers references and advice for future studies.

Graphical Abstract

1. Introduction

Urban land use mapping is of great importance for urban structure optimization, resource allocation, and development planning [1]. The rapid economic and urban developments in China have generated diverse and sophisticated urban functional zones, which are reflected in urban land use patterns [2]. Therefore, the effective detection and mapping of urban land use patterns are significant for formulating effective urban planning policies, and need to be resolved immediately.
Numerous approaches have been developed to monitor urban land use over long time periods. Traditional field investigations and interview questionnaires can produce land-use maps, but they are costly and time consuming [3]. Moreover, the rapid development of cities makes the field investigation out of date of the actual land use types. In recent years, many studies have proved the advantage of high spatial resolution (HSR) remote sensing images in land use/cover classification and analysis [4,5,6], and spectral, textural, geometric and spatial features are frequently extracted from remote sensing HSR images to improve classification accuracies. Li et al. [7] computed geometrical, morphological, and contextual attributes of different buildings using HSR images, and used these features to distinguish different building functions. Moreover, urban land use types were classified around the coastal zone by extracting landscape pattern indicators from HSR images [8].
Remote sensing techniques perform excellently in extracting physical characteristics, such as the reflectance of land surface and the texture of urban space. However, it is difficult to identify functional interaction patterns or to understand socioeconomic environments. Rich social sensing techniques can help bridge the semantic gap between land cover type and urban functions [9]. Hence, multisource social media data have been introduced to monitor residential activities and urban land use dynamics. Many studies suggest that point of interests (POIs) have great potential to reveal urban land use patterns [2,10]. Bus smart card data were introduced for mapping functional areas for the first time [11]. Yu et al. [12] attempted to examine the reversed linkage by revealing urban land use variations from taxi trajectory data. Mobile phone positioning data was used to understand urban functions and diurnal patterns with remarkable results [13]. Weibo records can represent the daily activities of residents, due to their spatiotemporal characters, and have been demonstrated to be effective in describing urban function types [14]. As the largest social media platform in China, real-time Tencent user density (RTUD) contains the hourly numbers of smartphone users who use Tencent applications and provides location-based services. RTUD holds great potential in the classification of urban land use types, especially in the regions with typical spatial-temporal features such as commercial and residential areas. RTUD data have been widely applied in functional zoning [2].
Many studies have demonstrated the effectiveness of fusing remote sensing data with multisource data in functional mapping [14,15,16]. The threshold method was used to combine Landsat Images and open social data to generate land-use types [16]. Hierarchical clustering was utilized to analyze mobile data and HSR images [17]. The random forest (RF) model was applied to fuse POI and Gaofen-2 (Chinese satellite, GF2) image features in order to obtain functional results [14]. The Bayesian model was introduced to link hierarchical semantic cognition (HSC) images with road networks to obtain functional results [18]. Although the above-mentioned classification methods are broadly available for data fusion and classification, it is still a challenge to accurately represent the characteristics of different data sources because of the gap between visions and cognitions [19]. To solve this problem, Zhang et al. [18,20] built a hierarchical semantic cognition (HSC) model to bridge this semantic gap and used this for functional area mapping. Then, the latent Dirichlet allocation (LDA) model was introduced in land use mapping [2,21]. This model is skilled at classifying land-use with HSC images and multi-source data and has been proven as the best semantic model at present [22].
Previous studies mainly focus on the selection of model and the introduction of new data, but ignore the choice of basic unit. The basic unit is an essential precursor to the data fusion and is fundamental to the entire classification. How to partition a city into small units concurrently using both social media data and remote sensing images is still a challenge, and the most appropriate segmentation still needs to be discussed in the case of combining remote sensing and social sensing data.
The meaningful spatial unit in the overall urban analysis is a building community [23], which indicates that all the analyzed urban characteristics must be reflected in the building community scale. Here, a building community refers to a housing community surrounded by roads which is represented a traffic analysis zone (TAZ). Because of its clear functional significance in urban analysis [24], the building community is currently commonly used in many studies [10,22,25]. However, this fine-grained unit is not sufficient for Chinese cities because most scenes are mixed and composed of many categories [26] and scene classification methods cannot satisfy the demands of practical applications. As can be seen in Figure 1, many TAZs of Shenzhen have more than one land use type. For convenience and detailed analysis of mixed functional areas, an accurate, easier to divide scale is required. Therefore, grid scale units are used in some studies [12,17], because they can obtain higher classification accuracy and are easy to be generated. Building level units are also used for accurate urban functional area mapping [27,28]. However, it is difficult to obtain an accurate and up to date building footprint. In some studies, multi-scale segmentation methods are used to obtain basic units [18,29], in particular, remote sensing images are used as primary data. These above-mentioned patches coincide with the patterns of reality, which make objects meaningful [30]. When only social media data are used, the road network is used to partition urban regions into basic units, while the multi-scale segmentation method is only used for remote sensing images [29]. At present, some studies have explored the effect of different scale partitions on urban land use mapping. Tu et al. evaluated the scale effect regarding land-use inference by weighting remote sensing and human sensing [31], Zhang et al. illustrated that classical segmentation could not divide functional scenes well [29] and Yuan et al. discussed the influence of mixed functional parcels when using TAZs [14]. However, there is not enough discussion on the comparison of different partitions and the impact on different scenes.
In summary, from the perspective of data sources, there is a general trend of using multisource data, including remote sensing images, POI and other social media data, and from the perspective of machine learning algorithms, urban functional mapping has moved from traditional statistical models to high-level semantically models in order to bridge the gap between low-level features and high-level semantic meanings. Thus, the effectiveness and advantages of using multisource data and high-level models have been widely studied and validated. However, how to properly partition an urban region into small basic functional units is rarely explored. Generally, there are four methods to partition an urban region into small functional units, including the traffic analysis zone, square grid, building footprint and segmented object methods. In previous studies, the researchers have usually chosen only one method; however, the pros and cons of using different methods have still not been fully discussed.
To obtain an accurate urban functional map and analyze the effect of different scales on the results, this study aims to combine remote sensing images and POI data to extract features, extract a final map using the LDA model and determine the comparative analysis of different partitions. Three different methods were compared to partition the study area into small units, and their impacts and advantages on different methods are observed for the first time. Additionally, the different combinations and the importance of different features are fully discussed, respectively, in Section 4.2 and Section 4.3.

2. Study Area and Dataset

2.1. Study Area

The study area is located in the Futian District (Figure 2a) of Shenzhen City, Guangdong Province, China. Due to its special geographical location adjacent to Hong Kong, Futian District has been developing rapidly with advanced political, economic and cultural functions, and it is considered as the center of Shenzhen. According to the Annals of Statistics, Futian District has a total area of 78.66 km2 and a permanent population of 1,501,700.

2.2. Dataset and Preprocessing

Multisource data, including road network data, remote sensing images and POIs, were used in this study. Road network data were used to partition the urban region into TAZs, HSR remote sensing images were used to describe the spectral, textural and landscape metrics of each parcel, and POI data were used to describe semantical features.
The road network data from OpenStreetMap (OSM, http://www.openstreetmap.org) was used in this study to partition the urban region into TAZs. The downloaded vector data were processed using FME editor software v.2018.0. According to a previous study [14], the road buffers with widths of 40, 20 and 10 m for level one, level two and level three roads were created to obtain road space, respectively. The urban region was partitioned into TAZs by the modified road network. The segmented TAZs with an area below 500 m2 were removed in order to keep meaningful ones as far as possible.
Two GaoFen2 images covering the study area were used in this study. These images were obtained on 27 December 2017 and 29 October 2017. To obtain high resolution multispectral images, the panchromatic and multispectral images were first fused using pan-sharpening fusion method in PIE-Ortho 5.0. The fused images were then mosaicked and orthodox-rectified. Finally, an image with 11187 × 9732 pixels was obtained, with a spatial resolution of 1 m/pixel and four spectral channels (blue, green, red and near-infrared).
The Gaode POI data from 2018 were acquired via the application programming interface (API) provided by Gaode Maps (https://lbs.amap.com/), which have been widely used in urban functional area mapping. A total number of 84,150 records of Gaode POIs were obtained within the study area, including residence, business, education, entertainment, government, healthcare, parks, arts, retail, services, and transportation. The POIs were classified into three levels of primary data from the degree of classification refinement.
The reference land use data were downloaded from the Shenzhen city planning and land resources committee (http://pnr.sz.gov.cn/ywzy/fdtz/cggbcx/ftq/index.html).

3. Methods

A general framework was proposed to map land use by fusing the POI and remote sensing image, and it includes four parts (Figure 3): (1) Spatial unit partition: the study area is partitioned into small spatial units, which is the smallest unit to fuse features from HSR images and POI data, and is also the smallest unit for land cover mapping. (2) Semantic feature construction: Low-level image features including spectral, textural and scale invariant feature transform (SIFT) features and POI features of each spatial unit were calculated, and were further promoted to high-level semantic features using the LDA model. Playgrounds were also extracted and used as a semantic feature. Besides, landscape metrics were calculated using a land cover map, which was obtained using object-based image classification of the HSR image. (3) A set of training data were selected, and an RF classifier was used for a feature importance analysis and land use classification of the whole study area. (4) Finally, by using three different partition methods, and repeating steps (1) to (4), three different land use maps were obtained, and then a comparative analysis was carried out to explore the impact of spatial unit on land use mapping with multisource data.

3.1. Spatial Unit Partitioning

Functional zones are not only spatially larger than objects, but also semantically different from objects [29], and they cannot be classified with traditional methods such as pixel-based methods or fishnet methods directly, which makes fine-grained functional-zone maps rare. In order to solve this problem and analyze the impact of using different spatial units, we combined road networks (as fundamental units) with three types of units (block-, grid- and object-based) in this study.
1.
Block-based urban unit partitioning
Block-based partitioning is extensively used in the field of architecture and urban analysis because of its clear functional meanings. Many researchers used road network blocks or traffic analysis zones (TAZ) to act as the basic units. However, the road network boundary is incomplete, and thus, a high accuracy depends on a large number of contrived modifications. Besides, the scale of a block is very coarse, which results in mixed function areas not being separated well. Therefore, a block is used for the initial partition of other segmentations.
2.
Grid-based urban unit partitioning
Fishing net zoning is a convenient method to partition urban functional units. The size of the grid has an important impact on accuracy. Some studies adopted this method in order to get land use map with suitable scales [17,32]. In our study, the target area was firstly divided into grids of 150 × 150 m, and then the grids were overlapped with TAZs to exclude traffic areas.
3.
Segmented object-based urban unit partitioning
Multiscale image segmentation divides an image into homogeneous regions, which meets the needs of land cover classification. However, an object is significantly smaller than a functional unit and cannot be directly used for functional area mapping, due to missing semantic information. However, these segmented objects could be used as a basic functional area mapping unit, especially when the segmentation scale is coarse [29]. There were two steps in adopting this method in this study: (1) a multiscale image segmentation algorithm was applied on remote sensing images to obtain object level boundaries, and the segmentation scale of 250 was used, and (2) these objects were overlapped with TAZs to exclude traffic areas.

3.2. Semantic Feature Constructing

Feature constructing plays an important role in object recognition and classification [15]. Due to the abundant information in multi-band images, spectral and textural information have been widely used for land cover classification [33]. In this study, GF-2 images were used to distinguish common land cover types [14]. The SIFT feature descriptor was introduced because of its ability in pattern recognition for ground components, which has been extensively applied in image analyses [34,35]. In order to reduce computational complexity during the extraction of physical features from HSR images, the sliding window was adopted to calculate some statistical characteristics namely mean and variance. The characteristics of POI were considered as an important social-economic data source for urban functional mapping. The k-means clustering method was employed to cluster and convert each feature into a virtual word. Moreover, semantic objects were extracted to enrich the features, and landscape metrics derived from land cover maps were also calculated [27]. The main method of feature extraction is similar to that of Liu [2].

3.2.1. Image Features

Some studies considered that the minimum unit to identify city should be set as nearly 50 × 50 m [36], and thus, the HSR images were segmented into a set of overlapping image patches of 45 × 45 pixels to determine spectral, textural and scale invariant feature transform (SIFT) features in this study. Each pair of adjacent patches was set to overlap by 15 pixels to preserve a sufficient amount of spatial information and each patch was represented as i.
  • Spectral features: The mean and standard deviation (STD) of each band of GF-2 images were calculated in each patch. The spectral feature of each patch can be represented as: Speci = (mean1, std1, …meanB, stdB).
  • Textural features: The grey-level co-occurrence matrix (GLCM) effectively describes the patterns of images and textures [37], and Haralick’s statistics provide 14 textural features for classification. Ulaby et al. [38] found that only four (correlation, angular second moment, energy and contrast) of those 14 GLCM-derived features were irrelevant, while they were easy to be calculated and could provide high accuracy. Therefore, we adopted these four commonly used features to extract the textural features of images. We compressed the image gray level to 16 bins, and the slide step length was set to 1. For each patch, the textural vector could be represented as Texi = (cor1; asm1; ene1; con).
  • SIFT: SIFT was introduced to describe image responsive features. A previous study indicated that SIFT could achieve the best optimized registration performance when a 128-dimensional vector was adopted to represent the SIFT feature [39]. The dense SIFT algorithm is roughly equivalent to running SIFT on a dense gird of locations at a fixed scale and orientation, and it has been widely used in image classification and the “bag of words” model [39,40]. Thus, dense SIFT was chosen to represent remote sensing images in this study.
Followed Liu’s work [2], the k-means clustering method was applied to classify the spectral, textural and SIFT features into several classes, respectively. The labels obtained by k-mean clustering methods were then used as mid-level features, instead of original low-level spectral, textual and SIFT features.

3.2.2. POI Feature

POI refers to a geographical point with a property label and position. The POI data used in this study were obtained from Gaode map, and they have detail types but many categories are repetitive and meaningless. Thus, POI was manually divided into seven categories by experiences including residential communities, commercial sites, industrial facilities, entertainment facilities, medical facilities, landscape sites, and education facilities. This dataset was introduced as one feature reflecting socioeconomic properties.

3.2.3. Feature Representation Using LDA

Because of the good performance of the semantic model in land use classification, probabilistic topic models, especially LDA, have been applied in related studies [22]. LDA is a document topic model that constrains latent Dirichlet allocation by defining a one-to-one correspondence [41]. It is an unsupervised model including three-layer: words, topics and documents. This hierarchical model represents each item of a collection as a random mixture of latent topics, in which each topic is characterized by a distribution over words [42].
In this study, we segmented the study area into non-overlapping spatial units, and these units were considered as “documents” of the LDA model. The land use type of a spatial unit was considered as a “topic”. The mid-level spectral, textural, SIFT and POI features of a spatial unit were used as “visual words” in the LDA model. The number of topics, K, was chosen by experience, and features were transformed into high-level semantic features: {Lspec, Ltex, Lpoi, Lsift} by the LDA model.

3.2.4. Semantic Objects

Semantic objects, including urban villages and playgrounds, are widely applied in land use recognition [43,44]. The goal of semantic object extraction is to classify some special areas which were hard to distinguish using POI and remote sensing characteristics. In our study area, playgrounds always appear in primary and middle schools, and thus they could be regarded as a semantic signal for educational areas. Using HSR remote sensing images, playgrounds can be easily obtained using an object detection technique, which has been widely used in image recognition and the remote sensing field [43]. In this study, the ENVI deep learning Toolkit v.1.0 was used to extract playgrounds from GF-2 images, and 51 playgrounds were detected and used.

3.2.5. Landscape Metrics

Landscape metrics is widely used in urban land use classification [32,45], due to its good performance. In this study, an object-based land cover classification process was carried out [46], and it classified images into built-up areas, green land, water, developing areas and shadow areas. The land cover map is presented in (Figure 4).
The good performance of several landscape metrics has been confirmed in terms of urban function mapping [17,32,45], including total area (TA), patch density (PD) and percentage of landscape (PLAND) at a class-level, as well as landscape division index (LDI) and Shannon’s diversity index (SHDI) at a landscape-level [47]. SHDI and LDI are calculated by Equations (1) and (2) separately. The descriptions of these indicators are shown in Table 1.
S H D I = i = 1 m P i l n ( P i )
where Pi is the proportion of landscape occupied by patch types i, and m is the number of types.
L D I = [ 1 i = 1 m j = 1 n ( a i j A ) 2 ]
where aij is the area of patch ij and A is the total landscape area (m2).
Each basic unit was described using several features, including LDA features, playground labels (PGs) and landscape metrics (LM), and thus the urban land use type of each unit could be obtained by a machine learning classifier. The feature of each unit was represented as: Unit = (Lspec, Ltex, Lpoi, Lsift, Playground, LM).

3.3. Land Use Mapping Using Random Forest

In this study, 195 points were labeled first, including residential land, commercial land, public management and service land, urban village and natural land. The labeled points were then overlaid on three partitions separately to get three training data sets. This step unified the position of training samples in different partitions. The ground truth land use types of label-points were identified based on HSR remote sensing images, street views, building profile data and official land use data. The RF algorithm was used due to its outstanding performance, which has been proven to be well-established in land cover/use classification [14,27]. The Kappa coefficient and the confusion matrix were chosen to validate classification accuracy. In addition, two sensitive parameters ntree and ntry were tuned by a gird-search method in order to maximize the Kappa. 10-fold cross validation was used for tuning model parameters. Moreover, RF has the advantage of evaluating the importances of features [14], which is used to rank the features in this study.

3.4. Comparative Analysis

By adopting the above-mentioned process, three different land use maps could be obtained, block-, grid- and object-based maps. Then, comparative analysis was conducted to explore the impact of using different spatial units. Firstly, we analyzed the performances of combining different features when using three different units, and secondly, the importances of different features were analyzed; the visual comparison and quantitative assessment of the block-, grid- and object-based land use maps were carried out.

4. Results

4.1. Impact on the Selection of Different Feature Combinations

To examine the influence of different features, we designed six different cases to classify land use. The details of these six examples are shown in Table 2. The selection of parameters refers to Section 4.3.
In the first three cases (A, B and C), the LDA semantic features from the HSR images were utilized to carry out functional land use classification tasks. In the next case (D), LM, POI and PGs were combined and used to test the performances. Then, features without landscape metrics were used in case E. All the features were integrated in case F.
Significant improvements of OA and Kappa could be found in case C, where POI was used. The OAs of the three different partition methods were all significantly improved, which indicates that the POI feature contributed to effective land use mapping. Besides, the results of C and E showed that the accuracies of using all three different spatial units were further improved by using PGs object information, especially for the grid method. Landscape and special object data can distinguish urban functional areas better than using image features according to the result of A and D.
According to the result of case F, the block-based method obtained the highest OA and Kappa coefficient values (OA = 86.59%, Kappa = 83.87%) among these three methods. The results of the grid method showed a good testing accuracy of 80.62% and an overall classification accuracy of 83.85%. The object-based method obtained the lowest performance (OA = 81.62%, Kappa = 77.93%).
The accuracies of different land use types using different spatial units are shown in Table 3. All urban zones were classified into six categories using a combination of all features. The common point of these three methods is that they all demonstrated good performances in the green areas and urban villages because of the huge difference in green land and urban village areas against other ground components. Traditional block-based and object-based methods had poor performances in the public service areas, but the grid methods performed well, because the physical image features are not enough to distinguish public service areas from other buildings and public service is mixed in with residential and commercial types in the POI dataset. The object-based method performed slightly less well in all classes of urban land-use classification compared with the other methods, but performed well in terms of accuracy in distinguishing the residential type.
Generally, by comparing the different feature combinations, we can observe that no matter what kind of spatial unit is used, the best choice is always to fuse all the features in order for the best classification accuracy to be obtained.
Figure 5 shows the confusion matrixes for the classification results (Table 3) of each method that are closest to the average accuracy. The spatial unit had a great impact on classification accuracy. According to Figure 5a, the public service area obtained an inadequate accuracy with block level urban parcels, because OSM is a volunteer based upload platform in which many roads are not accurate, or the networks are incomplete. Therefore, many blocks could not be properly partitioned, and lots of manual operations were needed. Moreover, due to the limited number of blocks in the Futian district, the number of public service samples is inadequate, which results in a large number of deficiencies when training the model. Figure 5b illustrates that the educational type had a poor performance in the grid method and Figure 5c shows that the public service parcels were often confused with other parcels.

4.2. Impact on Feature Importance

A total number of 114 features were used for urban land use classification in this study (Figure 3), including 22 landscape metrics, 73 spectral/textural/SIFT features, 18 Gaode POI features, and 1 special object feature. Figure 6 shows the rankings of feature importance (Top 30) using three different partitions. The importances of features are quite different among the different partition methods.
For block level parcels, POI features occupied 3/10 of the top ten features and the first three were all POI features. This means that POIs are far more important than other features when using the block partition method. The textural features also enter the top 10 and occupied two positions. Pland_4, Pland_2 and Pland_0 are the ninth, twelfth and thirteenth most important features, which represent the percentage of shadow, natural land and built-up areas in a block, respectively. The SIFT feature has four positions in the top 30. Only two feature vectors of the spectral features ranked in the top 30 most important features, which were ranked as four and 30, respectively.
Using grid level parcels, the gap of importances between different features is not particularly large. The landscape metrics has 13 positions in the list (Figure 6b). The special object PGs ranked first. The texture takes only one position, which ranked second. None of the SIFT features ranked in the top 30.
Using object level parcels, POI is the most important feature which occupied 7/10 of the top ten and almost all of the POI features are on the list. Landscape metrics occupied seven of the top 30. Spectral features are the least important compared with the other features because they only occupy two of the top 30 positions.
Comparing the ranks of feature importances using the three different methods, it can be observed that the spectral features are less important for identifying parcels than the other features in the block and object methods. SIFT features are insignificant features in the grid method. As expected, the semantic feature of the playground was identified as an important feature no matter what kind of partition was chosen. This demonstrates the importances of the use of specific features in functional area mapping.
As suggested by Figure 6, POI is the most important feature. Specifically, from the ranking we can deduce that the new extracted feature is a critical attribute for all of the conditions. Landscape metrics, especially at the class-level PLAND, became an important attribute in each partition, because they represented the proportion of land cover types in a single parcel. Spectral and textural attributes are more important for block and object level parcels, but were seldom found to rank in the top 30 features for grid level mapping.

4.3. Impact on Qualitative Performance

Figure 7 presents the detailed results using three partitions in the study area. As shown in the ground-truth map (Figure 7a) and the land-use classification maps (Figure 7b–d), the geographical distribution of land use in Futian is complicated. Many residential and commercial parcels were interweaved in the grid level (Figure 7c) and object level maps (Figure 7d). The mixed-use parcels, which were located in the southernmost areas, have been separated in the grid and object level maps when they were compared to the ground-truth map. Because of the complex land use types of the central area, mixed functional areas cannot be well represented by mapping. Grid level and object level maps show the complexity present within a block.
By observing these maps, it is clear that urban villages were intensively distributed in the mid-south areas. Natural land was seldom misclassified in all three methods. On the contrary, the number of misclassified public service parcels was largest for all three partitions. This conclusion indicates that natural land can be distinguished well by the extracted features, but public-service areas still need more appropriate features to improve the accuracy.
Figure 7e–h shows some details regarding the CBD area, which is one of the most prosperous areas of Shenzhen. The actual land use property is complicated when compared with the remote sensing images ((Figure 7e). The misclassified parcels were generally few in number compared with the ground-truth (Figure 7a) and the predicted results (Figure 7b), which demonstrated the effectiveness of the results obtained using the block-level parcel method. However, the disadvantage of this partition method is also obvious. Comparison of the remote sensing images (Figure 7e) and the block-level results (Figure 7f) demonstrated that the scale of road network is too coarse for function mapping, which caused the appearance of the mixed areas. Moreover, the educational type cannot be easily separated from the other categories, which leads to the poor accuracy of educational land-use types. One of the improvement measures is to use a higher level of road network. This requires a large amount of manual work to correct the original data, which makes reliable mapping impossible if the study area is large. It can be concluded that this method is only available for the test of classification methods and small-scale mapping.
The shortcoming is obvious when comparing Figure 7c,g with the ground-truth map (Figure 7e). Although the phenomenon of the mixed functional area has been partially solved, compared with the ground-truth, the land use types at the edge of the grid cannot be distinguished well. Moreover, the accuracy of the gird-method deeply relies on the selection of grid size and the unsightly rough edges cannot be ignored. It is convenient and time-saving to analyze the data using this method if only complete some statistical analyses with the point data, for instance, mobile data [13] and GPS tracking data [12]. It is effective in improving model accuracy according to the testing result, but it is still not suitable for the accurate mapping of functional areas.
We can find that the parcels were classified perfectly in Figure 7d,h, which used object-level parcels as the basic unit. It can be seen from Figure 7d that mapping quality increased substantially and the phenomenon of the mixed functional area was solved well. Additionally, the disadvantages are obvious because of the complex segmentation process before classification: time consuming. Secondly, it also has a strong dependence on the selection of scale parameters for image segmentation. Comparing the results with the ground-truth map, there is still a level of confusion between public service areas and the business district. This means more representative features or data need to be identified and incorporated to distinguish between these two types in the future. In summary, this method is more suitable for subsequent statistics and fine-grained mapping of functional districts.

4.4. Impact on Quantitative Performance

In this part, 487 sample points were randomly selected to assess the mapping accuracies. The ground-truth labels of these points were determined based on remote sensing images, street views, building profile data and official land use data. Then, these points were used to evaluate block-level, grid-level and object-level maps, and three confusion matrices (Table 4, Table 5 and Table 6) were obtained.
As we can see from Table 4, Table 5 and Table 6, the overall accuracies differ a lot compared with model accuracy. As shown in Table 4, the producer’s accuracy (PA) of the residential area is 35.83%. This result shows that residential areas are always misclassified with commercial areas, public service areas and educational areas. In particular, residential and educational areas are often close to each other, and the lack of road network separating them resulted in residential and educational areas having to be classed as the same block, which caused unavoidable misclassification errors. The grid-level method showed poor performance in distinguishing commercial and public service areas, because they have similar image patterns and POI features. The object-level map achieved the highest overall accuracy because of the fine-grained scale. Generally, natural areas and urban villages still have higher accuracies than other areas, because they have distinct characteristics from other areas in remote sensing images. It is difficult to distinguish residential and educational areas for all these three methods.

4.5. Parameters Sensitivity Analysis

Several parameters of this model may influence the discrimination accuracy, such as the numbers of spectral, textural and SIFT visual words and the numbers of LDA topics for the four used features. Previous studies have confirmed that the number of visual words and the size of the topics have an impact on the accuracies of land-use classification [48]. We utilized the K-means method with the Euclidean distance measurement to cluster the spectral, GLCM and SIFT features. V denotes the number of visual words, and K is the number of topics for the LDA model. The visual word number (V) and topic number (K) are two free parameters in our approach. The suitable topic numbers were chosen by comparing the accuracies of classification results, and the training and validation datasets are the same as those discussed in Section 3.3.
We used Dirichlet priors in the LDA estimation with α = 50/K and β = 0.01, which are common settings in the literature [49]. We have attempted to get the best value with different combinations of K and V parameters. The range of the parameters was set according to the article [50]. 
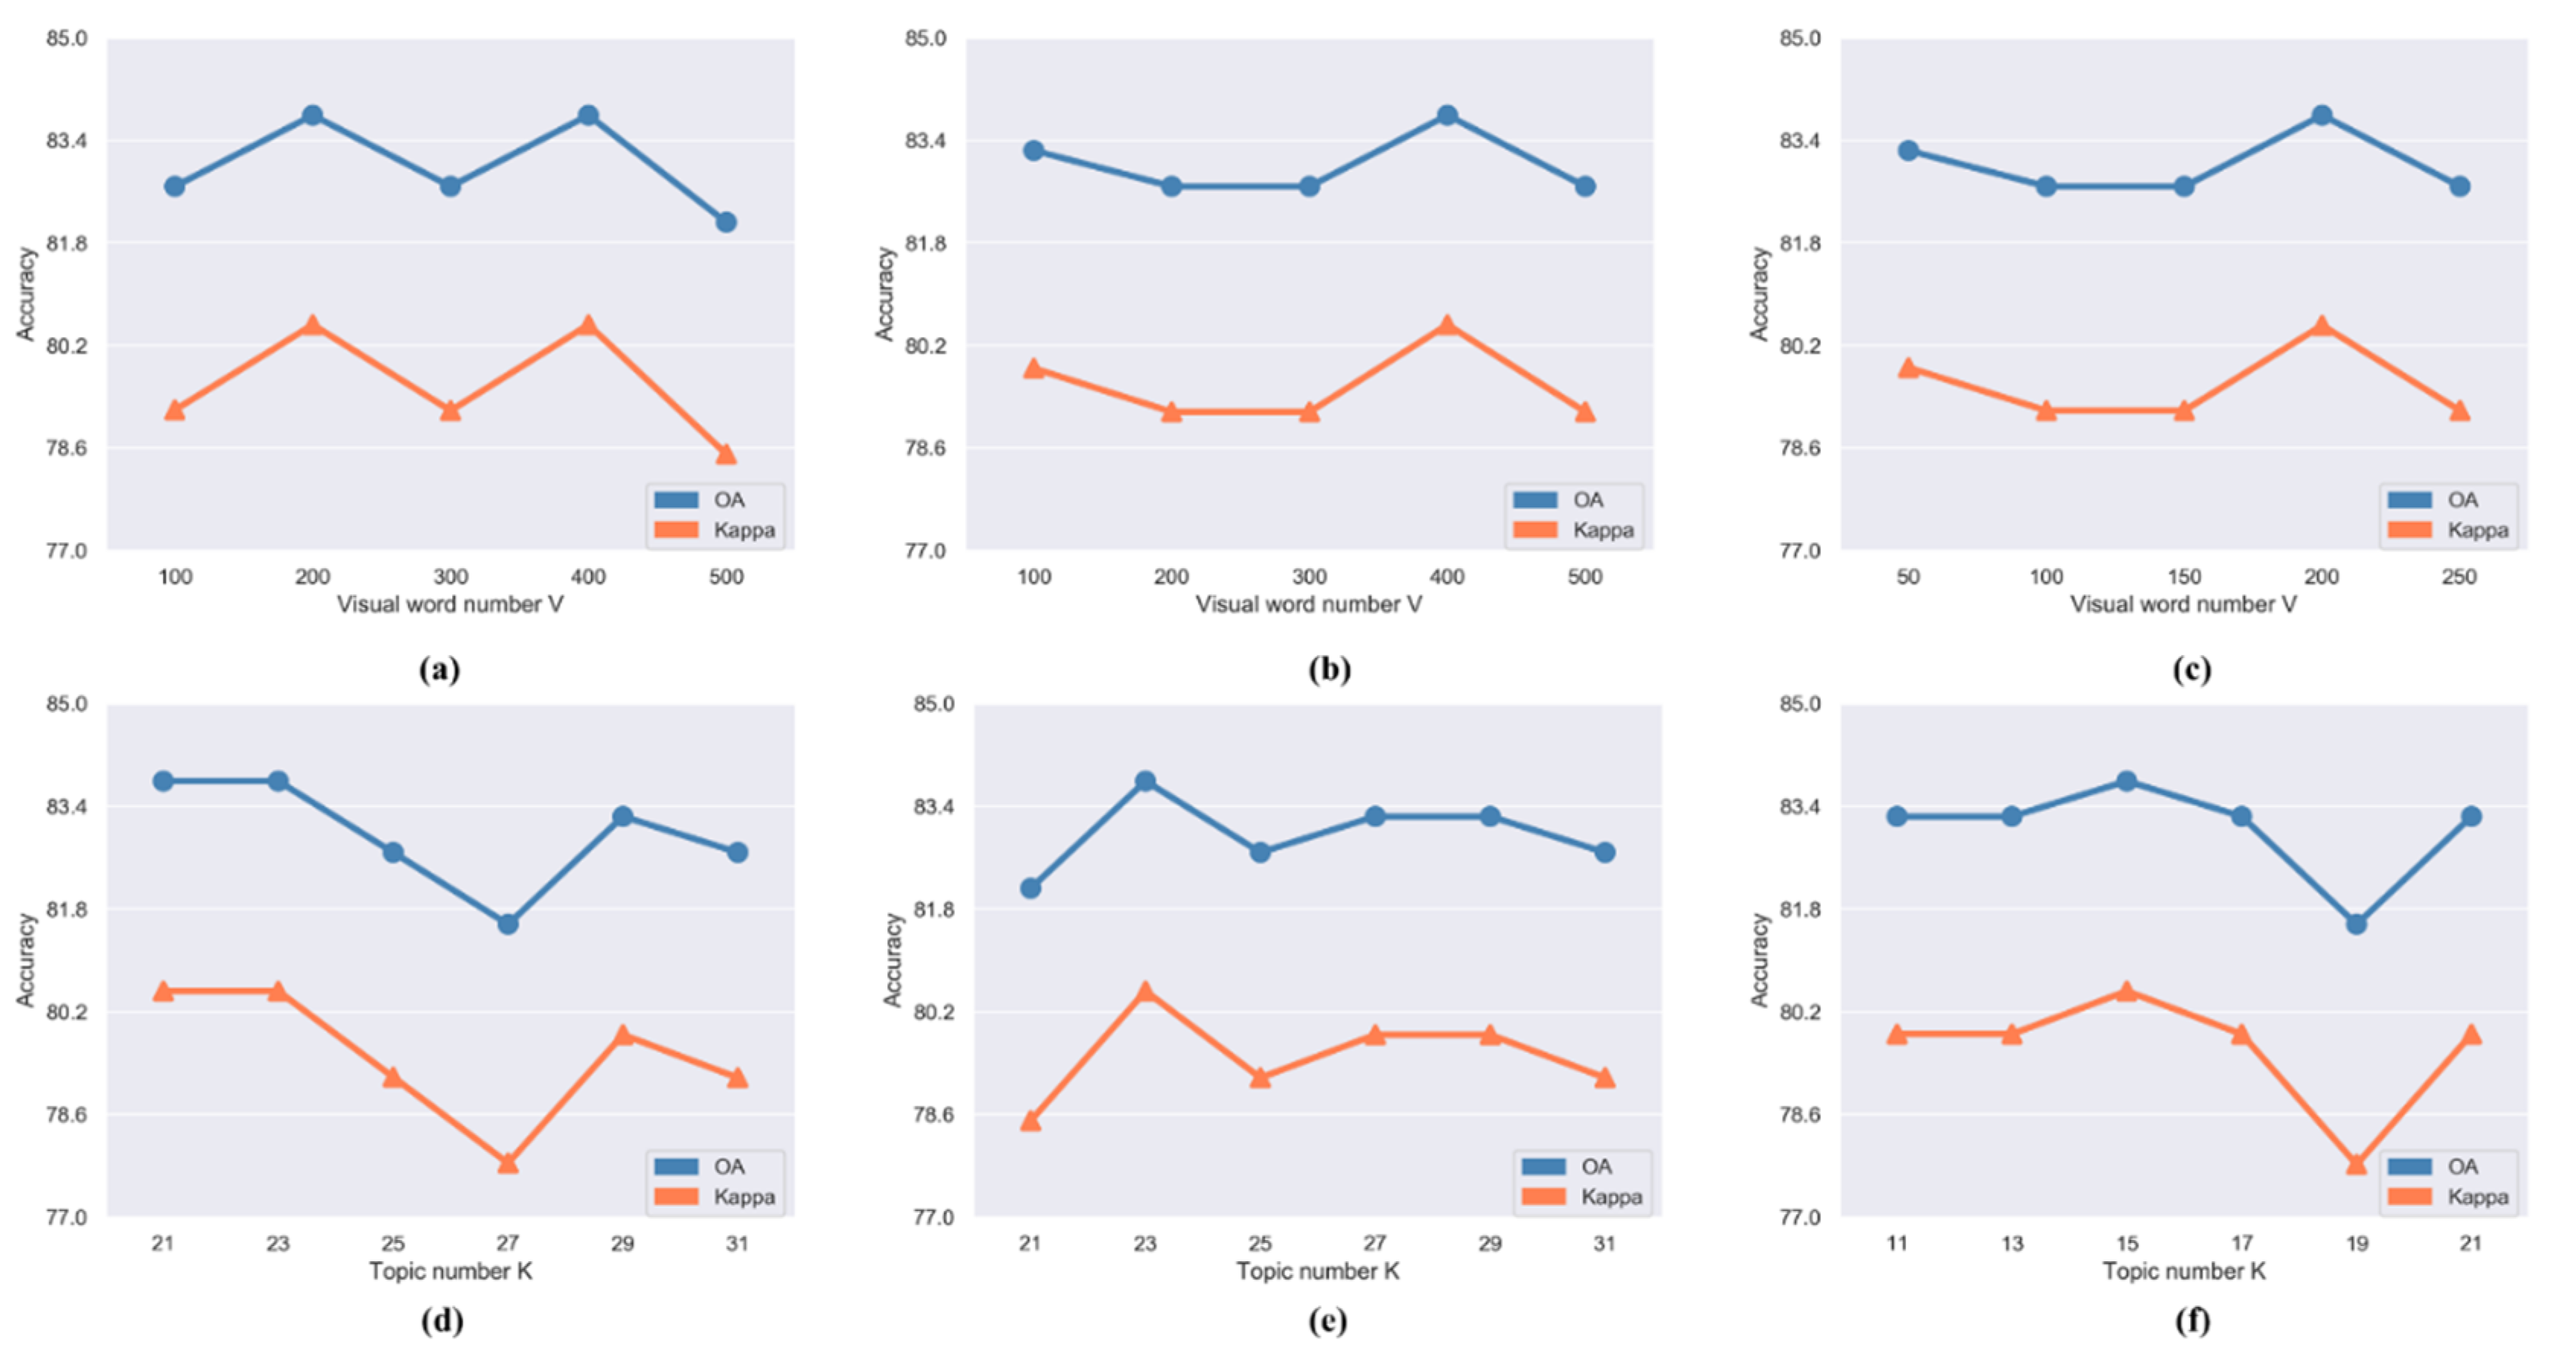
Figure 8 shows that the retrieval results are very sensitive to the values of these parameters.
Figure 8a–c shows the relationship between V with the corresponding accuracy, and Figure 8d–f shows the variation of accuracy when the topic number K is changed. As Figure 8a and b show, the number of words was set as 200 and 400 making the accuracy reach the peak for spectral and textural features, and 200 is the best set for the SIFT feature. After selecting the number of visual words, we found that the numbers of topics to ensure the highest accuracy for the spectral, textural and SIFT features are 23, 23 and 15, respectively. Table 7 shows the best parameters finally selected for the LDA model.

5. Discussion

The selection of a basic unit to fuse remote sensing and social sensing data is an important issue in functional urban land-use mapping. Previous studies have discussed the pros and cons to depict the urban function using road networks [14], but have seldom mentioned other partitions. Based on scene classification, this study proposed a semantic method to classify the urban land-use and discussed the influence of land-use mapping using different partition methods. However, some issues still need to be discussed.
Firstly, the selection of geospatial data which were chosen to classify the functional area, needs to be discussed. This study utilized POIs and remote sensing images to obtain a favorable accuracy for urban land-use classification. High spatial resolution remote sensing images provide rich spectral, textural and spatial information for accurate mapping, which materially aids classification. However, remote sensing data also have many shortcomings in this study. The actual land types under the shadow in the remote sensing image are difficult to distinguish by the features extracted in Section 3.2. Moreover, there is no obvious distinction between commercial and residential buildings in remote sensing images. Due to the crowded land and excessive population density, a building is usually mixed with commercial and residential activities, which also highlights a weakness of POIs in distinguishing those two kinds of buildings. POI data can represent the different space characteristics of human activity to a good degree, but it still cannot separate some categories with distinct temporal characteristics, such as residential and commercial areas. In future studies, some diurnal data should be added to the research—such as Tencent user density, mobile data or luminous remote sensing data. By adding the semantic objects of playgrounds, the education area has been well distinguished from other types. However, playgrounds represent not only the semantic ground objects of educational areas but also public service areas, such as stadiums, which can lead to inaccurate classification. In future studies, more attention should be paid to find representative ground objects to distinguish different functional areas.
Secondly, the machine learning model also has some issues. The LDA model elevates the low-level features to the high-level semantics, which solves the problem of low-level features not being able to distinguish between urban functions. However, the LDA model is still sensitive to parameters. In Section 4.3, the selection of word number V and semantic topic number K has affected the classification performance. It is time-consuming work to find the optimal parameter combination. A more automated way to select the best parameters of the LDA needs to be proposed in following studies.
Thirdly, the issue of mixed parcels also needs to be discussed. Previous studies have designed a metric to quantify the mixture degree [14]. However, the problem of mapping mixed-function zones is still unresolved. The best way to distinguish between mixed functional areas is to discuss them from the standpoint of segmentation scale, however, no appropriate scale and partitioning method existed to solve this problem at present. In this study, a rough judgment has been made on the mixing degree of each block by three different subdividing blocks. The point is that each segmentation type has its suitable occasion, and correctly choosing it would greatly benefit a certain recognition task. Moreover, the scale chosen by different segmentation methods on functional zoning has not discussed in this paper. Therefore, those questions should be considered in future research.
Finally, we draw some conclusions using the table (Table 8) based on the above analysis. Critical data, advantages and disadvantages, application Scenarios of different partitions are summarized as follows.

6. Conclusions

The urban functional zone is the fundamental unit of city analyses and is considered an important component in urban planning and resource management [45]. The requirement of precise urban functional mapping is an inevitable trend for urban studies. Although many studies have focused on functional classification and data fusion, seldom has research discussed how the basic units influence the mapping result. To investigate the problem, this study integrated remote sensing data and POI to delineate the complex pattern of urban functional areas using three types of spatial unit. Features derived from remote sensing images and POI data were represented by the LDA model and random forest was used for classification. The impact of using different spatial units was analyzed and further discussed. The results indicated that the spatial unit has a great influence on the functional classification and mapping, especially for mixed functional areas. This study enables urban planners to be aware of the selection of basic units. The main conclusions are as follows: the accuracy of blocks is enough to map the urban functions but it cannot distinguish the mixed area well; the grid method has satisfactory accuracy, but it cannot make accurate maps according to the shape of ground objects. The object-based method is fine for functional mapping; however, the selection of a proper segmentation method and the corresponding parameters should be further investigated. In addition, semantic objects (such as playgrounds) are significant for the classification of functional areas.
In general, this study discussed the pros and cons of three different partition methods, which can offer advice for future analyses. Due to the particularity of the central area of Shenzhen, there is no industrial zone occupying a large area, therefore, this functional type was excluded from the study. In future work, the industrial zone and other categories should be considered and more experiments are planned in other regions to verify the feasibility of using different spatial units.

Author Contributions

X.D. performed the experiments, analyzed the data and wrote the paper. Y.X. (Yue Xu), and L.H. selected reference sample points and assessed the results; Z.L., K.Z. and Y.X. (Yi Xu) contributed the materials; Z.H. and G.W. revised the manuscript and provided useful suggestions on the experiments. All authors have read and agreed to the published version of the manuscript.

Funding

This research was funded by (National Nature Science Foundation of China, grant number 41871227), (Nature Science Foundation of Guangdong Province, grant number 2020A1515010678), (Basic Research Funding of Shenzhen, grant number JCYJ20190808122405692).

Conflicts of Interest

The authors declare no conflict of interest.

References

  1. Wang, L.; Fang, F.; Yuan, X.H.; Luo, Z.W.; Liu, Y.Y.; Wan, B.; Zhao, Y.S. Urban function zoning using geotagged photos and openstreetmap. In Proceedings of the 2017 IEEE International Geoscience and Remote Sensing Symposium, Fort Worth, TX, USA, 23–28 July 2017; IEEE: New York, NY, USA, 2017; pp. 815–818. [Google Scholar]
  2. Liu, X.; He, J.; Yao, Y.; Zhang, J.; Liang, H.; Wang, H.; Hong, Y. Classifying urban land use by integrating remote sensing and social media data. Int. J. Geogr. Inf. Sci. 2017, 31, 1675–1696. [Google Scholar] [CrossRef]
  3. Jiang, S. Clustering daily patterns of human activities in the city. Data Min. Knowl. Discov. 2012, 25, 478–510. [Google Scholar] [CrossRef] [Green Version]
  4. Gong, C.; Han, J.; Lei, G.; Liu, Z.; Bu, S.; Ren, J. Effective and Efficient Midlevel Visual Elements-Oriented Land-Use Classification Using VHR Remote Sensing Images. IEEE Trans. Geosci. Remote Sens. 2015, 53, 4238–4249. [Google Scholar]
  5. Manonmani, R.; Suganya, G. Remote sensing and GIS application in change detection study in urban zone using multi temporal satellite. Int. J. Geomat. Geosci. 2010, 4, 339–348. [Google Scholar]
  6. Du, S.; Zhang, F.; Zhang, X. Semantic classification of urban buildings combining VHR image and GIS data: An improved random forest approach. ISPRS J. Photogramm. Remote Sens. 2015, 105, 107–119. [Google Scholar] [CrossRef]
  7. Li, M.; Stein, A.; Bijker, W.; Zhan, Q. Urban land use extraction from Very High Resolution remote sensing imagery using a Bayesian network. ISPRS J. Photogramm. Remote Sens. 2016, 122, 192–205. [Google Scholar] [CrossRef]
  8. Lu, C.; Yang, X.; Wang, Z.; Li, Z. Using multi-level fusion of local features for land-use scene classification with high spatial resolution images in urban coastal zones. Int. J. Appl. Earth Obs. Geoinf. 2018, 70, 1–12. [Google Scholar] [CrossRef] [Green Version]
  9. Yuan, N.J.; Zheng, Y.; Xie, X.; Wang, Y.Z.; Zheng, K.; Xiong, H. Discovering urban functional zones using latent activity trajectories. IEEE Trans. Knowl. Data Eng. 2015, 27, 712–725. [Google Scholar] [CrossRef]
  10. Yao, Y.; Xia, L.; Liu, X.; Liu, P.; Liang, Z.; Zhang, J.; Ke, M. Sensing spatial distribution of urban land use by integrating points-of-interest and Google Word2Vec model. Int. J. Geogr. Inf. Sci. 2016, 31, 825–848. [Google Scholar] [CrossRef]
  11. Long, Y.; Shen, Z. Discovering functional zones using bus smart card data and points of interest in Beijing. In Geospatial Analysis to Support Urban Planning in Beijing; Springer: Cham, Switzerland, 2015; pp. 193–217. [Google Scholar]
  12. Yu, L.; Wang, F.; Yu, X.; Song, G. Urban land uses and traffic ‘source-sink areas’: Evidence from GPS-enabled taxi data in Shanghai. Landsc. Urban Plan. 2012, 106, 73–87. [Google Scholar]
  13. Tu, W.; Cao, J.Z.; Yue, Y.; Shaw, S.L.; Zhou, M.; Wang, Z.S.; Chang, X.M.; Xu, Y.; Li, Q.Q. Coupling mobile phone and social media data: A new approach to understanding urban functions and diurnal patterns. Int. J. Geogr. Inf. Sci. 2017, 31, 2331–2358. [Google Scholar] [CrossRef]
  14. Yuan, Z.; Li, Q.; Huang, H.; Wei, W.; Xin, D.; Wang, H. The combined use of remote sensing and social sensing data in fine-grained urban land use mapping: A case study in Beijing, China. Remote Sens. 2017, 9, 865. [Google Scholar] [CrossRef] [Green Version]
  15. Zhang, Y.; Li, Q.; Tu, W.; Mai, K.; Yao, Y.; Chen, Y. Functional urban land use recognition integrating multi-source geospatial data and cross-correlations. Comput. Environ. Urban Syst. 2019, 78. [Google Scholar] [CrossRef]
  16. Hu, T.; Yang, J.; Li, X.; Peng, G. Mapping urban land use by using landsat images and open social data. Remote Sens. 2016, 8, 151. [Google Scholar] [CrossRef]
  17. Tu, W.; Hu, Z.W.; Li, L.F.; Cao, J.Z.; Jiang, J.C.; Li, Q.P.; Li, Q.Q. Portraying urban functional zones by coupling remote sensing imagery and human sensing data. Remote Sens. 2018, 10, 141. [Google Scholar] [CrossRef] [Green Version]
  18. Zhang, X.; Du, S.; Qiao, W. Integrating bottom-up classification and top-down feedback for improving urban land-cover and functional-zone mapping. Remote Sens. Environ. 2018, 212, 231–248. [Google Scholar] [CrossRef]
  19. Tokarczyk, P.; Wegner, J.D.; Walk, S.; Schindler, K. Features, Color Spaces, and Boosting: New insights on semantic classification of remote sensing images. IEEE Trans. Geosci. Remote Sens. 2015, 53, 280–295. [Google Scholar] [CrossRef]
  20. Zhang, X.; Du, S.; Qiao, W. Hierarchical semantic cognition for urban functional zones with VHR satellite images and POI data. ISPRS J. Photogramm. Remote Sens. 2017, 132, 170–184. [Google Scholar] [CrossRef]
  21. Blei, D.M.; Ng, A.Y.; Jordan, M.I. Latent dirichlet allocation. J. Mach. Learn. Res. 2012, 3, 993–1022. [Google Scholar]
  22. Song, G.; Janowicz, K.; Couclelis, H. Extracting urban functional regions from points of interest and human activities on location-based social networks. Trans. GIS 2017, 21, 446–467. [Google Scholar]
  23. Schwalbach, G. Basics Urban Analysis; Birkhäuser: Basel, Switzerland, 2017. [Google Scholar]
  24. Neis, P.; Zipf, A. Analyzing the contributor activity of a volunteered geographic information project ¡ª The case of OpenStreetMap. ISPRS Int. J. Geo-Inf. 2012, 1, 146–165. [Google Scholar] [CrossRef]
  25. Zhang, X.; Du, S.; Yuan, Z. Semantic and spatial co-occurrence analysis on object pairs for urban scene classification. IEEE J. Sel. Top. Appl. Earth Obs. Remote Sens. 2018, 11, 1–14. [Google Scholar] [CrossRef]
  26. Zhang, X.; Du, S. A Linear dirichlet mixture model for decomposing scenes: Application to analyzing urban functional zonings. Remote Sens. Environ. 2015, 169, 37–49. [Google Scholar] [CrossRef]
  27. Xing, H.; Meng, Y. Integrating landscape metrics and socioeconomic features for urban functional region classification. Comput. Environ. Urban Syst. 2018, 72, 134–145. [Google Scholar] [CrossRef]
  28. Chen, Y.; Liu, X.; Li, X.; Liu, X.; Yao, Y.; Hu, G.; Xu, X.; Pei, F. Delineating urban functional areas with building-level social media data: A dynamic time warping (DTW) distance based k -medoids method. Landsc. Urban Plan. 2017, 160, 48–60. [Google Scholar] [CrossRef]
  29. Zhang, X.; Du, S.; Wang, Q.; Zhou, W. Multiscale geoscene segmentation for extracting urban functional zones from vhr satellite images. Remote Sens. 2018, 10, 281. [Google Scholar] [CrossRef] [Green Version]
  30. Blaschke, T.; Strobl, J. What’s wrong with pixels? Some recent developments interfacing remote sensing and GIS. GIS—Z. für Geoinf. 2001, 14, 12–17. [Google Scholar]
  31. Tu, W.; Zhang, Y.; Li, Q.; Mai, K.; Cao, J. Scale effect on fusing remote sensing and human sensing to portray urban functions. IEEE Geosci. Remote Sens. Lett. 2020. [Google Scholar] [CrossRef]
  32. Lin, T.; Sun, C.; Li, X.; Zhao, Q.; Zhang, G.; Ge, R.; Ye, H.; Huang, N.; Yin, K. Spatial pattern of urban functional landscapes along an urban–rural gradient: A case study in Xiamen City, China. Int. J. Appl. Earth Obs. Geoinf. 2016, 46, 22–30. [Google Scholar] [CrossRef]
  33. Haralick, R.M.; Shanmugam, K.; Dinstein, I. Textural features for image classification. IEEE Trans. Syst. Man Cybern. 1973, SMC3, 610–621. [Google Scholar] [CrossRef] [Green Version]
  34. Lowe, D.G. Distinctive Image Features from Scale-Invariant Keypoints. In Proceedings of International. J. Comput. Vis. 2004, 60, 91–110. [Google Scholar] [CrossRef]
  35. Ke, Y.; Wang, Y.; Liang, D.; Huang, T.; Tian, Y. CNN vs. SIFT for Image Retrieval: Alternative or complementary? In Proceedings of the 24th ACM Multimedia Conference, Amsterdam, The Netherlands, 21–25 October 2016. [Google Scholar]
  36. Pesaresi, M.; Gerhardinger, A.; Kayitakire, F. A Robust Built-Up Area Presence index by anisotropic rotation-invariant textural measure. IEEE J. Sel. Top. Appl. Earth Obs. Remote Sens. 2009, 1, 180–192. [Google Scholar] [CrossRef]
  37. Hua, B.O.; Fu-Long, M.A.; Jiao, L.C. Research on computation of GLCM of image texture. Acta Electron. Sin. 2006, 1, 155–158. [Google Scholar]
  38. Ulaby, F.T.; Kouyate, F.; Brisco, B.; Williams, T.H.L. textural information in sar images. IEEE Trans. Geosci. Remote Sens. 1986, 24, 235–245. [Google Scholar] [CrossRef]
  39. Yang, J.; Kai, Y.; Gong, Y.; Huang, T. Linear spatial pyramid matching using sparse coding for image classification. In Proceedings of the 2009 IEEE Conference on Computer Vision and Pattern Recognition, Miami, FL, USA, 20–25 June 2009; pp. 1794–1801. [Google Scholar]
  40. Zhao, F.; Hao, S.; Shuai, L.; Zhou, S. Combining low level features and visual attributes for VHR remote sensing image classification. In Proceedings of the International Symposium on Multispectral Image Processing & Pattern Recognition, Enshi, China, 14 December 2015. [Google Scholar]
  41. Ramage, D.; Hall, D.; Nallapati, R.; Manning, C.D. Labeled LDA: A supervised topic model for credit attribution in multi-labeled corpora. In Proceedings of the Conference on Empirical Methods in Natural Language Processing, Singapore, 6–7 August 2019; pp. 248–256. [Google Scholar]
  42. Lienou, M.; Maitre, H.; Datcu, M. Semantic Annotation of Satellite Images Using Latent Dirichlet Allocation. IEEE Geosci. Remote Sens. Lett. 2010, 7, 28–32. [Google Scholar] [CrossRef]
  43. Li, Y.; Huang, X.; Liu, H. Unsupervised Deep Feature Learning for Urban Village Detection from High-Resolution Remote Sensing Images. Photogramm. Eng. Remote Sens. 2017, 83, 567–579. [Google Scholar] [CrossRef]
  44. Taubenböck, H.; Klotz, M.; Wurm, M.; Schmieder, J.; Wagner, B.; Wooster, M.; Esch, T.; Dech, S. Delineation of Central Business Districts in mega city regions using remotely sensed data. Remote Sens. Environ. 2013, 136, 386–401. [Google Scholar] [CrossRef]
  45. Xing, H.F.; Meng, Y. Measuring urban landscapes for urban function classification using spatial metrics. Ecol. Indic. 2020, 108. [Google Scholar] [CrossRef]
  46. Hu, Z.; Zhang, Q.; Zou, Q.; Li, Q.; Wu, G. Stepwise Evolution Analysis of the Region-Merging Segmentation for Scale Parameterization. IEEE J. Sel. Top. Appl. Earth Obs. Remote Sens. 2018, 11, 2461–2472. [Google Scholar] [CrossRef]
  47. Peng, J.; Wang, Y.; Zhang, Y.; Wu, J.; Li, W.; Li, Y.J.E.I. Evaluating the effectiveness of landscape metrics in quantifying spatial patterns. Ecol. Indic. 2010, 10, 217–223. [Google Scholar] [CrossRef]
  48. Zhu, Q.; Zhong, Y.; Wu, S.; Zhang, L.; Li, D. Scene Classification Based on the Sparse Homogeneous-Heterogeneous Topic Feature Model. IEEE Trans. Geosci. Remote Sens. 2018, 56, 1–15. [Google Scholar] [CrossRef]
  49. Xing, W.; Croft, W.B. LDA-based document models for ad-hoc retrieval. In Proceedings of the International Acm Sigir Conference on Research Development in Information Retrieval, Piscataway, NJ, USA, 13 August 2007; pp. 1276–1287. [Google Scholar]
  50. Zhong, Y.; Zhu, Q.; Zhang, L. Scene classification based on the multifeature fusion probabilistic topic model for high spatial resolution remote sensing imagery. IEEE Trans. Geosci. Remote Sens. 2015, 53, 6207–6222. [Google Scholar] [CrossRef]
Figure 1. Illustration of traffic analysis zone (TAZs) with mixed land use types.
Remotesensing 12 03597 g001
Figure 2. Location of Futian District and remote sensing image. (a) Remote sensing image. (b) Road network data and point of interests (POIs).
Remotesensing 12 03597 g002
Figure 3. A framework for exploring the impact of spatial unit on urban land use mapping. LDA: latent Dirichlet allocation; SIFT: scale invariant feature transform; PG: playground.
Remotesensing 12 03597 g003
Figure 4. Land cover map derived from GF-2 image using object-based image classification.
Remotesensing 12 03597 g004
Figure 5. Confusion matrix of three different partition methods. (a) Block, (b) Grid, (c) Object. (R—Residential; C—Commercial, P—Public, E—Educational, U—Urban village, N—Natural).
Remotesensing 12 03597 g005
Figure 6. The rank of feature importances (top 30) (a) Block, (b) Grid and (c) Object.
Remotesensing 12 03597 g006
Figure 7. Final classification maps of the Futian district (a) the ground-truth map, (b) the block level map, (c) the grid level map, (d) the object level map, (e) GF2 image and ground-truth map, (fh) the enlarged areas of (bd), respectively.
Remotesensing 12 03597 g007
Figure 8. Accuracy assessment (ac) y-axis is the accuracy, x-axis is the visual word number V; (df) y-axis is the accuracy, x-axis is the topic number K.
Remotesensing 12 03597 g008
Table 1. Landscape metrics selected in this study.
AbbreviationDescription
Total Class Area (CA) Total area of one class landscape.
Patch Density (PD)Patch count per square km of one class landscape
Number of Patches (NP)Total number of patches.
Percentage of Landscape (PLAND)Percentage of parcel area.
Landscape Division Index (LDI)Division is based on the cumulative patch area distribution and is interpreted as the probability that two randomly chosen pixels in the landscape are not situated in the same patch.
Shannon’s diversity index (SHDI)Shannon’s diversity index is a popular measure of diversity in community ecology, applied here to landscapes. Shannon’s index is sensitive to rare patch types.
Table 2. Different combinations of attribute categories with different segmentation (OA: overall accuracy).
Exp.Selected FeaturesBlockGridObject
SpectralTexturalSIFTPOILMPGsOAKappaOAKappaOAKappa
A 62.3748.9163.0255.6258.9150.70
B 66.4859.6865.7658.9274.0568.87
C 83.7980.5275.5270.0277.8473.40
D 82.1278.5080.2076.2477.2972.76
E 84.3581.1883.3379.9979.4575.34
F86.5983.8783.8580.6281.6277.93
Table 3. Produce’s accuracy (PA) and user’s accuracy (UA) of urban functional classification using different segmentations.
Land Use TypeAvg. AccuracyDifferent Spatial Units
BlocksGridObject
ResidentialPA0.8390.7110.938
UA0.8390.8710.968
CommercialPA0.8160.8790.743
UA0.9690.9060.813
Public ServicePA0.7270.8620.653
UA0.5330.8060.500
EducationPA0.8610.8150.800
UA0.9390.6670.848
Urban villagePA1.0000.8330.857
UA0.9600.8820.828
Natural landPA0.9640.9660.875
UA0.9640.9030.933
Table 4. Confusion matrix of block level land use mapping.
ReferenceR 1C 2P 3E 4U 5N 6TotalUser’s (%)
Classified
R67611418083.75
C273454617744.15
P244551228862.50
E493418518022.50
U181106208275.61
N21000778096.25
Total1874966247982487
Producer’s (%)35.8369.3983.3375.0078.4893.90
Overall accuracy (%) 64.27
1 R—Residential, 2 C—Commercial, 3 P—Public, 4 E—Educational, 5 U—Urban village, 6 N—Natural.
Table 5. Confusion matrix of gird level land use mapping.
ReferenceRCPEUNTotalUser’s (%)
Classified
R448187128055.00
C823343907729.87
P64693518878.41
E1481340508050.00
U57416508279.27
N00401758093.75
Total7750142548678487
Producer’s (%)57.1446.0048.5974.0775.5896.15
Overall accuracy (%) 64.88
Table 6. Confusion matrix of object level land use mapping.
ReferenceRCPEUNTotalUser’s (%)
Classified
R541093228067.50
C1442132427754.54
P93684318877.27
E1851639118048.75
U612026208275.61
N0000080801.00
Total10172106507286487
Producer’s (%)53.4758.3364.1578.0086.1193.02
Overall accuracy (%) 70.84
Table 7. Best parameter.
SpectralTexturalSIFT
V200400200
K232315
Table 8. Summary of different segmentation methods.
Basic UnitBlockGridObject
Case
Critical dataGF2 images, POILand-cover dataPOI
Mix-used parcelsManyManyFew
Applicable typesUrban villages, Natural landUrban villages, Natural landUrban villages, Natural land, Residential land
Mapping QualityModerateCoarseFine
Overall accuracyMediumMediumHigh
Application ScenariosThe foundation of the subsequent analysis.Suitable for point data feature sets (GPS, trajectory data, etc.)Accurate mapping of large-scale urban functional zones
Publisher’s Note: MDPI stays neutral with regard to jurisdictional claims in published maps and institutional affiliations.

