Abstract
A large part of the population in low-income countries (LICs) lives in fragile and conflict-affected states. Many cities in these states show high growth dynamics, but little is known about the relation of conflicts and urban growth. In Afghanistan, the Taliban regime, which lasted from 1996 to 2001, caused large scale displacement of the population. People from Afghanistan migrated to neighboring countries like Iran and Pakistan, and all developments came to a halt. After the US invasion in October 2001, all the major cities in Afghanistan experienced significant population growth, in particular, driven by the influx of internally displaced persons. Maximum pressure of this influx was felt by the capital city, Kabul. This rapid urbanization, combined with very limited capacity of local authorities to deal with this growth, led to unplanned urbanization and challenges for urban planning and management. This study analyses the patterns of growth between 2001 and 2017, and the factors influencing the growth in the city of Kabul with the help of high-resolution Earth Observation-based data (EO) and spatial logistic regression modelling. We analyze settlement patterns by extracting image features from high-resolution images (aerial photographs of 2017) and terrain features as input to a random forest classifier. The urban growth is analyzed using an available built-up map (extracted from IKONOS images for the year 2001). Results indicate that unplanned settlements have grown 4.5 times during this period, whereas planned settlements have grown only 1.25 times. The unplanned settlements expanded mostly towards the west and north west parts of the city, and the growth of planned settlements happened mainly in the central and eastern parts of the city. Population density and the locations of military bases are the most important factors that influence the growth, of both planned and unplanned settlements. The growth of unplanned settlement occurs predominantly in areas of steeper slopes on the hillside, while planned settlements are on gentle slopes and closer to the institutional areas (central and eastern parts of the city). We conclude that security and availability of infrastructure were the main drivers of growth for planned settlements, whereas unplanned growth, mainly on hillsides, was driven by the availability of land with poor infrastructure.
1. Introduction
Rapid urbanization of cities is a universal trend, posing problems and challenges, which need to be addressed by urban planners. The growth of population has forced the growth of urban centres, which has led to problems like demand for housing, jobs, infrastructure and other essential services, along with environmental degradation. This phenomenon needs to be mapped for predicting future growth patterns and requirements for land use planning [1]. Evaluation of the driving factors like socio-economic, utility services, population, environmental factors (slope, natural hazard) and land use zoning, which are responsible for the expansion, is needed to understand past trends and to predict future patterns [2]. However, in many rapidly growing cities in low and middle-income countries (LMICs), such information is not readily available, due to the unplanned nature of the growth and a lack of updated spatial and non-spatial datasets [3]. As part of LMICs, cities in conflict zones are in particular impacted by the interplay of rapid urbanization, mostly in the form of unplanned development, and the absence of data to monitor and guide urban development. Examples of such cases are the cities of Afghanistan. Afghanistan is experiencing unprecedented urban expansion, like many other countries in the region. The Ministry of Urban development and land (MoUDL) has predicted that Afghanistan’s urbanization rate will double by 2030 [4]. Most of this urbanization is concentrated in the capital city, Kabul. The growth in population due to a large number of returnees and internally displaced people has led to massive unplanned growth of the city. An official survey [5] indicated that up to 93% of urban households live in conditions of physical and environmental deprivation, which emphasizes the need to upgrade urban centers across the country.
Historically, many models have been applied to study urban dynamics. Some of these models include Von Thunen’s land use model and urban growth theory, which explains how the market forces control the spatial distribution of land use and urban growth. In 1926, Burgess proposed the concentric zone theory, while in 1933 Walter Christaller proposed the central place theory, the sector theory, the multiple nuclei theory and finally the bid rent theory [2]. In recent years, advanced spatial modelling techniques have been increasingly combined with EO, in particular machine learning and statistical techniques, to understand and explain the urban environment [3]. These models have been applied to many cities to analyze patterns of urban growth, and the factors influencing this growth [6]. There are two main advantages of using machine learning-based methods. Firstly, machine learning models train on its own from historical datasets and are able to map the dynamics, and secondly, different image features can be incorporated as part of the machine learning, and, thus, they optimize decisions based on training data [1].
There are several machine learning algorithms, which can be used to analyze urban growth patterns using remotely sensed data. In general, such algorithms (e.g., support vector machine, decision tree and random forest) allow obtaining highly accurate classification results with limited field observations [6]. Such classification results are commonly used as input for urban growth models [7]. Historical data and urban growth models equip urban planners to make a prediction on how the cities would look like in the future. Machine learning approaches have been combining textural, spectral and structural features, with studies confirming the robust performance of the random forest classifier (RFC) for general land-cover mapping and for extracting slums [8]. For example, Ref. [9] compared a random forest classifier with a simple decision tree classifier for a complex heterogeneous land-cover area. The study concluded that random forest performs well in differentiating different categories of areas. Object-oriented classification methods are gaining popularity as compared to pixel-based classification, as they are well suited for urban growth modelling studies [6]. To delineate the boundaries of urban settlements, pixel-based approaches and high-resolution images cannot represent the heterogeneity of complex urban environments [2]. A recent study [1] combined dynamic urban variables like population distribution with binary urban footprints and multi-class urban footprints to develop an urban growth framework. According to the authors, a data-driven urban growth framework needs to be simple and flexible, allowing additional variables to be added to make it robust. Their results indicated that the framework could be applied to any city in the world by using the GHSL and the LANDSAT dataset.
Many studies exist that analyzed the urban growth and drivers of urban growth. For example, Ref. [10] modelled urban expansion based on vector features to find the relationship between urban growth and biophysical and socio-economic factors as independent variables. The result shows that the model simulates well in a small area. Commonly, logistic regression modelling is applied to identify drivers of urban growth. For example, in a study on Kigali, Rwanda [7] logistic regression was used to analyse the spatio-temporal growth of Kigali city. The drivers of growth were identified, and three scenarios of growth for the future patterns for a period of 26 years are predicted using expansion (normal growth) and two densification scenarios (zoning implications). It was concluded that the neighborhood factor was the most important factor for urban growth. Another study [11] used a spatial logistic regression (SLR) model to understand the different types of urban growth and to predict future growth. The study constructed three binary SLR models, the overall urban growth model, the infill growth model and the expansion model. The study concluded that, though the SLR based urban growth models have certain limitations, they are suitable for studying the structural effects of determinants on the landscape and to understand their relative importance. Spatial metrics are used for land cover change analysis to study the expansion of Pune metropolis [12], and to understand the spatio-temporal dynamics of urban expansion using remote sensing data. The study, using metrics like patch shape, edge, diversity, etc., concluded that urban expansion metrics are useful tools to study urban growth. The result revealed that urban expansion rate and pattern vary across the study area, due to different government policies. To identify factors that influence spatial patterns of urban expansion in Africa, boosted regression tree models were developed to predict spatial patterns of rural-urban conversion in large African cities [13].
The factors influencing urban expansion in all major cities in the world vary for different time periods in different geographical regions. Major groups of factors driving urban expansion have been summarized by [14] as biophysical constraints and potentials, economic factors, social factors, spatial interaction and neighbourhood characteristics and spatial policies and their effectiveness. It becomes crucial to understand the factors responsible for urban growth to mitigate the adverse impacts of such expansion. For example, in Beijing, the urban expansion from 1972 to 2010, was detected from multi-temporal images for four time periods using a binary logistic regression model [15]. In a study on western Tarai region in Nepal [16], historical land-use and land-cover (LULC) transformations are examined from 1989 to 2016 to predict future urban expansion trends for 2026 and 2036. The study used bio-physical factors applying the artificial neural network—Markov chain—to model the LULC transition. Distance-based variables were created for the model; the results showed that distance to road, distance to built-up areas, distance to cultivated land were the main drivers of urban growth. The other factor that also impacted the growth was elevation.
In Afghanistan, various factors have affected the urban development during different time periods and make it an interesting study. From early 1970 to 1989, the urbanization in Afghanistan was mainly governed by social and political factors like unstable governments, safety and security and government spending on public services. The first master plan for Kabul city was created in 1964 by the Soviet government under an agreement with the Afghan government. The first achievement of the master plan was a housing project completed with funds from the Soviet government. The third master plan was finalized in 1978, which is still in place and caters for a population of 2 million and any development outside the plan boundaries is treated as violation of the plan. The present population has more than doubled than the planned figure (Figure 1). After the Soviet invasion in 1979, large migration took place from rural areas to the city of Herat and Jalalabad, and to the neighboring countries of Pakistan and Iran. The civil war from 1992 to 1996 had a violent impact in the city of Kabul, which led to the fleeing of 100,000 residents and destruction of more than 60% of private houses and other urban infrastructure and social systems like education, medical and other services [17]. During the subsequent Taliban regime, urban development came to a standstill due to lack of funds [4]. As can be seen from the historical background, Kabul has seen emigration and immigration through various stages of its history that have been the main drivers of urban expansion and its pace.
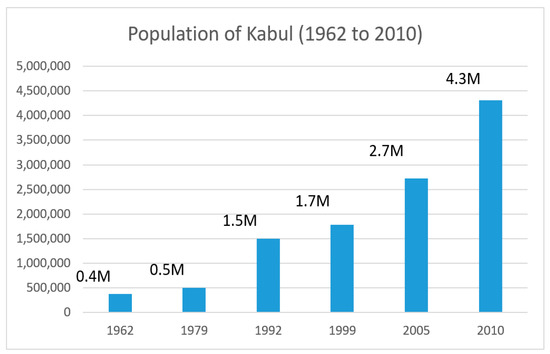
Figure 1.
Population from the period 1962 to 2010 (Source: Draft Kabul City Master Plan, RECS International Inc. Yachiyo Engineering Co., Ltd.).
Most urban models have been applied in areas under normal conditions, while there are very few studies that focus on urban growth dynamics in the context of a conflict zone. An exception is a study on the urban development in Kabul City, Afghanistan [18]. Here, the relationship of factors like population growth, migration and economic growth with expansion of urban land has been explored. The study uses the Kabul land use master plan of different vintages, satellite data, population census, economic development report and natural environment and social development report. However, factors specific to a conflict zone have not been considered in this research or any past research. In our study, we analyze the patterns of urban growth in Kabul by including and analyzing factors specific to conflict zones. This research makes use of multi-temporal data and machine learning to map the growth and analyze the importance of factors that drive urban growth, including those specific to a conflict zone. Thus, the main aim of the study is to analyze the patterns of urban growth in a conflict zone using multi-temporal EO-based data.
2. Materials and Methods
2.1. The Study Area
Afghanistan, as an example of a conflict zone, has experienced unprecedented growth in urban population. After the US invasion in October 2001 when the US and allied forces drove the Taliban out of power, all the major cities in Afghanistan have experienced significant population growth [16]. Most cities are experiencing an influx of returned refugees and internally displaced persons. Afghanistan is also one of the poorest countries in the world in terms of human development [19]. This rapid urbanization, combined with a very limited capacity of local authorities to deal with this growth, leads to an increase in poor and vulnerable populations, which poses a challenge in urban planning and management.
The city of Kabul, capital and largest city of Afghanistan is located in the eastern part of the country at 34° 32′ 38.0256″ N and 69° 9′ 38.3472″ E, and at an elevation of 1798 m above sea level. Kabul is also a municipality forming a part of the Kabul Province. Kabul city is divided into 22 districts called “Nahiyas”. Figure 2 shows the geographical location of the city. Kabul is the fifth fastest-growing city in the world; its population has grown from about 1.5 million in 2001 to around 5 million people in 2015. The rapid urbanization has not been able to keep up with the demands of the growing population in a city, which was originally designed for around 700,000 people. This caused about 70% of the inhabitants of Kabul to live in informal areas, which have been developed without formal planning [20]. The total built-up area of Kabul city region is 40,143 ha, out of which 17,335 ha is for residential use and 1006 ha for commercial use [21]. The primary factor and the driving force behind the urban land expansion of the city is economic growth [17].
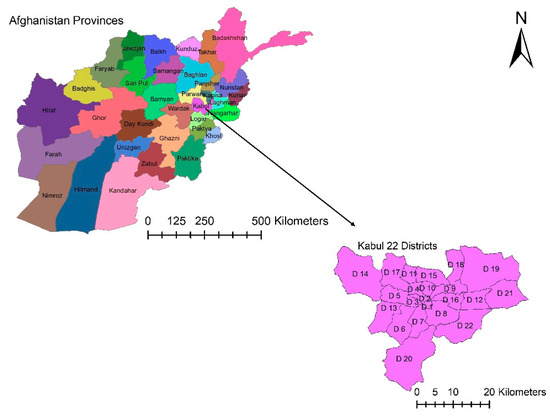
Figure 2.
Map showing the geographical location of the city of Kabul.
2.2. Data Sources and Overview of the Methodology
To analyze urban dynamics between the periods 2001 (start of the conflict “operation enduring freedom”) to 2017, efforts were made to acquire imagery prior to October 2001. However, there are no high-resolution imageries available within the various organizations in Kabul. Therefore, the standard 30 m resolution product of the Global Human Settlement Layer (GHSL) for the year 2014 was acquired and assessed [22]. However, we observed that the GHSL was not suitable because most of the built-up areas have not been captured in the layer (Figure 3). Some of the unplanned built-up area has also not been captured in the GHSL layer as can be seen in the enlarged image marked in Figure 4. Consequently, built-up data for the year 2001 was extracted from IKONOS imagery (1 m resolution) by JRC (Joint Research Centre, Italy) using MASADA software, which was developed for generating the Global Human Settlement Layer. Aerial photographs with a sub-meter resolution for the year 2017 were acquired from CRIDA (Capital Region Independent Development Authority) (https://www.crida.gov.af/en). Aerial photographs for the year 2017 were processed to analyze patterns of growth in the city in a span ranging from 2001 to 2017.
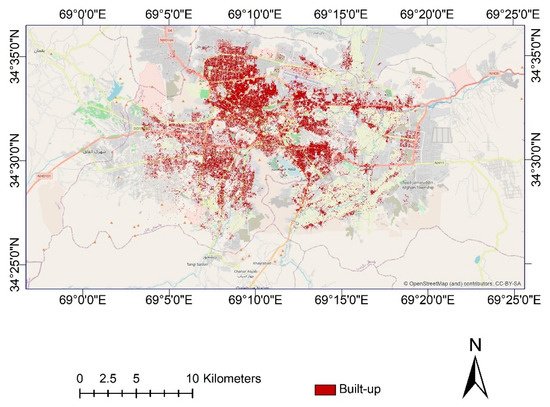
Figure 3.
Global Human Settlement Layer of 2014 shown on an OpenStreetMap of Kabul City.
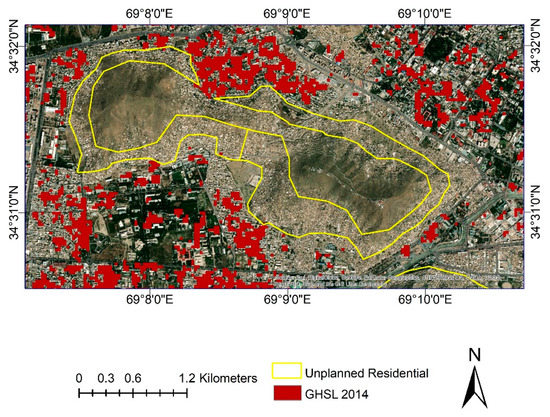
Figure 4.
Global Human Settlement Layer (GHSL) of 2014 overlaid on ESRI world imagery showing settlements not captured by Global Human Settlement Layer (Data Source: https://ghsl.jrc.ec.europa.eu/datasets.php).
The data pre-processing of the aerial photographs required resampling, mosaicking and producing a subset of the scenes on the basis of the extent of the study area, which is the city of Kabul, covering an area of 1023 km2. Since the aerial photographs consisted of noise, one of the important steps in pre-processing involved removing the noise from the aerial photograph. The noise in the aerial photographs consisted of pixels with no values, which is corrected using masking operations. Aerial photographs are classified using the random forest algorithm.
Using as input the built-up layer extracted from the IKONOS imagery of 2001 and the land cover/use map of 2017, spatial logistic regression is used for identifying factors impacting the growth patterns. The data is acquired from various secondary sources. The data was collected from different sources in Kabul, government publications and data provided by JRC (built-up layer extracted from IKONOS imagery of 1 m resolution). The imageries procured from CRIDA were of poor radiometric quality, the best imagery was chosen for further processing. The changes in the planned and unplanned settlements are analyzed using high-resolution aerial photograph provided by CRIDA and built-up layer provided by JRC were used for processing. The flowchart (Figure 5) shows the process followed.
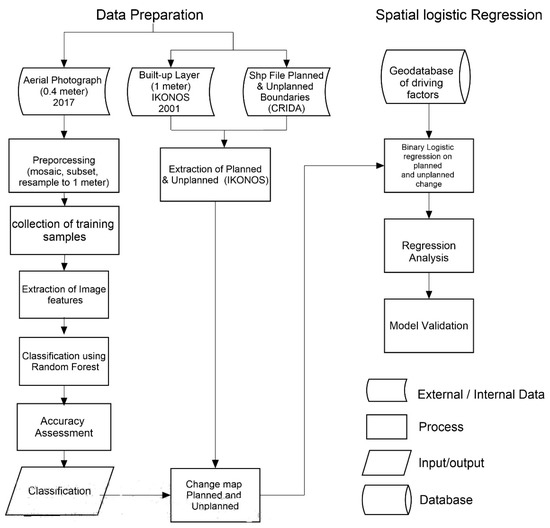
Figure 5.
Flowchart showing the methodology.
2.3. Classification and Urban Growth Modelling
Aerial photographs for the year 2017 and the IKONOS built-up layer (2001) are of different spatial resolution, therefore, pre-processing of the data involved resampling the aerial photograph to a resolution of 1 m and mosaicking the scenes that cover the extent of the study area. The photograph for the year 2017 consisted of noise and had pixels with no value, which is resolved by applying masking operation.
There are two main categories of classes the built-up and non-built-up. Built-up are further classified as planned and unplanned. The classes were on the basis of delineated boundaries of planned and unplanned provided by CRIDA (Capital Region Independent Development Authority) as shape file. In general, there are mainly detached houses and very few high-rise buildings. Since early 2000, a few housing complexes have been built, and a few more are underway to cater for the growing population of Kabul. These housing complexes are mostly located at the outskirts of the city. All the hillside settlements built on slopes are unplanned. However, the construction of the unplanned settlements is similar to the planned settlements. The only defining feature for the unplanned settlement is the lanes (less than 5 m) separating the buildings, which are much narrower than the lanes in the planned settlements.
2.3.1. Image Classification
The commonly used machine learning algorithms used for classification are support vector machine (SVM), neural network and random forest. Support vector machines (SVMs) have been applied in a number of research papers and have been compared with other machine learning algorithms for their performance in land use classification. The aim of SVM classification is to find best linear separation that separates the samples of two classes by minimizing training errors. In case of computational requirements, SVMs work well with small data sets with fewer outliers [23]. Another machine learning algorithm, that has been widely applied for land use classification is deep learning methods. Convolutional neural network (CNN) fall in the class of deep learning that also refers to artificial neural network, which is group of techniques facilitating the learning, retrieval and analysis of information (patterns and data representations) that are deeply hidden in the input data. Deep learning algorithms work well with relatively large datasets with supporting infrastructure to train them in reasonable time [24]. Random forest is chosen for the image classification as it is computationally efficient and can handle a large number of features without affecting the overall accuracy of the classification. It can also handle large datasets efficiently. Another advantage of random forest is its capability to determine the importance of variables in classification. It is robust and accurate to outliers and noise. Random forest can be used for both regression and classification. The concept is based on growing an ensemble of decision trees and letting them vote for the most popular class on the basis of a set of rules. An example of an ensemble of decision trees is bagging introduced by Leo Breiman in 1996 [25], where, to grow each tree, a random selection is made from examples in training sets. Bagging predictors is a method of generating multiple versions of predictors and using them to generate an aggregated predictor. Multiple versions are formed by making bootstrap copies of training sets and using these as new training sets. The bagging concept gives an improvement in accuracy of classification/regression. The image features used for the classification (spectral, texture and structural) are shown in Table 1.

Table 1.
List of image features included in the random forest classification (adapted from [20]).
Feature extraction inacludes Grey Level Co-occurrence Matrix (GLCM), red green Normalize Difference Vegetation Index (rgNDVI), red blue Normalize Difference Vegetation Index (rbNDVI), Visible Atmospherically Resistant Index (VARI), Laplacian edge detection filter. DEM (digital elevation model) and slope are additional geospatial features used as image features. There are in total of 35 images features, which are selected to be included in the random forest classification of the study area. The parameters defined for the GLCM texture feature extraction are: (1) processing window size of 3 * 3, as the resolution of the photographs was 1 m the window size is best suited; (2) grey quantization levels set to 64; and (3) a co-occurrence shift of 1. The texture computed are mean, variance, homogeneity, contrast, dissimilarity, entropy, second moment and correlation.
2.3.2. Collection of Training Samples
The training samples are collected using visual interpretation and an equal number of samples are collected for each class (with a minimum point spacing of 5 m). As a proportion of the full image to be analysed the number of training samples would represent less than 1% to 5% [26]. For accuracy assessment, an adequate number of reference samples for each class are collected from high-resolution aerial photographs. According to [26], the rule-of-thumb of a minimum of 50 samples per class should be collected for a satisfactory confusion matrix. The number of training samples collected was 600 samples for each of the seven classes shown in Figure 6. Reference samples are collected from a high-resolution aerial photograph from the year 2016. For each class, 50 samples were collected to check the accuracy of the classification.
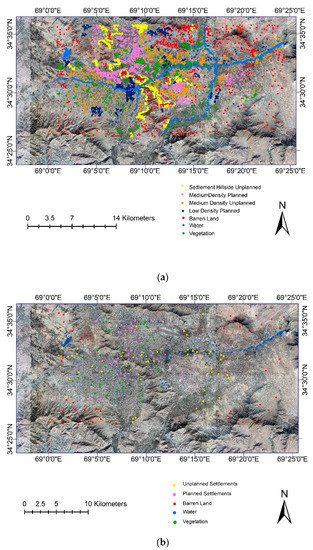
Figure 6.
Aerial photographs for the year 2017 showing the location of (a) training samples and (b) reference samples.
2.3.3. Spatial Logistic Regression
There are several statistical analysis techniques like multiple regression, linear regression, log linear and logistic regression. Compared with multiple regression and log-linear regression, which analyze data where both independent and dependent variables are numerical, logistic regression is appropriate in estimating binary dependent variables. Urban growth phenomenon is a complex phenomenon, which does not usually follow normal assumptions. Its factors are mostly a mixture of continuous and categorical variables [27]. Logistic regression model can be used to analyze driving forces having spatial characteristics and can interpret the influence of the driving factors. Logistic regression models allow for incorporating socio-economic variables with other spatial variables. Therefore, in the present study, binary logistic regression was performed for analyzing the factors influencing the patterns of urban growth in a city under conflict. The classified image and the IKONOS built-up layer was used to extract the change. There are five dimensions of independent variables, which are considered for the logistic regression. Different independent variables that were used for the spatial logistic regression are shown in Table 2.

Table 2.
List of factors influencing patterns of urban growth.
The above factors are considered keeping in mind the conflict situation in the country and the growth of the population from 2001 to 2017. Population density for 22 districts in the study area is shown in Figure 7. These factors are specific to the city of Kabul. A survey was conducted using SurveyMonkey, and responses from experts from the ministry and development authority were obtained to gather local knowledge to understand the factors that are influencing the growth of Kabul city. The primary data was also collected through interview and discussions with CRIDA officials. The socio-economic factors and the conflict factors are vulnerable locations since these locations have been attacked and have a probability of being attacked in the future. These vulnerable locations are embassies, ministries, mosques, educational institutions, hospitals, hotels and restaurants. All these factors are mostly centrally located and therefore have high locational similarity.
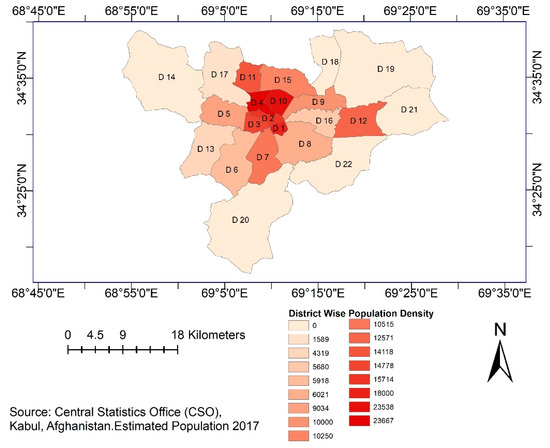
Figure 7.
Population distribution map of Kabul city.
3. Results
In Kabul city, it is more challenging to classify land cover/use as compared to other cities. The challenges are due to the very little vegetation cover caused by its cold semi-arid climate, the topography (areas of bare rocks and built-up are easily mixed) and the complex urban development patterns. Therefore, the performance of standard image classification methods is lower as can be observed in many global built-up and landcover products (see for example Figure 2). Therefore, a first step was to assess the most important image features to produce a land cover/use map. One of the outputs of the classification is the feature importance table, which measures the importance of the features by calculating the increase in the model’s prediction error after permuting the features. There are two measures of feature importance that can be used for image feature selection in random forest classification.
- (a)
- Gini decrease (also refered to as the mean decrease in Gini coefficient): During the implementation of random forest, predictor variable importance is calculated by using Gini importance, that is used to determine the nodes of individual decision trees to generate mean decrease of impurity (MDI) value, which is used to rank variables importance to the model. A higher mean decrease in Gini indicates higher variable importance [28].
- (b)
- Permutation importance (PIMP): The PIMP of a feature is computed as the average decrease in model accuracy on the out of the bag samples when the values of respective features are randomly permuted [28].
3.1. Classification
The classification was performed using all the 35 image features. As can be seen from the graphs Figure 8 and Figure 9, DEM (dDigital elevation model) and slope have high permutation importance and Gini decrease values. In the category of texture features, the features with high permutation importance and Gini decrease are GLCM second moment Band 2 and Band 1, GLCM mean Band 3. Among the spectral feature VARI (Visible Atmospheric Resistance Index) has a high permutation importance and Gini decrease. The original bands 1 and 3 of the aerial photographs have a high permutation importance and Gini decrease. The output of the classification is shown in Figure 10.
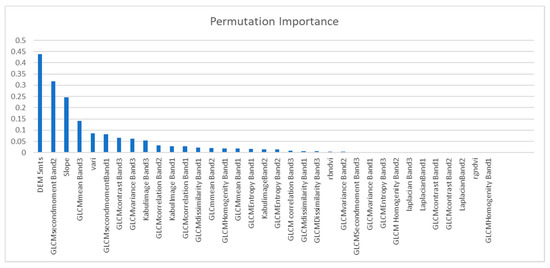
Figure 8.
Permutation Importance.
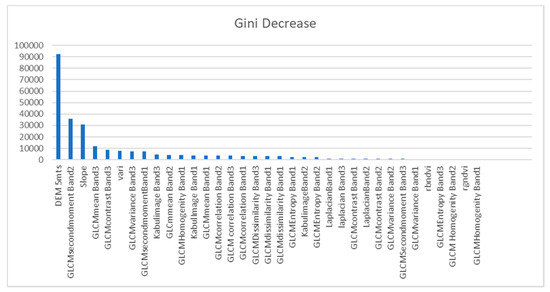
Figure 9.
Gini Decrease.
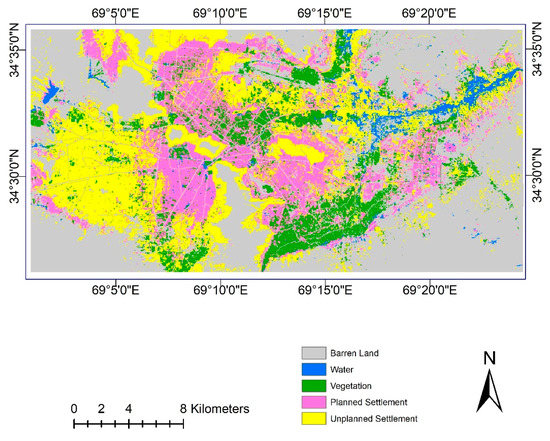
Figure 10.
Result of the classification of aerial photograph 2017.
Accuracy Assessment
The validation of the classification for the aerial photograph is based on the reference points collected for the five classes using high-resolution aerial photograph as the basis. The points are compared with the classification using the inbuilt confusion matrix (polygon/grid) in SAGA (System for Automated Geoscientific Analyses) GIS software [29].
The overall accuracy (seen in Table 3) of the land cover/use classification is 61%, that means 61% of the pixels were correctly assigned. This seems in general low, but reflects the complex urban morphology and the absence of a Near Infrared (NIR) band. Aggregating the classes to a binary classification, of built-up versus non-built-up moderate-high accuracy of 81% was achieved, as compared to standards built-up mapping products (e.g., the GHSL layer).

Table 3.
Summary of classification accuracy of the aerial photograph 2017.
The individual class accuracy can be seen in Table 4. The lowest user accuracy is for planned settlement with an accuracy of 53% and unplanned settlement with an accuracy of 55%. The low accuracy for planned and unplanned settlements is due to the complexity of these two classes. The roof tops for both the planned and the unplanned settlement have similar construction and, therefore, have a similar texture. Highest accuracies are achieved for barren land in case of producer accuracy with 84% and for the class water with a user accuracy of 74%.

Table 4.
User and producer accuracy for individual classes.
To perform the logistic regression, the accuracy of the built-up layer extracted from IKONOS was checked with the accuracy of the classification. The accuracy of the built-up layer extracted from IKONOS is 75% for the three classes, i.e., built-up, non-built-up and water. The result for the overall accuracy of three classes, the built-up, non-built-up and water, for the aerial photograph is also 75%, as shown in Table 5.

Table 5.
Accuracy result of the combined built-up, non-built and water class (2017).
A comparison of the overall accuracy for three classes, i.e., built-up, non-built-up and water for built-up layer from the Global Human Settlement Layer and the classification of the aerial photograph of 2017 is shown in Table 6.

Table 6.
Comparison of the overall accuracy of the built-up layer and the aerial photograph classification.
3.2. Results of the Logistic Regression
To perform the logistic regression built-up layer of Kabul for the year 2001 at a resolution of 1 m is extracted from IKONOS acquired from JRC. The planned and unplanned boundaries in the form of shapefile are used to extract data for 2001. The two images are used to see the change in the built-up areas from the year 2001 to 2017. The change in the settlements from 2001 to 2017 is mapped in the form of a binary classification, i.e., what was built in 2001 is 0 with no data and all that was built after 2001 is 1 that is the change in the built-up from 2001 to 2017. The change in the built-up forms the dependent variable (Figure 11).
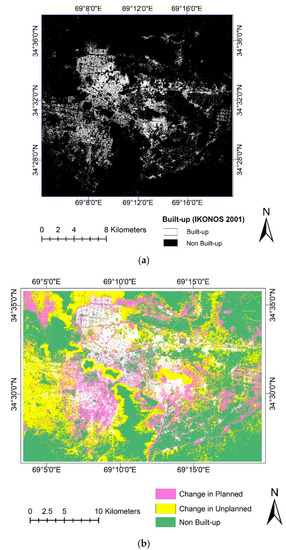
Figure 11.
(a) Built-up extract from IKONOS 2001, (b) change in planned and unplanned from 2001 to 2017.
3.3. Amount and Patterns of Growth in Planned and Unplanned Settlements
The total built-up area calculated for the planned settlements in 2001 is 71 km2 and in 2017 is 94 km2. Thus, the growth in the planned settlements from 2001 to 2017 is 22 km2. Planned settlements increased by 1.25 times from 2001 to 2017. The total built-up area calculated for unplanned settlements in 2001 is 21 km2, and in 2017 is 114 km2, and the growth in unplanned settlements from 2001 to 2017 is 94 km2. The unplanned settlements have grown 4.5 times in the period from 2001 to 2017, as shown in Table 7. The tremendous growth in the unplanned settlement is peculiar to Kabul, being the capital of Afghanistan compared to the other cities because of the largest presence of military bases, NATO base and Afghan troops in the whole country, giving a feeling of security to the population apart from economic opportunities in the city. As can be seen from Figure 11, unplanned growth is mainly on the west, north west, south west and on the hillsides. The settlements on the hillside are all unplanned. A large part of the planned growth is on central, east, north east and southern parts of the city. There is some planned growth on the northeast. Therefore, from the results, it can be said that the unplanned growth has occurred mainly in the western parts of the city, whereas, the planned growth is mainly towards central and eastern parts of the city. Overall, it can be said that Kabul is a sprawling city because of low rise and medium-density built-up. The increase in the unplanned sectors happened through the conversion of large agricultural lands into built-up areas, as well as the conversion of land on the steep slopes on the hills. Slope has been shown in Figure 12. These conversions drive the city sprawl. Most of the houses in the unplanned settlements are separated dwellings and have a central courtyard and similar building material, as found in the planned settlements, which is clearly visible on the aerial photograph, making it difficult to distinguish the built-up types.

Table 7.
Growth in the planned and unplanned settlements.
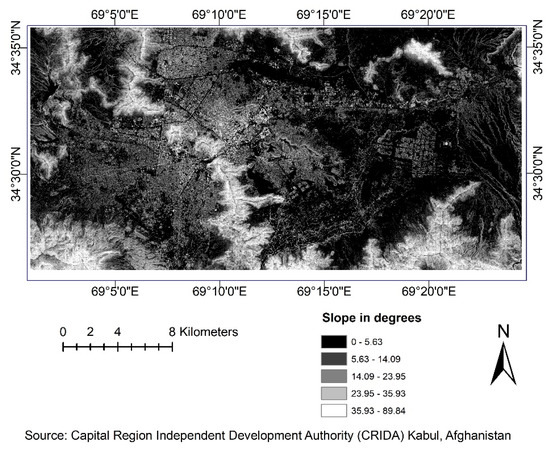
Figure 12.
Slope map of Kabul.
Two binary logistic regression models are performed for analysing the change in the built-up in planned settlements, and on the change in the built-up on the unplanned settlement. The regression models are used to study the importance of the predictor variables on the change in the built-up in the planned and unplanned settlements. The list of variables is shown in Table 8.

Table 8.
List of variables for the logistic regression.
The analysis of the regression model indicates that population density is the most significant factors for the growth of both planned and unplanned settlements. In the case of unplanned settlements, the slope is also one of the factors affecting the growth. It can be seen from the results that military bases also have a significant impact on the growth.
4. Discussion
Urban growth is a phenomenon happening all over the world, but its dynamics in a conflict zone like Kabul are not well studied. To study this phenomenon, a built-up layer of 1 m resolution for 2001 (i.e., the start of the conflict) was provided by JRC, and the aerial photograph for 2017 is classified using the random forest classifier. The aerial photographs consisted of several scenes that had to be mosaicked and were subset to the extent of the study area. The scenes were mosaicked without color balancing and histogram matching to retain the raw pixel values. Random forest classification was performed using 35 image features, which included terrain features, texture features, spectral features and structural features. The features with high permutation importance and Gini decrease are the terrain features DEM and slope, texture features GLCM second moment, mean, variance and contrast, spectral feature the visible atmospheric resistance index and the original bands 1 and 3 of the aerial photographs. The overall accuracy achieved for the classification (five land cover/use classes) is 61%. This reflects the difficulty to classify the built-up areas in Kabul, because of the similarities of unplanned and planned settlements. The rooftops of the unplanned settlements and the planned settlements are constructed of similar material and therefore have a similar texture. As a consequence, the classification resulted in a lot of misclassified pixels. However, the main locational patterns of unplanned and planned settlements are captured well, which was confirmed by local knowledge and fieldwork conducted by the first author. The amount of growth in the planned settlements is 1.25 times and in the unplanned settlements is 4.5 times from 2001 (since the start of the conflict) until 2017. The tremendous growth in the unplanned settlements is mainly due to better security environment and economic opportunities in the city. The growth in the unplanned settlement is towards the west and north west parts of the city. On the other hand, the growth in the planned settlements is mainly towards the central and eastern parts of the city. The complexity of the urban form made it difficult to extract the built-up and non-built-up satisfactorily because of the lack of contrast in the classes. It would be helpful to use a multispectral with an infrared band, where NDVI could be used to separate vegetation from built-up [30]. Kabul is a sprawling city, both planned and unplanned settlements are low rise and low density. The conversion of agricultural lands into built-up also makes the city sprawl. Standard products like the global human settlement layer have serious problems, as can be seen from Figure 3.
A lot of built-up areas have not been captured due to the spectral similarities between the built and the non-built.
The built-up layer for the year 2001 with 1 m resolution extracted from IKONOS is used to map the change in planned and unplanned from 2001 to 2017. The accuracies of the classified aerial photograph with three classes and the built-up layer extracted from IKONOS is comparable with 75% accuracies for both maps. This helped in improving the regression model. The urban morphology of the city of Kabul is complex; therefore, the availability of infra-red band for the year 2017 of an appropriate resolution would have helped for a more accurate classification.
Historically political actors governed the growth of the city. The support of the Soviet government led to urban growth, whereas during the Taliban period the population flowed out of the city and though the government had plans in place, limited funds stunted the growth of the city. In the present study, the factors influencing the growth are chosen keeping in mind the conflict situation in the country. These factors also are chosen due to the topography of the Kabul city. The city of Kabul is a valley surrounded by mountains and some hills in the center of the city, which has affected the growth and development of the city. High population density is due to immigration of internally displaced migrants. The heavy presence of international and national military establishments, leading to enhanced security within the city, has also impacted the growth of the city. The factors included population density, slope, military basis, road network and the locations that have been attacked in the past and have a high probability of being attacked, which includes embassies, ministries, educational institutions, hospitals, mosques, hotels and restaurants. The results of the regression show that the predictive accuracy for the planned settlements is 72.3%, and the predictive accuracy of the unplanned settlements is 65%. The major factors influencing the unplanned growth is population density and slope. The main factors influencing the planned growth is population density and military bases. Thus, unplanned growth is pushed towards the hazard-prone and less safe locations, in terms of natural hazards and human conflicts, while the planned growth is found mostly at safer zones. This confirms, similar to recent studies [31,32], that unplanned urban growth is more often found in higher-risk zones, as compared to planned urban growth. The other factor leading to unplanned growth is the availability of government land, which is illegally occupied, and agriculture land lying vacant due to the conflict in the region and the mass emigration of the population. The existing infrastructure is damaged due to the conflict and the unplanned development has no infrastructure since no proper development has taken place due to the conflict. The government capacities are severely curtailed due to insurgency [33]. The Ministry of Urban Development and Land, Afghanistan, Independent Directorate of Local Governance, along with Kabul Municipality, are developing programs under National Urban policy and National Spatial Strategy plans for Urban regeneration [34]. Most of the projects are entirely dependent on external aid, for example, USAID, Asian Developmen Bank (ADB), United Nation (UN), the World Bank etc. It is also important to understand that multiple drivers may be associated with urban expansion in major cities of developed and developing countries. However, driving factors may differ in the different time period. Internal and external conflicts are temporal factors of the urbanization.
Methods and data developed as part of this study can be utilized by government planning departments to ensure that further development of the unplanned growth is limited and the existing unplanned settlements could be facilitated with better infrastructure. The provision of data on unplanned developments is highly relevant for the development authority (CRIDA) for the context of the planning process for the new Kabul city project. Such data can form a base data for the government, private developers, builder and the development authorities to plan future development and redevelopment of the city.
5. Conclusions
In understanding urban growth and their drivers, Earth Observation (EO) has a major advantage to cover areas which are inaccessible for ground survey due to difficul terrain or due to the conflict situation. Urban planners in such cities face major challenges due to rapid change in urban dynamics and often outdated or unavailable base data. In Kabul, the main factors influencing the unplanned growth are population density and slope. The main factors influencing the planned growth is population density and military bases. There is a positive correlation between unplanned growth and slope, indicating that there are unplanned settlements on steep slopes, which means that much of the growth is happening in areas difficult to provide basic infrastructure. The expansion of unplanned growth on the west is because of the availability of agricultural land, which is being converted into built-up and towards the north east the steeper slopes are converted into unplanned settlements. The central part of the city is planned and has higher built-up densities, compared to the other parts of the city. The central and eastern parts of the city consist of ministries, embassies, hotels, guesthouses for expatriates and government housing built by the Russians for the government employees. The eastern parts of the city consist of international military bases, and, therefore, it is being developed by private builders and the government for the provision of housing for the growing population. As can be seen from the results, a major focus is given on security in the planned settlements, because of close proximity to the military establishments and other international assistance institutions. The model is successful in explaining the growth and the patterns of growth in the city of Kabul, which has absorbed by now three times the population that existed in 2001.
Similar studies on urban growth can be carried out for other major cities of Afghanistan, like Kandahar, Herat, Mazar and Jalalabad. Future projections can be made to assist the development authority like CRIDA for the development of their master plan. Efforts can be made to get multi-spectral data of earlier vintage to generate transition boundaries of land-use and land-cover for all such studies. In general, every conflict area centers around major urban cities of that country. EO allows for an understanding the factors affecting the growth, similarities and differences across cities. In many conflict areas, cities have a high pace of growth, where differences and dynamics often link with the security situation, population concentration/dispersal, type of terrain and availability of economic resources. The study can be replicated in other conflict zones.
Author Contributions
Conceptualization, M.K., V.C. and D.K.; Methodology, M.K. and V.C.; Data collection, V.C. and M.K.; Original draft, V.C., M.K. and D.K.; Review and editing, M.K., V.C. and D.K.; Writing, M.K., V.C. and D.K. All authors have read and agreed to the published version of the manuscript.
Funding
The research of M.Ku. pertaining to these results received financial aid from the Netherlands Organisation for Scientific Research (NWO), grant number VI. Veni. 194.025.
Acknowledgments
My thanks to JRC and CRIDA, Kabul, Afghanistan (Capital Regions Independent Development Authority) for providing me the required data to carry out my research.
Conflicts of Interest
The authors declare no conflict of interest. The funders had no role in the design of the study; in the collection, analyses, or interpretation of data; in the writing of the manuscript, or in the decision to publish the results.
References
- Escobar, J.A.G.; Patino, J.E.; Duque, J.C.; Passos, S. Spatiotemporal Modeling of Urban Growth Using Machine Learning. Remote Sens. 2019, 12, 109. [Google Scholar] [CrossRef]
- Pradhan, B. Spatial Modeling and Assessment of Urban Form; Pradhan, B., Ed.; Springer International Publishing: Cham, Switzerland, 2017; Available online: https://doi.org/10.1007/978-3-319-54217-1 (accessed on 5 March 2019).
- Thomson, D.R.; Kuffer, M.; Boo, G.; Hati, B.; Grippa, T.; Elsey, H.; Linard, C.; Mahabir, R.; Kyobutungi, C.; Maviti, J.; et al. Need for an Integrated Deprived Area “Slum” Mapping System (IDEAMAPS) in Low- and Middle-Income Countries (LMICs). Soc. Sci. 2020, 9, 80. [Google Scholar] [CrossRef]
- Hidayat, O.; Kajita, Y. Land Use Management and Urban Land Expansion in Kabul: A Case Study of Rapid Urbanization. Curr. Urban Stud. 2019, 7, 193–205. [Google Scholar] [CrossRef]
- ACRFH. Afghanistan Country Report for Habitat III, Islamic Republic of Afghanistan, 2015, Ministry of Urban Development Affairs. Available online: http://uploads.habitat3.org/hb3/Afghanistan-Country-Report-Habitat-III-1.pdf (accessed on 23 October 2020).
- Badmos, O.S.; Rienow, A.; Callo-Concha, D.; Greve, K.; Jürgens, C. Simulating slum growth in Lagos: An integration of rule based and empirical based model. Comput. Environ. Urban Syst. 2019, 77, 101369. [Google Scholar] [CrossRef]
- Nduwayezu, G.; Sliuzas, R.; Kuffer, M. Modeling urban growth in Kigali city Rwanda. Rwanda J. 2017, 1. [Google Scholar] [CrossRef]
- Kuffer, M.; Pfeffer, K.; Sliuzas, R.; Baud, I. Extraction of Slum Areas From VHR Imagery Using GLCM Variance. IEEE J. Sel. Top. Appl. Earth Obs. Remote Sens. 2016, 9, 1830–1840. [Google Scholar] [CrossRef]
- Rodriguez-Galiano, V.F.; Ghimire, B.; Rogan, J.; Chica-Olmo, M.; Rigol-Sanchez, J.P. An assessment of the effectiveness of a random forest classifier for land-cover classification. ISPRS J. Photogramm. Remote Sens. 2012, 67, 93–104. [Google Scholar] [CrossRef]
- Nong, Y.; Du, Q. Urban growth pattern modeling using logistic regression. Geo-Spat. Inf. Sci. 2011, 14, 62–67. [Google Scholar] [CrossRef]
- Duwal, S.A.; Kuffer, M.S. Modelling urban growth in the Kathmandu Valley, Nepal. In Gis in Sustainable Urban Planning and Management: A Golbal Perspective; van Maarseveen, M., Martinez, J., Flacke, J., Eds.; CRC Press: Boca Raton, FL, USA, 2018; Chapter 12; pp. 205–223. [Google Scholar]
- Kantakumar, L.N.; Kumar, S.; Schneider, K. Spatiotemporal urban expansion in Pune metropolis, India using remote sensing. Habitat Int. 2016, 51, 11–22. [Google Scholar] [CrossRef]
- Linard, C.; Tatem, A.J.; Gilbert, M. Modelling spatial patterns of urban growth in Africa. Appl. Geogr. 2013, 44, 23–32. [Google Scholar] [CrossRef]
- Verburg, P.H.; Van Eck, J.R.R.; De Nijs, T.C.M.; Dijst, M.J.; Schot, P. Determinants of Land-Use Change Patterns in the Netherlands. Environ. Plan. B: Plan. Des. 2004, 31, 125–150. [Google Scholar] [CrossRef]
- Li, X.; Zhou, W.; Ouyang, Z. Forty years of urban expansion in Beijing: What is the relative importance of physical, socioeconomic, and neighborhood factors? Appl. Geogr. 2013, 38, 1–10. [Google Scholar] [CrossRef]
- Rimal, B.; Sloan, S.; Keshtkar, H.; Sharma, R.; Rijal, S.; Shrestha, U.B. Patterns of Historical and Future Urban Expansion in Nepal. Remote Sens. 2020, 12, 628. [Google Scholar] [CrossRef]
- Migration and Urban Development in Kabul: Classification or Accommodation. 2012. Available online: http://appro.org.af/preview/migration-and-urban-development-in-kabul/ (accessed on 23 October 2020).
- Ahmadi, A.S.; Kajita, Y. Evaluating urban land expansion using geogrpahic information system and remote sensing in Kabul city, Afghanistan. Int. J. Geomat. Civ. Eng. 2016, 10, 945–952. [Google Scholar]
- Asian Development Bank. Afghanistan: Country Partnership Strategy (2017–2021). 2017. Available online: https://www.adb.org/documents/afghanistan-country-partnership-strategy-2017-2021 (accessed on 28 July 2019).
- Rasmussen, S.E. Kabul—the Fifth Fastest Growing City in the World—Is Bursting at the Seams|Cities|The Guardian. 2014. Available online: https://www.theguardian.com/cities/2014/dec/11/kabul-afghanistan-fifth-fastest-growing-city-world-rapid-urbanisation (accessed on 7 June 2018).
- Atlas of Afghan City Regions. UN Habitat, Government of Afghanistan. 2016. Available online: https://unhabitat.org/atlas-of-afghan-city-regions-2016 (accessed on 23 October 2020).
- Pesaresi, M.; Ehrlich, D.; Ferri, S.; Florczyk, A.J.; Freire, S.; Halkia, M.; Julea, A.; Kemper, T.; Soille, P.; Syrris, V. Operating procedure for the production of the Global Human Settlement Layer from Landsat data of the epochs 1975, 1990, 2000, and 2014. Publ. Off. Eur. Union 2016. [Google Scholar] [CrossRef]
- Gidudu, A.; Marwala, T. Classification of Images Using Support Vector Machines. arXiv 2007, arXiv:0709.3967. Available online: https://doi.org/10.1007/978-3-319-54217-1 (accessed on 6 November 2020).
- Jin, B.; Ye, P.; Zhang, X.; Song, W.; Li, S. Object-Oriented Method Combined with Deep Convolutional Neural Networks for Land-Use-Type Classification of Remote Sensing Images. J. Indian Soc. Remote Sens. 2019, 47, 951–965. [Google Scholar] [CrossRef]
- Pavlov, Y.L. Random forests. Random For. 2019, 1–122. [Google Scholar] [CrossRef]
- Guan, H.; Yu, J.; Li, J.; Luo, L. Random Forests-Based Feature Selection for Land-Use Classification Using Lidar Data and Orthoimagery. ISPRS—Int. Arch. Photogramm. Remote Sens. Spat. Inf. Sci. 2012, XXXIX-B7, 203–208. [Google Scholar] [CrossRef]
- Cheng, J.; Masser, I. Urban growth pattern modeling: a case study of Wuhan city, PR China. Landsc. Urban Plan. 2003, 62, 199–217. [Google Scholar] [CrossRef]
- Altmann, A.; Toloşi, L.; Sander, O.; Lengauer, T. Permutation importance: a corrected feature importance measure. Bioinformatics 2010, 26, 1340–1347. [Google Scholar] [CrossRef]
- Conrad, O.; Bechtel, B.; Bock, M.; Dietrich, H.; Fischer, E.; Gerlitz, L.; Wehberg, J.; Wichmann, V.; Böhner, J. System for Automated Geoscientific Analyses (SAGA) v. 2.1.4. Geosci. Model Dev. 2015, 8, 1991–2007. [Google Scholar] [CrossRef]
- Ranguelova, E.; Weel, B.; Roy, D.; Kuffer, M.; Pfeffer, K.; Lees, M. Image based classification of slums, built-up and non-built-up areas in Kalyan and Bangalore, India. Eur. J. Remote Sens. 2018, 52, 40–61. [Google Scholar] [CrossRef]
- Müller, I.; Taubenböck, H.; Kuffer, M.; Wurm, M. Misperceptions of Predominant Slum Locations? Spatial Analysis of Slum Locations in Terms of Topography Based on Earth Observation Data. Remote Sens. 2020, 12, 2474. [Google Scholar] [CrossRef]
- Brito, P.L.; Kuffer, M.; Koeva, M.; Pedrassoli, J.C.; Wang, J.; Costa, F.; De Freitas, A.D. The Spatial Dimension of COVID-19: The Potential of Earth Observation Data in Support of Slum Communities with Evidence from Brazil. ISPRS Int. J. Geo-Inf. 2020, 9, 557. [Google Scholar] [CrossRef]
- Asian Development Bank. Country Partnership Strategy; Afghnistan 2017–2021, Asian Development Bank, Afghanistan Inclusive and Sustainable Growth Assessment. 2017. Available online: https://www.adb.org/sites/default/files/linked-documents/cps-afg-2017-2021-ga.pdf (accessed on 28 July 2019).
- UN Habitat. National Support for Afghan Cities. Discussion Paper # 3, Series 2. 2016. Available online: https://www.fukuoka.unhabitat.org/projects/afghanistan/pdf/DP3_English.pdf (accessed on 28 July 2019).
Publisher’s Note: MDPI stays neutral with regard to jurisdictional claims in published maps and institutional affiliations. |
© 2020 by the authors. Licensee MDPI, Basel, Switzerland. This article is an open access article distributed under the terms and conditions of the Creative Commons Attribution (CC BY) license (http://creativecommons.org/licenses/by/4.0/).