Spatiotemporal Changes in 3D Building Density with LiDAR and GEOBIA: A City-Level Analysis
Abstract
:1. Introduction
- (1)
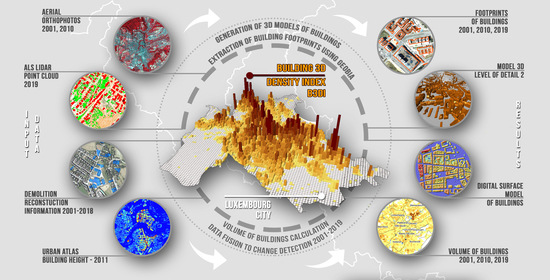
- To automate 3D building modelling and object-based footprints of buildings extraction;
- (2)
- To define Building 3D Density Index (B3DI);
- (3)
- To quantify changes in volume density in Luxembourg City over the last two decades (between 2001, 2010, and 2019).
2. Materials and Methods
2.1. The Geographical Localisation of the Study Area
2.2. Datasets and Data Sources
2.3. Methods
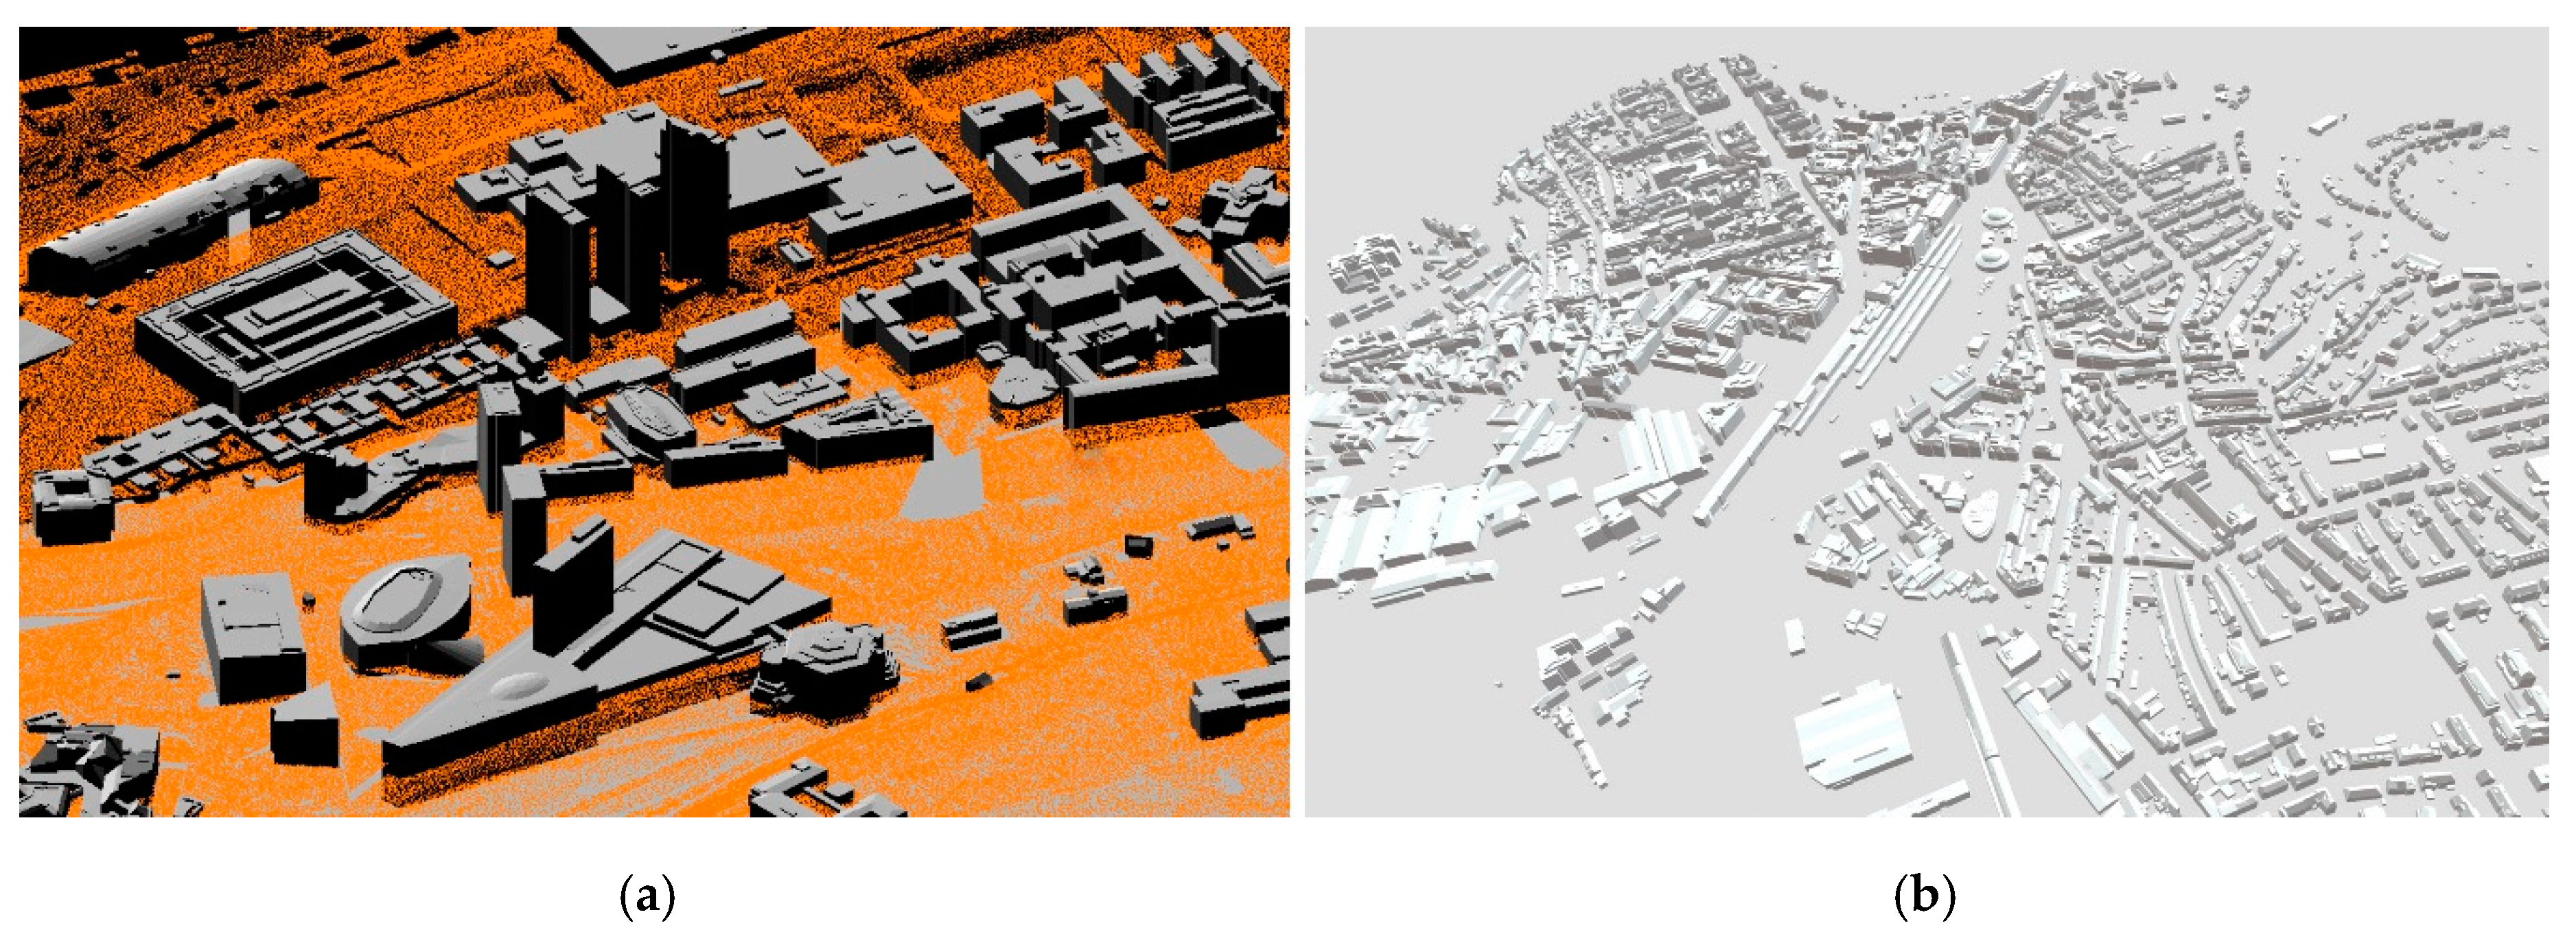
2.3.1. Generation of 3D Models of Buildings
2.3.2. Extraction of Building Footprints Using GEOBIA and Volume Calculation
2.3.3. Data Fusion to Calculate Building 3D Density Index
3. Results
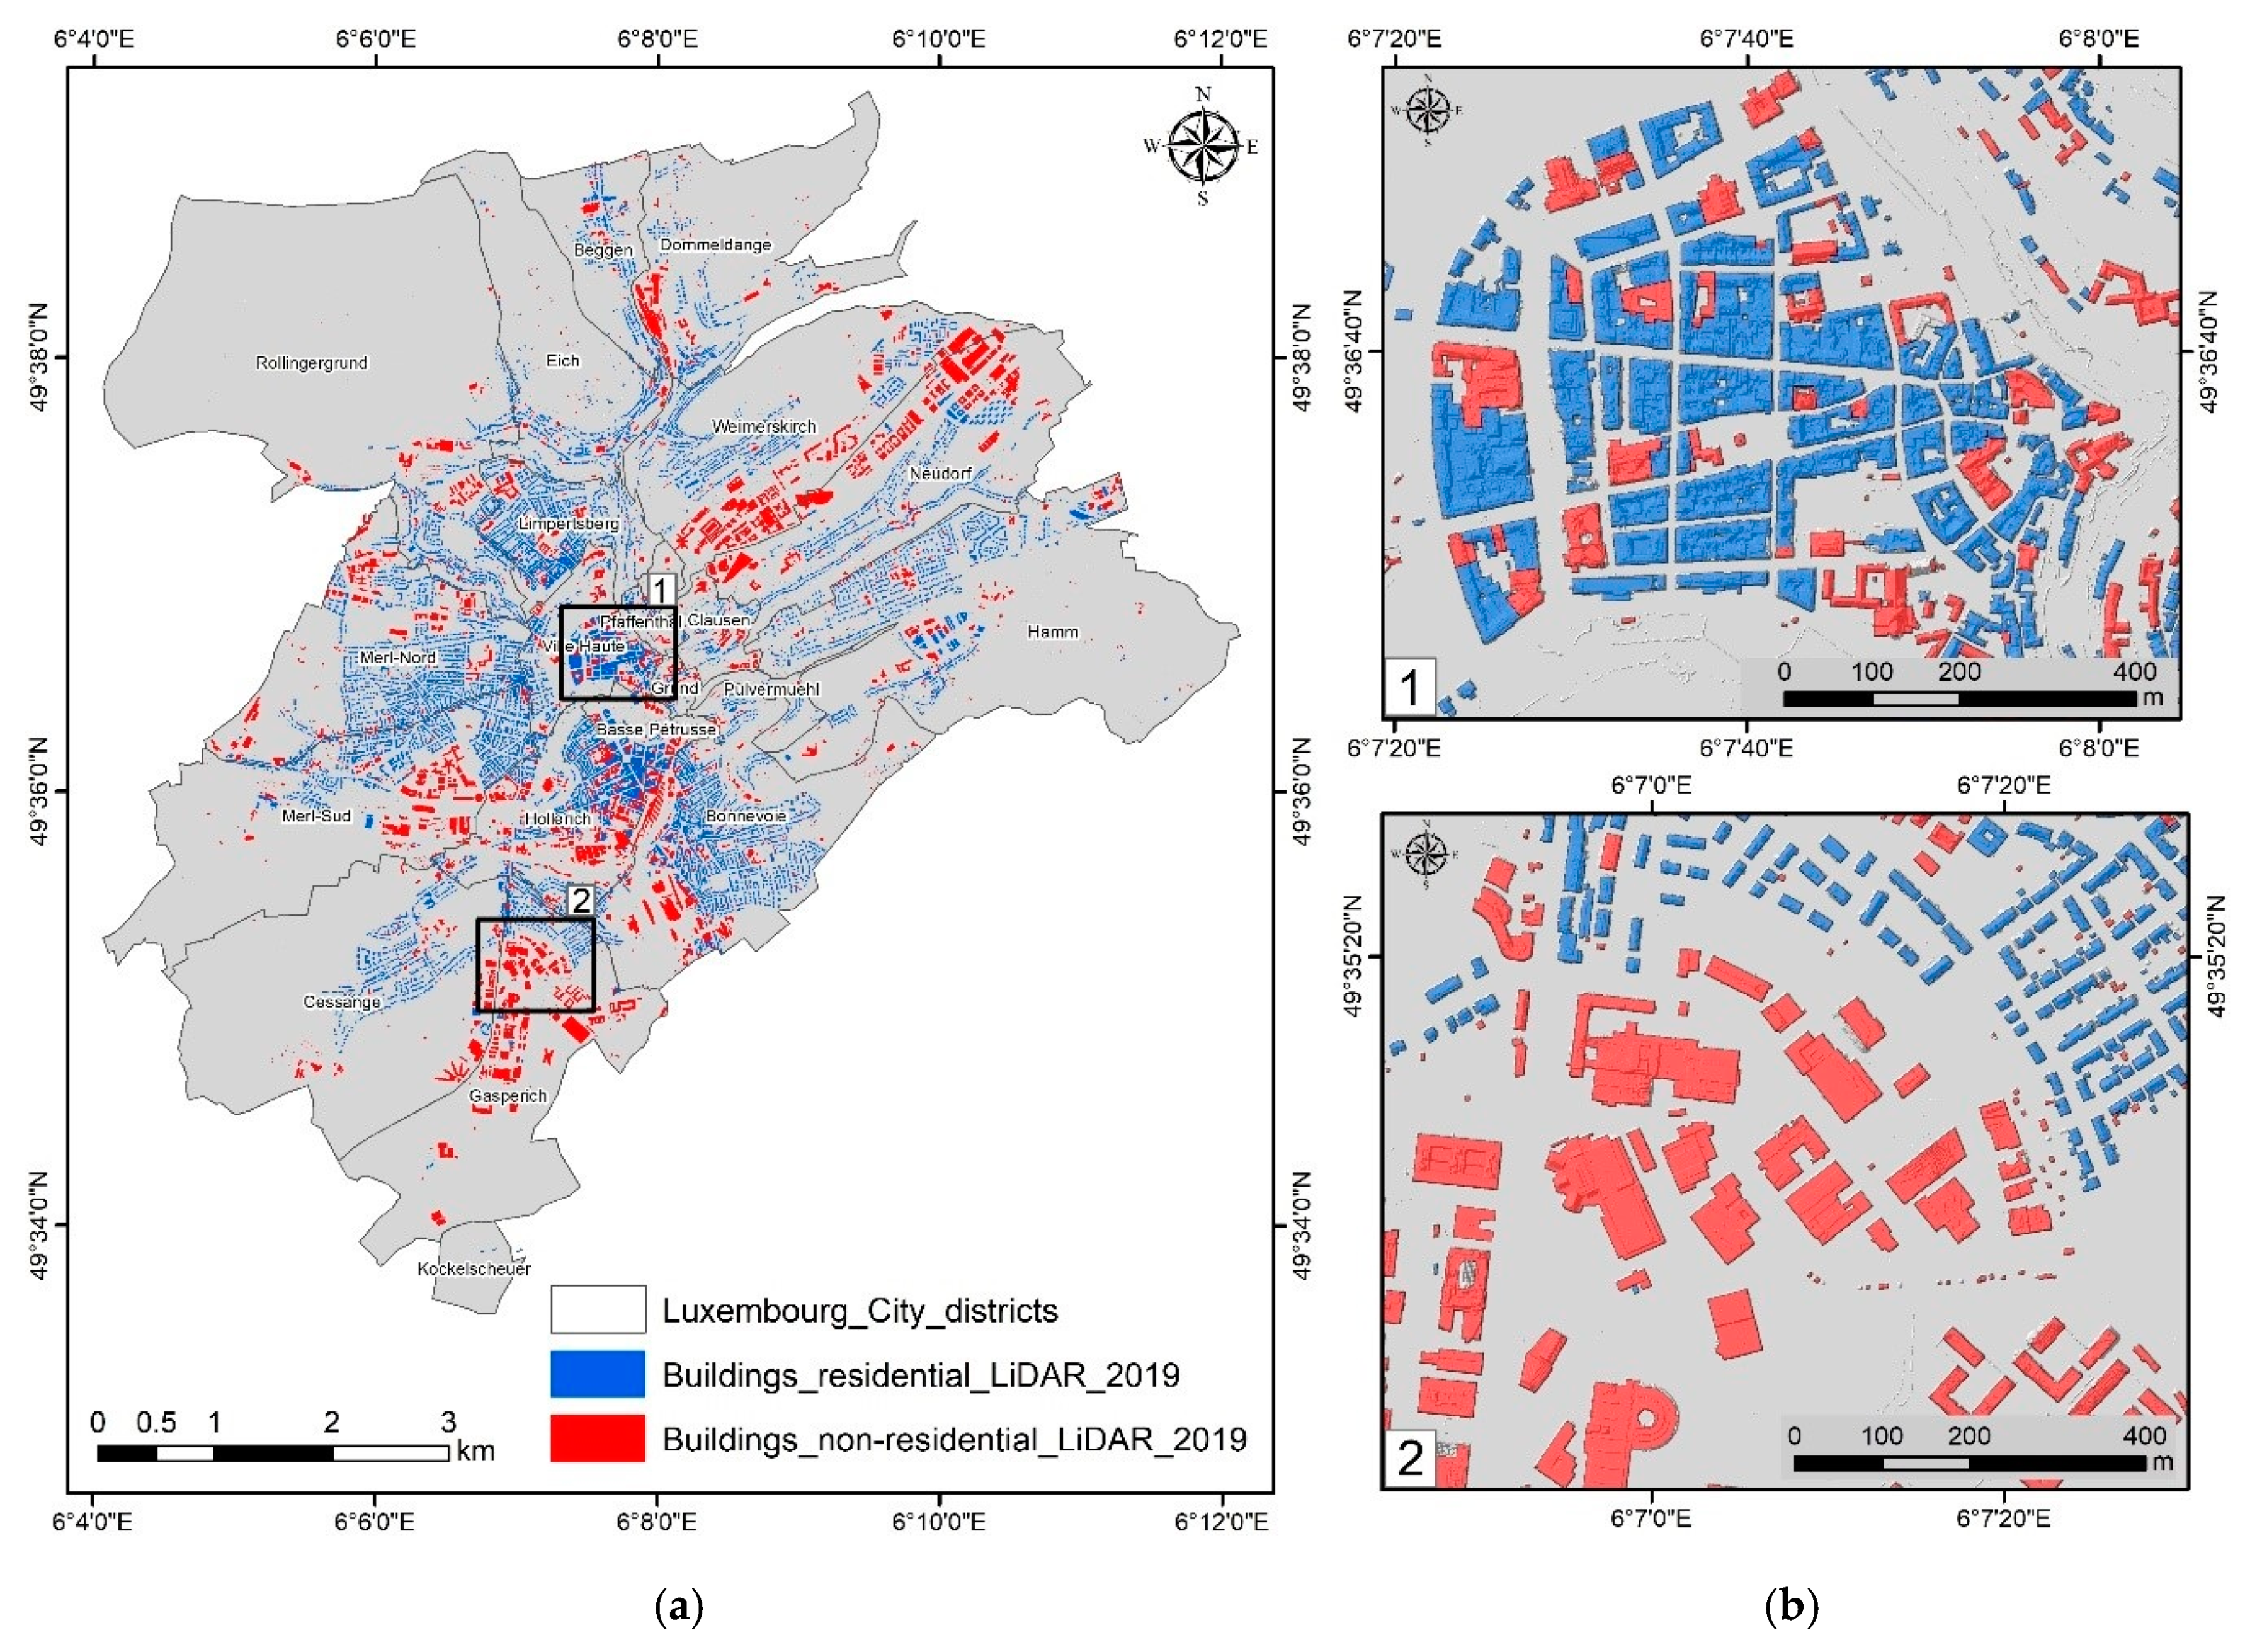
3.1. Buildings Detection and Accuracy Assessment
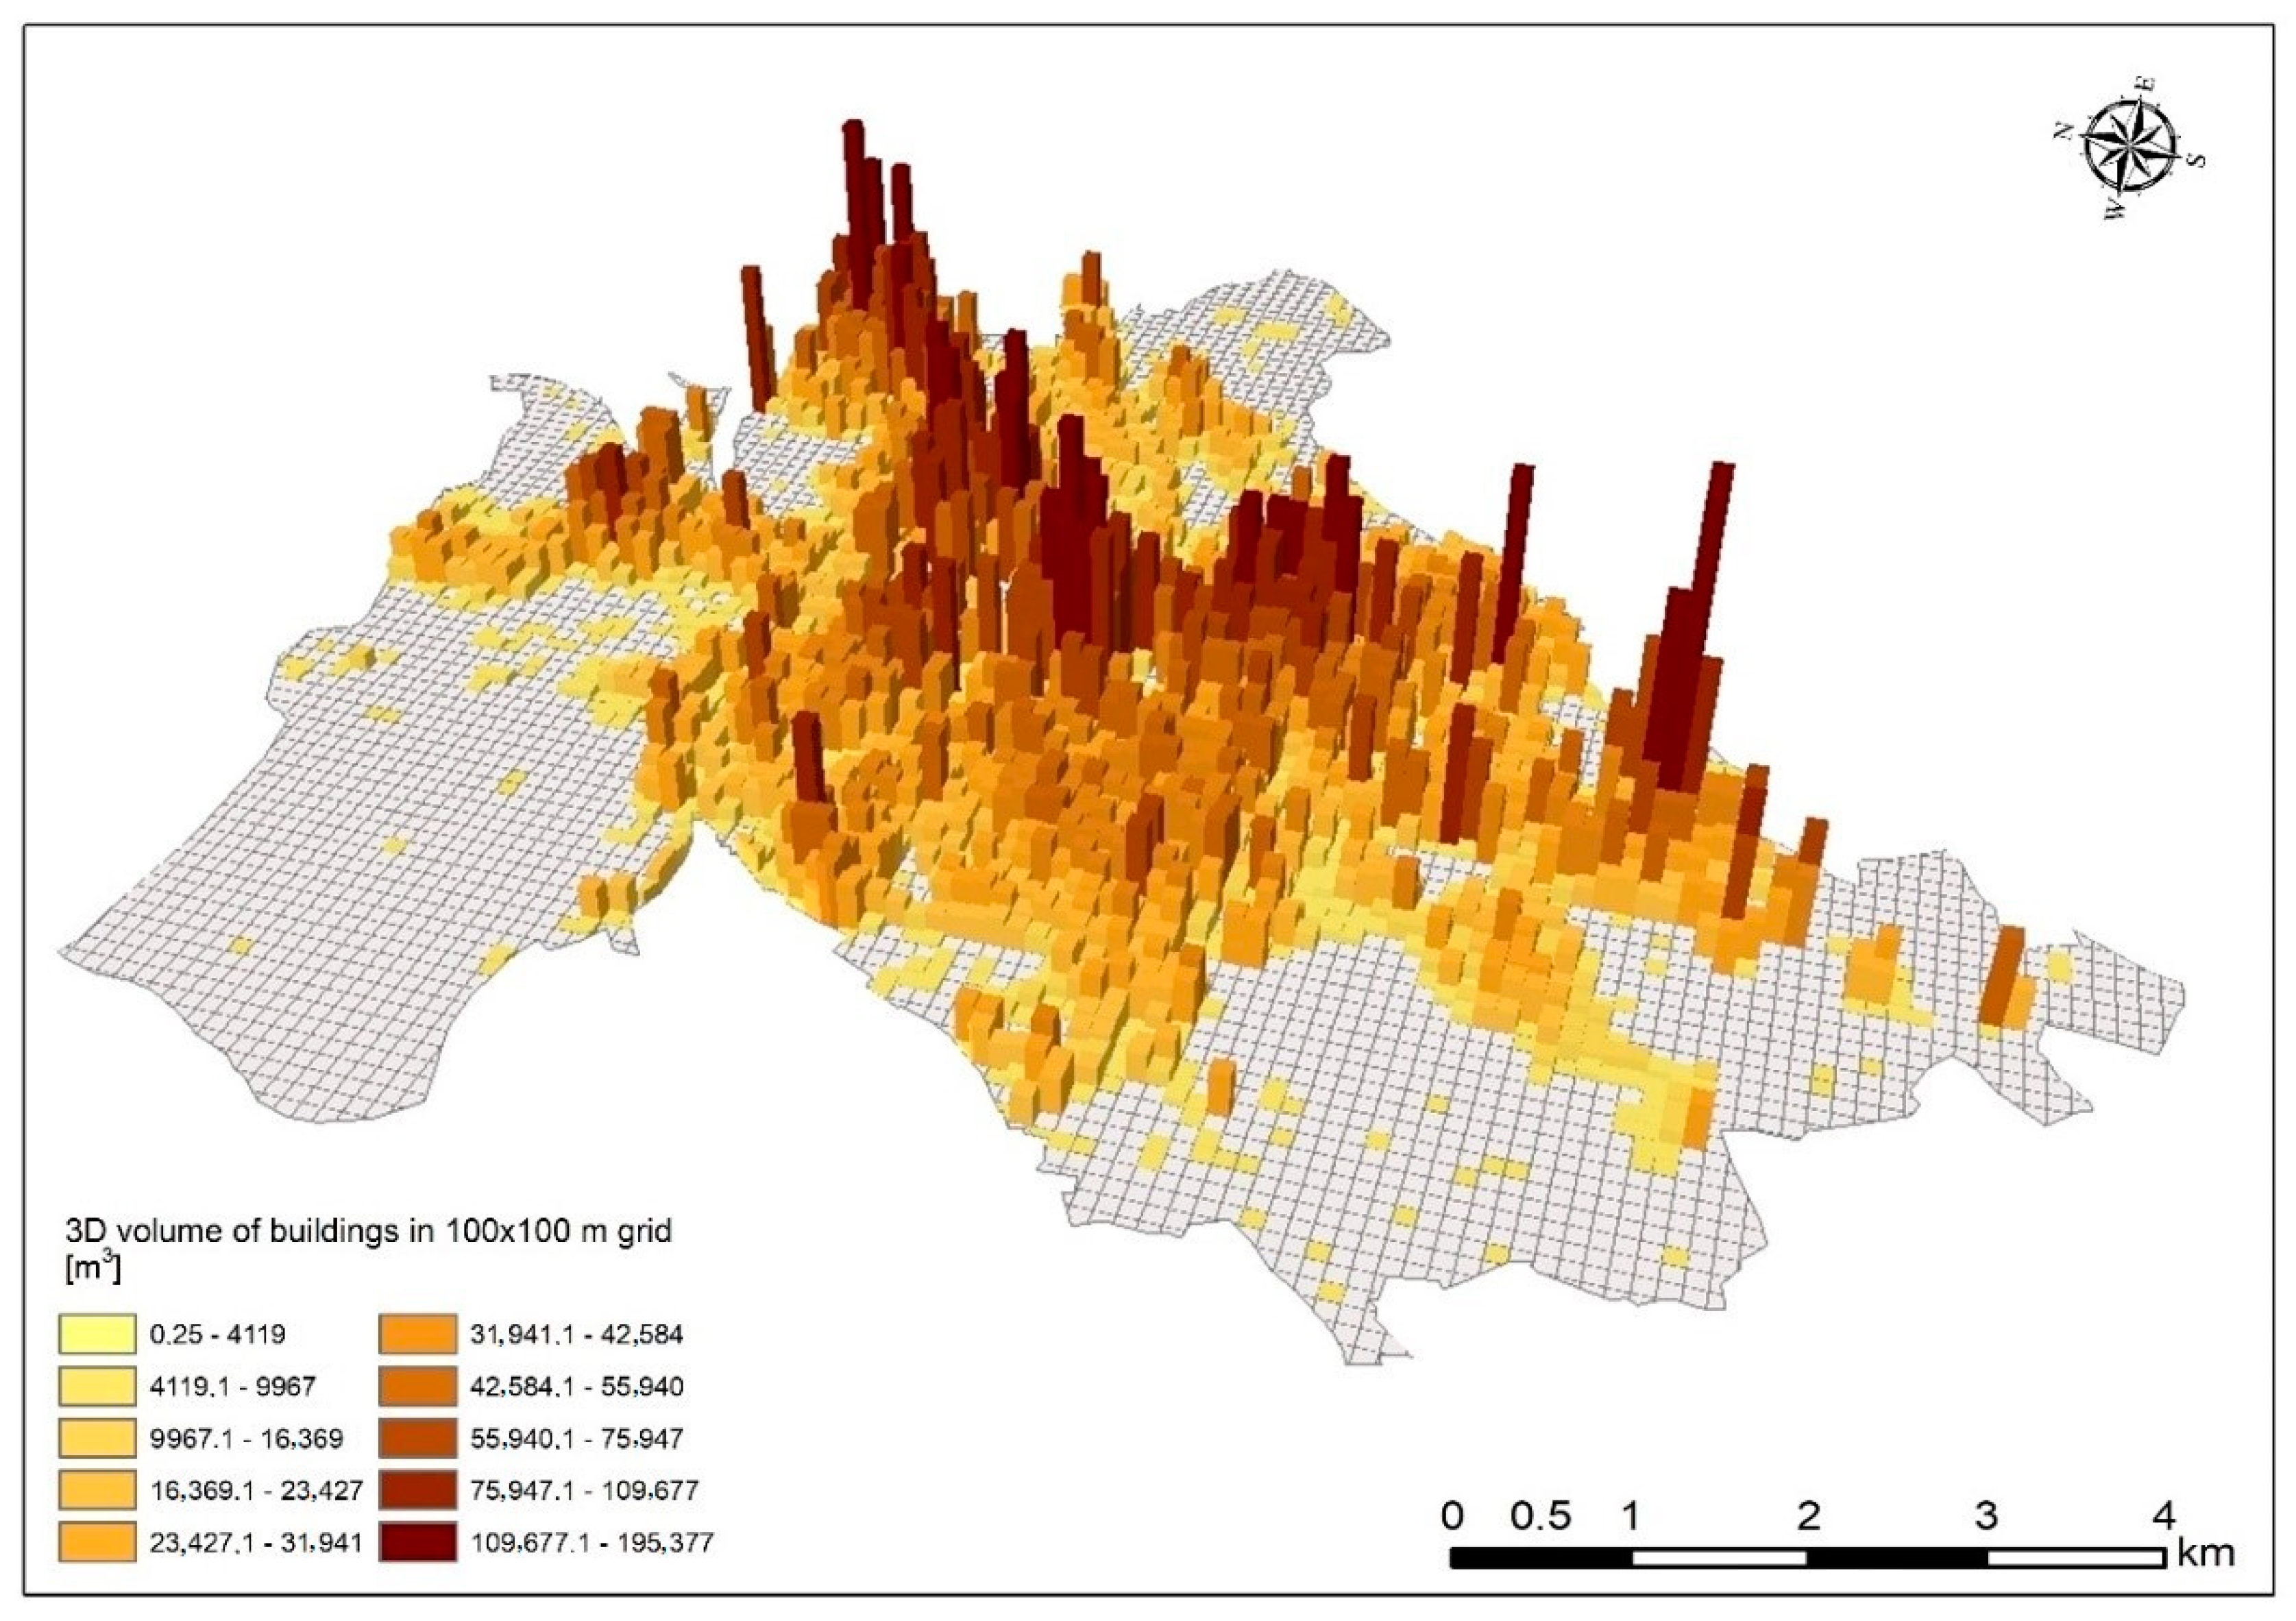
3.2. Urban Volumetry and Building 3D Density Index (B3DI)
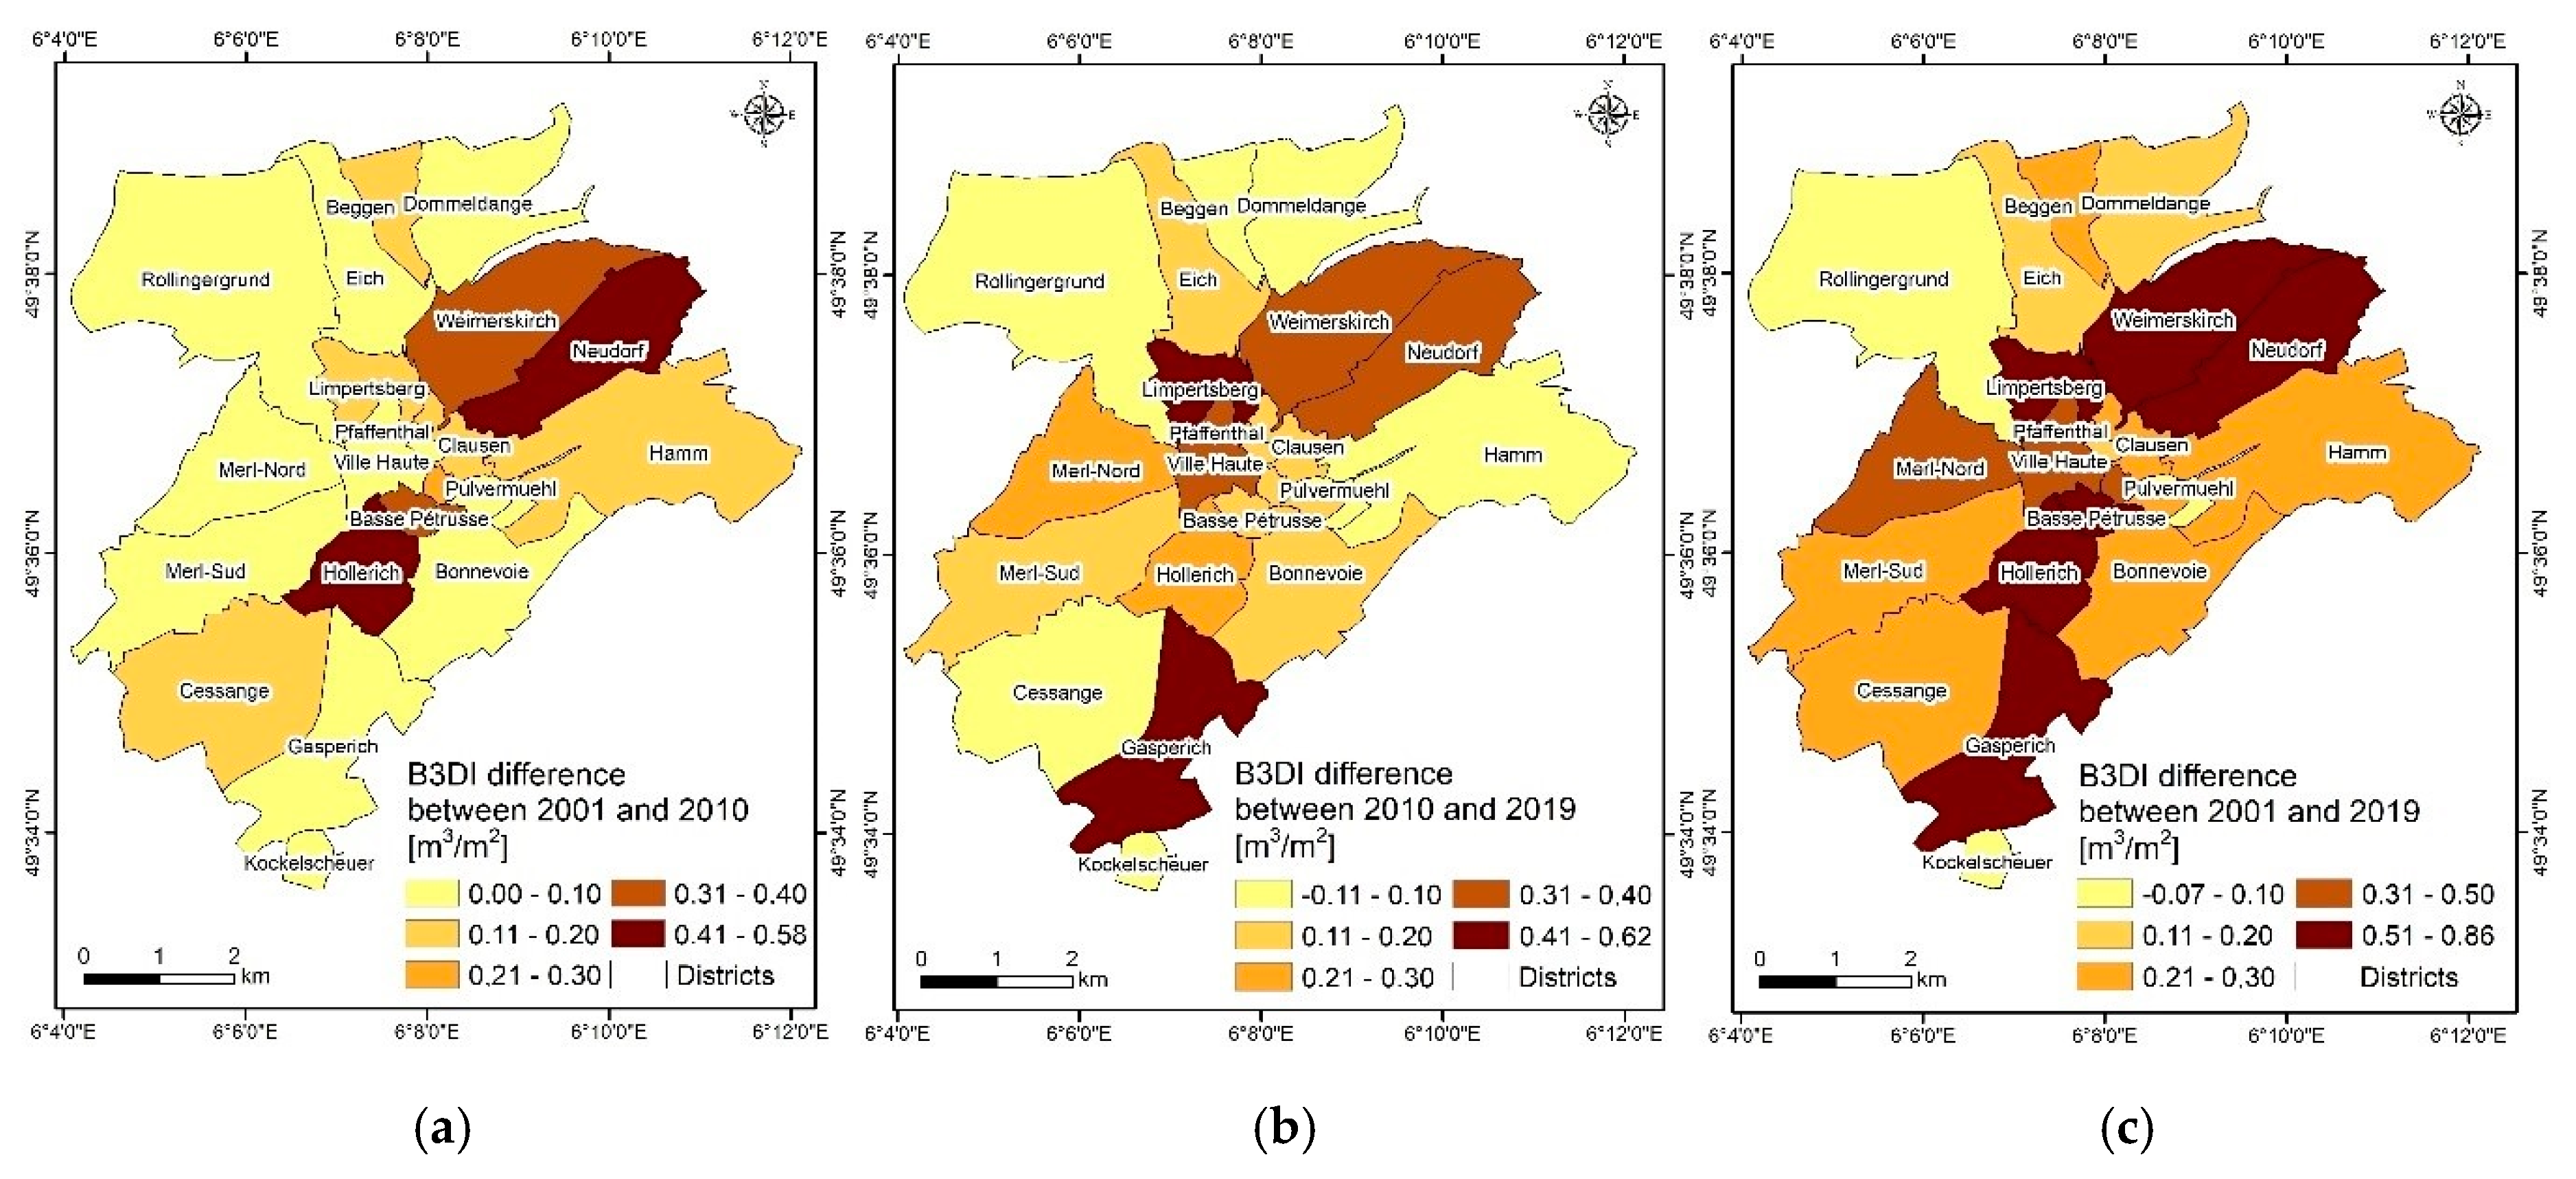
3.3. Changes in City Volumetry over the Past 20 Years
4. Discussion
5. Conclusions
Author Contributions
Funding
Acknowledgments
Conflicts of Interest
Appendix A
| Districts | Area | Volume All | B3DI All | Volume R | B3DI R | Volume NR | B3DI NR |
|---|---|---|---|---|---|---|---|
| Name | [m2] | [m3] | [m3/m2] | [m3] | [m3/m2] | [m3] | [m3/m2] |
| Ville Haute | 1,058,465.54 | 4,241,563.93 | 4.01 | 2,965,917.06 | 2.80 | 1,275,646.87 | 1.21 |
| Basse Pétruss | 453,111.05 | 1,508,814.68 | 3.33 | 863,309.87 | 1.91 | 645,504.81 | 1.42 |
| Hollerich | 1,800,838.97 | 5,560,073.12 | 3.09 | 3,232,718.75 | 1.80 | 2,327,354.37 | 1.29 |
| Limpertsberg | 1,176,055.91 | 3,073,585.62 | 2.61 | 2,356,861.75 | 2.00 | 716,723.87 | 0.61 |
| Grund | 155,076.80 | 400,620.12 | 2.58 | 134,047.56 | 0.86 | 266,572.56 | 1.72 |
| Neudorf | 3,220,259.14 | 5,923,257.37 | 1.84 | 1,542,721.43 | 0.48 | 4,380,535.94 | 1.36 |
| Merl-Nord | 2,890,428.02 | 4,767,710.43 | 1.65 | 3,299,263.37 | 1.14 | 1,468,447.06 | 0.51 |
| Bonnevoie | 3,546,872.29 | 5,697,965.93 | 1.61 | 3,823,082.43 | 1.08 | 1,874,883.50 | 0.53 |
| Weimerskirch | 3,522,342.37 | 5,323,061.25 | 1.51 | 1,680,753.50 | 0.48 | 3,642,307.75 | 1.03 |
| Pfaffenthal | 175,462.57 | 242,085.75 | 1.38 | 156,145.56 | 0.89 | 85,940.19 | 0.49 |
| Gasperich | 3,449,516.40 | 4,006,822.43 | 1.16 | 635,693.43 | 0.18 | 3,371,129.00 | 0.98 |
| Merl-Sud | 4,011,460.83 | 4,069,067.81 | 1.01 | 2,743,936.25 | 0.68 | 1,325,131.56 | 0.33 |
| Clausen | 601,469.02 | 571,229.93 | 0.95 | 249,419.43 | 0.41 | 321,810.50 | 0.54 |
| Beggen | 1,133,763.20 | 867,089.81 | 0.76 | 718,394.62 | 0.63 | 148,695.19 | 0.13 |
| Dommeldange | 2,926,149.86 | 1,693,941.06 | 0.58 | 650,902.87 | 0.22 | 1,043,038.19 | 0.36 |
| Hamm | 5,775,969.44 | 2,974,906.93 | 0.52 | 2,233,381.43 | 0.39 | 741,525.50 | 0.13 |
| Eich | 2,381,337.22 | 1,090,239.43 | 0.46 | 853,657.81 | 0.36 | 236,581.62 | 0.10 |
| Cessange | 4,934,991.40 | 2,149,884.18 | 0.44 | 1,154,016.31 | 0.23 | 995,867.87 | 0.20 |
| Pulvermuehl | 302,362.01 | 105,390.06 | 0.35 | 75,326.25 | 0.25 | 30,063.81 | 0.10 |
| Rollingergrund | 7,790,154.86 | 1,974,078.50 | 0.25 | 1,280,569.56 | 0.16 | 693,508.94 | 0.09 |
| Kockelscheuer | 428,491.16 | 3732.25 | 0.01 | 3720.18 | 0.01 | 12.07 | 0.00 |
| Luxembourg City | 51,734,578.06 | 56,245,120.59 | 1.09 | 30,653,839.42 | 0.59 | 25,591,281.17 | 0.49 |
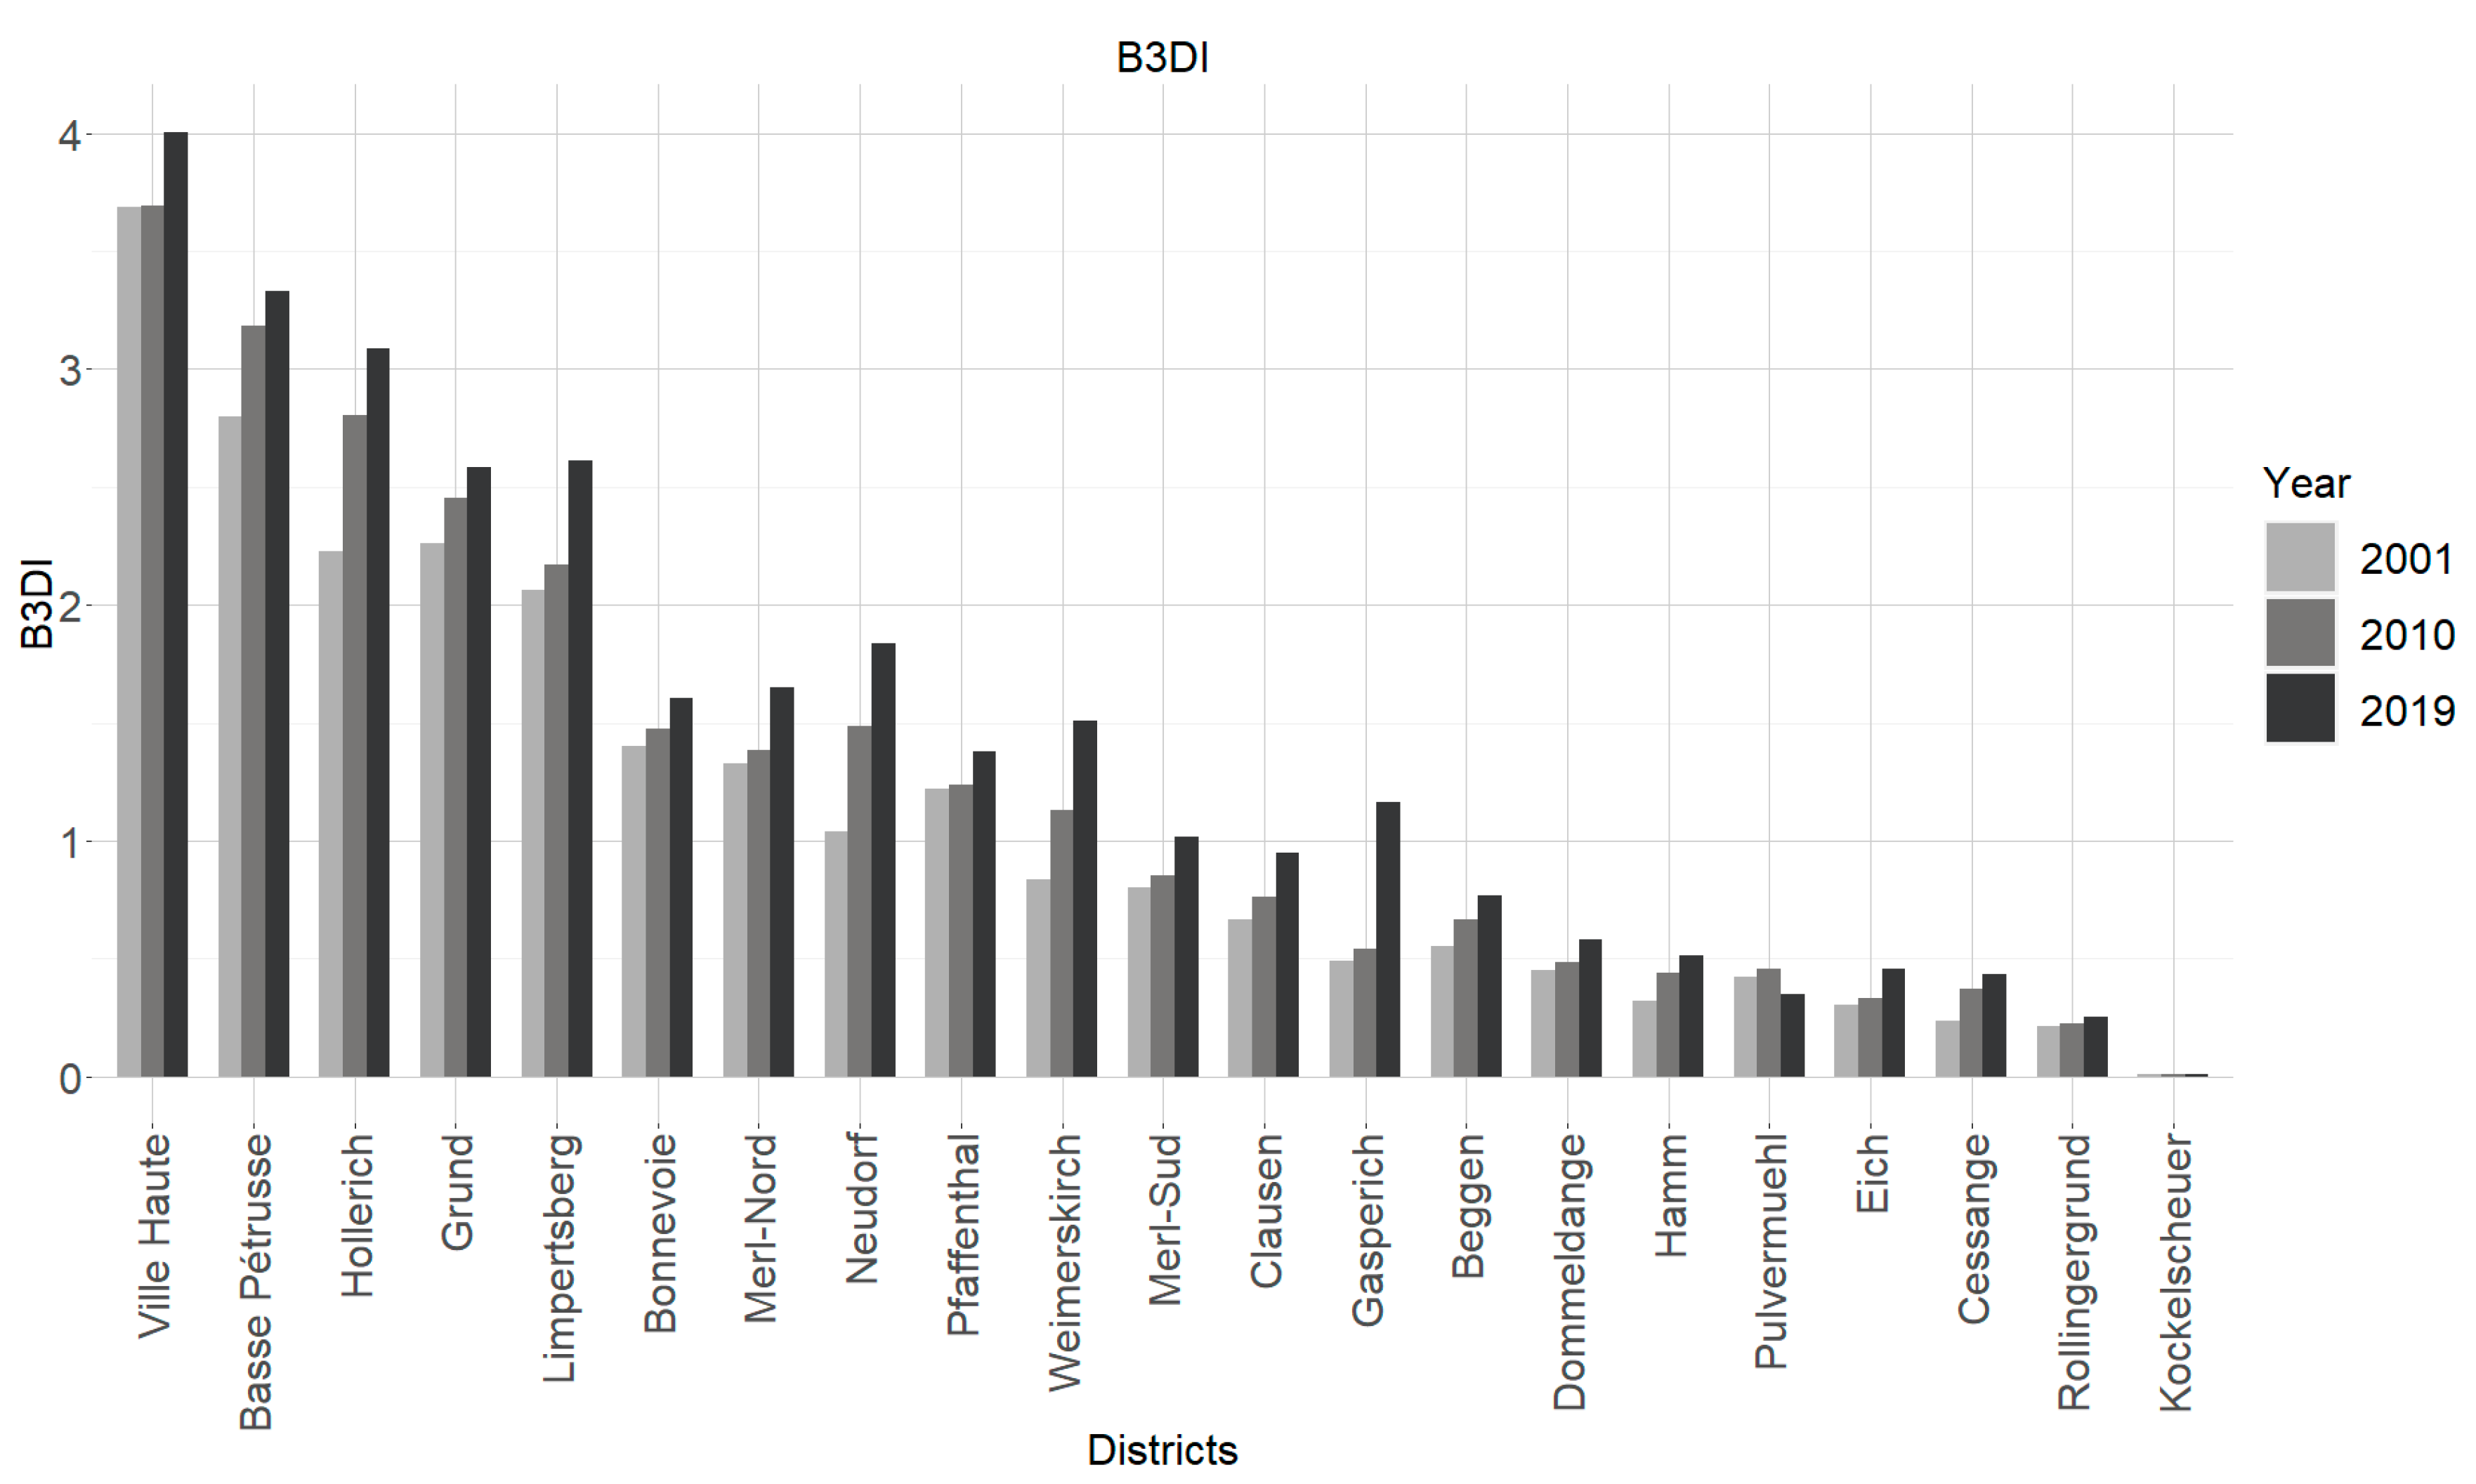
| Districts | Area | Volume Buildings 2001 | B3DI 2001 | Volume Buildings 2010 | B3DI 2010 |
|---|---|---|---|---|---|
| Name | [m2] | [m3] | [m3/m2] | [m3] | [m3/m2] |
| Ville Haute | 1,058,465.54 | 3,900,303.13 | 3.68 | 3,910,583.68 | 3.69 |
| Basse Pétrusse | 453,111.05 | 1,267,927.25 | 2.80 | 1,443,160.43 | 3.19 |
| Hollerich | 1,800,838.97 | 4,012,451.86 | 2.23 | 5,054,810.87 | 2.81 |
| Limpertsberg | 1,176,055.91 | 2,425,831.81 | 2.06 | 2,553,438.43 | 2.17 |
| Grund | 155,076.80 | 350,627.13 | 2.26 | 380,842.43 | 2.46 |
| Neudorf | 3,220,259.14 | 3,340,875.63 | 1.04 | 4,780,859.81 | 1.48 |
| Merl-Nord | 2,890,428.02 | 3,831,744.44 | 1.33 | 4,007,072.43 | 1.39 |
| Bonnevoie | 3,546,872.29 | 4,961,248.69 | 1.40 | 5,236,639.31 | 1.48 |
| Weimerskirch | 3,522,342.37 | 2,937,256.44 | 0.83 | 3,982,745.5 | 1.13 |
| Pfaffenthal | 175,462.57 | 214,528.875 | 1.22 | 217,273.93 | 1.24 |
| Gasperich | 3,449,516.40 | 1,694,743.56 | 0.49 | 1,856,934.37 | 0.54 |
| Merl-Sud | 4,011,460.83 | 3,210,661.38 | 0.80 | 3,423,023.68 | 0.85 |
| Clausen | 601,469.02 | 399,212.13 | 0.66 | 459,198.93 | 0.76 |
| Beggen | 1,133,763.20 | 626,895.06 | 0.55 | 755,686.25 | 0.67 |
| Dommeldange | 2,926,149.86 | 1,323,058 | 0.45 | 1,420,293.18 | 0.49 |
| Hamm | 5,775,969.44 | 1,849,161.06 | 0.32 | 2,550,945.12 | 0.44 |
| Eich | 2,381,337.22 | 722,590.13 | 0.30 | 791,180.93 | 0.33 |
| Cessange | 4,934,991.40 | 1,159,693 | 0.23 | 1,820,010 | 0.37 |
| Pulvermuehl | 302,362.01 | 126,943 | 0.42 | 138,498.81 | 0.46 |
| Rollingergrund | 7,790,154.86 | 1,668,265.25 | 0.21 | 1,765,808.25 | 0.23 |
| Kockelscheuer | 428,491.16 | 3567.5 | 0.01 | 3597.25 | 0.01 |
| Luxembourg City | 51,734,578.06 | 40,027,585.30 | 0.77 | 46,552,603.59 | 0.90 |
References
- Anees, M.M.; Mann, D.; Sharma, M.; Banzhaf, E.; Joshi, P.K. Assessment of Urban Dynamics to Understand Spatiotemporal Differentiation at Various Scales Using Remote Sensing and Geospatial Tools. Remote Sens. 2020, 12, 1306. [Google Scholar] [CrossRef] [Green Version]
- Kajimoto, M.; Susaki, J. Urban Density Estimation from Polarimetric SAR Images Based on a POA Correction Method. IEEE J. Sel. Top. Appl. Earth Obs. Remote Sens. 2013, 6, 1418–1429. [Google Scholar] [CrossRef] [Green Version]
- Peng, F.; Gong, J.; Wang, L.; Wu, H.; Yang, J. Impact of building heights on 3D urban density estimation from spaceborne stereo imagery. Int. Arch. Photogramm. Remote Sens. Spat. Inf. Sci. 2016, 41, 677–683. [Google Scholar] [CrossRef]
- Gonzalez-Aguilera, D.; Crespo-Matellan, E.; Hernandez-Lopez, D.; Rodriguez-Gonzalvez, P. Automated Urban Analysis Based on LiDAR-Derived Building Models. IEEE Trans. Geosci. Remote Sens. 2013, 51, 1844–1851. [Google Scholar] [CrossRef]
- Zhang, T.; Huang, X.; Wen, D.; Li, J. Urban Building Density Estimation from High-Resolution Imagery Using Multiple Features and Support Vector Regression. IEEE J. Sel. Top. Appl. Earth Obs. Remote Sens. 2017, 10, 3265–3280. [Google Scholar] [CrossRef]
- Yu, B.; Liu, H.; Wu, J.; Hu, Y.; Zhang, L. Automated derivation of urban building density information using airborne LiDAR data and object-based method. Landsc. Urban Plan. 2010, 98, 210–219. [Google Scholar] [CrossRef]
- Unsalan, C.; Boyer, K.L. A system to detect houses and residential street networks in multispectral satellite images. Comput. Vis. Image Underst. 2005, 98, 423–461. [Google Scholar] [CrossRef]
- Thiele, A.; Cadario, E.; Schulz, K.; Thonnessen, U.; Soergel, U. Building recognition from multi-aspect high-resolution InSAR data in urban areas. IEEE Trans. Geosci. Remote Sens. 2007, 45, 3583–3593. [Google Scholar] [CrossRef]
- San, D.K.; Turker, M. Building extraction from high resolution satellite images using hough transform. Int. Arch. Photogramm. Remote Sens. Spat. Inf. Sci. 2010, 38, 1063–1068. [Google Scholar]
- Wang, L.; Omrani, H.; Zhao, Z.; Francomano, D.; Li, K.; Pijanowski, B. Analysis on urban densification dynamics and future modes in southeastern Wisconsin, USA. PLoS ONE 2019, 14, e0211964. [Google Scholar] [CrossRef]
- Pili, S.; Grigoriadis, E.; Carlucci, M.; Clemente, M.; Salvati, L. Towards sustainable growth? A multi-criteria assessment of (changing) urban forms. Ecol. Indic. 2017, 76, 71–80. [Google Scholar] [CrossRef]
- Aburas, M.M.; Ho, Y.M.; Ramli, M.F.; Ash’aari, Z.H. Monitoring and assessment of urban growth patterns using spatio-temporal built-up area analysis. Environ. Monit. Assess. 2018, 190, 156. [Google Scholar] [CrossRef] [PubMed]
- Blaschke, T.; Hay, G.J.; Kelly, M.; Lang, S.; Hofmann, P.; Addink, E.; Tiede, D. Geographic object based image analysis—Towards a new paradigm. Isprs J. Photogramm. Remote Sens. 2014, 87, 180–191. [Google Scholar] [CrossRef] [Green Version]
- Benz, U.C.; Hofmann, P.; Willhauck, G.; Lingenfelder, I.; Heynen, M. Multi-resolution, object-oriented fuzzy analysis of remote sensing data for GIS-ready information. ISPRS J. Photogramm. Remote Sens. 2004, 58, 239–258. [Google Scholar] [CrossRef]
- Chen, G.; Weng, Q.; Hay, G.J.; He, Y. Geographic object-based image analysis (GEOBIA): Emerging trends and future opportunities. GISci. Remote Sens. 2018, 55, 159–182. [Google Scholar] [CrossRef]
- Wężyk, P.; Hawryło, P.; Szostak, M. Determination of the number of trees in the Bory Tucholskie National Park using crown delineation of the canopy height models derived from aerial photos matching and airborne laser scanning data. Arch. Fotogram. Kartogr. Teledetekcji 2016, 28, 137–156. [Google Scholar] [CrossRef]
- Simonetto, E.; Oriot, H.; Garello, R. Rectangular building extraction from stereoscopic airborne radar images. IEEE Trans. Geosci. Remote Sens. 2005, 43, 2386–2395. [Google Scholar] [CrossRef]
- Sohn, G.; Dowman, I. Data fusion of high-resolution satellite imagery and LiDAR data for automatic building extraction. ISPRS J. Photogramm. Remote Sens. 2007, 62, 43–63. [Google Scholar] [CrossRef]
- Turlapaty, A.; Gokaraju, B.; Du, Q.; Younan, N.H.; Aanstoos, J.V. A hybrid approach for building extraction from spaceborne multi-angular optical imagery. IEEE J. Sel. Top. Appl. Earth Obs. Remote Sens. 2012, 5, 89–100. [Google Scholar] [CrossRef]
- Davydova, K.; Cui, S.; Reinartz, P. Building footprint extraction from digital surface models using neural networks. In Proceedings of the Image and Signal Processing for Remote Sensing XXII, Edinburgh, UK, 26–28 September 2016; Volume 1004, p. 100040J. [Google Scholar] [CrossRef] [Green Version]
- Bittner, K.; Adam, F.; Cui, S.; Korner, M.; Reinartz, P. Building footprint extraction from VHR remote sensing images combined with normalized DSMs using fused fully convolutional networks. IEEE J. Sel. Top. Appl. Earth Obs. Remote Sens. 2018, 11, 2615–2629. [Google Scholar] [CrossRef] [Green Version]
- Zhu, Z.; Zhou, Y.; Seto, K.C.; Stokes, E.C.; Deng, C.; Pickett, S.T.A.; Taubenböck, H. Understanding an urbanizing planet: Strategic directions for remote sensing. Remote Sens. Environ. 2019, 228, 164–182. [Google Scholar] [CrossRef]
- Shao, Y.; Taff, G.N.; Walsh, S.J. Shadow detection and building-height estimation using IKONOS data. Int. J. Remote Sens. 2011, 32, 6929–6944. [Google Scholar] [CrossRef]
- Kadhim, N.; Mourshed, M. A shadow-overlapping algorithm for estimating building heights from VHR satellite images. IEEE Geosci. Remote Sens. Lett. 2018, 15, 8–12. [Google Scholar] [CrossRef] [Green Version]
- Brunner, D.; Lemoine, G.; Bruzzone, L.; Greidanus, H. Building height retrieval from VHR SAR imagery based on an iterative simulation and matching technique. IEEE Trans. Geosci. Remote Sens. 2010, 48, 1487–1504. [Google Scholar] [CrossRef]
- Wang, Z.; Jiang, L.; Lin, L.; Yu, W. Building height estimation from high resolution SAR imagery via model-based geometrical structure prediction. Prog. Electromagn. Res. 2015, 41, 11–24. [Google Scholar] [CrossRef] [Green Version]
- Sun, Y.; Hua, Y.; Mou, L.; Zhu, X.X. Large-scale building height estimation from single VHR SAR image using fully convolutional network and GIS building footprints. Joint Urb. Remote Sens. Event JURSE 2019, 90, 1–4. [Google Scholar]
- Aguilar, M.A.; Saldana, M.; Aguilar, F.J. Generation and quality assessment of stereo-extracted DSM from GeoEye-1 and WorldView-2 imagery. IEEE Trans. Geosci. Remote Sens. 2014, 52, 1259–1271. [Google Scholar] [CrossRef]
- Zeng, C. Automated Building Information Extraction and Evaluation from High-Resolution Remotely Sensed Data. Electron. Thesis Diss. Repos. 2014, 2076. Available online: https://ir.lib.uwo.ca/etd/2076 (accessed on 11 October 2020).
- Lillesand, T.M.; Kiefer, R.W.; Chipman, J. Lidar Data Analysis and Applications. In Remote Sensing and Image Interpretation, 7th ed.; John Wiley & Sons: Hoboken, NJ, USA, 2015; pp. 475–482. [Google Scholar]
- Kedron, P.; Zhao, Y.; Frazier, A.E. Three dimensional (3D) spatial metrics for objects. Landsc. Ecol. 2019, 34, 2123–2132. [Google Scholar] [CrossRef]
- Park, Y.; Guldmann, J.M. Creating 3D city models with building footprints and LiDAR point cloud classification: A machine learning approach. Comput. Environ. Urban Syst. 2019, 75, 76–89. [Google Scholar] [CrossRef]
- Toschi, I.; Nocerino, E.; Remondino, F. Geomatics makes smart cities a reality. GIM Int. 2017, 31, 25–27. [Google Scholar]
- Li, M.; Koks, E.; Taubenböc, H.; Vliet, J. Continental-scale mapping and analysis of 3D building structure. Remote Sens. Environ. 2020, 245, 111859. [Google Scholar] [CrossRef]
- Wang, P.; Huang, C.; Tilton, J. Mapping Three-dimensional Urban Structure by Fusing Landsat and Global Elevation Data. arXiv 2018, arXiv:1807.04368. [Google Scholar]
- EMU Analytics. Available online: https://buildingheights.emu-analytics.net (accessed on 10 March 2020).
- Krehl, A.; Siedentop, S.; Taubenböck, H.; Wurm, M. A comprehensive view on urban spatial structure: Urban density patterns of German City Regions. ISPRS Int. J. Geo Inf. 2016, 5, 76. [Google Scholar] [CrossRef] [Green Version]
- Shirowzhan, S.; Trinder, J.; Osmond, P. New Metrics for Spatial and Temporal 3D Urban Form Sustainability Assessment Using Time Series Lidar Point Clouds and Advanced GIS Techniques. Intechopen [Online First] 2019. Available online: https://www.intechopen.com/online-first/new-metrics-for-spatial-and-temporal-3d-urban-form-sustainability-assessment-using-time-series-lidar (accessed on 11 October 2020).
- Decoville, A.; Schneider, M. Can the 2050 zero land take objective of the EU be reliably monitored? A comparative study. J. Land Use Sci. 2016, 11, 331–349. [Google Scholar] [CrossRef]
- STATEC. Atlas Démographique du Luxembourg; STATEC Institut National de la Statistique et des Études Économiques: Luxembourg, 2019; Volume 2.
- Omrani, H.; Abdallah, F.; Charif, O.; Longford, N.T. Multi-label class assignment in land-use modelling. Int. J. Geogr. Inf. Sci. 2015, 29, 1023–1041. [Google Scholar] [CrossRef]
- Omrani, H.; Tayyebi, A.; Pijanowski, B. Integrating the multi-label land-use concept and cellular automata with the artificial neural network-based Land Transformation Model: An integrated ML-CA-LTM modeling framework. Gisc. Remote Sens. 2017, 54, 283–304. [Google Scholar] [CrossRef] [Green Version]
- Housing Observatory. 2013. Available online: http://observatoire.liser.lu/pdfs/DossierThematique_OBS_2013.pdf (accessed on 30 May 2020).
- Housing Observatory. 2019. Available online: http://observatoire.liser.lu/pdfs/DossierThematique_OBS_2019_02.pdf (accessed on 30 May 2020).
- Baatz, M.; Schape, A. Multiresolution segmentation: An optimization approach for high quality multi-scale image segmentation. J. Photogramm. Remote Sens. 2000, 58, 12–23. [Google Scholar]
- Zięba-Kulawik, K.; Wężyk, P. Detekcja zmian roślinności wysokiej Krakowa w latach 2016–2017 przy wykorzystaniu analizy GEOBIA zobrazowań satelitarnych RapidEye (Planet). Współczesne Probl. Kierun. Badaw. Geogr. Inst. Geogr. Gospod. Przestrz. UJ 2019, 7, 199–226. [Google Scholar]
- Wężyk, P.; Hawryło, P.; Janus, B.; Weidenbach, M.; Szostak, M. Forest cover changes in Gorce NP (Poland) using photointerpretation of analogue photographs and GEOBIA of orthophotos and nDSM based on image-matching based approach. Eur. J. Remote Sens. 2018, 51, 501–510. [Google Scholar] [CrossRef]
- Congalton, R.G.; Green, K. Assessing the Accuracy of Remotely Sensed Data Principles and Practices, 2nd ed.; CRC Press Taylor & Francis Group: Boca Raton, FL, USA, 2009. [Google Scholar]
- Foody, G.M. Status of land cover classification accuracy assessment. Remote Sens. Environ. 2002, 80, 185–201. [Google Scholar] [CrossRef]
- Chen, X.; Yu, Y.; Zhu, P. Study from Building Density to Building 3D Density. In Proceedings of the IEEE International Conference on Management and Service Science, Wuhan, China, 20–22 September 2009; pp. 1–5. [Google Scholar] [CrossRef]
- TerraScan User’s Guide. 2016. Available online: https://www.terrasolid.com/download/tscan.pdf (accessed on 12 March 2020).
- Santos, T.; Rodrigues, A.M.; Tenedório, J.A. Characterizing urban volumetry using LiDAR data. Int. Arch. Photogramm. Remote Sens. Spat. Inf. Sci. 2013, 40, 71–75. [Google Scholar] [CrossRef] [Green Version]
- Tiwari, A.; Meir, I.A.; Karnieli, A. Object-based image procedures for assessing the solar energy photovoltaic potential of heterogeneous rooftops using airborne LiDAR and orthophoto. Remote Sens. 2020, 12, 223. [Google Scholar] [CrossRef] [Green Version]
- Fan, S.; Liu, Z.; Hu, Y. Extraction of Building Information Using Geographic Object-Based Image Analysis. In Proceedings of the 4th International Workshop on Earth Observation and Remote Sensing Applications (EORSA), Guangzhou, China, 4–6 July 2016. [Google Scholar] [CrossRef]
- Warth, G.; Braun, A.; Assmann, O.; Fleckenstein, K.; Hochschild, V. Prediction of socio-economic indicators for urban planning using VHR satellite imagery and spatial analysis. Remote Sens. 2020, 12, 1730. [Google Scholar] [CrossRef]
- Airbus Defence and Space. Pléiades Neo. Trusted Intelligence. Available online: https://www.intelligence-airbusds.com/en/8671-pleiades-neo-trusted-intelligence (accessed on 31 July 2020).
- Maxar. WorldView Legion. Our Next-Generation Constellation. Available online: https://www.maxar.com/splash/worldview-legion (accessed on 31 July 2020).
- Programme Directeur d’Amenagement du Territoire. 2003. Available online: https://amenagement-territoire.public.lu/damassets/fr/publications/documents/programme_directeur/programme_directeur_2003_fr_partie_a_hr.pdf (accessed on 15 May 2020).






| Data Name | Data Sources | Date of Data Acqusition | Format | Density/GSD/Resolution/Accuracy |
|---|---|---|---|---|
| ALS LiDAR point cloud | Open Data 1 | 7–25 February 2019 | .las | ~15 pts/m2 |
| Orthophotos RGB/CIR | Open Data 1 | 24–26 August 2001 3 | .tif | 0.50 m |
| 1–2 July 2010 | 0.25 m | |||
| 22 August 2019 | 0.20 m | |||
| Cadastral shapefile | Open Data 1 | 24 February 2019 | .shp | - |
| Demolition-reconstruction information | Housing Observatory 2 | 2001–2019 | .shp | - |
| Urban Atlas—Building Height | European Environment Agency | 2011 | .tif | 10 m |
| Corine Land Cover (CLC) | European Environment Agency | 2000 | .shp | 25 m |
| 2012 | 25 m | |||
| 2018 | 10 m |
| Classification Results/Reference Data | Buildings | Unclassified | Sum | UA (%) |
|---|---|---|---|---|
| Buildings | 142 | 7 | 149 | 95.3 |
| Unclassified | 5 | 144 | 149 | 96.6 |
| Sum | 147 | 151 | ||
| PA (%) | 96.6 | 95.4 | ||
| Overall Accuracy | 96.0% | |||
| Classification Results/Reference Data | Buildings | Unclassified | Sum | UA (%) |
|---|---|---|---|---|
| Buildings | 144 | 5 | 149 | 96.6 |
| Unclassified | 3 | 146 | 149 | 98.0 |
| Sum | 147 | 151 | ||
| PA (%) | 98.0 | 96.7 | ||
| Overall Accuracy | 97.3% | |||
Publisher’s Note: MDPI stays neutral with regard to jurisdictional claims in published maps and institutional affiliations. |
© 2020 by the authors. Licensee MDPI, Basel, Switzerland. This article is an open access article distributed under the terms and conditions of the Creative Commons Attribution (CC BY) license (http://creativecommons.org/licenses/by/4.0/).
Share and Cite
Zięba-Kulawik, K.; Skoczylas, K.; Mustafa, A.; Wężyk, P.; Gerber, P.; Teller, J.; Omrani, H. Spatiotemporal Changes in 3D Building Density with LiDAR and GEOBIA: A City-Level Analysis. Remote Sens. 2020, 12, 3668. https://doi.org/10.3390/rs12213668
Zięba-Kulawik K, Skoczylas K, Mustafa A, Wężyk P, Gerber P, Teller J, Omrani H. Spatiotemporal Changes in 3D Building Density with LiDAR and GEOBIA: A City-Level Analysis. Remote Sensing. 2020; 12(21):3668. https://doi.org/10.3390/rs12213668
Chicago/Turabian StyleZięba-Kulawik, Karolina, Konrad Skoczylas, Ahmed Mustafa, Piotr Wężyk, Philippe Gerber, Jacques Teller, and Hichem Omrani. 2020. "Spatiotemporal Changes in 3D Building Density with LiDAR and GEOBIA: A City-Level Analysis" Remote Sensing 12, no. 21: 3668. https://doi.org/10.3390/rs12213668
APA StyleZięba-Kulawik, K., Skoczylas, K., Mustafa, A., Wężyk, P., Gerber, P., Teller, J., & Omrani, H. (2020). Spatiotemporal Changes in 3D Building Density with LiDAR and GEOBIA: A City-Level Analysis. Remote Sensing, 12(21), 3668. https://doi.org/10.3390/rs12213668


