The Integration of Remote Sensing and Field Surveys to Detect Ecologically Damaged Areas for Restoration in South Korea

 , ,
, , 
Abstract
:
1. Introduction
2. Materials and Methods
2.1. Study Area
2.2. Materials
2.2.1. Land-Cover Data
2.2.2. Land-Use Data
2.2.3. The Area Subject to Environmental Impact Assessment Data (EIA Map)
2.2.4. Google Earth Data
2.3. Methods
2.3.1. Land-Cover Change Analysis
2.3.2. Analysis of Illegal Damaged Area
2.3.3. Modification Using Google Earth Data
2.3.4. Field Survey
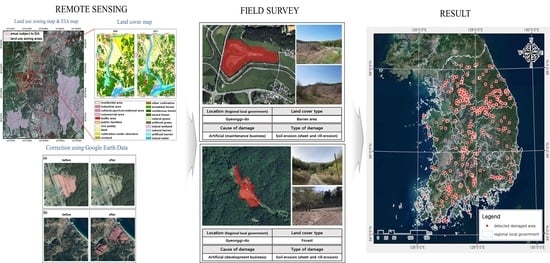
3. Results
3.1. Damaged Area Detection
3.2. Field Surveys
3.2.1. Status of Damaged Areas by Region
3.2.2. Status of Damaged Areas by Causes and Types
4. Discussion
5. Conclusions
Author Contributions
Funding
Conflicts of Interest
Appendix A

| Division | Total | Ongoing | Finished | |||
|---|---|---|---|---|---|---|
| Number | Area (1000 m2) | Number | Area (1000 m2) | Number | Area (1000 m2) | |
| Seoul * | 10 | 9858 | 10 | 9858 | - | - |
| Busan * | 10 | 1557 | 2 | 1303 | 8 | 254 |
| Daegu * | 13 | 859 | 9 | 709 | 4 | 150 |
| Incheon * | 29 | 10,628 | 19 | 7305 | 10 | 3323 |
| Gwangju * | 13 | 2282 | 8 | 2085 | 5 | 197 |
| Daejeon * | 14 | 4412 | 8 | 949 | 6 | 3463 |
| Ulsan * | 11 | 4379 | 9 | 4043 | 2 | 336 |
| Sejong * | 1 | 232 | 1 | 232 | - | - |
| Gyeonggi-do | 138 | 47,278 | 104 | 38,460 | 34 | 8818 |
| Gangwon-do | 17 | 2283 | 10 | 1730 | 7 | 553 |
| Chungcheongbuk-do | 14 | 3296 | 12 | 2998 | 2 | 298 |
| Chungcheongnam-do | 54 | 13,634 | 25 | 6165 | 29 | 7469 |
| Jeollabuk-do | 10 | 8670 | 5 | 5038 | 5 | 3632 |
| Jeollanam-do | 20 | 7952 | 12 | 6456 | 8 | 1496 |
| Gyeongsangbuk-do | 40 | 10,668 | 24 | 8634 | 16 | 2034 |
| Gyeongsangnam-do | 51 | 16,424 | 26 | 11,042 | 25 | 5382 |
| total (column) | 445 | 144,412 | 284 | 107,007 | 161 | 37,405 |
Appendix B

References
- Fereidoun, H.; Nourddin, M.S.; Rreza, N.A.; Mohsen, A.; Ahmad, R.; Pouria, H. The effect of long-term exposure to particulate pollution on the lung function of Teheranian and Zanjanian students. Pak. J. Physiol. 2007, 3. [Google Scholar]
- Reed, M.S.; Dougill, A.J.; Taylor, M.J. Integrating local and scientific knowledge for adaptation to land degradation: Kalahari rangeland management options. Land Degrad. Dev. 2007, 18, 249–268. [Google Scholar] [CrossRef]
- Costanza, R.; De Groot, R.; Sutton, P.; Ploeg, S.; Anderson, S.; Kubiszewski, I.; Farber, S.; Turner, R.K. Changes in the global value of ecosystem services. Glob. Environ. Chang. 2014, 26, 152–158. [Google Scholar] [CrossRef]
- Hobbs, R.J.; Cramer, V.A. Restoration ecology: Interventionist approaches for restoring and maintaining ecosystem function in the face of rapid environmental change. Annu. Rev. Environ. Resour. 2008, 33, 39–61. [Google Scholar] [CrossRef]
- Aradóttir, Á.L.; Petursdottir, T.; Halldorsson, G.; Svavarsdottir, K.; Arnalds, O. Drivers of ecological restoration: Lessons from a century of restoration in Iceland. Ecol. Soc. 2013, 18, 14. [Google Scholar] [CrossRef] [Green Version]
- Luuppala, L. Ecological Restoration: Conceptual Analysis and Ethical Implications; HELDA—University of Helsinki: Helsinki, Finland, 2015.
- Ministry of Environment. Research for the Systematic Restoration of the Damaged Natural Environment; Republic of Korea, Ministry of Environment: Sejong City, Korea, 2011. (In Korean) [Google Scholar]
- Suding, K.N. Toward an era of restoration in ecology: Successes, failures, and opportunities ahead. Annu. Rev. Ecol. Evol. Syst. 2011, 42, 465–487. [Google Scholar] [CrossRef] [Green Version]
- Zhang, D.; Jia, Q.; Wang, P.; Zhang, J.; Hou, X.; Li, X.; Li, W. Analysis of spatial variability in factors contributing to vegetation restoration in Yan’an, China. Ecol. Indic. 2020, 113, 1062–1078. [Google Scholar] [CrossRef]
- DeLuca, T.H.; Aplet, G.H.; Wilmer, B.; Burchfield, J. The unknown trajectory of forest restoration: A call for ecosystem monitoring. J. For. 2010, 108, 288–295. [Google Scholar]
- Hooper, M.J.; Glomb, S.J.; Harper, D.D.; Hoelzle, T.B.; McIntosh, L.M.; Mulligan, D.R. Integrated risk and recovery monitoring of ecosystem restorations on contaminated sites. Integr. Environ. Assess. Manag. 2016, 12, 284–295. [Google Scholar] [CrossRef] [Green Version]
- Nagendra, H.; Lucas, R.; Honrado, J.P.; Jongman, R.H.; Tarantino, C.; Adamo, M.; Mairota, P. Remote sensing for conservation monitoring: Assessing protected areas, habitat extent, habitat condition, species diversity, and threats. Ecol. Indic. 2013, 33, 45–59. [Google Scholar] [CrossRef]
- Lu, D.; Mausel, P.; Brondizio, E.; Moran, E. Change detection techniques. Int. J. Remote Sens. 2004, 25, 2365–2401. [Google Scholar] [CrossRef]
- Bellón, B.; Blanco, J.; Vos, A.D.; Roque, F.D.O.; Pays, O.; Renaud, P.C. Integrated Landscape Change Analysis of Protected Areas and their Surrounding Landscapes: Application in the Brazilian Cerrado. Remote Sens. 2020, 12, 1413. [Google Scholar] [CrossRef]
- Kintz, D.B.; Young, K.R.; Crews-Meyer, K.A. Implications of land use/land cover change in the buffer zone of a national park in the tropical Andes. Environ. Manag. 2006, 38, 238–252. [Google Scholar] [CrossRef] [PubMed]
- Reif, M.K.; Theel, H.J. Remote sensing for restoration ecology: Application for restoring degraded, damaged, transformed, or destroyed ecosystems. Integr. Environ. Assess. Manag. 2017, 13, 614–630. [Google Scholar] [CrossRef]
- Scharsich, V.; Mtata, K.; Hauhs, M.; Lange, H.; Bogner, C. Analysing land cover and land use change in the Matobo National Park and surroundings in Zimbabwe. Remote Sens. Environ. 2017, 194, 278–286. [Google Scholar] [CrossRef] [Green Version]
- Szantoi, Z.; Brink, A.; Buchanan, G.; Bastin, L.; Lupi, A.; Simonetti, D.; Mayaux, P.; Peedell, S.; Davy, J. A simple remote sensing-based information system for monitoring sites of conservation importance. Remote Sens. Ecol. Conserv. 2016, 2, 16–24. [Google Scholar] [CrossRef]
- Willis, K.S. Remote sensing change detection for ecological monitoring in United States protected areas. Biol. Conserv. 2015, 182, 233–242. [Google Scholar] [CrossRef]
- Bull, J.W.; Suttle, K.B.; Gordon, A.; Singh, N.J.; Milner-Gulland, E.J. Biodiversity offsets in theory and practice. Oryx 2013, 47, 369–380. [Google Scholar] [CrossRef] [Green Version]
- Martin, N.; Evans, M.; Rice, J.; Lodhia, S.; Gibbons, P. Using offsets to mitigate environmental impacts of major projects: A stakeholder analysis. J. Environ. Manag. 2016, 179, 58–65. [Google Scholar] [CrossRef] [Green Version]
- CSBI (Cross Sector Biodiversity Initiative). A Cross-Sector Guide for Implementing the Mitigation Hierarchy; Biodiversity Consultancy: Cambridge, UK, 2015. [Google Scholar]
- Rhodes, C.J.; Henrys, P.; Siriwardena, G.M.; Whittingham, M.J.; Norton, L.R. The relative value of field survey and remote sensing for biodiversity assessment. Methods Ecol. Evol. 2015, 6, 772–781. [Google Scholar] [CrossRef]
- Yoo, C.; Im, J.; Cho, D.; Yokoya, N.; Xia, J.; Bechtel, B. Estimation of All-Weather 1 km MODIS Land Surface Temperature for Humid Summer Days. Remote Sens. 2020, 12, 1398. [Google Scholar] [CrossRef]
- Environmental Geographic Information System. Available online: http://egis.me.go.kr (accessed on 13 August 2018).
- Cohen, W.B.; Goward, S.N. Landsat’s role in ecological applications of remote sensing. Bioscience 2004, 54, 535–545. [Google Scholar] [CrossRef]
- Natoli, S.J. Zoning and the development of urban land use patterns. Econ. Geogr. 1971, 47, 171–184. [Google Scholar] [CrossRef]
- Xia, Y.; Liu, D.; Liu, Y.; He, J.; Hong, X. Alternative zoning scenarios for regional sustainable land use controls in China: A knowledge-based multi objective optimisation model. Int. J. Environ. Res. Public Health 2014, 11, 8839–8866. [Google Scholar] [CrossRef] [PubMed] [Green Version]
- Qian, Z. Without zoning: Urban development and land use controls in Houston. Cities 2010, 27, 31–41. [Google Scholar] [CrossRef]
- Rossi-Hansberg, E. Optimal urban land use and zoning. Rev. Econ. Dyn. 2004, 7, 69–106. [Google Scholar] [CrossRef]
- Xu, X.; Hou, L.; Lin, H.; Liu, W. Zoning of sustainable agricultural development in China. Agric. Syst. 2006, 87, 38–62. [Google Scholar] [CrossRef]
- Ministry of Land, Infrastructure and Transport. National Land Planning and Utilization Act; Republic of Korea, Ministry of Land, Infrastructure and Transport: Sejong City, Korea, 2017.
- National Spatial Data Information Portal. Available online: http://www.nsdi.go.kr/ (accessed on 14 August 2018).
- Li, J.C. Environmental Impact Assessments in Developing Countries: An Opportunity for Greater Environmental Security; USAID, FESS: Washington, DC, USA, 2008.
- El-Gafy, M.A.; Abdelrazig, Y.A.; Abdelhamid, T.S. Environmental impact assessment for transportation projects: Case study using remote-sensing technology, geographic information systems, and spatial modeling. J. Urban Plan. Dev. 2011, 137, 153–158. [Google Scholar] [CrossRef]
- Moufaddal, W.M. Use of satellite imagery as environmental impact assessment tool: A case study from the NW Egyptian Red Sea coastal zone. Environ. Monit. Assess. 2005, 107, 427–452. [Google Scholar] [CrossRef]
- Saroglu, E.; Bektas, F.; Dogru, A.O.; Ormeci, C.; Musaoglu, N.; Kaya, S. Environmental impact analyses of quarries located on the Asian side of Istanbul using remotely sensed data. In Proceedings of the XXII International Cartographic Conference (ICC), Corunna, Spain, 3–8 July 2011. [Google Scholar]
- Ministry of Environment. Environmental Impact Assessment Act; Republic of Korea, Ministry of Environment: Sejong City, Korea, 2018.
- Environmental Impact Assessment Support System. Available online: https://www.eiass.go.kr (accessed on 18 August 2018).
- Pulighe, G.; Baiocchi, V.; Lupia, F. Horizontal accuracy assessment of very high resolution Google Earth images in the city of Rome, Italy. Int. J. Digit. Earth 2016, 9, 342–362. [Google Scholar] [CrossRef]
- Eskandari, S.; Reza Jaafari, M.; Oliva, P.; Ghorbanzadeh, O.; Blaschke, T. Mapping Land Cover and Tree Canopy Cover in Zagros Forests of Iran: Application of Sentinel-2, Google Earth, and Field Data. Remote Sens. 2020, 12, 1912. [Google Scholar] [CrossRef]
- Benker, S.C.; Langford, R.P.; Pavlis, T.L. Positional accuracy of the Google Earth terrain model derived from stratigraphic unconformities in the Big Bend region, Texas, USA. Geocarto Int. 2011, 26, 291–303. [Google Scholar] [CrossRef]
- Ministry of Environment. Natural Environment Conservation Act; Republic of Korea, Ministry of Environment: Sejong City, Korea, 2018.
- Ministry of Environment. Enforcement Decree of The Environmental Impact Assessment Act; Republic of Korea, Ministry of Environment: Sejong City, Korea, 2019.
- Victoria Resources Online (VRO). Available online: http://vro.agriculture.vic.gov.au (accessed on 28 September 2018).
- MOLIT Statistics System. Available online: http://stat.molit.go.kr (accessed on 5 April 2020).
- Lee, C.J.; Yoo, N.J. A Study on Devris Flow Landslide Disasters and Restoration at Inje of Kangwon Province, Korea. J. Korean Soc. Hazard Mitig. 2009, 9, 99–106. [Google Scholar]
- Zhang, Q.; Zhang, T.; Liu, X. Index system to evaluate the quarries ecological restoration. Sustainability 2018, 10, 619. [Google Scholar] [CrossRef] [Green Version]
- Pimentel, D.; Kounang, N. Ecology of soil erosion in ecosystems. Ecosystems 1998, 1, 416–426. [Google Scholar] [CrossRef]
- Aulakh, M.S.; Sidhu, G.S. Soil degradation in India: Causes, major threats, and management options. In Proceedings of the MARCO symposium, Tsukuba, Japan, 26–28 August 2015; pp. 151–156. [Google Scholar]
- Elmqvist, T.; Zipperer, W.G.; Guneralp, B. Urbanization, habitat loss, biodiversity decline: Solution pathways to break the cycle. In Routledge Handbook of Urbanization and Global Environmental Change; Seta, K., Solecki, W., Griffith, D., Corrie, A., Eds.; Routledge: London, UK, 2016; pp. 139–151. [Google Scholar]


| Original Classification | Classification for This Study | |
|---|---|---|
| Level 1 | Level 2 | |
| Urban Area | Residential Area | Developed Area |
| Industrial Area | ||
| Commercial Area | ||
| Cultural, Sport, recreational Area | ||
| Traffic Area | ||
| Public Facilities | ||
| Agricultural Land | Rice Paddy | Natural and Semi-Natural Environment Area |
| Field | ||
| Cultivation under Structure | ||
| Orchard | ||
| Other Cultivation | ||
| Forest | Broadleaf Forest | |
| Coniferous Forest | ||
| Mixed Forest | ||
| Grass | Natural Grass | |
| Artificial Grass | ||
| Wetland | Inland Wetland | |
| Coastal Wetland | ||
| Barren | Natural Barren | Potentially Damaged Area |
| Artificial Barren | ||
| Water | Inland Water | Water |
| Seawater | ||
| Division | Description |
|---|---|
| Urban areas | Areas requiring systematic development, maintenance, management, preservation, etc., where the population and industries are concentrated, or such concentration is anticipated therein |
| Control areas | Areas to be systematically controlled corresponding to urban areas to accommodate the population and industries of urban areas or those requiring control corresponding to an agricultural and forest area or natural environment conservation area to promote the agricultural and forest industry and preserve the natural environment or forests |
| Agricultural and forest areas | Areas necessary to promote the agricultural and forest industry and preserve forests, such as agricultural promotion areas under the Farmland Act or conserved mountainous districts under the Mountainous Districts Management Act that do not belong to urban areas |
| Natural environment conservation areas | Areas necessary to preserve the natural environment, water resources, coastal areas, ecosystems, water supply resources, and cultural heritage assets and protect and foster fishery resources, etc. |
| Division | Cause of the Damage | Type of Damage |
|---|---|---|
| Natural damage |
|
|
| Anthropogenic damage |
|
| Division | 5000– 10,000 m2 | 10,000– 50,000 m2 | 50,000– 100,000 m2 | 100,000– 150,000 m2 | 150,000– 200,000 m2 | 200,000– 250,000 m2 | 250,000– 300,000 m2 | 300,000 m2~ | Total (Row) |
|---|---|---|---|---|---|---|---|---|---|
| Seoul * | 2 | 1 | 1 | 0 | 0 | 0 | 0 | 0 | 4 (2%) |
| Busan * | 1 | 1 | 0 | 0 | 0 | 0 | 0 | 0 | 2 (1%) |
| Daegu * | 0 | 0 | 0 | 0 | 0 | 0 | 0 | 0 | 0 (0%) |
| Incheon * | 0 | 0 | 0 | 0 | 0 | 0 | 0 | 0 | 0 (0%) |
| Gwangju * | 1 | 0 | 0 | 0 | 0 | 0 | 0 | 0 | 1 (1%) |
| Daejeon * | 0 | 0 | 0 | 0 | 0 | 0 | 0 | 0 | 0 (0%) |
| Ulsan * | 1 | 1 | 0 | 0 | 0 | 0 | 0 | 0 | 2 (1%) |
| Sejong * | 0 | 0 | 0 | 0 | 0 | 0 | 0 | 0 | 0 (0%) |
| Gyeonggi-do | 20 | 53 | 4 | 0 | 2 | 1 | 3 | 0 | 84 (21%) |
| Gangwon-do | 25 | 44 | 5 | 4 | 0 | 1 | 0 | 3 | 82 (20%) |
| Chungcheong buk-do | 20 | 29 | 3 | 0 | 0 | 0 | 0 | 0 | 52 (13%) |
| Chungcheong nam-do | 10 | 14 | 1 | 1 | 0 | 0 | 0 | 0 | 26 (6%) |
| Jeolla buk-do | 10 | 10 | 1 | 0 | 0 | 1 | 1 | 0 | 23 (5%) |
| Jeolla nam-do | 17 | 20 | 6 | 1 | 0 | 0 | 0 | 0 | 44 (11%) |
| Gyeongsang buk-do | 9 | 20 | 3 | 2 | 0 | 0 | 0 | 0 | 34 (8%) |
| Gyeongsang nam-do | 17 | 21 | 2 | 3 | 0 | 0 | 0 | 2 | 45 (11%) |
| Total (column) | 133 (33%) | 215 (54%) | 26 (6%) | 11 (3%) | 2 (1%) | 3 (1%) | 4 (1%) | 5 (1%) | 399 (100%) |
| Division | 5000– 10,000 m2 | 10,000– 50,000 m2 | 50,000– 100,000 m2 | 100,000– 150,000 m2 | 150,000– 200,000 m2 | 200,000– 250,000 m2 | 250,000– 300,000 m2 | 300,000 m2~ | Total (Row) |
|---|---|---|---|---|---|---|---|---|---|
| Seoul * | 1 | 1 | 1 | 0 | 0 | 0 | 0 | 0 | 3 (1%) |
| Busan * | 1 | 1 | 0 | 0 | 0 | 0 | 0 | 0 | 2 (1%) |
| Daegu * | 0 | 0 | 0 | 0 | 0 | 0 | 0 | 0 | 0 (0%) |
| Incheon * | 0 | 0 | 0 | 0 | 0 | 0 | 0 | 0 | 0 (0%) |
| Gwangju * | 0 | 0 | 0 | 0 | 0 | 0 | 0 | 0 | 0 (0%) |
| Daejeon * | 0 | 0 | 0 | 0 | 0 | 0 | 0 | 0 | 0 (0%) |
| Ulsan * | 1 | 1 | 0 | 0 | 0 | 0 | 0 | 0 | 2 (1%) |
| Sejong * | 0 | 0 | 0 | 0 | 0 | 0 | 0 | 0 | 0 (0%) |
| Gyeonggi-do | 20 | 52 | 4 | 0 | 1 | 1 | 3 | 0 | 81 (28%) |
| Gangwon-do | 18 | 27 | 1 | 0 | 0 | 1 | 0 | 0 | 47 (16%) |
| Chungcheong buk-do | 16 | 18 | 0 | 0 | 0 | 0 | 0 | 0 | 34 (12%) |
| Chungcheong nam-do | 5 | 10 | 1 | 0 | 0 | 0 | 0 | 0 | 16 (5%) |
| Jeolla buk-do | 9 | 7 | 0 | 0 | 0 | 1 | 1 | 0 | 18 (6%) |
| Jeolla nam-do | 13 | 16 | 5 | 0 | 0 | 0 | 0 | 0 | 34 (12%) |
| Gyeongsang buk-do | 7 | 17 | 2 | 2 | 0 | 0 | 0 | 0 | 28 (10%) |
| Gyeongsang nam-do | 7 | 12 | 0 | 2 | 0 | 0 | 0 | 2 | 23 (8%) |
| Total (column) | 98 (34%) | 162 (56%) | 14 (4%) | 4 (1%) | 1 (1%) | 3 (1%) | 4 (1%) | 2 (1%) | 288 (100%) |
Publisher’s Note: MDPI stays neutral with regard to jurisdictional claims in published maps and institutional affiliations. |
© 2020 by the authors. Licensee MDPI, Basel, Switzerland. This article is an open access article distributed under the terms and conditions of the Creative Commons Attribution (CC BY) license (http://creativecommons.org/licenses/by/4.0/).
Share and Cite
Lee, K.; Sung, H.C.; Seo, J.-Y.; Yoo, Y.; Kim, Y.; Kook, J.H.; Jeon, S.W. The Integration of Remote Sensing and Field Surveys to Detect Ecologically Damaged Areas for Restoration in South Korea. Remote Sens. 2020, 12, 3687. https://doi.org/10.3390/rs12223687
Lee K, Sung HC, Seo J-Y, Yoo Y, Kim Y, Kook JH, Jeon SW. The Integration of Remote Sensing and Field Surveys to Detect Ecologically Damaged Areas for Restoration in South Korea. Remote Sensing. 2020; 12(22):3687. https://doi.org/10.3390/rs12223687
Chicago/Turabian StyleLee, Kyungil, Hyun Chan Sung, Joung-Young Seo, Youngjae Yoo, Yoonji Kim, Jung Hyun Kook, and Seong Woo Jeon. 2020. "The Integration of Remote Sensing and Field Surveys to Detect Ecologically Damaged Areas for Restoration in South Korea" Remote Sensing 12, no. 22: 3687. https://doi.org/10.3390/rs12223687