Article

Using Wavelet Transforms to Fuse Nighttime Light Data and POI Big Data to Extract Urban Built-Up Areas

1
School of Geography and Planning, Sun Yat-sen University, Guangzhou 510275, China
2
School of Architecture and Planning, Yunnan University, Kunming 650031, China
*
Author to whom correspondence should be addressed.
Remote Sens. 2020, 12(23), 3887; https://doi.org/10.3390/rs12233887
Submission received: 23 October 2020 / Revised: 25 November 2020 / Accepted: 26 November 2020 / Published: 27 November 2020
(This article belongs to the Section Urban Remote Sensing)

Abstract

:
Urban built-up areas are not only the embodiment of urban expansion but also the main space carrier of urban activities. Accurate extraction of urban built-up areas is of great practical significance for measuring the urbanization process and judging the urban environment. It is difficult to identify urban built-up areas objectively and accurately with single data. Therefore, to evaluate urban built-up areas more accurately, this study uses the new method of fusing wavelet transforms and images on the basis of utilization of the POI data of March 2019 and the Luojia1-A data from October 2018 to March 2019. to identify urban built-up areas. The identified urban built-up areas are mainly concentrated in the areas with higher urbanization level and night light value, such as the northeast of Dianchi Lake and the eastern bank around the Dianchi Lake. It is shown in the accuracy verification result that the classification accuracy identified by night-light data of urban build-up area accounts for 84.00% of the total area with the F1 score 0.5487 and the Classification accuracy identified by the fusion of night-light data and POI data of urban build-up area accounts for 96.27% of the total area with the F1 score 0.8343. It is indicated that the built-up areas identified after image fusion are significantly improved with more realistic extraction results. In addition, point of interest (POI) data can better account for the deficiency in nighttime light (NTL) data extraction of urban built-up areas in the urban spatial structure, making the extraction results more objective and accurate. The method proposed in this study can extract urban built-up areas more conveniently and accurately, which is of great practical significance for urbanization monitoring and sustainable urban planning and construction.

Graphical Abstract

1. Introduction

The urban built-up area refers to the nonagricultural construction land developed in the administrative region from the macro perspective; from the micro perspective, it refers to the urban construction land distributed in the urban area with basically perfect municipal public facilities [1]. The urban built-up area is not only the main gathering area of population and economic activities, but also, the spatial carrier of urban activities [2]. The scope of urban built-up areas is directly related to the level of urbanization [3], that is, the accurate identification of urban build-up area can greatly contribute to the accurate understanding of rapid urbanization. In the cities with a higher urbanization level, the urban build-up area is one of the most important factors that affect the temperature of surface [4,5], therefore, the accurate extraction of urban built-up areas can provide a research basis for the study of urban heat island phenomena [6,7].
With the rapid development of global urbanization, urban built-up areas are experiencing sharp growth. The global urban built-up area increased from 600,000 to 870,000 square kilometers during 2000–2010 [8]. The expansion of urban built-up areas is accompanied by drastic changes in land use, unbalanced economic development, complex population composition and other prominent urban problems, which require more attention in urban construction and management [9,10]. Therefore, accurate extraction of urban built-up areas is crucial to the development of urban boundary, the division of ecological red line and the alleviation of social and environmental problems raised in the process of urbanization [11].
In the extraction of urban spatial structure, surface information reflected by remote sensing images gradually replaces statistical indicators, such as economic activities and population density. Compared with administrative statistical indicators, surface information can show urban spatial differences in more detail [12]. As one of the most common data in remote sensing images, night light can not only reflect the urban infrastructure function through the brightness of urban light at night but also directly reflect the distribution characteristics of the urban population and economy. At present, night light data have a good effect in monitoring and identifying urban built-up areas [13,14,15,16].
Nighttime light (NTL) data sources include Defence Meteorological Program Operational Line-Scan System (DMSP/OLS) [17], Suomi National Polar-orbiting Partnership/Visible Infrared Imaging Radiometer Suite (NPP/VIIRS) [18], and Luojia1-01 [19], and using these data, researchers have monitored and simulated urban built-up areas [20,21] and urban interior spatial structure [22]. Due to the shortcomings of the DMSP/OLS and NPP/VIIRS data spatial resolutions being only 1000 m and 500 m, respectively, extraction of urban built-up areas is not sufficiently refined due to the low spatial resolution [23], and most studies can only focus on large-scale spatial scopes, such as urban agglomeration. Subsequently, some scholars proposed an object-based method to analyze the urban pattern represented by night lights, which makes the method of extracting urban built-up area more plentiful [24,25].
The successful launch of the experimental satellite named Luojia1-01 in 2018 led to the availability of orthophoto maps of global night-light data with a width of 250 km and a spatial resolution of 130 m. Luojia1-01 adopts innovative technologies such as high signal-to-noise ratio, high dynamic imaging, impact isolation, and self-locking deployment of windsurfing boards, which guarantees high-precision night light data. Nowadays, Luojia1-01 data can be downloaded from the high-resolution earth observation system data of the Hubei Province and application network (http://59.175.109.173:8888/index.html) [26]. Compared with DMSP/OLS and NPP/VIIRS data, Luojia1-01 data clearly reflect the integrity of the city, which makes the extraction of urban built-up areas more precise and accurate. Besides, the accessibility of the data is greatly improved. Moreover, the high spatial resolution makes it possible to identify the built-up area of the small region [27]. However, from the perspective of existing studies, the night light extraction of urban built-up areas is still affected by spatial resolution and the spillover effects of spatial resolution and data itself, which makes the observation of urban built-up areas mostly stay at the macro scale, resulting in the lack of precision of urban built-up areas extracted [28].
POI data, as one of the emerging geospatial data, can represent the internal spatial structure of a city through the distribution degree of data in the micro geospatial. At present, it has been well applied in the research of urban spatial structure and urban built-up area. Compared with the macro observation of urban space by night light data, POI aggregation can better reflect the micro advantages potential. Based on the limitations of nighttime lighting data in urban built-up area extraction, scholars began to pay attention to the research of the fusion of nighttime light data and POI data [29,30,31]. Studies show the research on the fusion of POI data and night light data could make up for the insufficient observation of the city on the micro scale by night light data, and greatly improve the accuracy of urban built-up area extraction [32,33], making the extracted urban built-up area more and more refined [34] The current research dilemma lies in the lack of objective mathematical proof for the method of fusing POI and night light data [35,36].
As a key direction of data fusion, image fusion has been widely used in remote sensing, vision, urban observation and other fields [37]. Image fusion combines multiple images that can be obtained from different sensors on the same target or the same scene or obtained from different ways of the same sensor into one image (this image cannot be obtained by a single sensor), and the information in multiple images can be reflected in the composite image to achieve a more comprehensive and accurate judgment of the target and scene [38,39]. Since image fusion is a subset of data fusion, it is bound to have the advantages of data fusion, which can improve the effectiveness of sensors and the use efficiency of information, thus improving the resolution of detected targets and suppressing the monitoring noise [40,41].
Image fusion can be divided into three levels: pixel fusion, feature fusion and decision fusion [42], with pixel fusion as the most basic and most important method of image fusion. Scholars first proposed the arithmetic mean image fusion method; whose shortcoming was the poor contrast of fusion images. Later, scholars proposed pyramid-based image fusion methods, including Plath pyramid, gradient pyramid, and ratio low-pass pyramid; however, good results had not been achieved until the appearance of the wavelet transforms [43,44]. Therefore, the method of fusing POI data and NTL data on the basis of wavelet transform to identify urban build-up area could become a new means to carry out the relevant researches about data fusion.
As one of the cities with the fastest urban development in China in recent years, Kunming’s urbanization has reached nearly 70%. Various urban problems occurred during this period, especially the great changes in urban built-up areas [45]. Accurate extraction of urban built-up areas is very important for urban construction planning and decision making [46,47]. Taking the urban agglomeration in the central Yunnan Province as an example, this study develops a new urban built-up area extraction method based on the fusion of night light and POI data by wavelet transform, and then the urban built-up area is extracted by multi-resolution segmentation, and finally the accuracy of the result is tested.

2. Materials and Methods
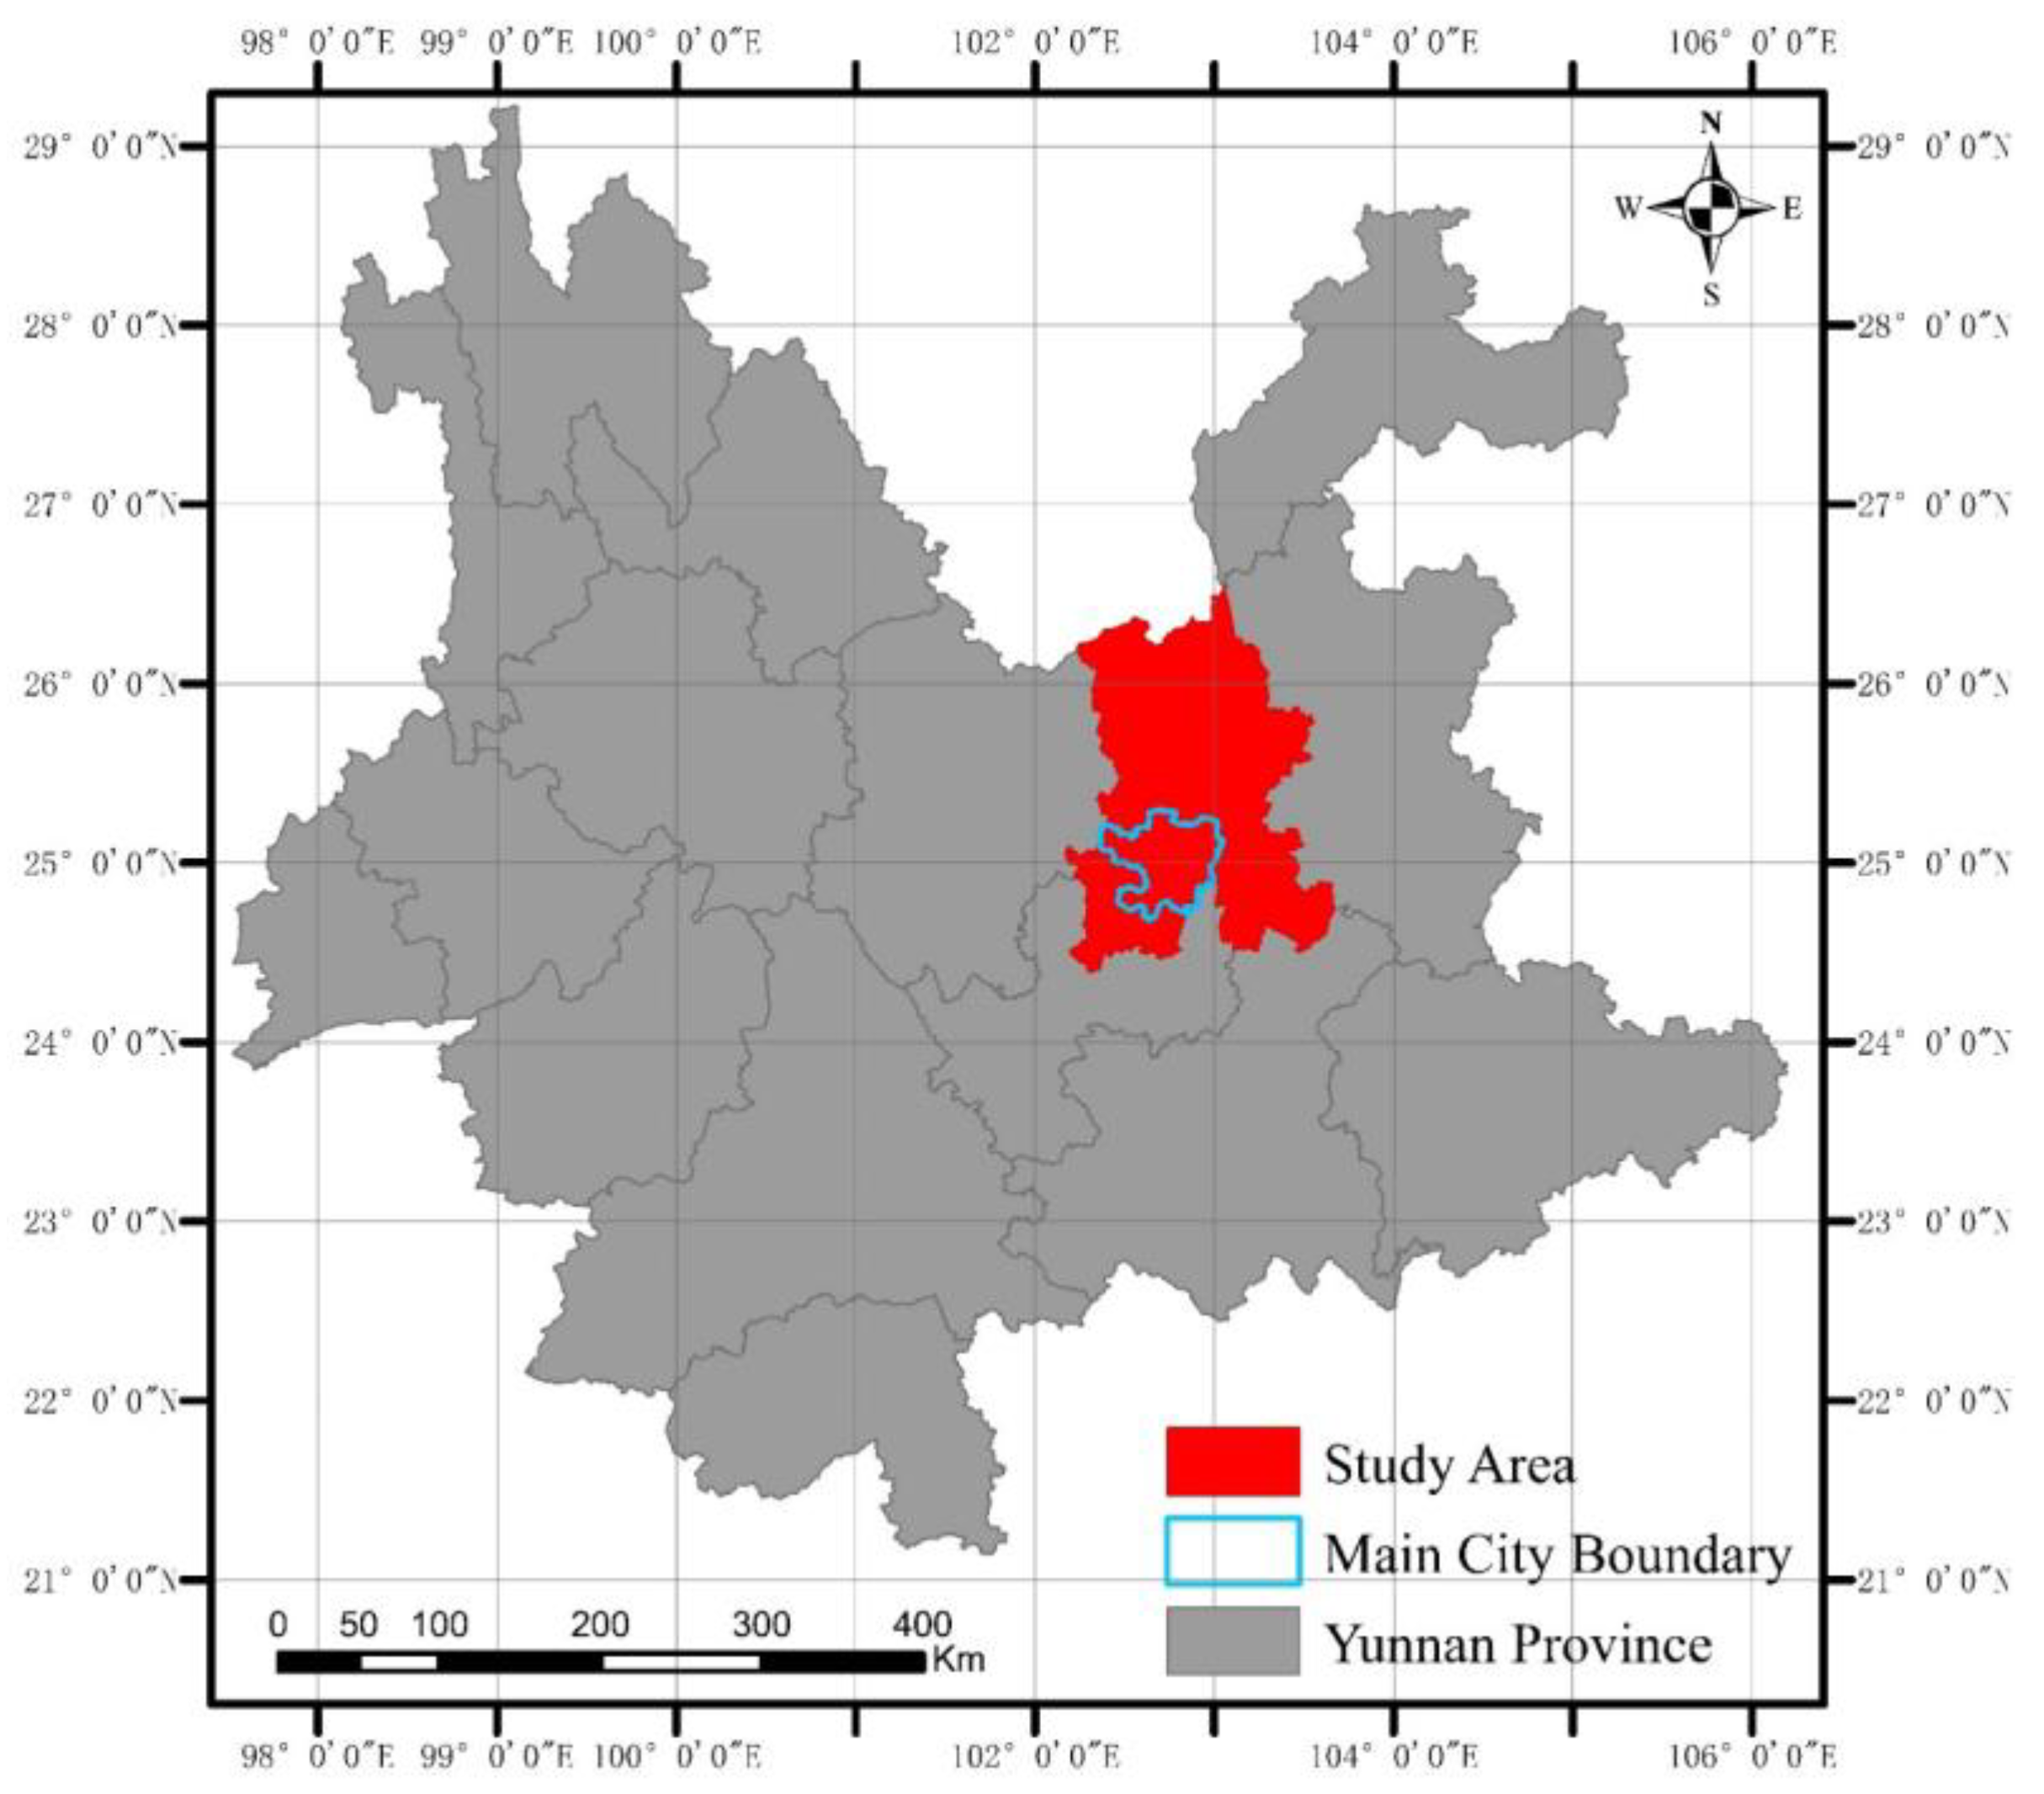
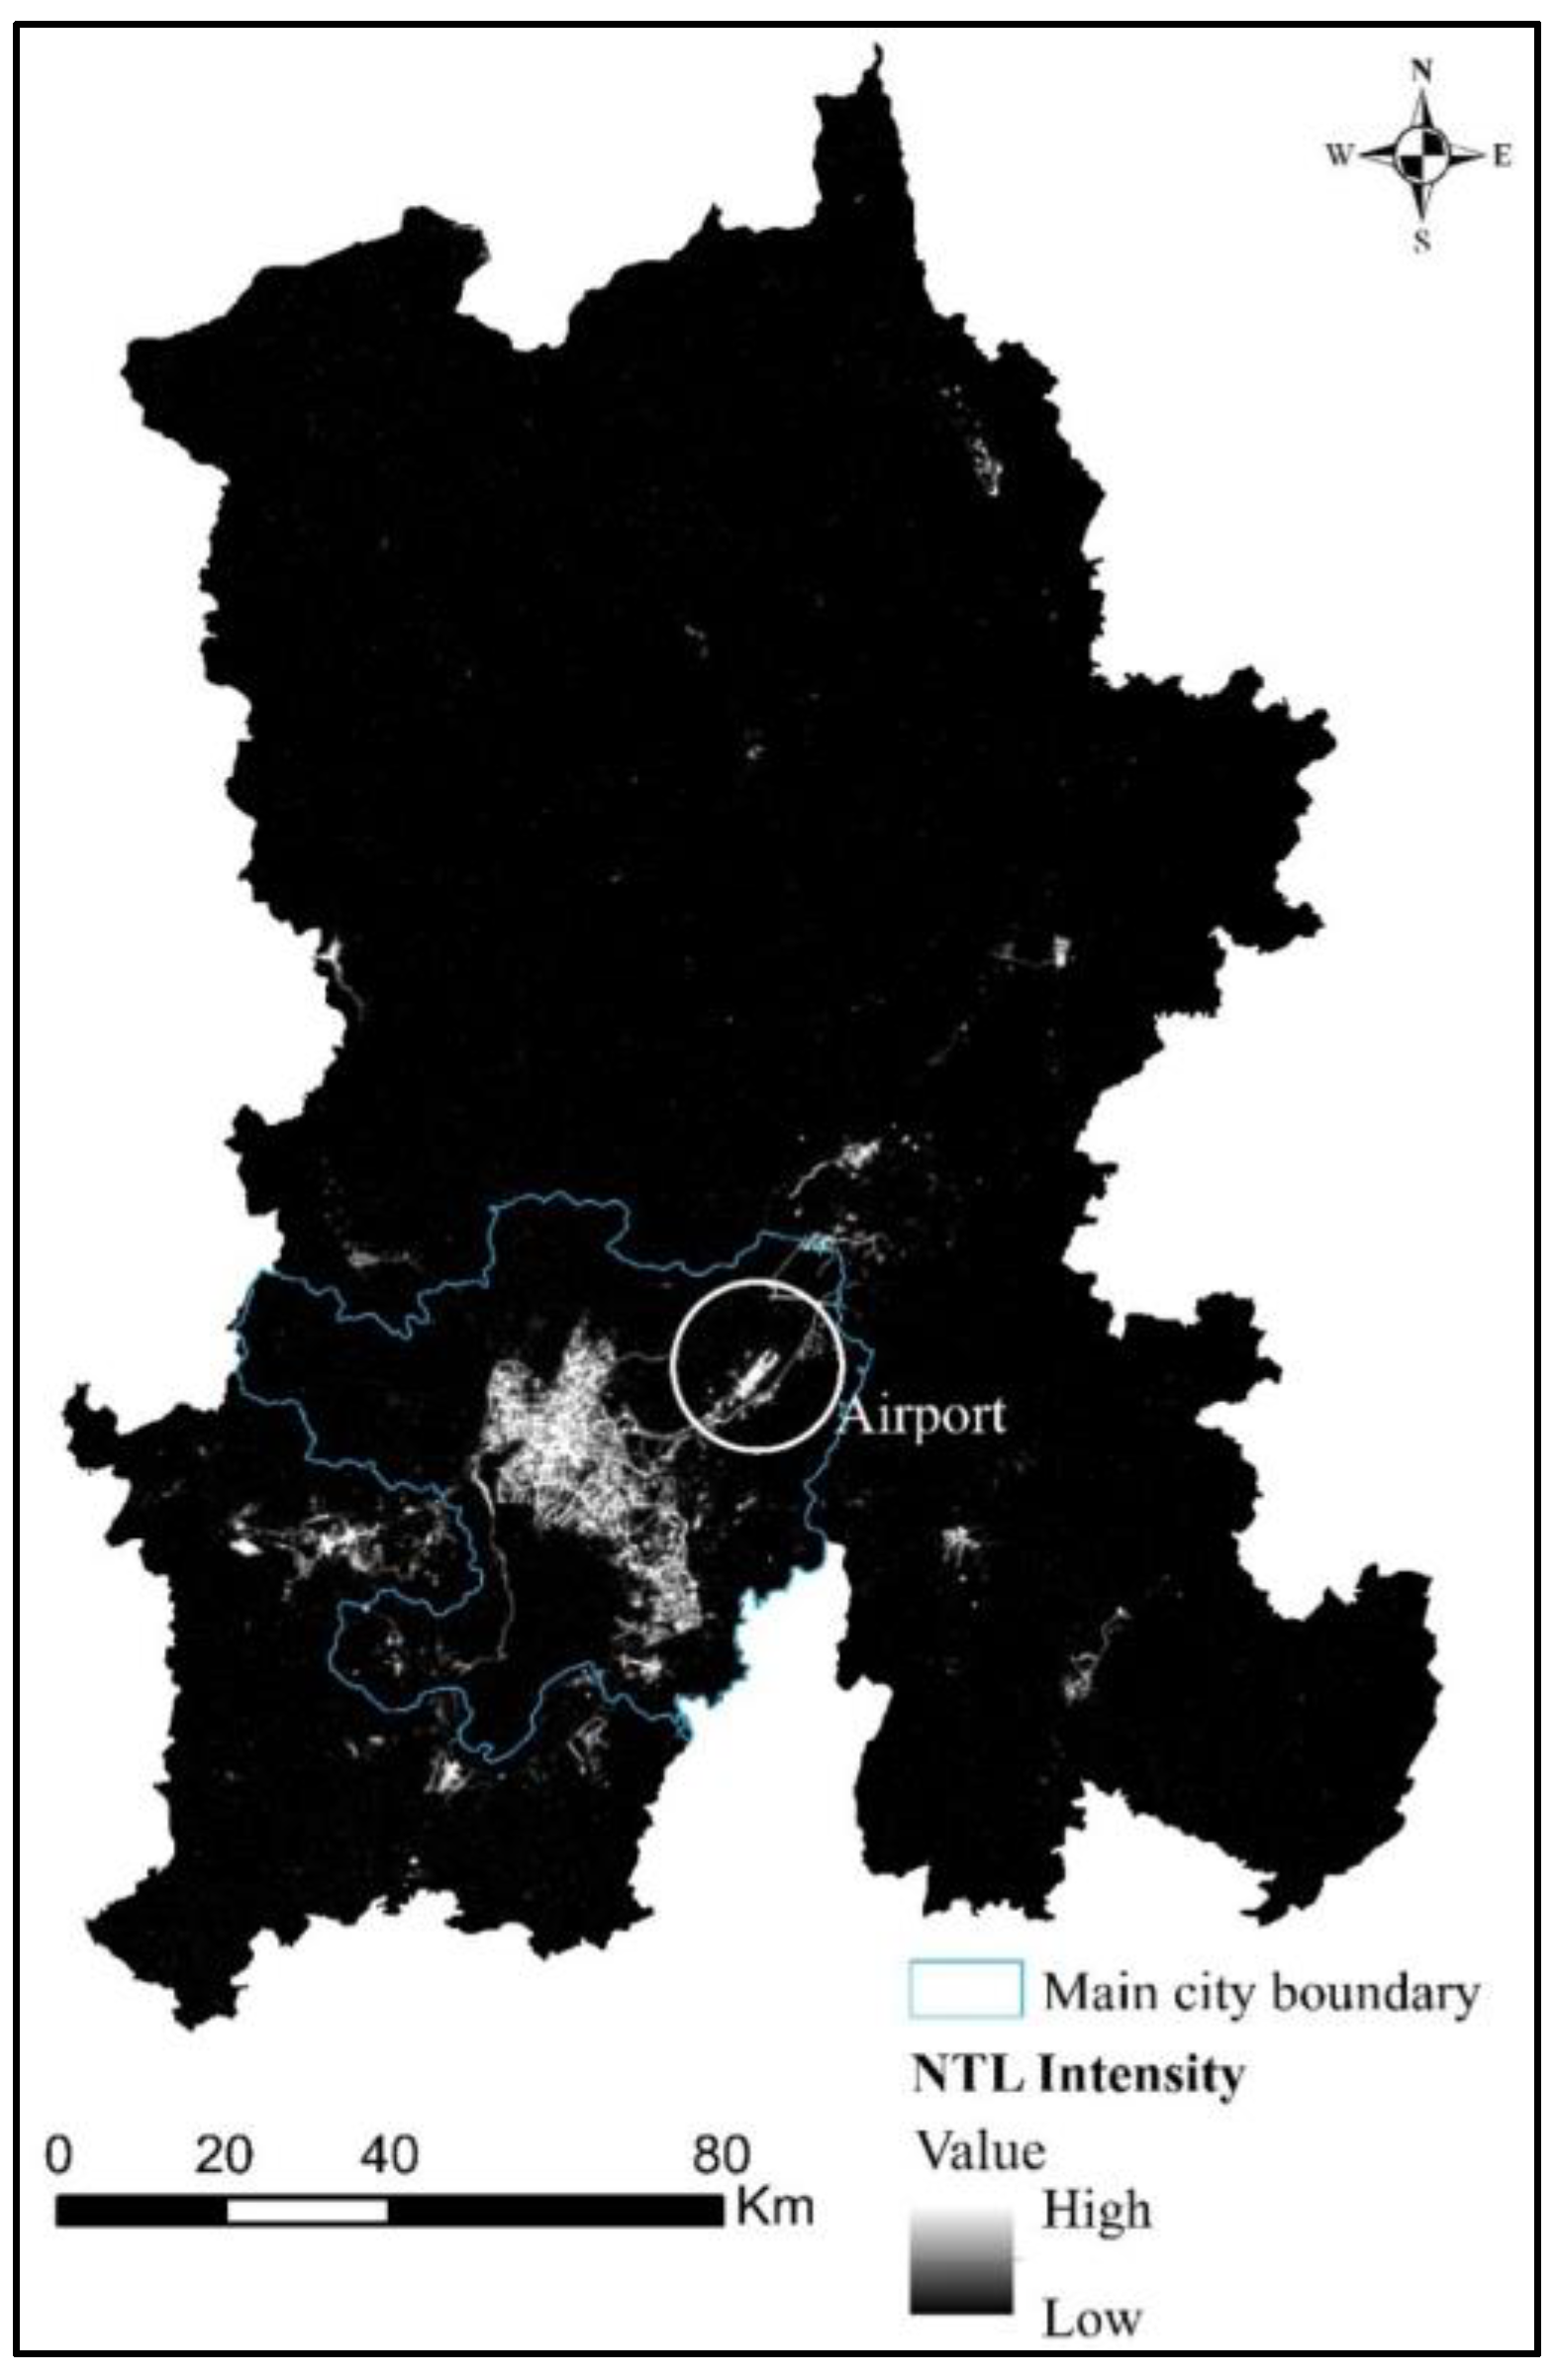
2.1. Study Area

The research area is situated in Kunming city, Yunnan Province, China (Figure 1). Kunming is the most concentrated area of urbanization and population in Yunnan.
Since the implementation of the “One Belt and One Road” and “western development” policies, Kunming’s urban development has significantly improved [48]. The extraction of the urban built-up area of Kunming carried out by the study is helpful to understand the scale, form and actual use of urban construction land in Kunming and is helpful to analyze the current situation of land use and provide a foundation for land and land used for urban planning construction and development.
The research data, including Luojia1-01 data, refers to the monthly average data from October 2018 to March 2019 obtained from the high-resolution earth observation system data of the Hubei Province and application network (http://59.175.109.173:8888/Index.html), the processed data are shown in Figure 2. The POI data: a total number of 449,821 POI data for Kunming, Yunnan Province in March 2019 is obtained in the beginning by using the API (Application Programming Interface) provided by AMap, however, as this study is about urban built-up areas, only 403,376 data remains after filtering the POI data without actual geographical meaning in Kunming. In addition, due to the existence of duplicate data and uncertain data at specific geographical locations of POI data within the geographical space, the data are further cleaned and rechecked. And a total number of 394,201 POI is remained at last, the proportion of all kinds of POI data is shown in Figure 3, and finally, the density processing of POI is carried out The reference data of built-up areas in the Yunnan Province in 2018 are provided by Geographical Information Monitoring Cloud Platform and are also used as reference vector data. The reference area of built-up areas is 434.4 square kilometers. The auxiliary data is the satellite image of Kunming City in March 2019 provided by Google Earth, with a spatial resolution of 4.78 m, which is used for fine comparison of the urban built-up areas extracted from the last two kinds of data (Table 1).

2.2. Methods

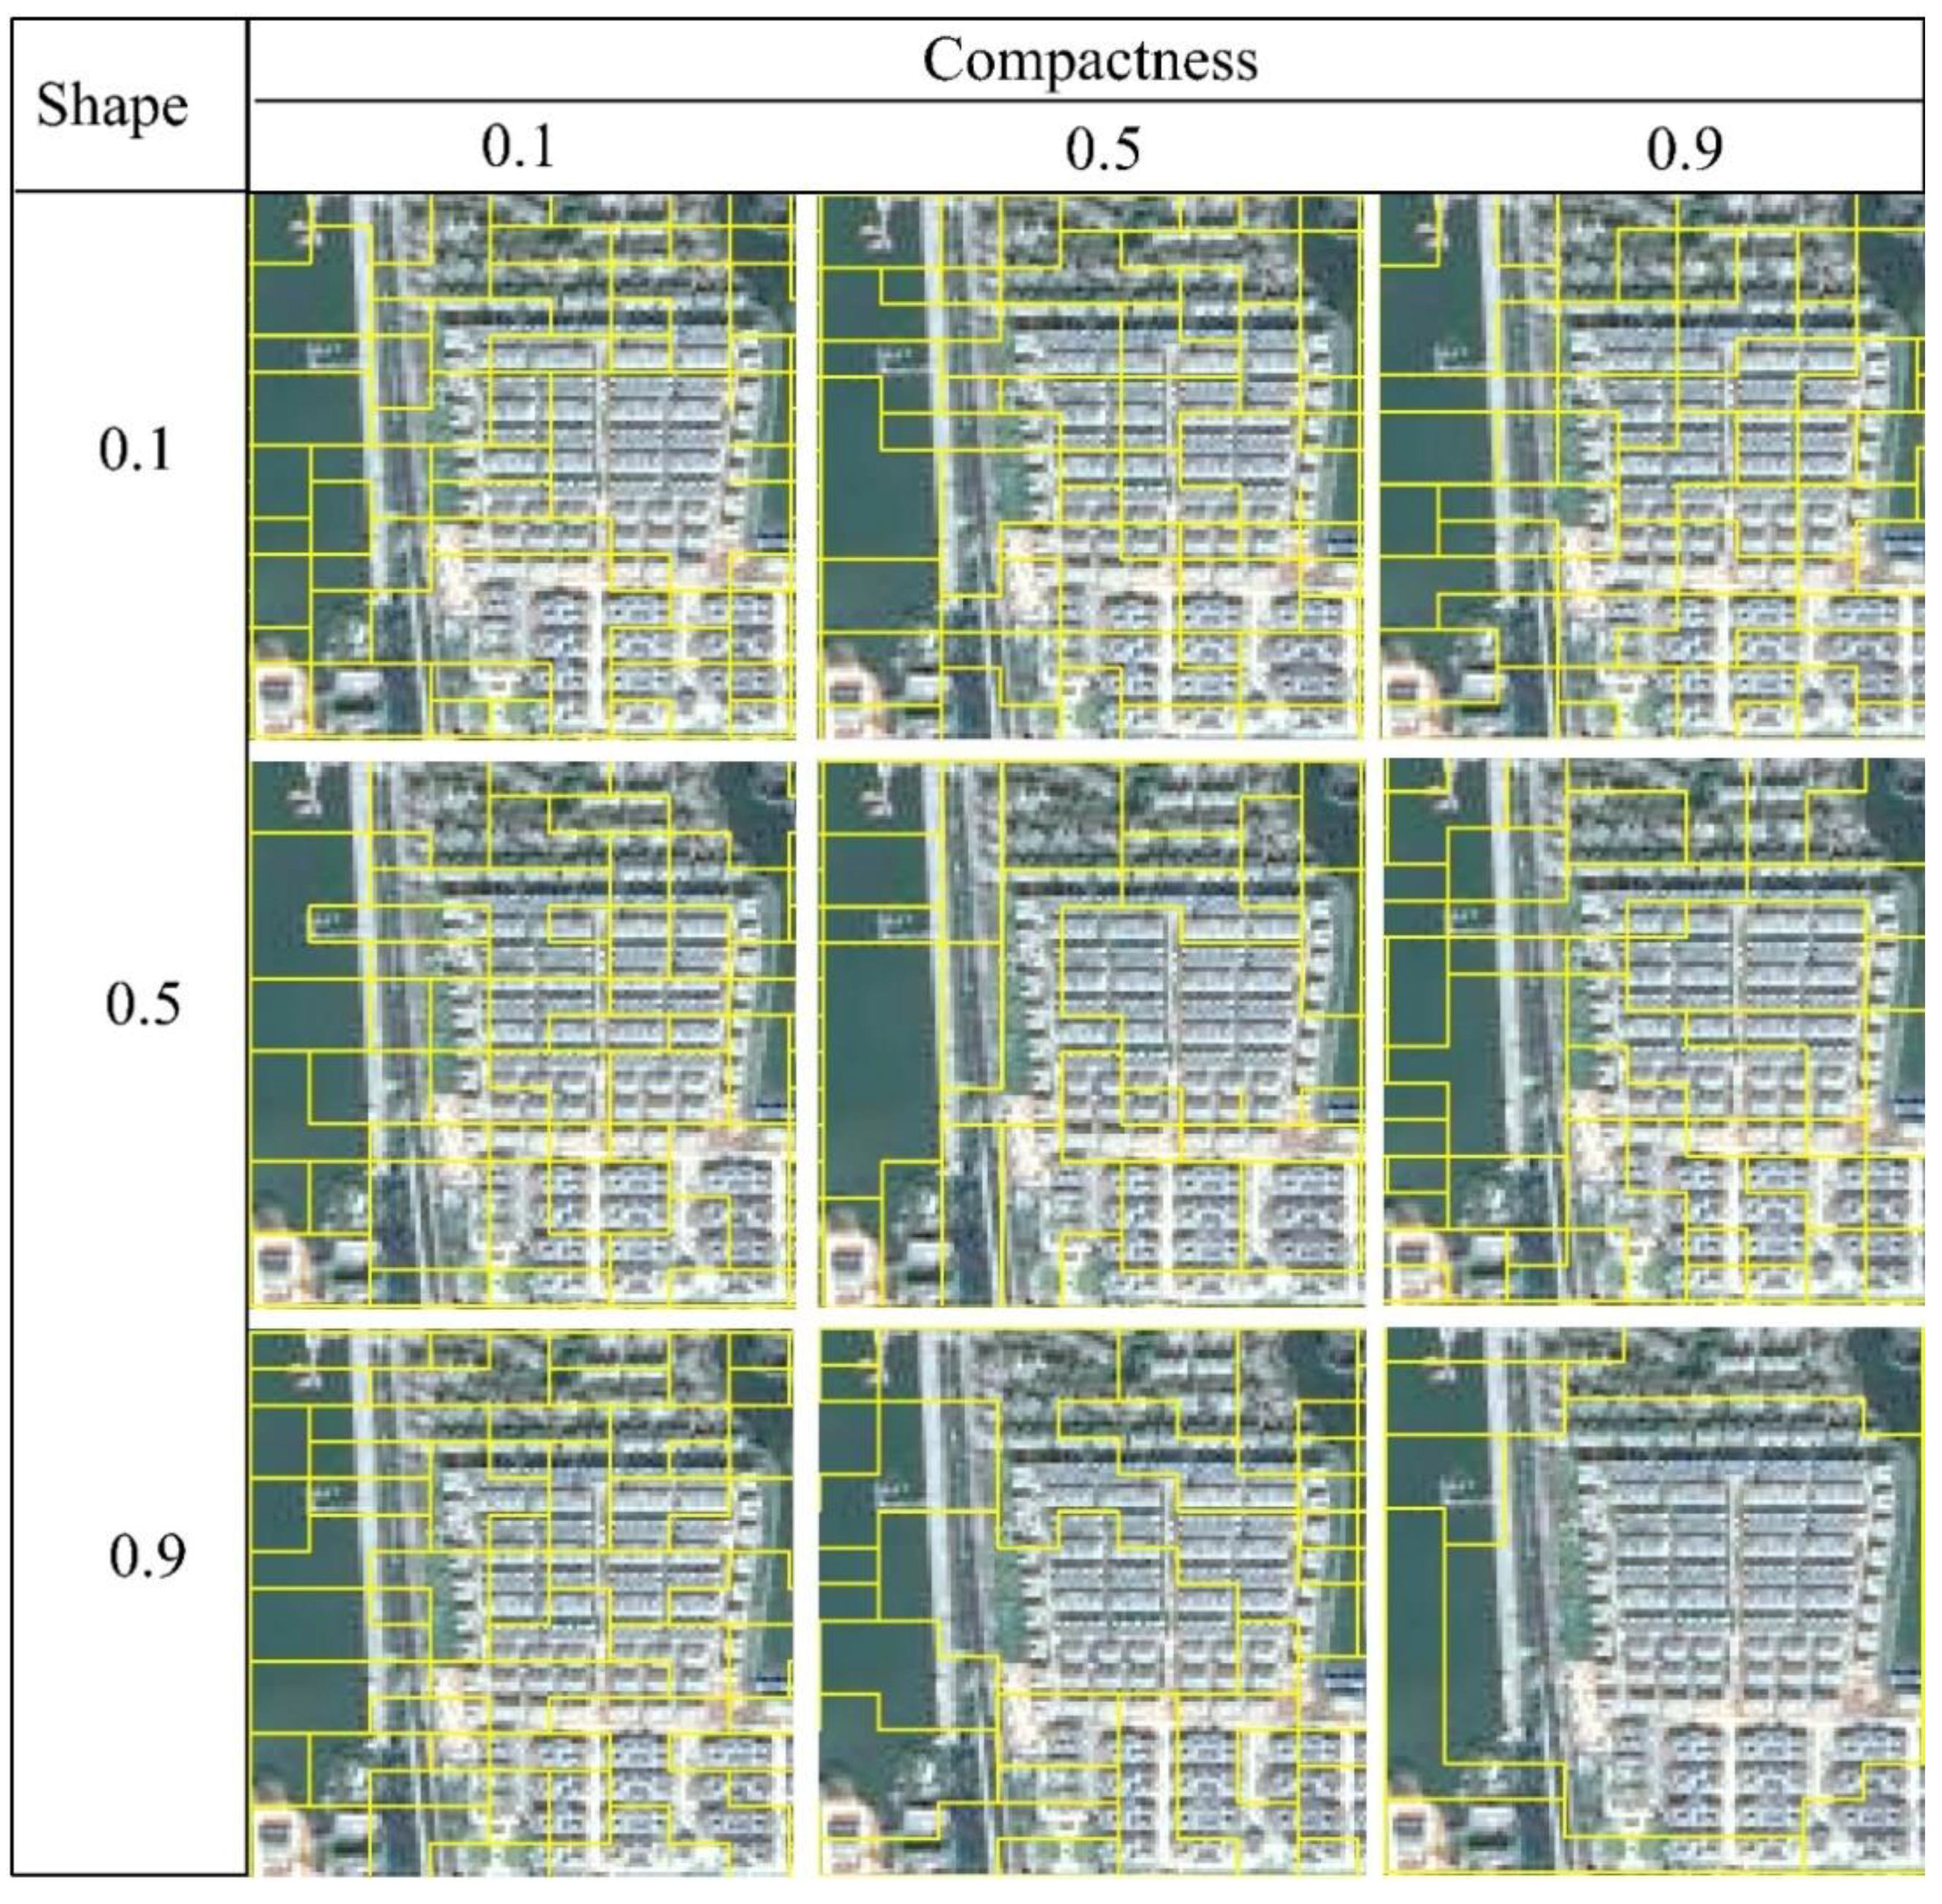
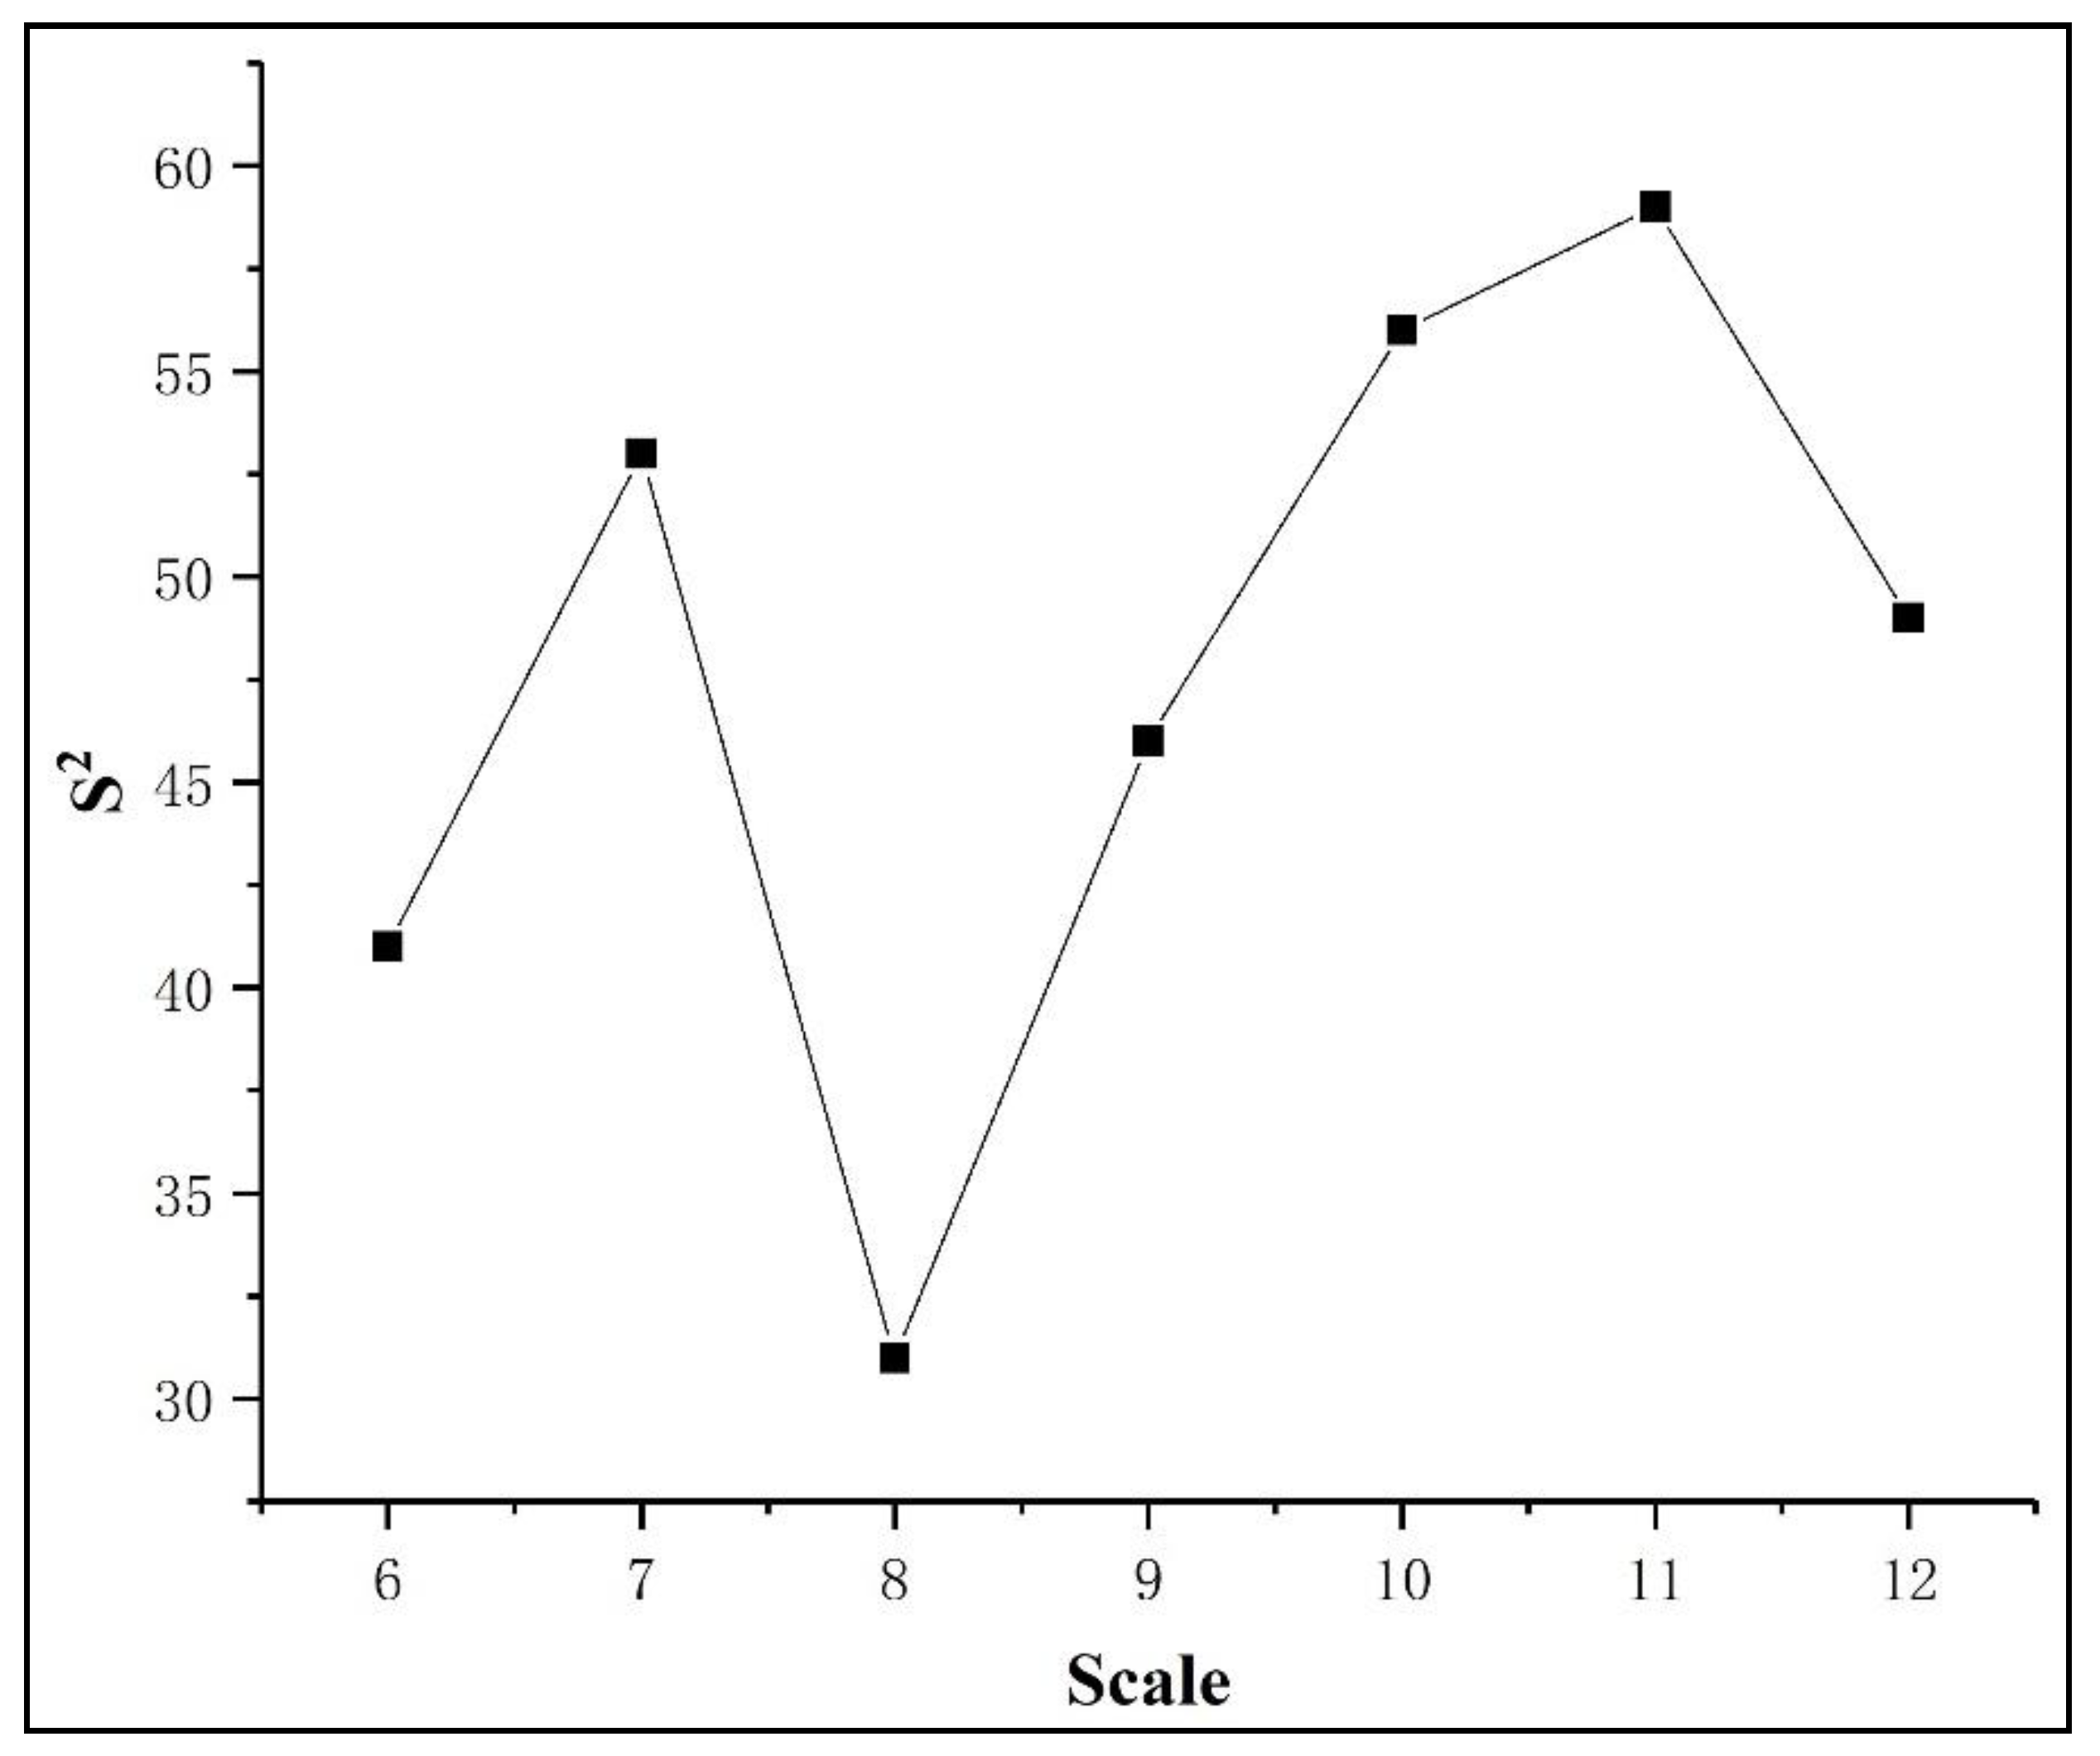
2.2.1. Multiresolution Segmentation

As the first object-oriented commercial software for image analysis, eCongnition has the ability to simulate human thinking and then conduct image analysis and information extraction. eCongnition supports a variety of image segmentation methods, including quadtree-based segmentation, checkerboard segmentation, spectral difference, multiresolution segmentation, etc., among which multiresolution segmentation is the most commonly used method [49]. By merging adjacent elements or segmented objects, multiresolution segmentation uses the region merging method to complete image segmentation on the premise of ensuring the maximum average intersegment heterogeneity and maximum intersegment homogeneity [50]. Therefore, it is a bottom-up method.
There are three main factors of multiresolution segmentation: scale, shape and compactness. After multi-scale segmentation is performed with the selected scale parameter, the number of segmented images, the average value of all segmented images and the area of the image should be calculated respectively.
The weighted mean variance after segmentation is calculated by Equation (3). When the average variance S 2 reaches the maximum value, it proves that the segmentation effect reaches the best proportion:
C ¯ k = 1 n i = 1 n C i
C ¯ k = 1 m k = 1 m C ¯ K
S 2 = 1 m k = 1 m ( C ¯ k C ¯ ) 2
where n stands for the number of pixels in the segmented image, C ¯ i is the digital number (DN) value of the i pixel in the k segment, m is the total number of pixels in the segmented image, and S 2 is the weighted mean variance in the DN value of the segmented image.

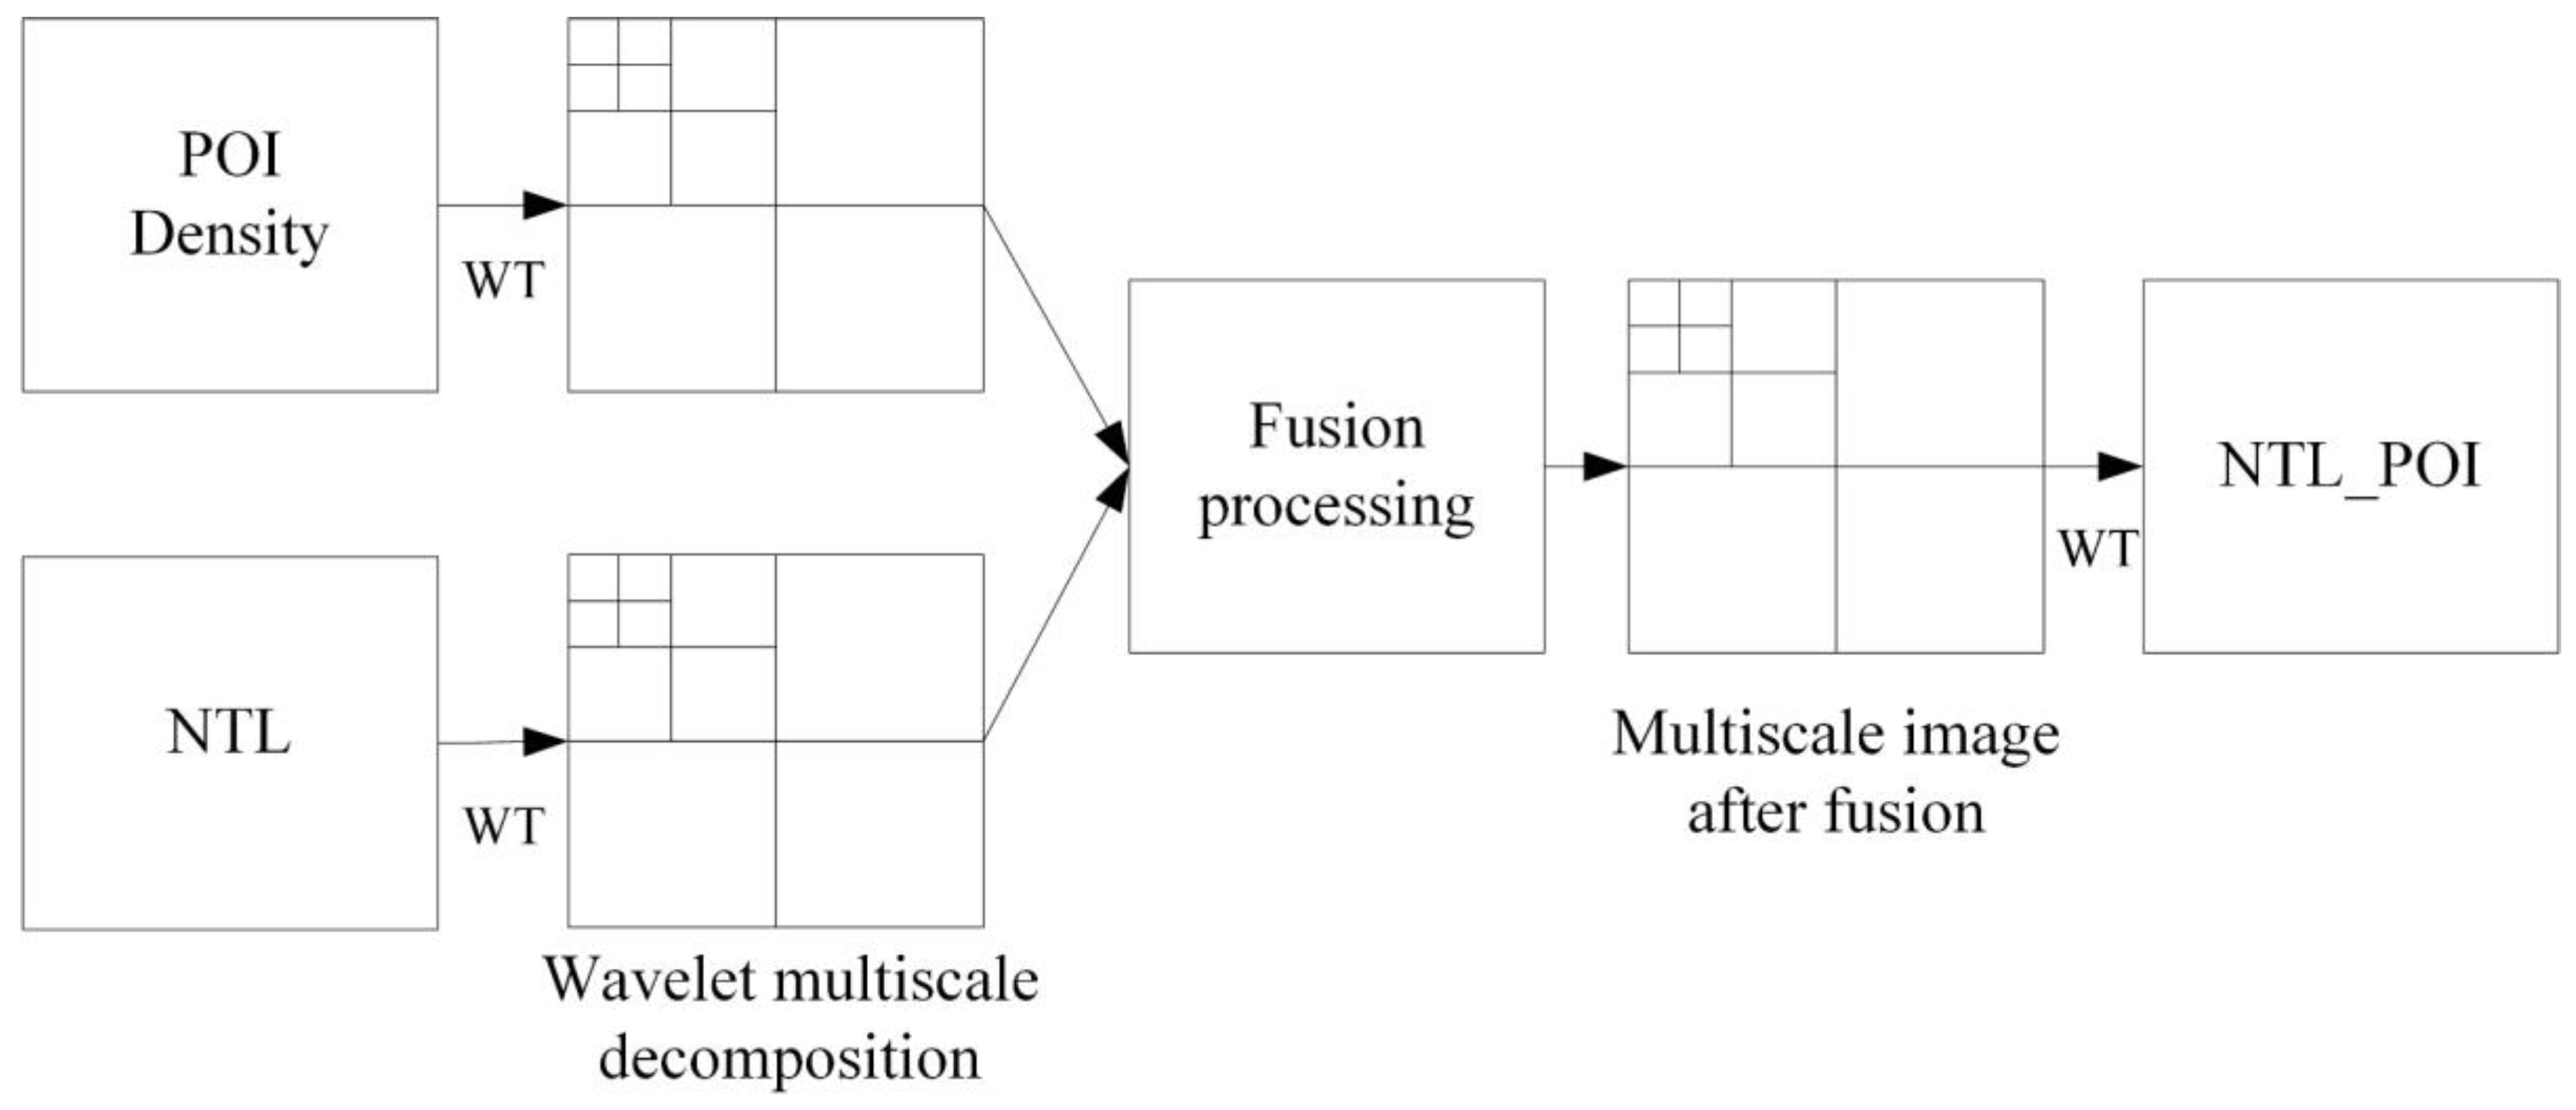
2.2.2. Wavelet Transform

In order to fuse night light with POI density, the interactive relationship between time and frequency should be fully considered in the selection of algorithm. The wavelet transform is a representation between the function time domain (spatial domain) and frequency [51]. With its “microscope” focusing function, it is possible to achieve the unification of the time domain and frequency domain [52]. Wavelet analysis has good localization properties in both the time domain and frequency domain. Wavelet analysis highlights some features of the image through a “time-frequency” window that changes with frequency and a local “focusing” analysis of time (space) frequency, which can decompose a signal into an independent part of the signal to space and time without losing the information contained in the original signal [53]. The basic formula of the wavelet transform is described as follows:
W T ( α , τ ) = f ( t ) φ ( t ) = 1 α + f ( t ) φ ( t b α ) d t
In Equation (4), a signal vector f ( t ) can be transformed into a wavelet through the basic wavelet function ( φ ( t ) ) under the changes in different scales α , translation τ and parameters b .
After two-dimensional wavelet transform decomposition of the POI density image and NTL image, all information and details of POI density image and NTL image are compared in the wavelet transform domain, and fusion is realized at different scales, as well as wavelet transformation is inversed. Finally, the fused NTL_POI image is obtained (Figure 4).
The low-frequency component, horizontal high-frequency component, vertical high-frequency component and diagonal high-frequency component of an image can be obtained after the image is decomposed by two-dimensional wavelet transform, of which the high-frequency component is the detailed part of the image. In the wavelet transform domain, the detailed information or all information of each image is compared, and the fusion is realized on different scales. Finally, an inverse wavelet transform is performed to obtain the image after image fusion (Figure 4).

2.3. Accuracy Assessment

To evaluate the extraction accuracy of urban built-up areas, the fraction per pixel is calculated based on the research area. The fraction is the harmonic average of recall and precision with a value range of 0~1. The higher the value is, the higher the precision is [54], the recall rate, precision rate and F 1 score are respectively:
p r e c i s i o n = a o v e r l a p a c o m p u t e d
r e c a l l = a o v e r l a p a c o m p a r a t i v e
F 1 = ( 2 r e c a l l 1 + p r e c i s i o n 1 ) = 2 · p r e c i s i o n · r e c a l l p r e c i s i o n + r e c a l l
among which, a o v e r l a p stands for the total area of the overlapped part of the built-up area and the reference built-up area, a c o m p u t e d for the total area of built-up area extracted, a c o m p a r a t i v e is the total area of the reference built-up area.

3. Results

3.1. Built-Up Urban Areas Identified by Luojia1-01

The light value of Kunming Changshui International Airport is selected as the highest light threshold, and Dianchi Lake, which has a low radiation background area, is selected as the minimum light threshold after comparative observation. The processed night light image is shown in Figure 2; that is, the highest NTL intensity of Luojia1-01 is situated at Kunming Changshui International Airport, and the main urban area has higher NTL intensity than other districts and counties. In addition, most of the high-intensity NTL pixel values are concentrated in the north and northeast of Dianchi Lake, and the low-intensity NTL pixel values are mainly distributed in Chengjiang and other places.

3.1.1. Results of Multiresolution Segmentation

In this study, the relationship between the image segmentation scale and the segmented region is shown in Figure 5. after the segmentation experiment on the Luojia1-01-night light image with a scale of 1–30. That is, when the segmentation scale is 1–5, the number of segmentation regions decreases sharply with increasing segmentation scale. When the segmentation scale is greater than 11, the number of segmentation regions will not change significantly with increasing segmentation scale. Therefore, the segmentation scale range of night light images determined in this study is 5–11.
As the relatively mature scale segmentation method in multi-resolution segmentation, visual comparison and estimation of scale parameters (ESP) have been well applied in recent years [55]. The ESP tool can continuously perform scale tests to approach the most appropriate segmentation parameters, which can effectively speed up the multi-scale segmentation process in multi-resolution segmentation [56]. In the case of sufficient test time, visual comparison is still the most powerful source of experience and technology for evaluating multi-resolution segmentation.
The temporary segmentation scale is selected as 10 in this study, and nine combinations of two parameters, shape (0.1, 0.5, 0.9) and compactness (0.1, 0.5, 0.9), are used to analyze the results of scale segmentation [57]. Figure 5 shows the Google Earth observation results of the segmentation results of different shape and compactness combinations at a scale of 10 (Figure 6); that is, when the combination is 0.1 and 0.1, 0.1 and 0.5, 0.1 and 0.9, 0.5 and 0.1, 0.9 and 0.1, 0.5 and 0.1, or 0.9 and 0.1, the results of image segmentation are too fragmented, which is not conducive to observations and statistics in urban built-up areas.
When the combination is 0.5 and 0.9 or 0.9 and 0.5, the segmentation results do not segment the correct river contour, and the result of partial segmentation shows that the construction land unit and water unit are mixed together, so there is some error in the segmentation result. When the combination is 0.9 and 0.9, the division units of the urban built-up area are too excessive, and the urban built-up area is only divided into one piece without any difference in internal details. It can be found after the vectorization comparison of the nine combinations in Figure 6 that when the combination is 0.5 and 0.5, the number of polygons is 12. When the combination is 0.5 and 0.9, 0.9 and 0.5, the number of polygons is 17. When the combinations are 0.1 and 0.1, 0.1 and 0.5, the number of polygons is 19; when the combinations are 0.1 and 0.9, 0.5 and 0.1, 0.9 and 0.1, the number of polygons is 18.
From the perspective of visual results and the number of vector polygons, when the combination is 0.5 and 0.5, the segmentation of urban built-up area and river shows the best result. Therefore, shape and compactness are selected as 0.5 and 0.5 in this study.
Because shape is 0.5 and compactness is 00.5, segmentation and comparison experiments are carried out on night light images with 7 scales (scales 5, 6, 7, 8, 9, 10 and 11) to inversely determine the optimal scale value. Figure 7 shows the functional relationship between different scales and weighted mean variance. Finally, based on selecting a scale of 11, shape of 0.5, and compactness of 0.5, multiresolution segmentation is performed.

3.1.2. Results of Urban Built-Up Area Identified by NTL Data

In the multiresolution segmentation, the Luojia1-01-night light image is segmented when scale, shape, and compactness are taken as 11, 0.5, and 0.5, respectively, and the urban built-up area shown in Figure 7 is obtained. The urban built-up area identified in Figure 8 is 364.9 square kilometers, which is mainly located in the main urban area of Kunming, and a small part of the built-up area is situated on the west bank of Dianchi Lake. In the main urban area of Kunming, the identified urban built-up areas are mainly located north of Dianchi Lake and along the east bank. Due to the high light value of Changshui International Airport, a significant number of urban built-up areas have been identified. In addition, due to the influence of light values, many major traffic arteries in Kunming have also been identified as linear urban built-up areas.

3.2. Urban Built-Up Areas Identified by Data Fusion

POI data, which represent each actual unit of a city, can represent the function of a city on a microscopic scale through density clustering and have been widely applied in the study of the internal spatial structures of cities [58]. Previous studies have shown that there is a significant spatial difference in POI data distribution between built-up and non-built-up urban areas [59]. In related research on the extraction of urban spatial structure by POI data, the POI data for different regions are rarely distinguished. To show the difference in POI data in urban built-up areas and non-built-up areas in more detail, this study reclassifies and sorts out POI data in different areas.
As shown in Figure 3, the number of POIs distributed in urban built-up areas accounts for approximately 80% of the total number of POIs, which is four times the number of POIs distributed in non-built-up areas. In the separate categories of POI data (refer to the POI classification of Amap), Golf areas accounts for the highest proportion of urban built-up areas, which is close to 97%, while villa areas account for the highest proportion of non-built-up areas, which is close to 40%. The proportion of other types of POI is within this range.

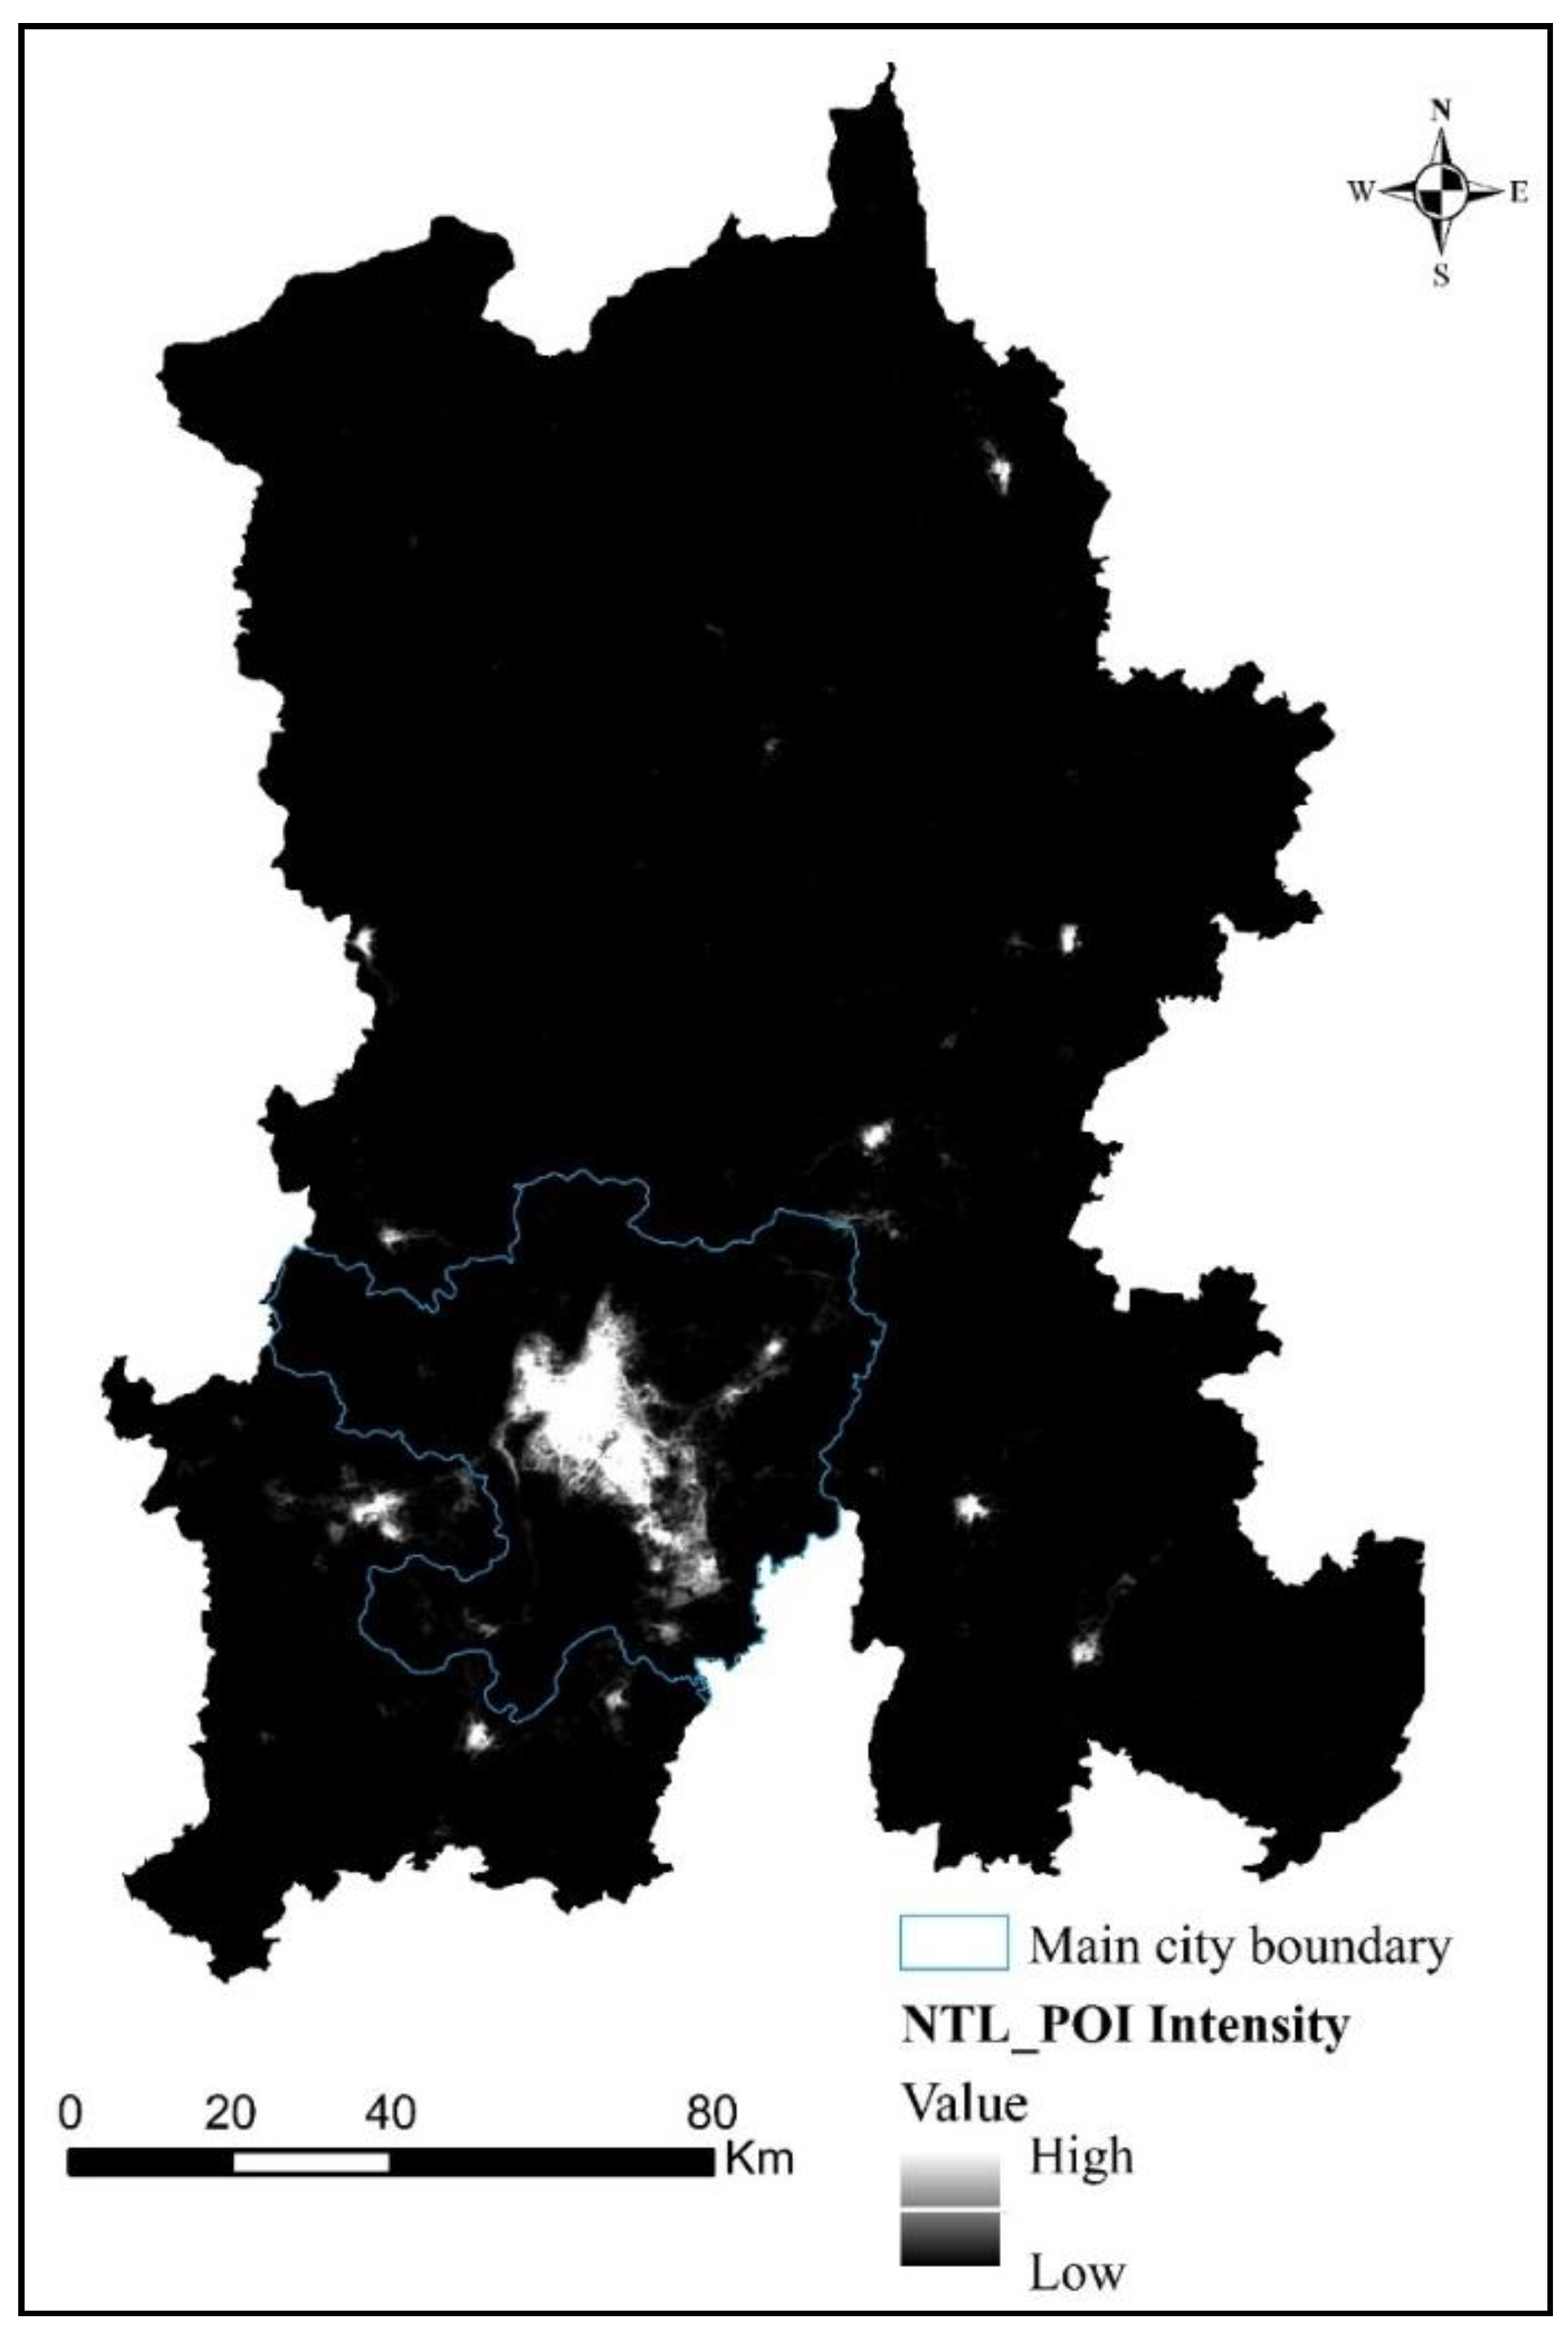
3.2.1. Fusion of POI and NTL Data

The first step of using the wavelet transform to fuse POI and NTL images is to perform wavelet transforms on POI and NTL. When the wavelet coefficients are situated in the four frequency bands of LL, HL, LH, and HH and the absolute value of the wavelet coefficient is the largest, it corresponds to the prominent feature part of the image. Therefore, provided that the absolute value of each wavelet coefficient in the transform domain is the largest, it can realize the fusion of wavelet coefficients at all resolution levels, and the fused wavelet coefficients have preserved more frequency band characteristics intact [40]. When processing image signals, the optimal scale is determined by analyzing variance diagrams of wavelet coefficients at different scales. The optimal scale for image fusion determined in this study is 5 (Figure 9).
The fused NTL_POI data are shown in Figure 10. The pixel high-value region of NTL_POI data is mainly located in the main urban area, and a small number of high-value regions exist outside the main urban area.
In the main urban area, the high NTL_POI pixel values are concentrated in the northern part of Dianchi Lake in the center of Wuhua and Guandu, but the pixel values on the west bank of Dianchi Lake and Changshui International Airport are relatively low.

3.2.2. Urban Built-Up Areas Identified by POI_NTL

The urban built-up area of NTL_POI data is identified by the same multiresolution segmentation method as that of NTL data. In this section, according to the result of multiresolution segmentation, the NTL_POI image is segmented with scale, shape and compactness values of 10, 0.5 and 0.5, respectively, and the urban built-up area in Figure 11 is obtained. The urban built-up area identified in Figure 11 is 418.2 square kilometers. The identified urban built-up areas are mainly distributed in the main urban areas, and a small part of the identified urban built-up areas are located on the west bank of Dianchi Lake. In the main urban area, Changshui Airport and roads have not been identified as large urban built-up areas. The urban built-up areas are still concentrated north of Dianchi Lake and on the east bank of Dianchi Lake.

3.3. Comparison of NTL Data and NTL_POI Data after Fusion

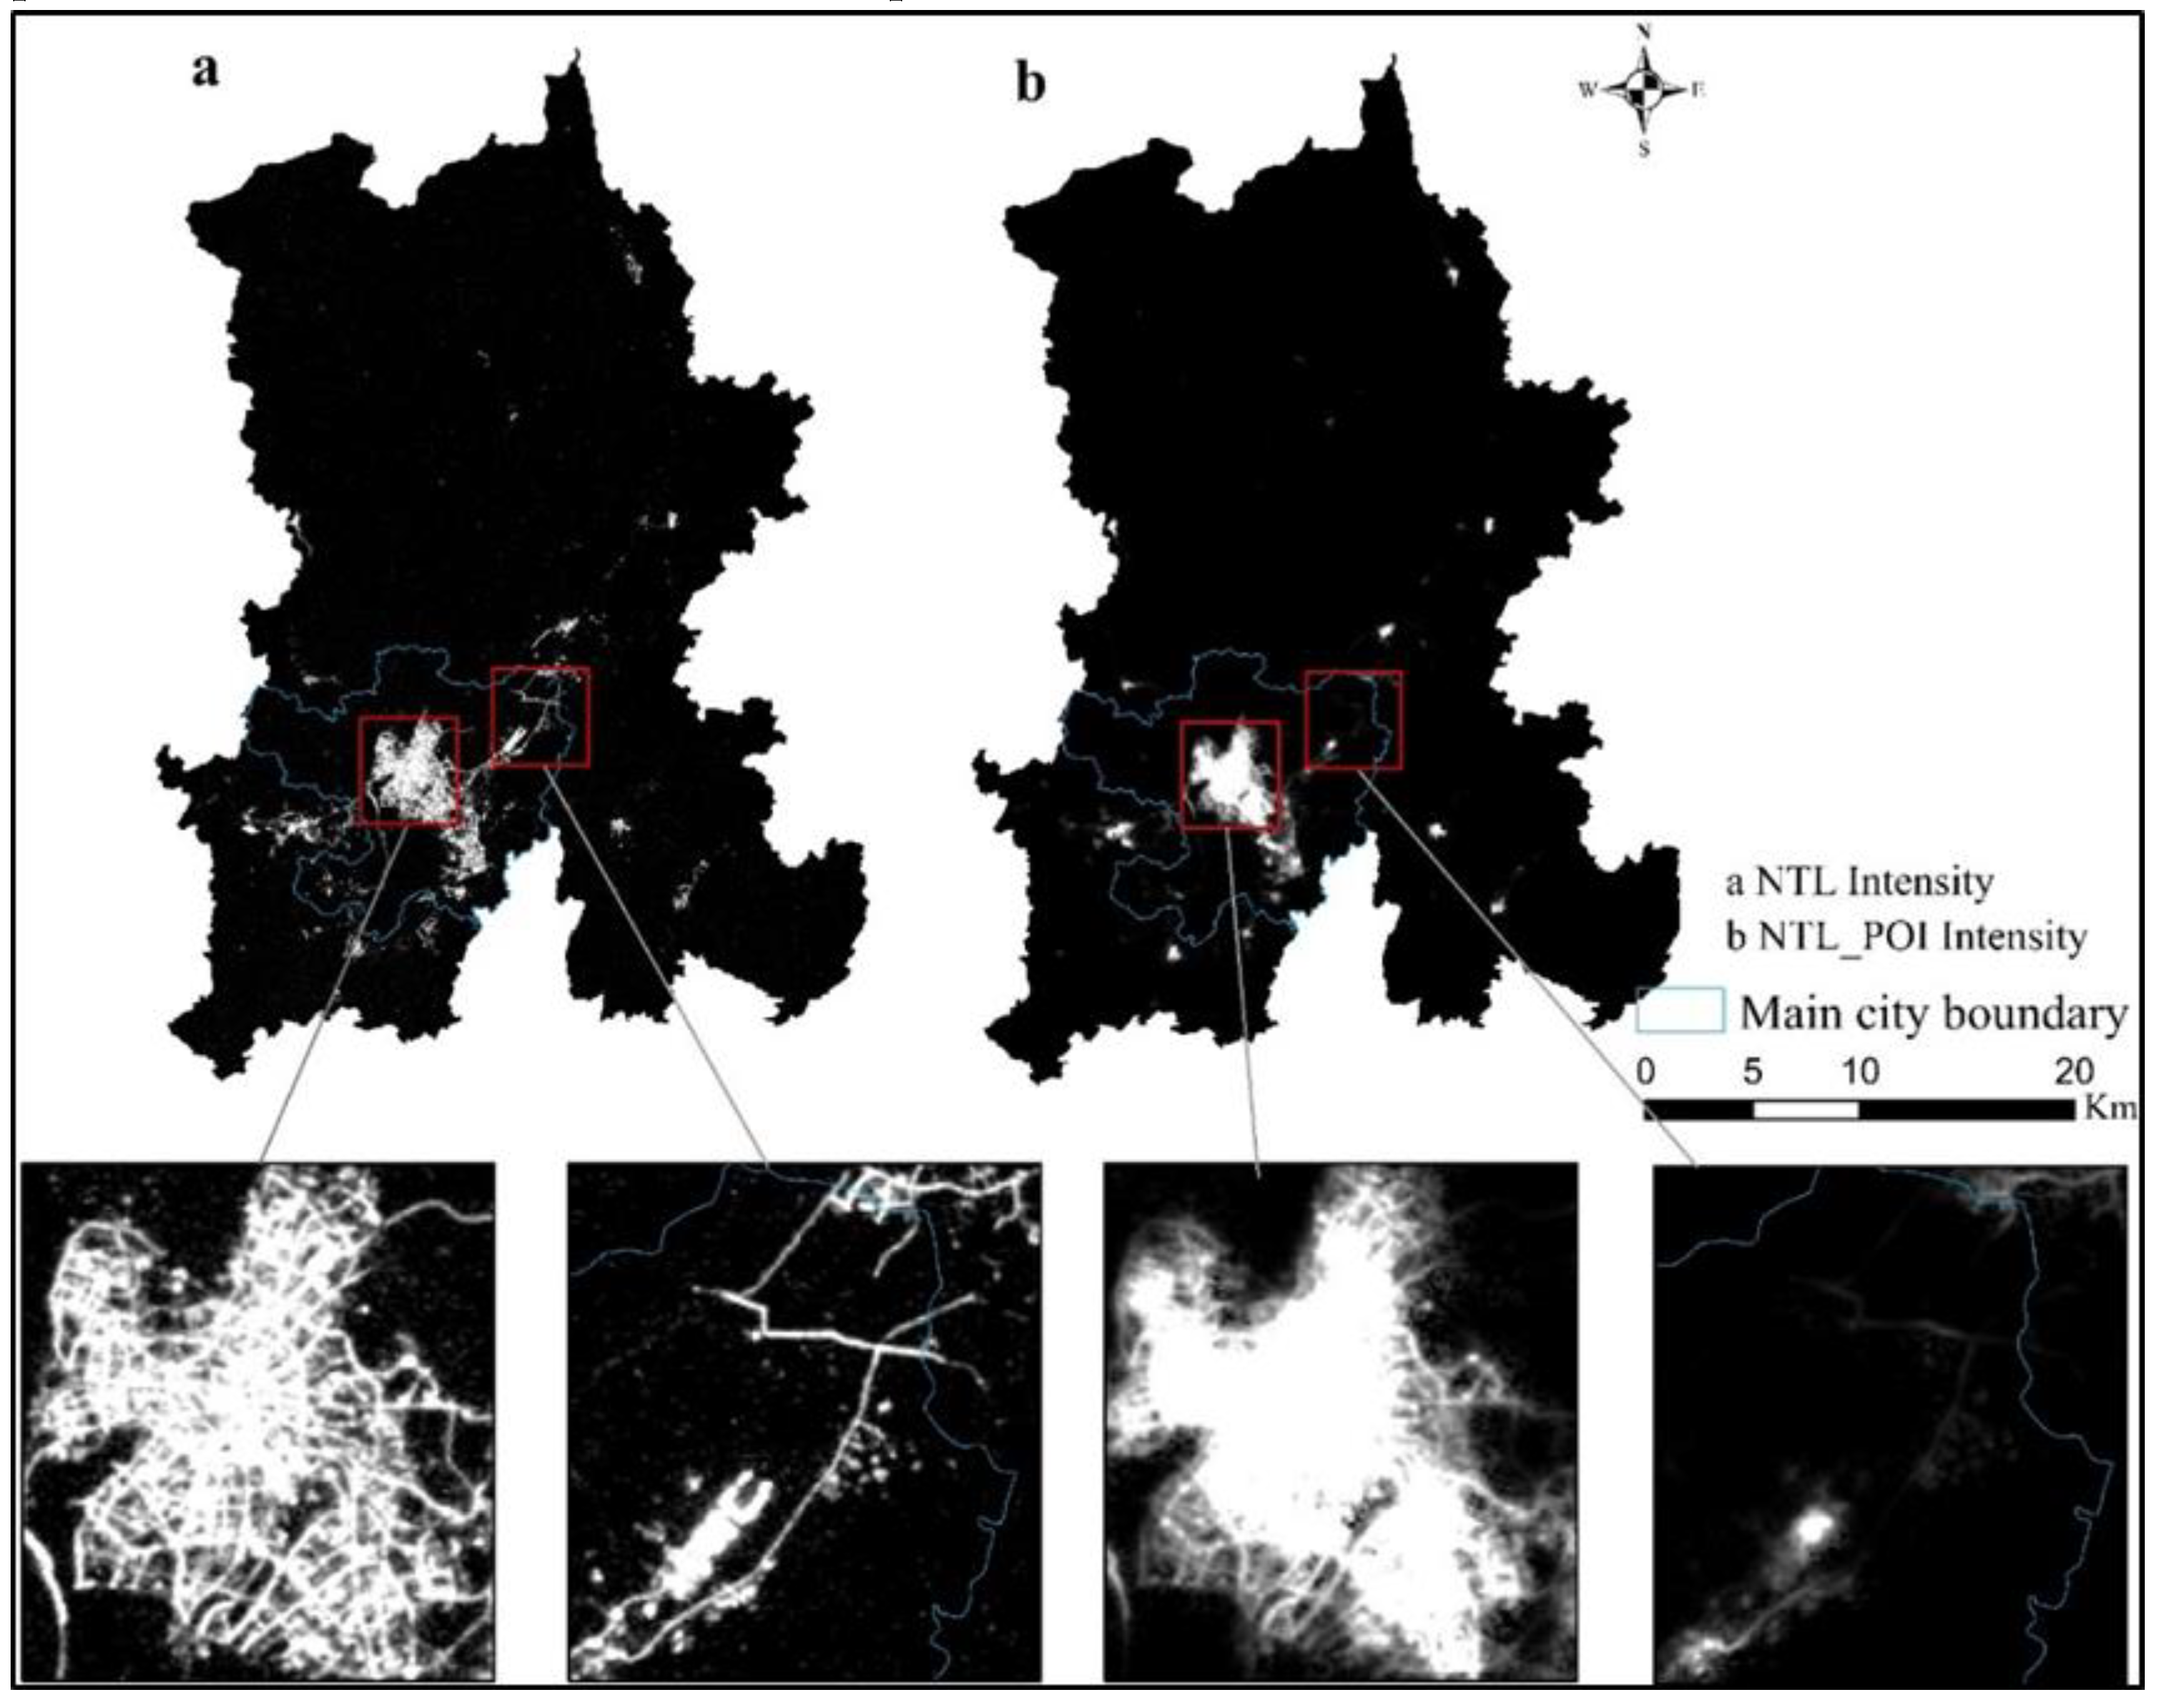
3.3.1. NTL Data and Fused NTL_POI Data

Based on comparing the NTL data and NTL_POI data in Figure 12, it can be found that the two data are relatively similar in a macroscopic view. Compared with traditional population data and GDP data, NTL data and NTL_POI data can describe the spatial structure of cities more intuitively and thus have good application prospects in identifying urban built-up areas. By observing the high and low value distribution areas of the two cities, the light intensity and NTL_POI value of NTL decrease from the central area to the edge of the city to the rural area, and the spatial distribution of high-value areas of the two cities is roughly the same.
By comparing the NTL data and NTL_POI data microscopically, it can be found that NTL data only have a single night light brightness attribute; therefore, in urban space, the higher the brightness is, the higher the NTL value will be, which often leads to inaccurate extraction of urban built-up areas. For example, Changshui Airport and the main traffic roads emit strong light at night, which makes areas with high brightness values form around the airport and roads. Although Changshui International Airport and the main traffic roads have higher light values, they do not have the same level of POI, especially on the roads. Therefore, there is no obvious high value at Changshui Airport or the main traffic road area of NTL_POI data that was fused with the POI data, which is also in line with the basic characteristics of regional differentiation in the process of urbanization [60].
In addition, some residential areas, streets and shopping malls in the city do not generate lights at night on the urban micro scale, so there will be a “lighting void” in the city, which is also in line with the actual development status of the city [61]. While the NTL_POI data are integrated with the POI data, although there is no light brightness in the “void” of the city light, there is a clustering phenomenon of POI, so the NTL_POI data can make up for the city “void” phenomenon, which makes the urban space more integrated in both macro and micro levels, and greatly improves the extraction effect of urban built-up areas.
In general, although the NTL data from a single data source can better represent the urban internal spatial structure [62], high values would be generated in nonurban areas with higher brightness due to the limitations of a single data source. POI data, on the other hand, represent urban functions by means of quantitative clustering. After data fusion, NTL_POI data can not only consider the presence or absence of POI in areas with high light values but also consider the aggregation of POI in areas with low light values. In short, the NTL_POI data fused with POI data has a better supplement to the details of urban built-up areas, and the extraction effect is more accurate.

3.3.2. Urban Built-Up Areas Identified by NTL and NTL_POI Data

The urban built-up area identified by NTL is 364.9 square kilometers, accounting for 84% of the total area of the reference built-up area. The urban built-up area identified by NTL is relatively accurate, with a recall of 0.577, precision of 0.5215 and F1 score of 0.5478 (Table 2). Although the identified built-up area reaches 84%, but the recall rate, precision rate and F1 score are low, it proves that the identified urban built-up area and the actual built-up area do not highly overlap in terms of spatial position, and there are certain differences.
The urban built-up area identified by NTL_POI is 418.2 square kilometers, accounting for 96.27% of the total area of the reference built-up area. The urban built-up area identified by NTL_POI is more accurate, with a recall of 0.86, precision of 0.81 and F1 score of 0.8343 (Table 2). The identified urban built-up area is close to the actual reference built-up area, and the recall rate, precision rate and F1 score are relatively high, which proves that NTL_POI with data fusion can identify urban built-up areas more accurately.
The urban built-up areas identified by the two datasets are 412.9 square kilometers and 418.2 square kilometers, based on a comparison of the urban built-up areas identified by the NTL and NTL_POI data. From the perspective of the identified urban built-up areas, the urban built-up area identified by NTL_POI has been obviously improved, which proves that the multiresolution segmentation based on eCongnition has a good effect on identifying urban built-up areas [63]. However, referring to the recall ratio, precision ratio, and F1 scores, there is a large difference between the urban built-up areas identified by the two datasets. The urban built-up areas identified by the NTL data do not highly overlap with the reference built-up areas in terms of spatial positions, while the urban built-up areas identified by NTL_POI overlap more with the reference built-up areas in terms of spatial positions. Therefore, the urban built-up areas identified by NTL_POI are more “realistic”.
By comparing the spatial locations of urban built-up areas identified by NTL and NTL_POI data (Figure 13), in terms of spatial locations, the differences between the two datasets are mainly concentrated at the edges of urban built-up areas, junctions and near roads. This study conducted an analysis on 6 obvious areas with the help of Google Earth using a resolution of 4.78 m. In Figure 13a,f, Google Earth shows that all the important traffic roads identified by NTL are outside the urban center of Kunming city. Since these roads also emit bright light at night, the urban built-up areas identified in the NTL data will include these traffic roads. In Figure 13b,e, there are two places where NTL has identified a larger urban built-up area: one is the Haigeng Dam (Dianchi Observation Deck) and the other is Changshui International Airport, and in comparison with Google Earth, there are few urban functional facilities here, but it is a high-value area of light, which leads to the extraction of urban built-up areas. In Figure 13c,d, the urban built-up areas identified by NTL are all smaller than those identified by NTL_POI. The reason for this result is that the light value is very low in these two areas. However, by comparison with Google Earth, one area is a villa area and the other is an urban area under construction. Because of the low light value, neither of them has been identified as an urban built-up area by NTL. The fused NTL_POI data can better compensate for the deficiency in NTL data in these 6 regions, which means that the identified urban built-up areas are more real and reliable.

4. Discussion

4.1. Advantages of Urban Built-Up Area Extracted by Wavelet Transform and Image Fusion

This research proposes a new method for extracting urban built-up areas by analyzing the characteristics of NTL data and POI data in urban space, combining the advantages and disadvantages of the two types of data. The extraction results show that the fusion of POI data and NTL data has significant advantages in the extraction of urban built-up areas.
In recent years, although with the continuous innovation of methods and technologies in the extraction of NTL data in urban built-up areas, the accuracy of the built-up area extraction is getting higher and higher, from the results of extraction, the urban built-up area extracted by NTL data still selects the light threshold as the urban built-up area, which is similar to other studies [64,65]. The direct result is that the overflow and oversaturation of NTL data lead to misclassification of areas with higher lighting values in non-built-up areas and lower lighting values in built-up areas [8]. In this study, POI data and NTL data were combined to successfully classify the non-built-up areas (airports) with high light values at night and built-up areas (residences) with low light values in the identification of urban built-up areas, which is the biggest difference compared with other studies. The main reason is that POI data, as the aggregation of geographical space quantity, makes up for the insufficient observation of NTL data in the micro scale. The wavelet transform fusion image is used to identify the urban built-up area, which better highlights the advantages of the two kinds of data in the macro scale and micro scale, that is, it effectively solves the light overflow effect and oversaturation phenomenon of NTL data in the macro scale, and takes the authenticity of POI data in the application of urban space into account [66]. Therefore, the fusion of POI and NTL images based on wavelet transform has significant advantages in extracting urban built-up areas.

4.2. Limitations and Future Research Directions

In this paper, a new method of urban built-up area extraction is proposed by fusing NTL data and POI data based on a wavelet transform, which significantly improves the accuracy of urban built-up area recognition and avoids the uncertainty of NTL single data in identifying urban built-up areas. This method does not require repeated training with many samples, making the extraction of urban built-up areas more flexible and suitable for a detailed description of the internal spatial structure of a city. However, some areas of this research still need continuous exploration and improvement.
First, instead of referring to this research as based on NTL data and POI data to identify urban built-up areas, it is better to say that this research is a study of spatial distribution characteristics. Although urban built-up areas can be automatically identified, they still lack spatial form and detailed analysis. Second, F1 scores are used in this study to verify the research results of identifying urban built-up areas based on NTL and NTL_POI. However, more detailed accuracy verification is still lacking, and more detailed accuracy assessment needs to be introduced in the next study. Finally, an exploration needs to be carried out on whether this study area can consider the spatial morphology and edge details of urban built-up areas to continue to compare the advantages of data fusion.

5. Conclusions

The urban built-up area represents the inner spatial structure of a city. The accurate extraction of the urban built-up area is of great significance for the urbanization process and the accurate evaluation of the urban environment. In this study, a new data fusion method is proposed to identify urban built-up areas by comparing the urban built-up areas identified by NTL data and NTL_POI data fused with wavelet transform. The accuracy of image fusion for the extraction of urban built-up areas is verified, and the results show that:
(1)
NTL data can identify urban built-up areas at a macro scale. Although the identified built-up area reaches 84%, the verification accuracy is too low, which makes the extracted urban built-up area not coincide with the actual urban built-up area in spatial position, resulting in large error in the extraction results.
(2)
Based on NTL data, NTL_POI data is combined with POI data through wavelet transform, the area of the identified urban built-up area reaches 96.27%, and the verification accuracy is also significantly improved. The extracted urban built-up area is highly coincident with the reference built-up area in terms of spatial location.
The image fusion method proposed in this study is of great practicability and accuracy for fusing POI and NTL data. It proves that wavelet transform fusion data is more objective and accurate to identify urban built-up areas, which makes up for the deficiency of NTL data in identifying urban built-up areas. The urban built-up areas identified by the new method are not only helpful to monitor and manage the city more efficiently but also contribute to decision making regarding urban internal spatial planning and development in the future.

Author Contributions

Conceptualization, X.H.; methodology, J.Z., X.Y.; software, X.H.; validation, X.H., C.Z.; formal analysis, C.Z.; investigation, X.H.; data curation, X.Y.; writing—original draft, X.H.; writing—review and editing, C.Z.; All authors have read and agreed to the published version of the manuscript.

Funding

This research received no external funding.

Acknowledgments

Thanks to all editors and commenters.

Conflicts of Interest

The authors declare no conflict of interest.

References

  1. Zhan, Q.; Yue, Y.; Xiao, Y. Evolution of built-up area expansion and verification of planning implementation in Wuhan. City Plan. Rev. 2018, 42, 63–71. [Google Scholar]
  2. Zhang, D.; Zhou, C.; Xu, W. Spatial-temporal characteristics of primary and secondary educational resources for relocated children of migrant workers: The case of Liaoning province. Complexity 2020, 2020, 7457109. [Google Scholar]
  3. Anasuya, B.; Swain, D.; Vinoj, V. Rapid urbanization and associated impacts on land surface temperature changes over Bhubaneswar urban district, India. Environ. Monit. Assess. 2019, 191, 790. [Google Scholar] [CrossRef] [PubMed]
  4. Rinder, J.; Liu, Q. Assessing environmental impacts of urban growth using remote sensing. Geo Spat. Inf. Sci. 2020, 23, 20–39. [Google Scholar] [CrossRef] [Green Version]
  5. Ejiagha, I.R.; Ahmed, M.R.; Hassan, Q.K.; Dewan, A.; Gupta, A.; Rangelova, E. Use of remote sensing in comprehending the influence of urban landscape’s composition and configuration on land surface temperature at neighborhood scale. Remote Sens. 2020, 12, 2508. [Google Scholar] [CrossRef]
  6. Liang, X.; Liu, X.; Chen, G.; Leng, J.; Wen, Y.; Chen, G. Coupling fuzzy clustering and cellular automata based on local maxima of development potential to model urban emergence and expansion in economic development zones. Int. J. Geogr. Inf. Sci. 2020, 34, 1930–1952. [Google Scholar] [CrossRef]
  7. Li, H.; Li, X.; Yang, X.; Zhang, H. Analyzing the relationship between developed land area and nighttime light emissions of 36 Chinese cities. Remote Sens. 2019, 11, 10. [Google Scholar] [CrossRef] [Green Version]
  8. Dou, Y.; Liu, Z.; He, C.; Yue, H. Urban land extraction using VIIRS nighttime light data: An evaluation of three popular methods. Remote Sens. 2017, 9, 175. [Google Scholar] [CrossRef] [Green Version]
  9. Andrade-Núñez, M.J.; Aide, T.M. Built-up expansion between 2001 and 2011 in South America continues well beyond the cities. Environ. Res. Lett. 2018, 13, 084006. [Google Scholar] [CrossRef]
  10. Kotharkar, R.; Bahadure, P. Achieving compact city form through density distribution: Case of Indian cities. J. Urban Plan. Dev. 2020, 146, 04019022. [Google Scholar] [CrossRef]
  11. Dennis, M.; James, P. Evaluating the relative influence on population health of domestic gardens and green space along a rural-urban gradient. Landsc. Urban Plan. 2017, 157, 343–351. [Google Scholar] [CrossRef] [Green Version]
  12. Son, N.T.; Chen, C.F.; Chen, C.R.; Thanh, B.X.; Vuong, T.H. Assessment of urbanization and urban heat islands in Ho Chi Minh City, Vietnam using Landsat data. Sustain. Cities Soc. 2017, 30, 150–161. [Google Scholar] [CrossRef]
  13. Shi, K.; Huang, C.; Yu, B.; Yin, B.; Huang, Y.; Wu, J. Evaluation of NPP-VIIRS night-time light composite data for extracting built-up urban areas. Remote Sens. Lett. 2014, 5, 358–366. [Google Scholar] [CrossRef]
  14. Cheng, X.; Luo, R.; Shi, G.; Xia, L.; Shen, Z. Automated detection of impervious surfaces using night-time light and Landsat images based on an iterative classification framework. Remote Sens. Lett. 2020, 11, 465–474. [Google Scholar] [CrossRef]
  15. Kotarba, A.Z.; Aleksandrowicz, S. Impervious surface detection with nighttime photography from the international space station. Remote Sens. Environ. 2016, 176, 295–307. [Google Scholar] [CrossRef]
  16. Pesaresi, M.; Ehrlich, D.; Ferri, S.; Florczyk, A.; Freire, S.; Halkia, M.; Julea, A.; Kemper, T.; Soille, P.; Syrris, V.; et al. Operating procedure for the production of the global human settlement layer from Landsat data of the epochs 1975, 1990, 2000, and 2014. Publ. Off. Eur. Union 2016, 1–62. [Google Scholar]
  17. Wang, Z.; Yang, S.; Wang, S.; Shen, Y. Monitoring evolving urban cluster systems using DMSP/OLS nighttime light data: A case study of the Yangtze river delta region, China. J. Appl. Remote Sens. 2017, 11, 046029. [Google Scholar] [CrossRef]
  18. Wang, R.; Wan, B.; Guo, Q.; Hu, M.; Zhou, S. Mapping regional urban extent using NPP-VIIRS DNB and MODIS NDVI data. Remote Sens. 2017, 9, 862. [Google Scholar] [CrossRef] [Green Version]
  19. Zhang, Y.X.; Li, X.; Li, C.H. Urban spatial form analysis of GBA based on “LJ1-01” nighttime light remote sensing images. J. Appl. Sci. 2020, 38, 466–477. [Google Scholar]
  20. Yu, B.; Tang, M.; Wu, Q.; Yang, C.; Deng, S.; Shi, K.; Peng, C.; Wu, J.; Chen, Z. Urban built-up area extraction from log-transformed NPP-VIIRS nighttime light composite data. IEEE Geosci. Remote Sens. Lett. 2018, 15, 1279–1283. [Google Scholar] [CrossRef]
  21. Kucsicsa, G.; Grigorescu, I. Urban growth in the Bucharest metropolitan area: Spatial and temporal assessment using logistic regression. J. Urban Plan. Dev. 2018, 144, 05017013. [Google Scholar] [CrossRef]
  22. Lei, S.; Xu, J.; Li, Y.; Du, C.; Mu, M.; Zeng, S.; Miao, S.; Bi, S.; Wang, Q.; Lyu, H.; et al. Remote monitoring of PSD slope under the influence of sand dredging activities in lake Hongze based on landsat-8/OLI data and VIIRS/DNB night-time light composite data. IEEE J. Sel. Top. Appl. Earth Obs. Remote Sens. 2019, 12, 4198–4212. [Google Scholar] [CrossRef]
  23. Li, S.; Cheng, L.; Liu, X.; Mao, J.; Wu, J.; Li, M. City type-oriented modeling electric power consumption in China using NPP-VIIRS nighttime stable light data. Energy 2019, 189, 116040. [Google Scholar] [CrossRef]
  24. Marquez, L.O.; Maheepala, S. An object-oriented approach to the integrated planning of urban development and utility services. Comput. Environ. Urban Syst. 1996, 20, 303–312. [Google Scholar] [CrossRef]
  25. Pesaresi, M.; Huadong, G.; Blaes, X.; Ehrlich, D.; Ferri, S.; Gueguen, L.; Halkia, M.; Kauffmann, M.; Kemper, T.; Lu, L.; et al. A global human settlement layer from optical HR/VHR RS data: Concept and first results. IEEE J. Sel. Top. Appl. Earth Obs. Remote Sens. 2013, 6, 2102–2131. [Google Scholar] [CrossRef]
  26. Li, X.; Zhu, J.; Yin, X.; Yao, C.; Huang, J.; Li, M. Mapping construction land of Guangzhou based on LuojiaNo.1 nightlight data. J. Geo Inf. Sci. 2019, 21, 1802–1810. [Google Scholar]
  27. Wang, X.; Zhou, T.; Wang, W. Building density estimation in Hefei main urban area by Luojia1-01 nighttime light imagery. Remote Sens. Inf. 2020, 35, 71–77. [Google Scholar]
  28. Ouyang, Z.; Lin, M.; Chen, J.; Fan, P.; Qian, S.S.; Park, H. Improving estimates of built-up area from night time light across globally distributed cities through hierarchical modeling. Sci. Total Environ. 2019, 647, 1266–1280. [Google Scholar] [CrossRef]
  29. Goldblatt, R.; Stuhlmacher, M.F.; Tellman, B.; Clinton, N.; Hanson, G.; Georgescu, M.; Wang, C.; Serrano-Candela, F.; Khandelwal, A.K.; Cheng, W.H.; et al. Using Landsat and nighttime lights for supervised pixel-based image classification of urban land cover. Remote Sens. Environ. 2018, 205, 253–275. [Google Scholar] [CrossRef]
  30. Xie, Y.; Weng, Q. Spatiotemporally enhancing time-series DMSP/OLS nighttime light imagery for assessing large-scale urban dynamics. ISPRS J. Photogramm. Remote Sens. 2017, 128, 1–15. [Google Scholar] [CrossRef]
  31. Shi, K.; Chang, Z.; Chen, Z.; Wu, J.; Yu, B. Identifying and evaluating poverty using multisource remote sensing and point of interest (POI) data: A case study of Chongqing, China. J. Clean. Prod. 2020, 255, 120245. [Google Scholar] [CrossRef]
  32. Liu, C.; Yang, K.; Bennett, M.M.; Guo, Z.; Cheng, L.; Li, M. Automated extraction of built-up areas by fusing VIIRS nighttime lights and landsat-8 data. Remote Sens. 2019, 11, 1571. [Google Scholar] [CrossRef] [Green Version]
  33. Li, F.; Yan, Q.; Bian, Z.; Liu, B.; Wu, Z. A POI and LST adjusted NTL urban index for urban built-up area extraction. Sensors 2020, 20, 2918. [Google Scholar] [CrossRef] [PubMed]
  34. Sun, B.; Zhang, Y.; Zhou, Q.; Gao, D. Street-scale analysis of population exposure to light pollution based on remote sensing and mobile big data—Shenzhen city as a case. Sensors 2020, 20, 2728. [Google Scholar] [CrossRef]
  35. Yang, X.; Ye, T.; Zhao, N.; Chen, Q.; Yue, W.; Qi, J.; Zeng, B.; Jia, P. Population mapping with multisensor remote sensing images and point-of-interest data. Remote Sens. 2019, 11, 574. [Google Scholar] [CrossRef] [Green Version]
  36. Song, J.; Lin, T.; Li, X.; Prishchepov, A.V. Mapping urban functional zones by integrating very high spatial resolution remote sensing imagery and points of interest: A case study of Xiamen, China. Remote Sens. 2018, 10, 1737. [Google Scholar] [CrossRef] [Green Version]
  37. Cao, R.; Tu, W.; Yang, C.; Li, Q.; Liu, J.; Zhu, J.; Zhang, Q.; Li, Q.; Qiu, G. Deep learning-based remote and social sensing data fusion for urban region function recognition. ISPRS J. Photogramm. Remote Sens. 2020, 163, 82–97. [Google Scholar] [CrossRef]
  38. Garnica-Carrillo, A.; Calderon, F.; Flores, J. Multi-focus image fusion for multiple images using adaptable size windows and parallel programming. Signal Image Video Process. 2020, 14, 1–8. [Google Scholar] [CrossRef]
  39. Xu, Y.; Sun, B.; Yan, X.; Hu, J.; Chen, M. Multi-focus image fusion using learning-based matting with sum of the Gaussian-based modified Laplacian. Digit. Signal Process. 2020, 106, 102821. [Google Scholar] [CrossRef]
  40. Aymaz, S.; Köse, C. A novel image decomposition-based hybrid technique with super-resolution method for multi-focus image fusion. Inf. Fusion 2019, 45, 113–127. [Google Scholar] [CrossRef]
  41. Martinez, J.; Pistonesi, S.; Maciel, M.C.; Flesia, A.G. Multi-scale fidelity measure for image fusion quality assessment. Inf. Fusion 2019, 50, 197–211. [Google Scholar] [CrossRef]
  42. Sun, J.; Han, Q.; Kou, L.; Zhang, L.; Zhang, K.; Jin, Z. Multi-focus image fusion algorithm based on Laplacian pyramids. JOSA A 2018, 35, 480–490. [Google Scholar] [CrossRef] [PubMed]
  43. Liu, Y.; Chen, X.; Wang, Z.; Wang, Z.J.; Ward, R.K.; Wang, X. Deep learning for pixel-level image fusion: Recent advances and future prospects. Inf. Fusion 2018, 42, 158–173. [Google Scholar] [CrossRef]
  44. Hu, K.; Feng, X. Research on the multi-focus image fusion method based on the lifting stationary wavelet transform. JIPS 2018, 14, 1293–1300. [Google Scholar]
  45. Zhang, J.; He, X. The center of city function in Guiyang, China: An evaluation with emerging data. Int. J. Sustain. Dev. Plan. 2020, 15, 735–741. [Google Scholar] [CrossRef]
  46. Wicht, M.; Kuffer, M. The continuous built-up area extracted from ISS night-time lights to compare the amount of urban green areas across European cities. Eur. J. Remote Sens. 2019, 52, 58–73. [Google Scholar] [CrossRef]
  47. Taubenböck, H.; Weigand, M.; Esch, T.; Staab, J.; Wurm, M.; Mast, J.; Dech, S. A new ranking of the world’s largest cities—Do administrative units obscure morphological realities? Remote Sens. Environ. 2019, 232, 111353. [Google Scholar] [CrossRef]
  48. Zhang, J.; He, X.; Yuan, X.D. Research on the relationship between Urban economic development level and urban spatial structure—A case study of two Chinese cities. PLoS ONE 2020, 15, e0235858. [Google Scholar] [CrossRef]
  49. Shen, Y.; Chen, J.; Xiao, L.; Pan, D. Optimizing multiscale segmentation with local spectral heterogeneity measure for high resolution remote sensing images. ISPRS J. Photogramm. Remote Sens. 2019, 157, 13–25. [Google Scholar] [CrossRef]
  50. Chen, Y.; Lv, Z.; Huang, B.; Jia, Y. Delineation of built-up areas from very high-resolution satellite imagery using multi-scale textures and spatial dependence. Remote Sens. 2018, 10, 1596. [Google Scholar] [CrossRef] [Green Version]
  51. Gao, J.; Wang, B.; Wang, Z.; Wang, Y.; Kong, F. A wavelet transform-based image segmentation method. Optik 2020, 208, 164123. [Google Scholar] [CrossRef]
  52. Kalaivani, K.; Phamila, Y.A.V. Detecting changes in multitemporal multispectral Landsat images using spatial frequency-based undecimated wavelet transform fusion. J. Electron. Imaging 2020, 29, 033011. [Google Scholar] [CrossRef]
  53. Yang, G.; Dai, J.; Liu, X.; Chen, M.; Wu, X. Spectral feature extraction based on continuous wavelet transform and image segmentation for peak detection. Anal. Methods 2020, 12, 169–178. [Google Scholar] [CrossRef]
  54. Sun, L.; Tang, L.; Shao, G.; Qiu, Q.; Lan, T.; Shao, J. A Machine learning-based classification system for urban built-up areas using multiple classifiers and data sources. Remote Sens. 2020, 12, 91. [Google Scholar] [CrossRef] [Green Version]
  55. Drăguţ, L.; Csillik, O.; Eisank, C.; Tiede, D. Automated parameterisation for multi-scale image segmentation on multiple layers. ISPRS J. Photogramm. Remote Sens. 2014, 88, 119–127. [Google Scholar] [CrossRef] [Green Version]
  56. Drǎguţ, L.; Tiede, D.; Levick, S.R. ESP: A tool to estimate scale parameter for multiresolution image segmentation of remotely sensed data. Int. J. Geogr. Inf. Sci. 2010, 24, 859–871. [Google Scholar] [CrossRef]
  57. Wang, Z.; Chen, G.; Yu, B.; Zhang, X. Determination of the optimal segmentation scale of high-resolution remote sensing images of islands and reefs in the south China sea. Geospat. Inf. 2018, 16, 21–24. [Google Scholar]
  58. Yang, Y.; Jun, Z.; Sui, X.; He, X. Analysis of the evolution of urban center space based on POI: A case study of main area in Kunming. Urban Dev. Stud. 2019, 26, 31–35. [Google Scholar]
  59. Yang, Z.J.; He, X.; Zhang, K.; Zhang, J. Analysis of the correlation between takeaway and urban space from the perspective of POI: A case study of main area in Kunming. Urban Dev. Stud. 2020, 27, 13–17. [Google Scholar]
  60. Zhu, Z.; Li, Z.; Liu, Y.; Chen, H.; Zeng, J. The impact of urban characteristics and residents’ income on commuting in China. Transp. Res. Part D Transp. Environ. 2017, 57, 474–483. [Google Scholar] [CrossRef]
  61. Le Roux, D.S.; Ikin, K.; Lindenmayer, D.B.; Blanchard, W.; Manning, A.D.; Gibbons, P. Reduced availability of habitat structures in urban landscapes: Implications for policy and practice. Landsc. Urban Plan. 2014, 125, 57–64. [Google Scholar] [CrossRef]
  62. Han, X.; Tana, G.; Qin, K.; Letu, H. Estimating industrial structure changes in China using DMSP-OLS night-time light data during 1999–2012. Int. Arch. Photogramm. Remote Sens. Spat. Inf. Sci. 2018, 42, 9–15. [Google Scholar] [CrossRef] [Green Version]
  63. Li, L.; Zhou, H.; Wen, Q.; Chen, T.; Guan, F.; Ren, B.; Yu, H.; Wang, Z. Automatic extraction of urban built-up area based on object-oriented method and remote sensing data. Int. Arch. Photogramm. Remote Sens. Spat. Inf. Sci. 2018, 42, 877–883. [Google Scholar] [CrossRef] [Green Version]
  64. Liu, L.; Leung, Y. A study of urban expansion of prefectural-level cities in South China using night-time light images. Int. J. Remote Sens. 2015, 36, 5557–5575. [Google Scholar] [CrossRef]
  65. Jiang, S.; Li, J.; Duan, P.; Wei, Y. An image layer difference index method to extract light area from NPP/VIIRS nighttime light monthly data. Int. J. Remote Sens. 2019, 40, 4839–4855. [Google Scholar] [CrossRef]
  66. Peng, J.; Zhao, S.; Liu, Y.; Tian, L. Identifying the urban-rural fringe using wavelet transform and kernel density estimation: A case study in Beijing City, China. Environ. Model. Softw. 2016, 83, 286–302. [Google Scholar] [CrossRef]
Figure 1. Study area.
Remotesensing 12 03887 g001
Figure 2. Preprocessing results of NTL data.
Remotesensing 12 03887 g002
Figure 3. Proportions of POI data in different categories for built-up areas and sub built-up areas in Kunming in March 2019.
Remotesensing 12 03887 g003
Figure 4. Principle of wavelet transform.
Remotesensing 12 03887 g004
Figure 5. Schematic diagram of the segmentation region in eCongnition changing with scale changes.
Remotesensing 12 03887 g005
Figure 6. Segmentation results of different combinations of shape and compactness.
Remotesensing 12 03887 g006
Figure 7. Results of weighted mean variances at different scales.
Remotesensing 12 03887 g007
Figure 8. Results of urban built-up areas identified by NTL.
Remotesensing 12 03887 g008
Figure 9. Variance curves of wavelet transform coefficients at different scales.
Remotesensing 12 03887 g009
Figure 10. NTL_POI fused by wavelet transform.
Remotesensing 12 03887 g010
Figure 11. Results of urban built-up areas identified by NTL_POI.
Remotesensing 12 03887 g011
Figure 12. Comparison of NTL and NTL_POI data.
Remotesensing 12 03887 g012
Figure 13. Comparison of urban built-up areas identified by NTL and NTL_POI.
Remotesensing 12 03887 g013
Table 1. Data Declaration.
DataSpatial ResolutionData SourcesAcquisition Time
POI30 × 30 mwww.amap.comMarch 2019
Luojia-1A130 × 130 mhttp://59.175.109.173:8888/index.htmlOctober 2018 to March 2019
Urban Built-up Areas30 × 30 mhttp://www.dsac.cn/2018
Google Earth4.78 × 4.78 mhttp://earth.google.com/March 2019
Table 2. Comparison of NTL and NTL_POI recognition results.
Area Proportion (%)Recall RatePrecision RateF1 Score
NTL84.000.5770.52150.5478
NTL_POI96.270.860.810.8343
Publisher’s Note: MDPI stays neutral with regard to jurisdictional claims in published maps and institutional affiliations.

