Letter

A Validation Experiment of the Reflectance Products of KOMPSAT-3A Based on RadCalNet Data and Its Applicability to Vegetation Indexing

Department of Electronics and Information Engineering, Hansung University, Seoul 02876, Korea
*
Author to whom correspondence should be addressed.
Remote Sens. 2020, 12(23), 3971; https://doi.org/10.3390/rs12233971
Submission received: 19 November 2020 / Revised: 1 December 2020 / Accepted: 3 December 2020 / Published: 4 December 2020

Abstract

:
Surface reflectance products obtained through the absolute atmospheric correction of multispectral satellite images are useful for precise scientific applications. For broader applications, the reflectance products computed using high-resolution images need to be validated with field measurement data. This study dealt with 2.2-m resolution Korea Multi-Purpose Satellite (KOMPSAT)-3A images with four multispectral bands, which were used to obtain top-of-atmosphere (TOA) and top-of-canopy (TOC) reflectance products. The open-source Orfeo Toolbox (OTB) extension was used to generate these products. Next, these were subsequently validated by considering three sites (i.e., Railroad Valley Playa, NV, USA (RVUS), Baotou, China (BTCN), and La Crau, France (LCFR)) in RadCalNet, as well as a calibration and validation portal for remote sensing. We conducted the validations comparing satellite image-based reflectance products and field measurement reflectance based on data sets acquired at different times. The experimental results showed that the overall trend of validation accuracy of KOPSAT-3A was well fitted in all the RadCalNet sites and that the accuracy remained quite constant. Reflectance bands showing the minimum and maximum differences between the sets of experimental data are presented in this paper. The vegetation indices (i.e., the atmospherically resistant vegetation index (ARVI) and the structure insensitive pigment index (SIPI)) and three TOC reflectance bands obtained from KOMPSAT-3A were computed as a case study and used to achieve a detailed vegetation interpretation; finally, the correspondent results were compared with those obtained from Landsat-8 images (downloaded from the Google Earth Engine (GEE)). The validation and the application scheme presented in this study can be potentially applied to the generation of analysis ready data from high-resolution satellite sensor images.

Graphical Abstract

1. Introduction

Absolute atmospheric corrections consist of minimizing atmospheric effects in radiometric images and subsequently generating reflectance products by considering the time of acquisition of satellite images and the corresponding atmospheric conditions. The importance of absolute atmospheric correction for high-resolution satellite images with spatial resolutions <5 m in multispectral bands has been noted in previous studies [1,2,3,4].
Many types of high-resolution multispectral optical satellite images are currently used in the civilian and commercialized sectors. They are obtained from WorldView-2 (with a spatial resolution of 1.8 m for eight visible and near-infrared (VNIR) bands at the nadir, except panchromatic images (PAN)) and WorldView-3 (with a spatial resolution of 1.24 m for eight VNIR bands and 3.7 m for eight shortwave infrared (SWIR) bands except PAN) by DigitalGlobe, Pleiades-1A/1B (with a spatial resolution of 2.80 m and four bands, except PAN) by the Centre National d’Études Spatiales (CNES), Gaofen-9 (with a spatial resolution of 3.20 m and four bands, except PAN) by the Chinese Academy of Space Technology, and KOMPSAT-3 (with a spatial resolution of 2.80 m and four bands, except PAN) [5].
Two types of reflectance products are derived from these satellite images: top-of-atmosphere (TOA) and top-of-canopy (TOC) reflectance. TOC reflectance products correspond to surface or bottom-of-atmosphere reflectance products.
On the other hand, open-source tools make an essential contribution to spreading the civilian use of multi-typed satellite images. However, because they do not provide all the functions that users want, it is necessary to develop additional features to fit their application purposes. Since a few open-source tools offer the processing modules for the absolute atmospheric correction of the high-resolution image, verification of processed results by newly implemented modules is also necessary for further application.
KOMPSAT-3A, which was designed and built by the Korean Aerospace Research Institute, is a high-resolution multispectral satellite launched in 2015. The calibration and validation (Cal/Val) for quality control of KOMPSAT-3A have already been carried out [6,7]. Currently, few tools can be used to extract TOA/TOC reflectance products from KOMPSAT-3A images. One example is the Orfeo Toolbox (OTB) extension [8,9]. The OTB is the product of an open-source project that provides algorithms and functions to process high-resolution multispectral and radar images at the terabyte scale [10,11]. In particular, the OTB extension adds new functions based on libraries and features from the OTB through the developer interfaces. In this study, by applying an optical calibration algorithm through the dedicated OTB extension, we generated reflectance products from KOMPSAT-3A images.
There are two primary motivations for this study. The first is to verify the temporal consistency or accuracy of the atmosphere and surface reflectance products generated from KOMPSAT-3A images at intervals of one year using data of the field measurement stations. The second is to explore the advantages of extracting precision vegetation indices to present the possibility of applying high-resolution image sets with validated products of surface reflectance.
The validation of the TOA and TOC reflectance, which represented the processing results, is fundamental for their application. Here we used RadCalNet data to verify the accuracy of the reflectance products. The Cal/Val portal for remote sensing (i.e., RadCalNet) is an initiative of the Working Group on Calibration and Validation of the Committee on Earth Observation Satellites (CEOS), which operates four reference sites around the world to support the radiometric calibration and validation of optical imaging sensor data. RadCalNet data are the most useful for evaluating the radiometric stability and accuracy of individual satellite sensors and assessing the radiometric consistency of multiple sensors. Notably, this method does not rely on the assumption of temporal invariance at the observed sites and does not require near-simultaneous observations of the site by the different sensors [12]. RadCalNet TOA reflectance data were evaluated by comparing them with Landsat 7, Landsat 8, Sentinel 2A, Sentinel 2B Sensors, and PROBA-V, and DEIMOS-1 data [13,14]. Subsequently, the RadCalNet data were applied to the absolute radiometric calibration of airborne imagers [15].
When using the reflectance products, it is necessary to consider the vegetation indices obtained by combining multiple KOMPSAT-3A bands. Notably, high-resolution images created from the multispectral bands of KOMPSAT-3A typically exhibit spatial resolutions <3 m and provide important information for a precise analysis of local or urban areas [16,17,18,19,20]. Many types of vegetation indices can be calculated from multi-bands [21,22,23,24]. For example, the normalized difference vegetation index (NDVI) (i.e., the most common vegetation index) is based on red and near infrared (NIR) bands. In this study, however, we sought to estimate two vegetation indices (i.e., the atmospherically resistant vegetation index (ARVI) and the structure insensitive pigment index (SIPI)) based on the TOC reflectance products of three bands. The RadCalNet results and the computed vegetation indices validated the KOMPSAT-3A data. Additionally, the vegetation indices obtained from KOMPSAT-3A were compared with those from the analysis ready data (ARD) of the Landsat-8 OLI images in the Google Earth Engine (GEE). We conducted to demonstrate the applicability of surface reflectance data produced from very high-resolution multispectral images.

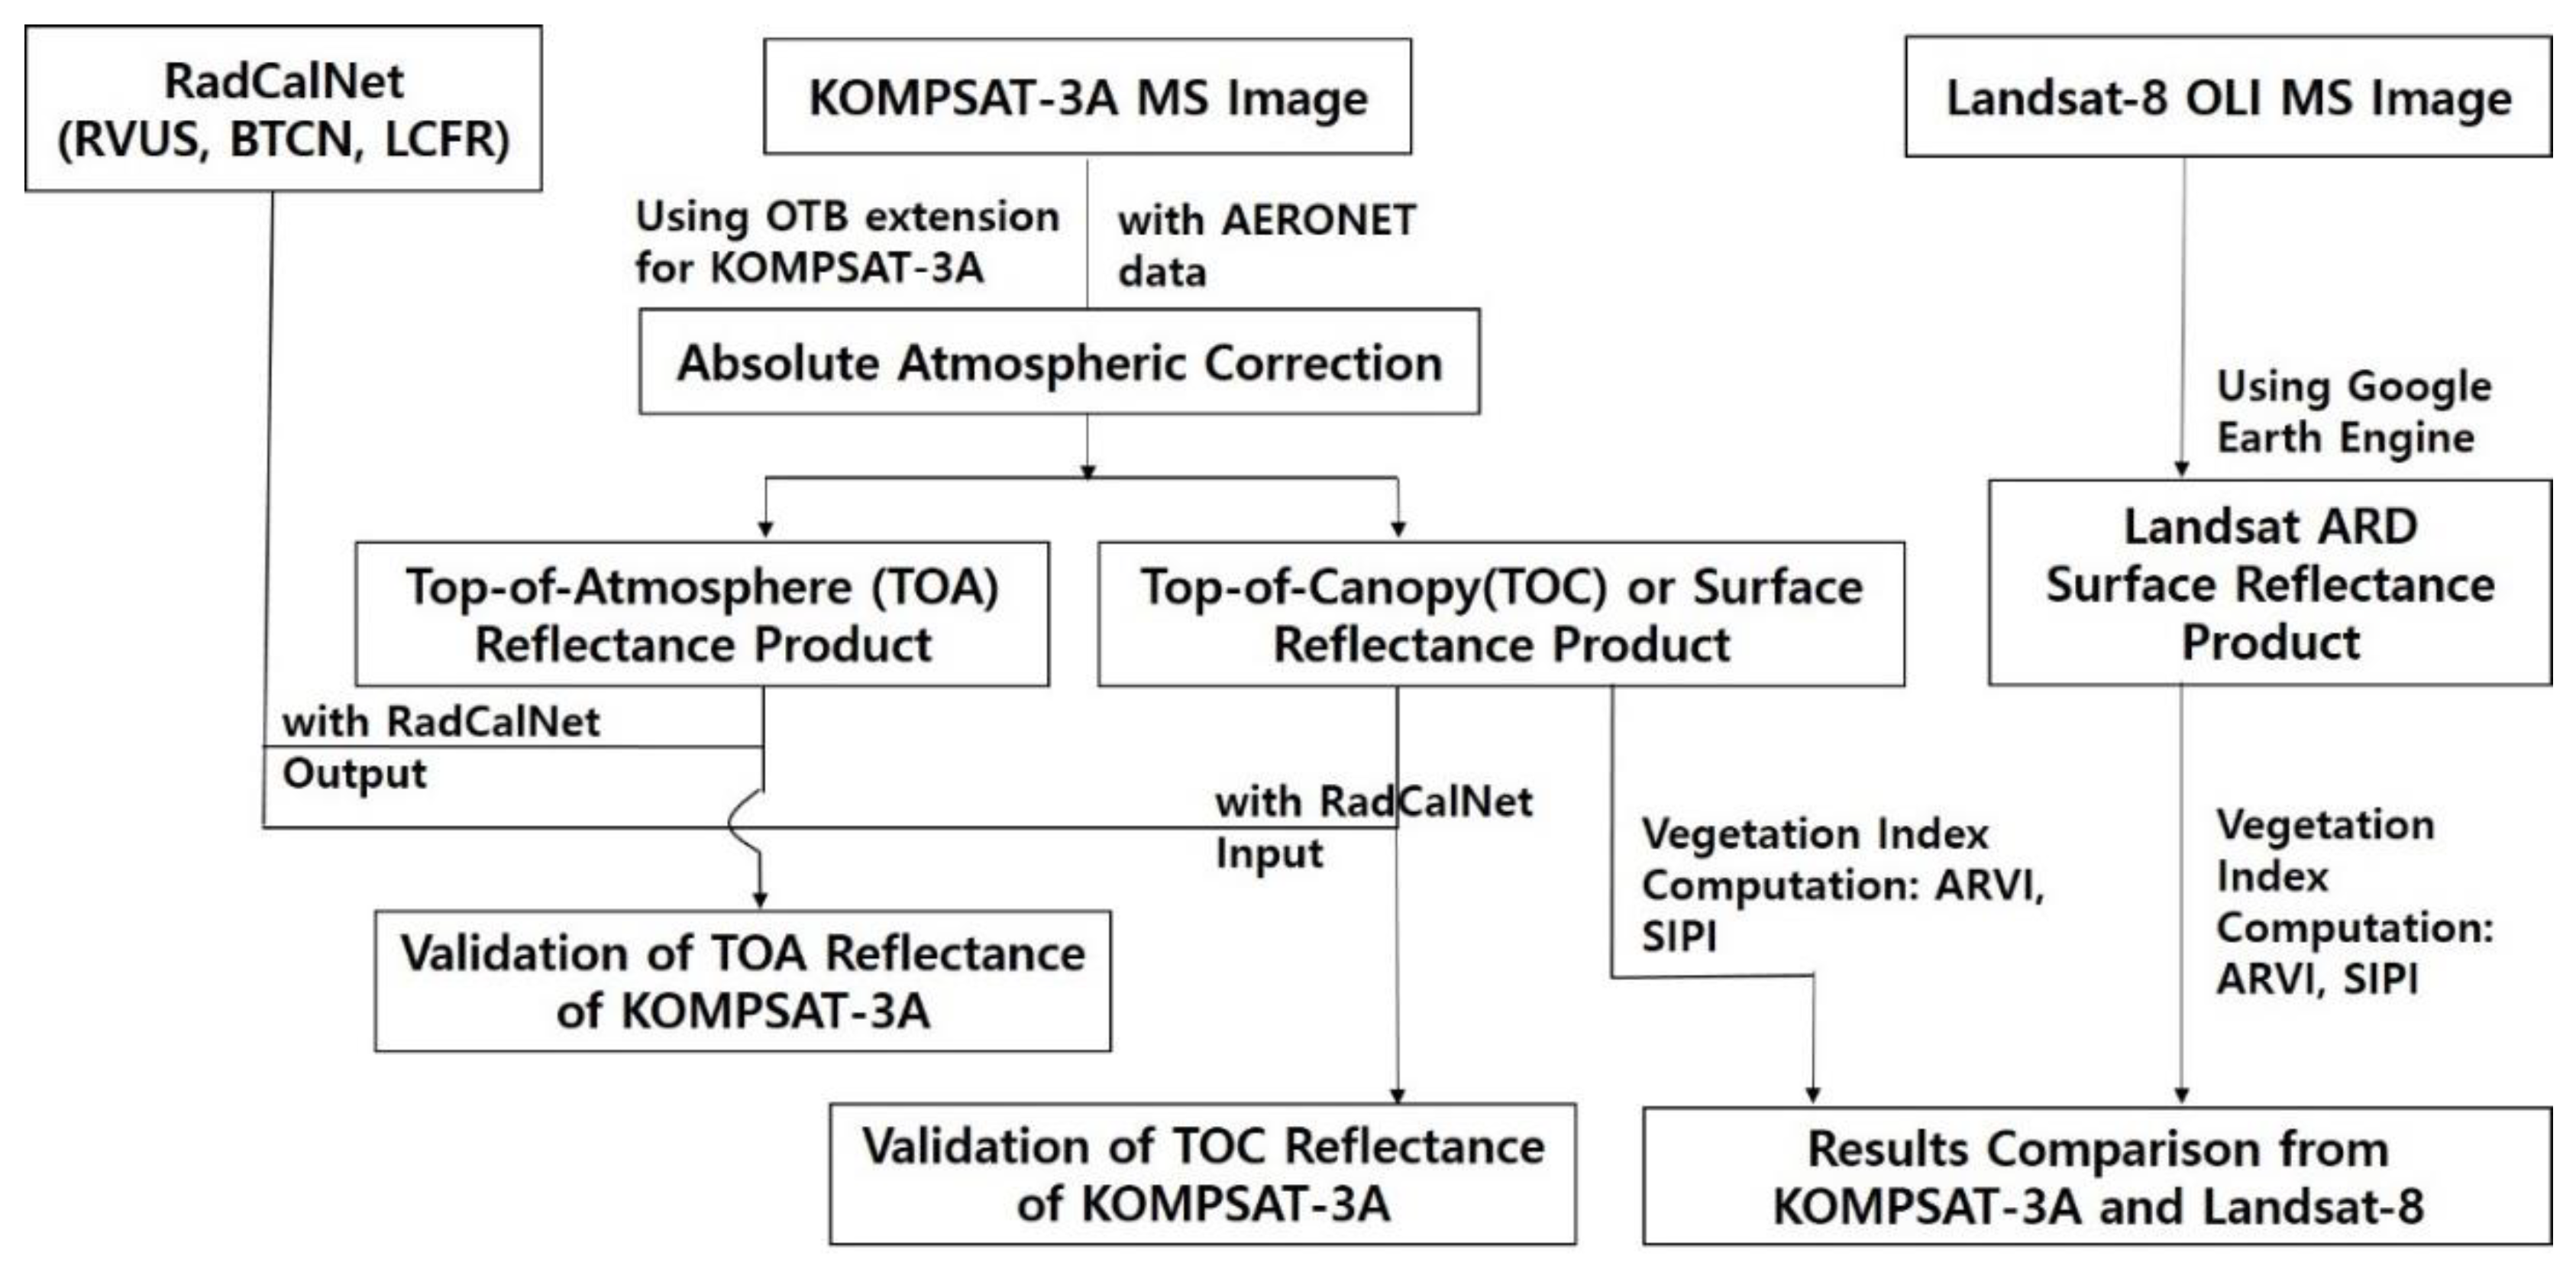
2. Work Scope and Workflow

Figure 1 shows the work scope and workflow followed for the validation of the KOMPSAT-3A images based on the RadCalNet data and their comparison with the Landsat-8 ARD data. The sensor specifications of KOMPSAT-3A (exhibiting a swath width of 12 km) are as follows: 450–900 µm for the panchromatic band, 450–520 µm for the blue band, 520–600 µm for the green band, 630–690 µm for the red band, and 760–900 µm for the NIR. Moreover, the ground sample distances at nadir are 0.55 m, 2.2 m, and 5.5 m for the panchromatic, multispectral, and NIR bands, respectively.
The four sites included in the RadCalNet are as follows: the University of Arizona at Railroad Valley Playa, Nevada, USA (RVUS), the CNES at La Crau, France (LCFR), the Academy of Opto-Electronics at Baotou, China (BTCN), and the European Space Agency (ESA)/CNES site at Gobabeb, Namibia, Africa (GONA). The RVUS site has been providing data since 2013, while the LCFR, BTCN, and GONA sites have been providing data since 2015, 2016, and 2017, respectively [12]. Among all of the available RadCalNet data, we selected only those of the first three sites (i.e., RVUS, BTCN, and LCFR). Notably, RadCalNet data provide two types of input and output [25]: a typical RadCalNet input file is composed of surface reflectance data measured at both 30-min (between 09:00 and 15:00 local time) and 10-nm (between 400 and 2500 nm) intervals; meanwhile, a RadCalNet output file is composed of TOA reflectance data. Uncertainty information can be obtained from both input and output data.
Here, we first generated TOA and TOC reflectance products from the multi-temporal KOMPSAT-3A images in multi-bands by using the OTB extension. Then, for the absolute atmosphere correction, we used aerosol AERONET data [26] collected near the RadCalNet sites. The subsequent validation process was conducted by comparing the TOA reflectance product to the RadCalNet output data and the TOC reflectance product to the RadCalNet input data. Then, the TOC reflectance product was used to compute the vegetation indices (i.e., ARVI and SIPI). Hence, the computed results were compared with those obtained from Landsat-8 analysis ready data (ARD) of the United States Geological Survey (USGS), Landsat-8 surface reflectance tier-1 [27], through the developer interface in Google Earth Engine (GEE) [28].

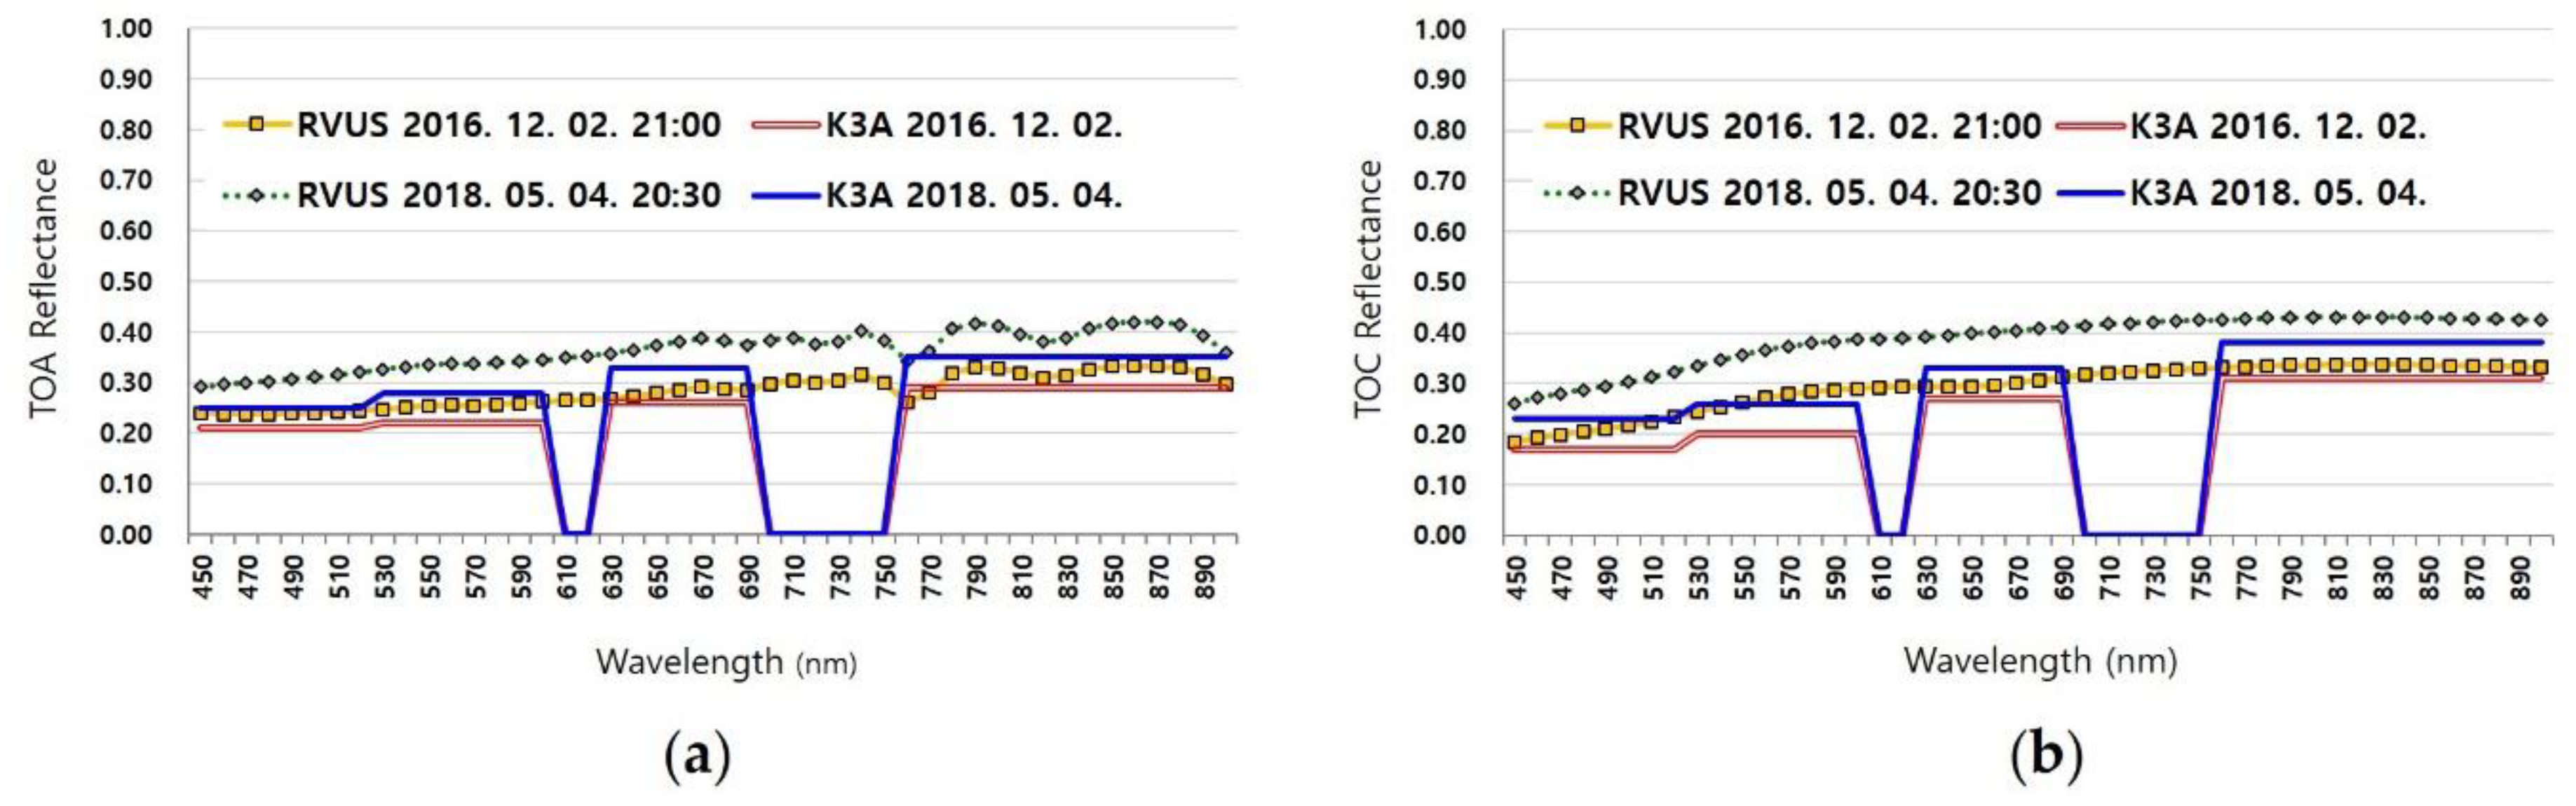
3. Results of Validation Experiment of KOMPSAT-3A with RadCalNet Data

To validate the reflectance products containing scientific information, matching the experimental conditions of the archived satellite KOMPSAT-3A images with the RadCalNet data from field measurements is necessary, although this is not easy to achieve. The use of RadCalNet expanded beyond absolute radiometric calibrations (e.g., inter-comparisons of sensors, evaluation of radiative transfer codes, and surface reflectance validation). To apply the OTB extension and obtain the reflectance products, a great amount of information on several parameters is needed. For instance, to obtain the TOA reflectance, the gains/biases of sensor and solar illuminations (one value for each band), the day and month of acquisition or the solar distance, and the sun elevation angle are required as input values. Meanwhile, to obtain the TOC reflectance, additional atmospheric parameters need to be considered: the ozone amount, the water vapor amount, the aerosol optical thickness (AOT), the sun angles (i.e., elevation and azimuth angles), the sensor angles (i.e., viewing elevation and viewing azimuth angles), and atmospheric pressure. The sensor parameters (i.e., sun angles, viewing angles, and gains/biases of the sensor) [29,30] are included in the ancillary file of the bundle image sets. It is difficult to obtain other input data on atmospheric conditions at the time and date of image acquisition in areas with no on-site measurement station. Free and open AERONET data [26] can be used to obtain AOT data and other atmospheric parameters, including the water vapor amount at the acquisition time and date. Moreover, RadCalNet sites provide uncertainty data for the TOA and TOC reflectance products. The uncertainty of the TOA reflectance was derived from the uncertainties of the test site through the Monte Carlo approach, which is based on 100 variations of a given atmospheric and surface case. The uncertainty of the input parameters used for deriving the 100 cases and the TOA reflectance uncertainty corresponded to the standard deviation of the 100 cases [31]. In addition, an uncertainty analysis of the RadCalNet data was conducted [32].
Figure 2 compares some TOA and TOC reflectance products of KOMPSAT-3A with the corresponding data from the RVUS site of the RadCalNet. In particular, it shows two datasets collected in 2016 and 2018. The RVUS site is located at 38.497 latitude and −115.690 longitude, at an altitude of 1435 m. Figure 2a,b show the TOA and TOC reflectance products, respectively. The accuracies of the TOC reflectance product of KOMPSAT-3A and the input data of the RVUS site were compared with the reflectance data extracted from Landsat-8 OLI using open-source and proprietary tools, as well as the surface reflectance of the USGS ARD [33]. Considering numerous KOMPSAT-3A image sets would have been ideal; however, finding images captured under cloud-free weather or other experimental conditions was not possible (e.g., at certain dates and times).
A high degree of agreement and a clear trend was noted between the TOA/TOC reflectance and RadCalNet data. Table 1 shows additional quantitative data: the minimum and maximum values of TOA/TOC reflectance included in the output and input files of the RVUS data for each KOMPSAT-3A band between 2 December 2016 and 4 May 2018, as well as the minimum and maximum values of the TOA/TOC reflectance for each corresponding KOMPSAT-3A band.
Concerning the RadCalNet TOA reflectance, the mean values of the B, G, R, and NIR bands in 2016 were 0.2393, 0.2553, 0.2812, and 0.3149, respectively; meanwhile, those in 2018 were 0.3052, 0.3364, 0.3740, and 0.3955, respectively. In comparison, the mean values of uncertainty of the RadCalNet TOA reflectance for the B, G, R, and NIR bands in 2016 were 0.0078, 0.0093, 0.0106, and 0.0121, respectively; moreover, those in 2018 were 0.0108, 0.0116, 0.0136, and 0.0153, respectively. The mean RadCalNet TOC reflectance for the B, G, R, and NIR bands in 2016 were 0.2082, 0.2715, 0.2995, and 0.3349, respectively; meanwhile, those in 2018 were 0.2914, 0.3655, 0.4014, and 0.4287, respectively. In comparison, the mean values of uncertainty of the RadCalNet TOC reflectance for the B, G, R, and NIR bands in 2016 were 0.0100, 0.0115, 0.0120, and 0.0129, respectively; meanwhile, those in 2018 were 0.0122, 0.0140, 0.0148, and 0.0158, respectively. At the RVUS site, the RadCalNet data demonstrated greater values than the KOMPSAT-3A TOA and TOC reflectance products. The minimum difference between the KOMPSAT-3A TOA reflectance and the RVUS site of the RadCalNet was observed for the R band in 2016 (0.0212), while the maximum difference was observed for the G band in 2018 (0.0564). Moreover, the minimum difference between the KOMPSAT-3A TOC reflectance and the RVUS site in RadCalNet was observed for the NIR band in 2016 (0.0249), while the maximum difference was observed for the G band in 2018 (0.1055). The average difference between the RadCalNet data from the RVUS site and the KOMPSAT-3A TOA reflectance in 2016 and 2018 were 0.0278 and 0.0503, respectively. Additionally, the average differences between the RadCalNet data from the RVUS site and the KOMPSAT-3A TOC reflectance in 2016 and 2018 were 0.0410 and 0.0718, respectively.
Figure 3 and Table 2 both show the data from the RadCalNet BTCN site and the KOMPSAT-3A reflectance products. Three image sets, each corresponding to a day (i.e., 31 October 2016, 5 August 2017, and 30 November 2018), were used for the validation experiments. Using the input data obtained from the BTCN site, the accuracy of the KOMPSAT-3A TOC reflectance product was compared with the reflectance product extracted from Sentinel-2B using open-source and proprietary tools, as well as with the surface reflectance of USGS ARD [34]. Notably, the BTCN site is located at a latitude of 40.85486, a longitude of 109.6272, and an altitude of 1270 m.
Differently from what was noted for the RadCalNet RVUS site, the data from the RadCalNet BTCN site were larger or smaller compared to the KOMPSAT-3A reflectance product (Figure 3). Concerning the RadCalNet TOA reflectance, the mean values of the B, G, R, and NIR bands in 2016 were 0.1757, 0.1617, 0.1585, and 0.1461, respectively, while those in 2017 were 0.1773, 0.1834, 0.1954, and 0.1862, respectively. Additionally, those in 2018 were 0.1938, 0.1883, 0.1952, and 0.1810, respectively. The mean RadCalNet TOC reflectance values for the B, G, R, and NIR bands in 2016 were 0.1269, 0.1534, 0.1577, and 0.1483, respectively, while those in 2017 were 0.1390, 0.1787, 0.1991, and 0.2013, respectively. Moreover, those in 2018 were 0.1450, 0.1870, 0.2016, and 0.1907, respectively. The mean values of uncertainty of the TOA reflectance product in 2016, 2017, and 2018 ranged between 0.0029 and 0.0036, 0.0033 and 0.0049, and 0.0031 and 0.0051, respectively. Meanwhile, those of the TOC reflectance product in 2016, 2017, and 2018 ranged between 0.0037 and 0.0045, 0.0040 and 0.0058, and 0.0042 and 0.0058, respectively.
The average differences between the data from the RadCalNet BTCN site and the KOMPSAT-3A TOA reflectance product in 2016, 2017, and 2018 were −0.0470, −0.0369, and 0.0171, respectively; meanwhile, the average difference between the RadCalNet BTCN site and the KOMPSAT-3A TOC reflectance product in 2016, 2017, and 2018 were −0.0384, −0.0305, and 0.0286, respectively. The minimum and maximum differences (in terms of absolute value) between the RadCalNet BTCN site data and the KOMPSAT-3A TOA reflectance product were noted for the NIR band in 2018 (0.0090) and 2016 (0.0739), respectively. Additionally, the minimum difference (in terms of absolute value) between the KOMPSAT-3A TOC reflectance product and the RadCalNet RVUS site data was noted for the G band in 2017 (0.0013), while the maximum difference was noted for the NIR band in 2016 (0.0817).
Figure 4 and Table 3 show the data from the RadCalNet LCFR site and the KOMPSAT-3A reflectance products for 10 August 2016 and 25 February 2019. Notably, the LCFR site is situated at a latitude of 43.56, a longitude of 4.86, and an elevation of 20 m. Similar to what was seen for the BTCN site data, the values of the LCFR site data were larger or smaller than the KOMPSAT-3A reflectance products (Figure 4).
Concerning the RadCalNet TOA reflectance data, the average values for bands B, G, R, and NIR in 2016 were 0.1462, 0.1587, 0.1989, and 0.2557, respectively, while those in 2019 were 0.1245, 0.1113, 0.1132, and 0.1943, respectively. Moreover, the average RadCalNet TOC reflectance for bands B, G, R, and NIR in 2016 were 0.0988, 0.1509, 0.2035, and 0.2757, respectively, while those in 2019 were 0.0482, 0.0806, 0.0989, and 0.2159, respectively. Notably, the mean TOA reflectance uncertainty values in 2016 and 2019 ranged between 0.0042 and 0.0098, and 0.0037 and 0.0070, respectively, while the mean TOC reflectance uncertainty in 2016 and 2018 ranged between 0.0052 and 0.0109, and 0.0028 and 0.0089, respectively.
The average differences between the data from the RadCalNet LCFR site and KOMPSAT-3A TOA reflectance in 2016 and 2019 were 0.0274 and −0.0067, respectively. Moreover, the average difference between the RadCalNet LCFR site and KOMPSAT-3A TOC reflectance in 2016 and 2019 were 0.0347 and −0.0141, respectively. In addition, the minimum difference between the KOMPSAT-3A TOA reflectance and the data from the RadCalNet LCFR site (in terms of absolute value) was noted for the G band in 2019 (0.0013), while the maximum difference was noted for the NIR band in 2016 (0.0357). Notably, the minimum and maximum differences (in terms of absolute value) between the KOMPSAT-3A TOC reflectance product and the RadCalNet RVUS site data were observed for the R band in 2019 (0.0011) and the NIR band in 2019 (0.0541), respectively.
A previous study considered the evaluation surface reflectance results from Landsat-5 TM and Landsat-7 ETM+ for the period 2000–2013, finding that the uncertainties in TOC reflectance for those sensors corresponded to 5% × surface reflectance +0.5% [35]. In this study, the overall mean value of the KOMPSAT-3A TOA reflectance product, in the case of the RVUS site, was more similar to the mean value obtained from the RadCalNet data than to that from the TOC reflectance product (0.0390 and 0.0564, respectively). Moreover, the mean TOA and TOC reflectance values were −0.0223 and −0.0134, respectively, at the BTCN site and 0.0104 and 0.0103, respectively, at the LCFR site. The comparison between these three sets of RadCalNet data indicate that the validation accuracy of KOPSAT-3A was well fitted for all the RadCalNet sites and that it was within ±5%.

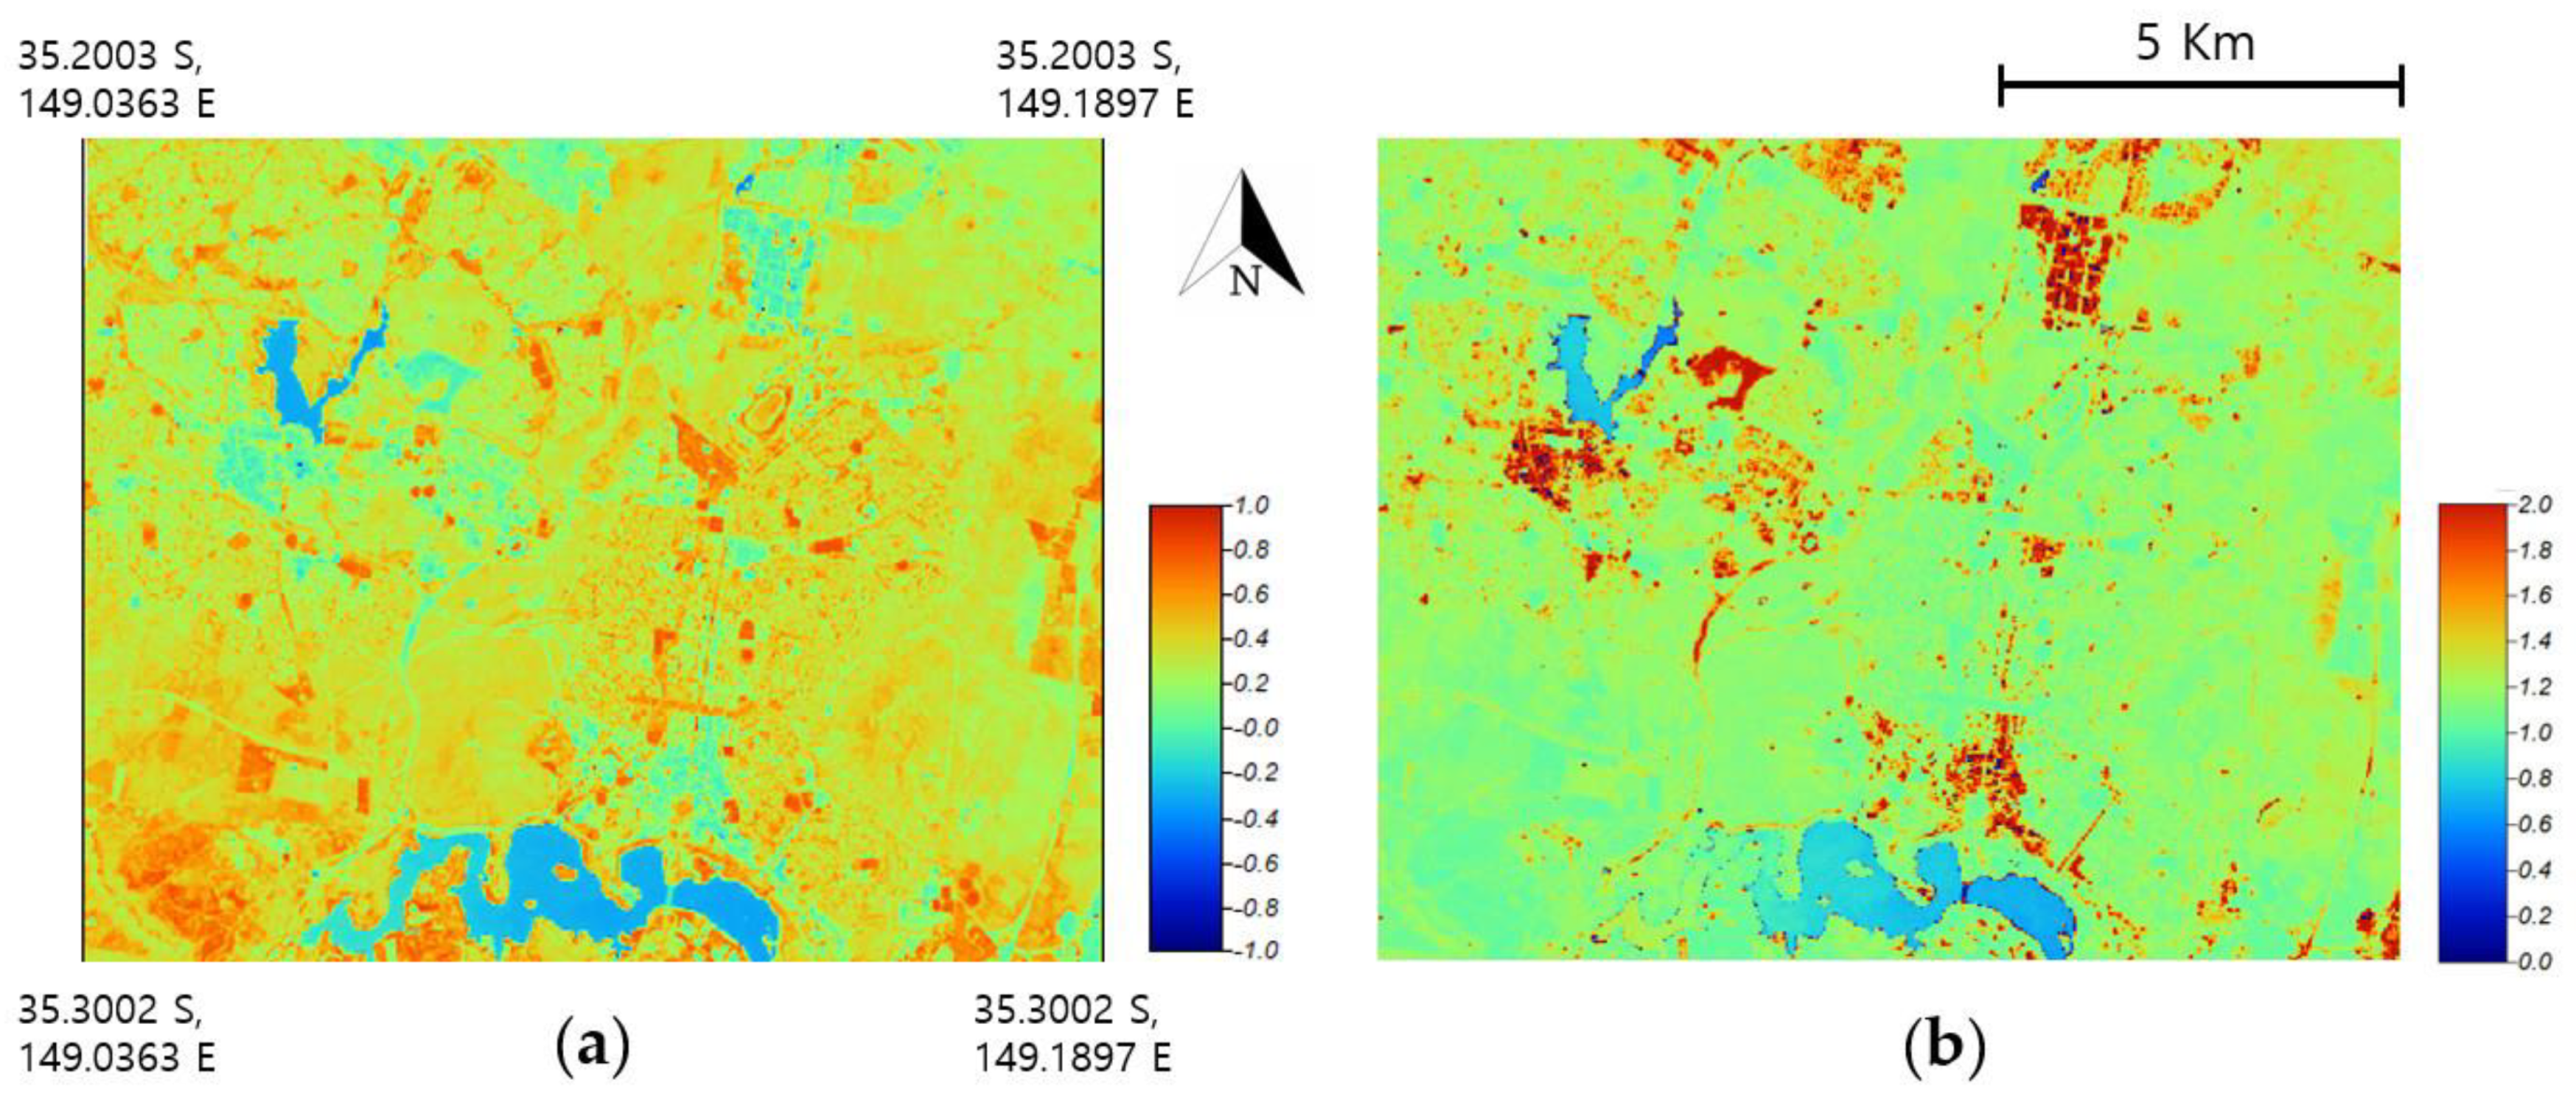
4. Computation of Vegetation Indices: A Case Study

Among the various methods available for calculating the vegetation index, we choose to employ three band values extracted from the products of surface reflectance. This approach is different from that used to calculate the NDVI, which is based instead on two bands (i.e., red and NIR).
The ARVI, in fact, is an NDVI adjusted for the atmospheric diffusion effects in the red reflectance spectrum. This adjustment is based on blue wavelength data [36].
A R V I   =   ( N I R     ( 2.0   ×   R e d )   +   B l u e ) ( N I R   +   ( 2.0   ×   R e d )   +   B l u e )
This index is particularly suitable for studying areas characterized by high amounts of atmospheric aerosols. The reflectance measurements for blue wavelengths are used to compensate for the atmospheric scattering effects, which also influence the TOC reflectance of red wavelengths. ARVI values are comprised between −1.0 and 1.0; green vegetation is generally comprised between 0.20 and 0.80. Compared to other indices, the ARVI agricultural index is less influenced by topographic effects; it can be used as a particularly effective monitoring tool for mountainous regions, which are often polluted by residual soot from slash-and-burn agriculture.
Meanwhile, the SIPI is suitable for quantitative analyses of areas characterized by a variable vegetation cover structure. This index indicates the ratio of carotenoids/chlorophyll and is generally used to detect increases in vegetation stress.
S I P I   =   ( N I R     B l u e ) ( N I R     R e d )
This vegetation index maximizes the sensitivity to the bulk carotenoids/chlorophyll ratio and, hence, the impact of a variable canopy structure. Therefore, it is particularly useful in areas with a highly variable plant cover structure or leaf area index. SIPI values vary between 0.0 and 2.0; healthy green vegetation generally varies between 0.8 and 1.8. Therefore, high SIPI values are often an indicator of plant disease, which is linked to a loss of chlorophyll in plants; this index is useful for monitoring plant health in regions where the canopy structure or leaf area index are highly variable, and for a rapid detection of plant diseases or other causes of stress.
Figure 5 shows the area of interest for a case study (the Canberra region in Australia), covered by the KOMPSAT-3A in 2016 and that included a station from which AERONET data were obtained. OpenStreetMap (OSM) [37] was used for the background map. The NDVI, which was obtained from the red and NIR bands of the TOC reflectance product from a KOMPSAT-3A image, was computed and interpreted by density slice reclassification [9].
Figure 6a,b show the ARVI and SIPI results obtained from the surface reflectance product of Landsat-8 in GEE at the same date and time of the KOMPSAT-3A survey. The ARVI and SIPI results were extracted from the scripts of Equations (1) and (2), respectively. Figure 7a,b show the AVRI and SIPI results obtained from the TOC reflectance product of the KOMPSAT-3A image and the AERONET data, respectively. The overall vegetation changes in the study area indicated by the ARVI and the SIPI are visible in Figure 6a,b; however, the detailed features within and around the area of interest are somewhat indiscernible due to the low resolution of Landsat-8 OLI data. Such details are instead well defined when using the KOMPSAT-3A multispectral image sets (shown in Figure 7a,b).
In addition to these visual interpretations, the ARVI results can be partitioned into four ranges: −1.00 to 0.00, 0.00 to 0.19, 0.20 to 0.80, and 0.81 to 1.00; by the interpretation guide suggested in [38], green vegetation ranges between 0.20 and 0.80. The SIPI results can be instead partitioned into three intervals by interpreting according to the guide in [39]: 0.00 to 0.79, 0.80 to 1.80, and 1.81 to 2.00. We can infer that healthy green vegetation falls between 0.8 and 1.80. The ARVI results do not appear to show marked differences, while the SIPI results suggested substantial changes. This implies that comparing the results obtained from several vegetation indices is necessary.

5. Discussion

Obtaining surface reflectance data from high-resolution images by applying absolute atmospheric correction is another important step for verifying the performance. Although absolute atmospheric correction has been extensively investigated in the field of optical satellite remote sensing, it is still being studied and developed [40]; it exhibits a practical importance in increasing the value of remotely sensed images for further scientific applications. As a matter of fact, high-resolution images can be used to generate detailed vegetation indices, allowing precise interpretations.
For optical satellites that do not exhibit Cal/Val sites, as well as satellites that exhibit fixed sites for calibration, reflectance products need to be periodically generated and compared to the values registered at RadCalNet sites to check their quality. These cross-validation operations should be continuously and periodically performed; in fact, satellite states change continuously, and the exact environmental variables needed to obtain reflectance products for application in the target region are difficult to obtain.
The experimental results obtained in this study cannot be generalized; further studies based on KOMPSAT-3A images should be conducted. Nevertheless, based on surface reflectance products obtainable from high-resolution satellite images, this paper describes a basic and practical approach for ARD construction [41]. ARD is regarded as an emerging trend for Earth observations applications based on time-series stacks of satellite images. The CEOS defined ARD as satellite data that are processed and organized in a form that is ideal for immediate analyses, requires minimum effort by additional users’, and exhibits a minimum set of requirements for the preparation of imagery for further analysis [42]. These characteristics help minimize the time and scientific knowledge required to access and utilize satellite data for users’ application targets. Numerous optical images with resolutions >10 m for civilian and scientific use have been reconstructed from Landsat ARD and Sentinel-2 ARD [43,44]. In the CEOS ARD, Cal/Val is also regarded as one of the major research topics [45]. The products of high ARD have been previously introduced for remote sensing data analysis (e.g., image classification using machine learning) [41]. ARD for optical satellite images currently being led by the CEOS have developed implementation guidelines primarily for Landsat or Sentinel satellite images [46]. No guidance on high-resolution images such as WorldView-2/3, Pleiades-1A/1B, Gaofen-9, CartoSat-2, and KOMPSAT-3/3A has been released yet because it is in an early stage of ARD research for high-resolution sensor images. Several types of information and processes (presented in this study) are necessary for building a high-resolution ARD with multispectral bands with resolution <3 m: TOA and TOC reflectance products, a production system or software for obtaining them, the validation of these products based on field measurements, and the demonstration of application cases with respect to the reflectance products.
Recent demands for application studies such as detailed environmental monitoring and climate change in local and regional areas in the private and public sectors have been increased. As the imperative data sets for these applications, Low Earth Orbit (LEO) satellites will continue to launch and operate in many countries to obtain high-resolution and multi-spectral satellite images. Of course, Cal/Val for satellite images are the essential pre-processing processes. For such processing, the use of RadCalNet data is the most practical approach if there are no Cal/Val facilities for their own sensors or if prompt validation for reflectance products obtained from past images is required. Therefore, this study can be used as a reference study for this verification.

6. Conclusions

Although atmospheric correction has been widely studied in satellite remote sensing, it is still being researched and developed because of its practical importance in increasing data value for further scientific applications. Surface reflection data are obtained from the absolute atmospheric correction of satellite images. Notably, the reflectance products from high-resolution images need to be validated by using field measurement data.
This study focused on KOMPSAT-3A images with four multispectral bands and their TOA and TOC reflectance products. To validate the TOA and TOC reflectance products generated using the OTB extension, we considered three RadCalNet sites: RVUS, BTCN, and LCFR. To validate the image-based reflectance products, we compared them with the RadCalNet field reflectance data from single measurement stations located in the same locations covered by the satellite. We noted that, in most cases, the products and the applied field datasets were highly consistent (accuracy within ±5%). Notably, we considered bands of minimum and maximum differences between the two sets of experimental data. Overall, the experimental results provided important information and validated the accuracy of the reflectance products of satellite images. These same experiments can be applied by checking the accuracy of open-source tools or algorithms for the absolute atmospheric correction, such as OTB extension applied in this study. In addition, we calculated different vegetation indices based on three bands and applied them to a case study. To demonstrate the detailed characteristics of high-resolution images, the correspondent results were compared with Landsat 8 images from the GEE. This same technique can be applied to urban forest analysis and the proposal and validation of an application scheme for ARD building from high-resolution satellite sensor images.

Author Contributions

Conceptualization, K.L.; Methodology, K.L.; Software, K.K.; Investigation and Analysis, K.L.; Writing, K.L.; All authors have read and agreed to the published version of the manuscript.

Funding

Kiwon Lee was financially supported by Hansung University. The advanced 3D spatial data management program (A3DSAMP, grant number: 2020-03-009) also supported Kwangseob Kim.

Acknowledgments

The authors thank the anonymous reviewers for their careful reading of our manuscript and their comments and suggestions.

Conflicts of Interest

The authors declare no conflict of interest.

References

  1. Marcello, J.; Eugenio, F.; Perdomo, U.; Medina, A. Assessment of Atmospheric Algorithms to Retrieve Vegetation in Natural Protected Areas Using Multispectral High Resolution Imagery. Sensors 2016, 16, 1624. [Google Scholar] [CrossRef] [PubMed] [Green Version]
  2. Vanhellemont, Q.; Ruddick, K. Atmospheric correction of metre-scale optical satellite data for inland and coastal water applications. Remote Sens. Environ. 2018, 216, 586–597. [Google Scholar] [CrossRef]
  3. DigitalGlobe Atmospheric Compensation. Available online: http://digitalglobe-marketing.s3.amazonaws.com/files/documents/DataSheet_AComp_DS.pdf (accessed on 6 October 2020).
  4. Absolute Radiometric Calibration Is an Essential Tool to Imagery Science, but What Is It? Available online: https://blog.maxar.com/earth-intelligence/2020/absolute-radiometric-calibration-is-an-essential-tool-to-imagery-science-but-what-is-it (accessed on 2 October 2020).
  5. Chandra, S.N.R.; Christopherson, J.B.; Casey, K.A. Joint Agency Commercial Imagery Evaluation-Remote Sensing Satellite Compendium. 2020. Available online: https://pubs.er.usgs.gov/publication/cir1468 (accessed on 20 October 2020).
  6. Yeom, J.M.; Ko, J.; Hwang, J.; Lee, C.S.; Choi, C.U.; Jeong, S. Updating Absolute Radiometric Characteristics for KOMPSAT-3 and KOMPSAT-3A Multispectral Imaging Sensors Using Well-Characterized Pseudo-Invariant Tarps and Microtops II. Remote Sens. 2018, 10, 697. [Google Scholar] [CrossRef] [Green Version]
  7. Ahn, H.Y.; Kim, K.Y.; Lee, K.D.; Park, C.W.; So, K.H.; Na, S.I. Feasibility Assessment of Spectral Band Adjustment Factor of KOMPSAT-3 for Agriculture Remote Sensing. Korean J. Remote Sens. 2018, 34, 1369–1382, (In Korean with English Abstract). [Google Scholar] [CrossRef]
  8. Lee, K.; Kim, K. An Experiment for Surface Reflectance Image Generation of KOMPSAT 3A Image Data by Open Source Implementation. Korean J. Remote Sens. 2019, 35, 1327–1339, (In Korean with English Abstract). [Google Scholar] [CrossRef]
  9. Lee, K.; Kim, K.; Lee, S.; Kim, Y. Determination of the Normalized Difference Vegetation Index(NDVI) with Top-of-Canopy(TOC) Reflectance from a KOMPSAT-3A Image Using Orfeo ToolBox(OTB) Extension. ISPRS Int. J. Geo-Inf. 2020, 9, 257. [Google Scholar] [CrossRef] [Green Version]
  10. Grizonnet, M.; Michel, J.; Poughon, V.; Inglada, J.; Savinaud, M.; Cresson, R. Orfeo ToolBox: Open source processing of remote sensing images. Open Geospat. Data Softw. Stand. 2017, 2, 15. [Google Scholar] [CrossRef] [Green Version]
  11. Orfeo Toolbox. Open Source Processing for Remote Sensing Images. Available online: https://www.orfeo-toolbox.org/ (accessed on 10 October 2020).
  12. Bouvet, M.; Thome, K.; Berthelot, B.; Bialek, A.; Czapla-Myers, J.; Fox, N.P.; Goryl, P.; Henry, P.; Ma, L.; Marcq, S.; et al. RadCalNet: A Radiometric Calibration Network for Earth Observing Imagers Operating in the Visible to Shortwave Infrared Spectral Range. Remote Sens. 2019, 11, 2401. [Google Scholar] [CrossRef] [Green Version]
  13. Jing, X.; Leigh, L.; Pinto, C.T.; Helder, D. Evaluation of RadCalNet Output Data Using Landsat 7, Landsat 8, Sentinel 2A, and Sentinel 2B Sensors. Remote Sens. 2019, 11, 541. [Google Scholar] [CrossRef] [Green Version]
  14. Sterckx, S.; Wolters, E. Radiometric Top-of-Atmosphere Reflectance Consistency Assessment for Landsat 8/OLI, Sentinel-2/MSI, PROBA-V, and DEIMOS-1 over Libya-4 and RadCalNet Calibration Sites. Remote Sens. 2019, 11, 2253. [Google Scholar] [CrossRef] [Green Version]
  15. Wenny, B.N.; Thome, K.; Czapla-Myers, J. Evaluation of vicarious calibration for airborne sensors using RadCalNet. In Proceedings of the SPIE 11530, Sensors, Systems, and Next-Generation Satellites XXIV, Online Conference, 2 October 2020; p. 1153017. [Google Scholar] [CrossRef]
  16. Nouri, H.; Beecham, S.; Anderson, S.; Nagler, P. High Spatial Resolution WorldView-2 Imagery for Mapping NDVI and Its Relationship to Temporal Urban Landscape Evapotranspiration Factors. Remote Sens. 2014, 6, 580–602. [Google Scholar] [CrossRef] [Green Version]
  17. Warner, T.; Skowronski, N.S.; Gallagher, M.R. High spatial resolution burn severity mapping of the New Jersey Pine Barrens with WorldView-3 near-infrared and shortwave infrared imagery. Int. J. Remote Sens. 2017, 38, 598–616. [Google Scholar] [CrossRef]
  18. Yan, J.; Zhou, W.; Han, L.; Qian, Y. Mapping vegetation functional types in urban areas with WorldView-2 imagery: Integrating object-based classification with phenology. Urban For. Urban Green. 2018, 31, 230–240. [Google Scholar] [CrossRef]
  19. Solano, F.; Fazio, S.D.; Modica, G. A methodology based on GEOBIA and WorldView-3 imagery to derive vegetation indices at tree crown detail in olive orchards. Int. J. Appl. Earth Obs. 2019, 83, 101912. [Google Scholar] [CrossRef]
  20. Fang, F.; McNeil, B.; Warner, T.; Dahle, G.; Eutsler, E. Street tree health from space? An evaluation using WorldView-3 data and the Washington D.C. Street Tree Spatial Database. Urban For. Urban Green. 2020, 49, 126634. [Google Scholar] [CrossRef]
  21. Xue, J.; Su, B. Significant Remote Sensing Vegetation Indices: A Review of Developments and Applications. J. Sens. 2017, 2017, 1353691. [Google Scholar] [CrossRef] [Green Version]
  22. Tan, C.; Zhou, X.; Zhang, P.; Wang, Z.; Wang, D.; Guo, W.; Yun, F. Predicting grain protein content of field-grown winter wheat with satellite images and partial least square algorithm. PLoS ONE 2020, 15, e0228500. [Google Scholar] [CrossRef]
  23. Zarei, A.; Asadi, E.; Ebrahimi, A.; Jafari, M.; Malekian, A.; Nasrabadi, H.M.; Chemura, A.; Maskell, G. Prediction of future grassland vegetation cover fluctuation under climate change scenarios. Ecol. Indic. 2020, 119, 106858. [Google Scholar] [CrossRef]
  24. Somvanshi, S.S.; Kumari, M. Comparative analysis of different vegetation indices with respect to atmospheric particulate pollution using sentinel data. Appl. Comput. Geosci. 2020, 7, 100032. [Google Scholar] [CrossRef]
  25. RadCalNet Data Format Specification, QA4EO-WGCVRadCalNet-R2. Available online: https://www.radcalnet.org/resources/RadCalNetQuickstartGuide_20180702.pdf (accessed on 10 March 2020).
  26. AERONET. Aerosol Robotic Network. Available online: https://aeronet.gsfc.nasa.gov/ (accessed on 10 January 2020).
  27. USGS Landsat 8 Surface Reflectance Tier 1. Available online: https://developers.google.com/earth-engine/datasets/catalog/LANDSAT_LC08_C01_T1_SR (accessed on 10 September 2020).
  28. NDVI. Mapping a Function over a Collection, Quality Mosaicking. Available online: https://developers.google.com/earth-engine/tutorial_api_06 (accessed on 4 September 2020).
  29. TOA Radiance Reflectance Conversion of KOMPSAT 1.5. 2018. Available online: http://www.si-imaging.com/resources/?pageid=2&uid=284&mod=document (accessed on 2 October 2020).
  30. KOMPSAT-3A Image Data Manual v1.4. 2017. Available online: http://www.si-imaging.com/resources/?pageid=4&uid=234&mod=document (accessed on 2 October 2020).
  31. Thome, K.; Bouvet, M. Radiometric Calibration Network for Vicarious Calibration of Earth Observing Imagers in the Reflected Solar. Available online: https://earth.esa.int/documents/700255/4038549/2+thome_optical_radcalnet.pdf (accessed on 2 October 2019).
  32. Ma, L.; Zhao, Y.; Woolliams, E.R.; Dai, C.; Wang, N.; Liu, Y.; Li, L.; Wang, X.; Gao, C.; Li, C.; et al. Uncertainty Analysis for RadCalNet Instrumented Test Sites Using the Baotou Sites BTCN and BSCN as Examples. Remote Sens. 2020, 12, 1696. [Google Scholar] [CrossRef]
  33. Lee, K.; Kim, K. Validation of Surface Reflectance Product of KOMPSAT-3A Image Data Using RadCalNet Data. Korean J. Remote Sens. 2020, 36, 167–178, (In Korean with English Abstract). [Google Scholar] [CrossRef]
  34. Kim, K.; Lee, K. Validation of Surface Reflectance Product of KOMPSAT-3A Image Data: Application of RadCalNet Baotou (BTCN) Data. Korean J. Remote Sens. 2020. submitted for publication (In Korean with English Abstract). [Google Scholar]
  35. Claverie, M.; Vermote, E.F.; Belen Franch, B.; Masek, J.G. Evaluation of the Landsat-5 TM and Landsat-7 ETM+ surface reflectance products. Remote Sens. Environ. 2015, 169, 390–403. [Google Scholar] [CrossRef]
  36. Spectral Indices on Top of NDVI to Make Your Vegetation Analysis Complete. Available online: https://eos.com/blog/6-spectral-indexes-on-top-of-ndvi-to-make-your-vegetation-analysis-complete/ (accessed on 30 March 2020).
  37. OpenStreetMap. Available online: www.openstreetmap.org (accessed on 30 October 2020).
  38. Available online: https://custom-scripts.sentinel-hub.com/custom-scripts/sentinel-2/arvi/ (accessed on 2 September 2020).
  39. Available online: https://custom-scripts.sentinel-hub.com/custom-scripts/sentinel-2/sipi1/ (accessed on 2 September 2020).
  40. Radiometric Use of WorldView-3 Imagery. Available online: https://dg-cms-uploads-production.s3.amazonaws.com/uploads/document/file/207/Radiometric_Use_of_WorldView-3_v2.pdf (accessed on 25 November 2020).
  41. Frantz, D. FORCE—Landsat + Sentinel-2 Analysis Ready Data and Beyond. Remote Sens. 2019, 11, 1124. [Google Scholar] [CrossRef] [Green Version]
  42. Available online: http://ceos.org/ard/files/PFS/SR/v5.0/CARD4L_Product_Family_Specification_Surface_Reflectance-v5.0.pdf (accessed on 2 October 2019).
  43. Poussin, C.; Guigoz, Y.; Palazzi, E.; Terzago, S.; Chatenoux, B.; Giuliani, G. Snow Cover Evolution in the Gran Paradiso National Park, Italian Alps, Using the Earth Observation Data Cube. Data 2019, 4, 138. [Google Scholar] [CrossRef] [Green Version]
  44. Potapov, P.; Hansen, M.C.; Kommareddy, I.; Kommareddy, A.; Turubanova, S.; Pickens, A.; Adusei, B.; Tyukavina, A.; Ying, Q. Landsat Analysis Ready Data for Global Land Cover and Land Cover Change Mapping. Remote Sens. 2020, 12, 426. [Google Scholar] [CrossRef] [Green Version]
  45. Ong, C.; Thome, K.; Kuze, A. Role of CEOS Working Group on Calibration and Validation in Analysis Ready Data Products. In Proceedings of the IEEE International Geoscience and Remote Sensing Symposium, Yokohama, Japan, 28 July–2 August 2019; pp. 5538–5540. [Google Scholar]
  46. USGS EROS. Landsat Play Major Roles in Development of CEOS CARD4L. Available online: https://www.usgs.gov/center-news/usgs-eros-landsat-play-major-roles-development-ceos-card4l (accessed on 25 November 2020).
Figure 1. Work flow of the validation of KOMPSAT-3A images and comparison experiments with Landsat-8 Analysis Ready Data (ARD).
Remotesensing 12 03971 g001
Figure 2. Comparison between the RadCalNet data from the RVUS site and the KOMPSAT-3A reflectance products: (a) Top-of-Atmosphere (TOA) and (b) Top-of-Canopy (TOC) reflectance data, both collected between 2 December 2016 and 4 May 2018.
Remotesensing 12 03971 g002
Figure 3. Comparison between the RadCalNet BTCN data and the KOMPSAT-3A reflectance product: (a) TOA and (b) TOC reflectance products for 31 October 2016, 5 August 2017, and 30 November 2018.
Remotesensing 12 03971 g003
Figure 4. Comparison between the data from the RadCalNet LCFR site and the KOMPSAT-3A reflectance products: (a) TOA (b) TOC reflectance products for 10 August 2016 and 25 February 2019.
Remotesensing 12 03971 g004
Figure 5. Canberra region, Australia (covered by KOMPSAT-3A on 7 February 2016) and AERONET measurement station on OpenStreetMap (OSM).
Remotesensing 12 03971 g005
Figure 6. Vegetation indices obtained from the surface reflectance product of Landsat-8 in the Google Earth Engine (GEE): (a) Atmospherically Resistant Vegetation Index (ARVI); (b) Structure Insensitive Pigment Index (SIPI).
Remotesensing 12 03971 g006
Figure 7. Vegetation indices obtained from the surface reflectance product of a KOMPSAT-3A image and AERONET data: (a) ARVI; (b) SIPI.
Remotesensing 12 03971 g007
Table 1. KOMPSAT-3A TOA and TOC reflectance products and RadCalNet data from the RVUS site collected between 2 December 2016 and 4 May 2018.
DateBandTOA Reflectance
Range in the RadCalNet Output
TOA Reflectance
Value of KOMPSAT-3A
TOC Reflectance
Range in the RadCalNet Input
TOC Reflectance
Value of KOMPSAT-3A
2 December 2016Blue0.2373–0.24450.21000.1841–0.23350.1700
Green0.2475–0.26210.22000.2439–0.29000.2000
Red0.2677–0.2909a0.2600a0.2930–0.31180.2700
NIR0.2619–0.33270.29000.3310–0.3376c0.3100c
4 May 2018Blue0.2912–0.32040.25000.2610–0.32300.2300
Green0.3256–0.3446b0.2800b0.3350–0.3859d0.2600d
Red0.3568–0.38750.33000.3912–0.41140.3300
NIR0.3428–0.41940.35000.4246–0.43130.3800
The letters (i.e., a, b, c, and d) beside the underlined values denote the minimum difference in TOA reflectance, the maximum difference in TOA reflectance, the minimum difference in TOC reflectance, and the maximum difference in TOC reflectance, respectively (absolute values).
Table 2. KOMPSAT-3A TOA and TOC reflectance products and RadCalNet BTCN data for 31 October 2016, 5 August 2017, and 30 November 2018.
DateBandTOA Reflectance
Range in the RadCalNet Output
TOA Reflectance
Value of KOMPSAT-3A
TOC Reflectance
Range in the RadCalNet Input
TOC Reflectance
Value of KOMPSAT-3A
31 October 2016Blue0.1700–0.18250.21000.1099–0.14160.1500
Green0.1574–0.16810.19000.1453–0.15830.1500
Red0.1524–0.16200.21000.1563–0.15850.2100
NIR0.1283–0.1574b0.2200b0.1391–0.1545d0.2300d
5 August 2017Blue0.1758–0.18010.21000.1191–0.15760.1700
Green0.1812–0.18600.21000.1630–0.1910c0.1800c
Red0.1887–0.20120.23000.1964–0.20100.2300
NIR0.1532–0.20290.24000.1904–0.20620.2600
30 November 2018Blue0.1915–0.19750.17000.1225–0.16560.1100
Green0.1855–0.19080.15000.1714–0.19860.1200
Red0.1881–0.20090.18000.2006–0.20240.1800
NIR0.1562–0.1985a0.1900a0.1757–0.20040.2000
The letters (i.e., a, b, c, and d) beside the underlined values denote the minimum difference in TOA reflectance, the maximum difference in TOA reflectance, the minimum difference in TOC reflectance, and the maximum difference in TOC reflectance, respectively (absolute values).
Table 3. KOMPSAT-3A TOA and TOC reflectance products and data from the RadCalNet LCFR site for 10 August 2016 and 25 February 2019.
DateBandTOA Reflectance
Range in the RadCalNet Output
TOA Reflectance
Value of KOMPSAT-3A
TOC Reflectance
Range in the RadCalNet Input
TOC Reflectance
Value of KOMPSAT-3A
10 August 2016Blue0.1447–0.14960.13000.0813–0.11740.0700
Green0.1481–0.17190.13000.1240–0.17650.1000
Red0.1857–0.20780.17000.1916–0.21510.1600
NIR0.2058–0.2874b0.2200b0.2542–0.29160.2600
25 Febuary 2019Blue0.1132–0.14080.13000.0399–0.05880.0600
Green0.1102–0.1122a0.1100a0.0636–0.09340.0700
Red0.1116–0.11490.11000.0966–0.1080c0.1000c
NIR0.1566–0.22050.22000.1963–0.2271d0.2700d
The letters (i.e., a, b, c, and d) beside the underlined values denote the minimum difference in TOA reflectance, the maximum difference in TOA reflectance, the minimum difference in TOC reflectance, and the maximum difference in TOC reflectance, respectively (absolute values).
Publisher’s Note: MDPI stays neutral with regard to jurisdictional claims in published maps and institutional affiliations.

