Application of Reflectance Ratios on High-Resolution Satellite Imagery to Remotely Identify Eucalypt Vegetation


Abstract
:
1. Introduction
1.1. Satellite Selection
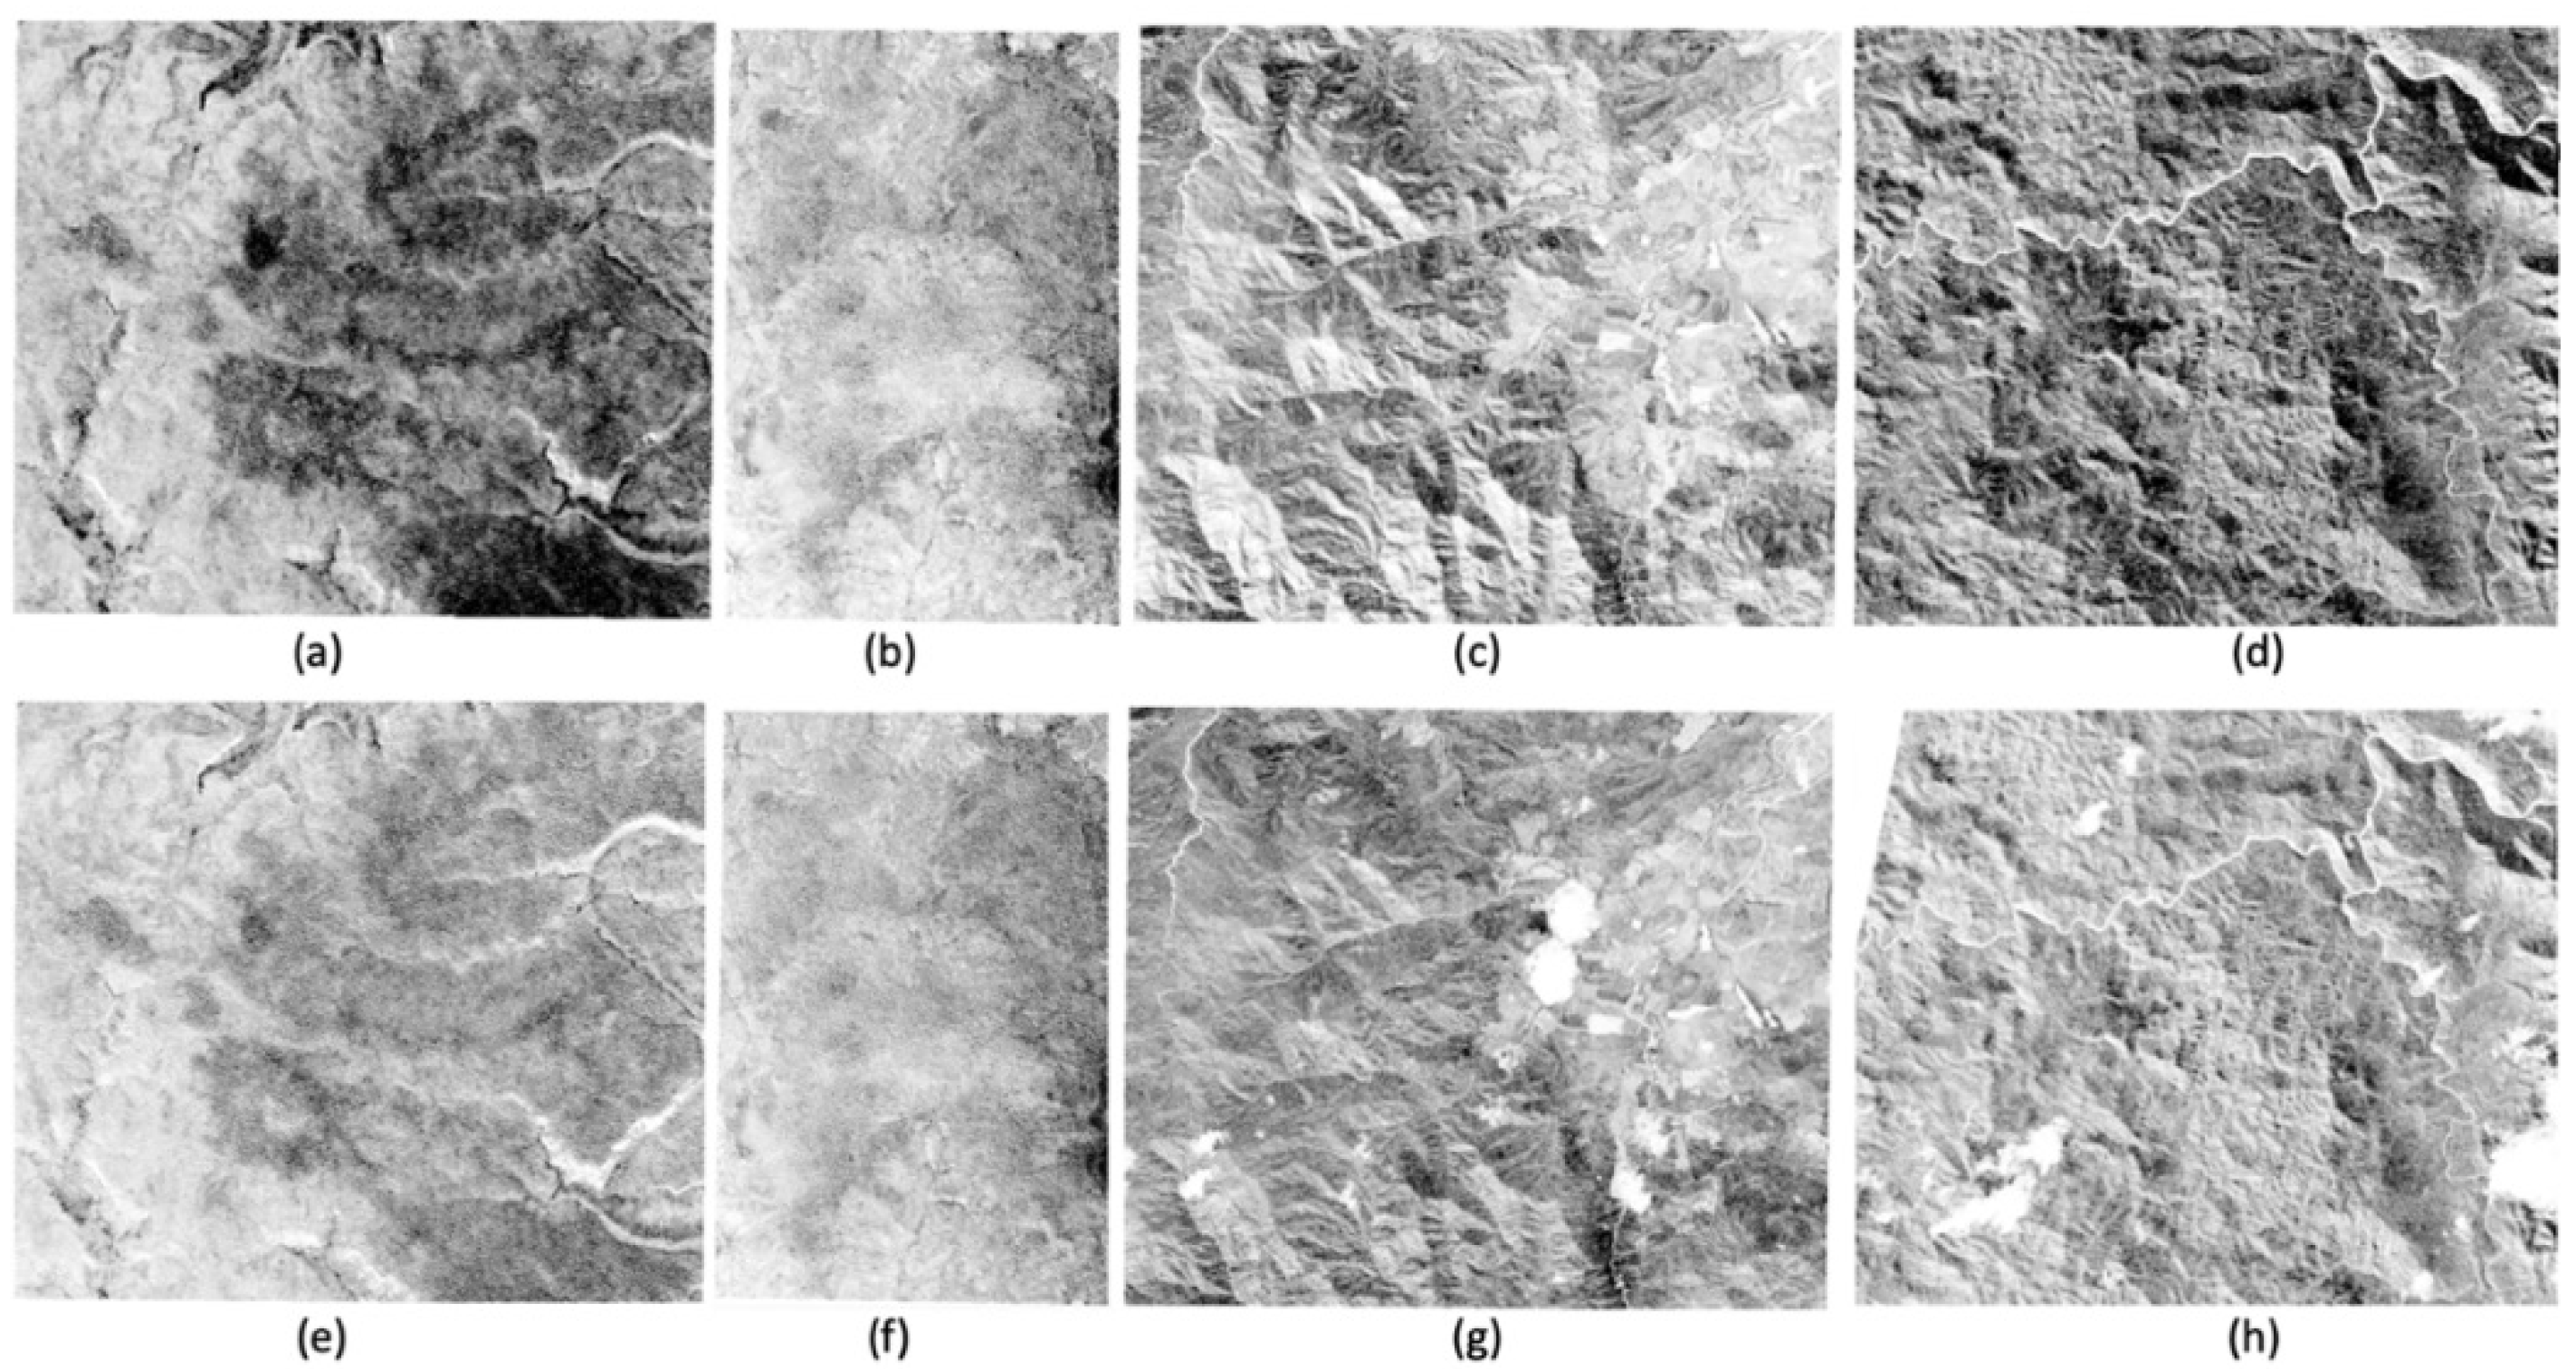
1.2. Area of Study
2. Materials and Methods
3. Results
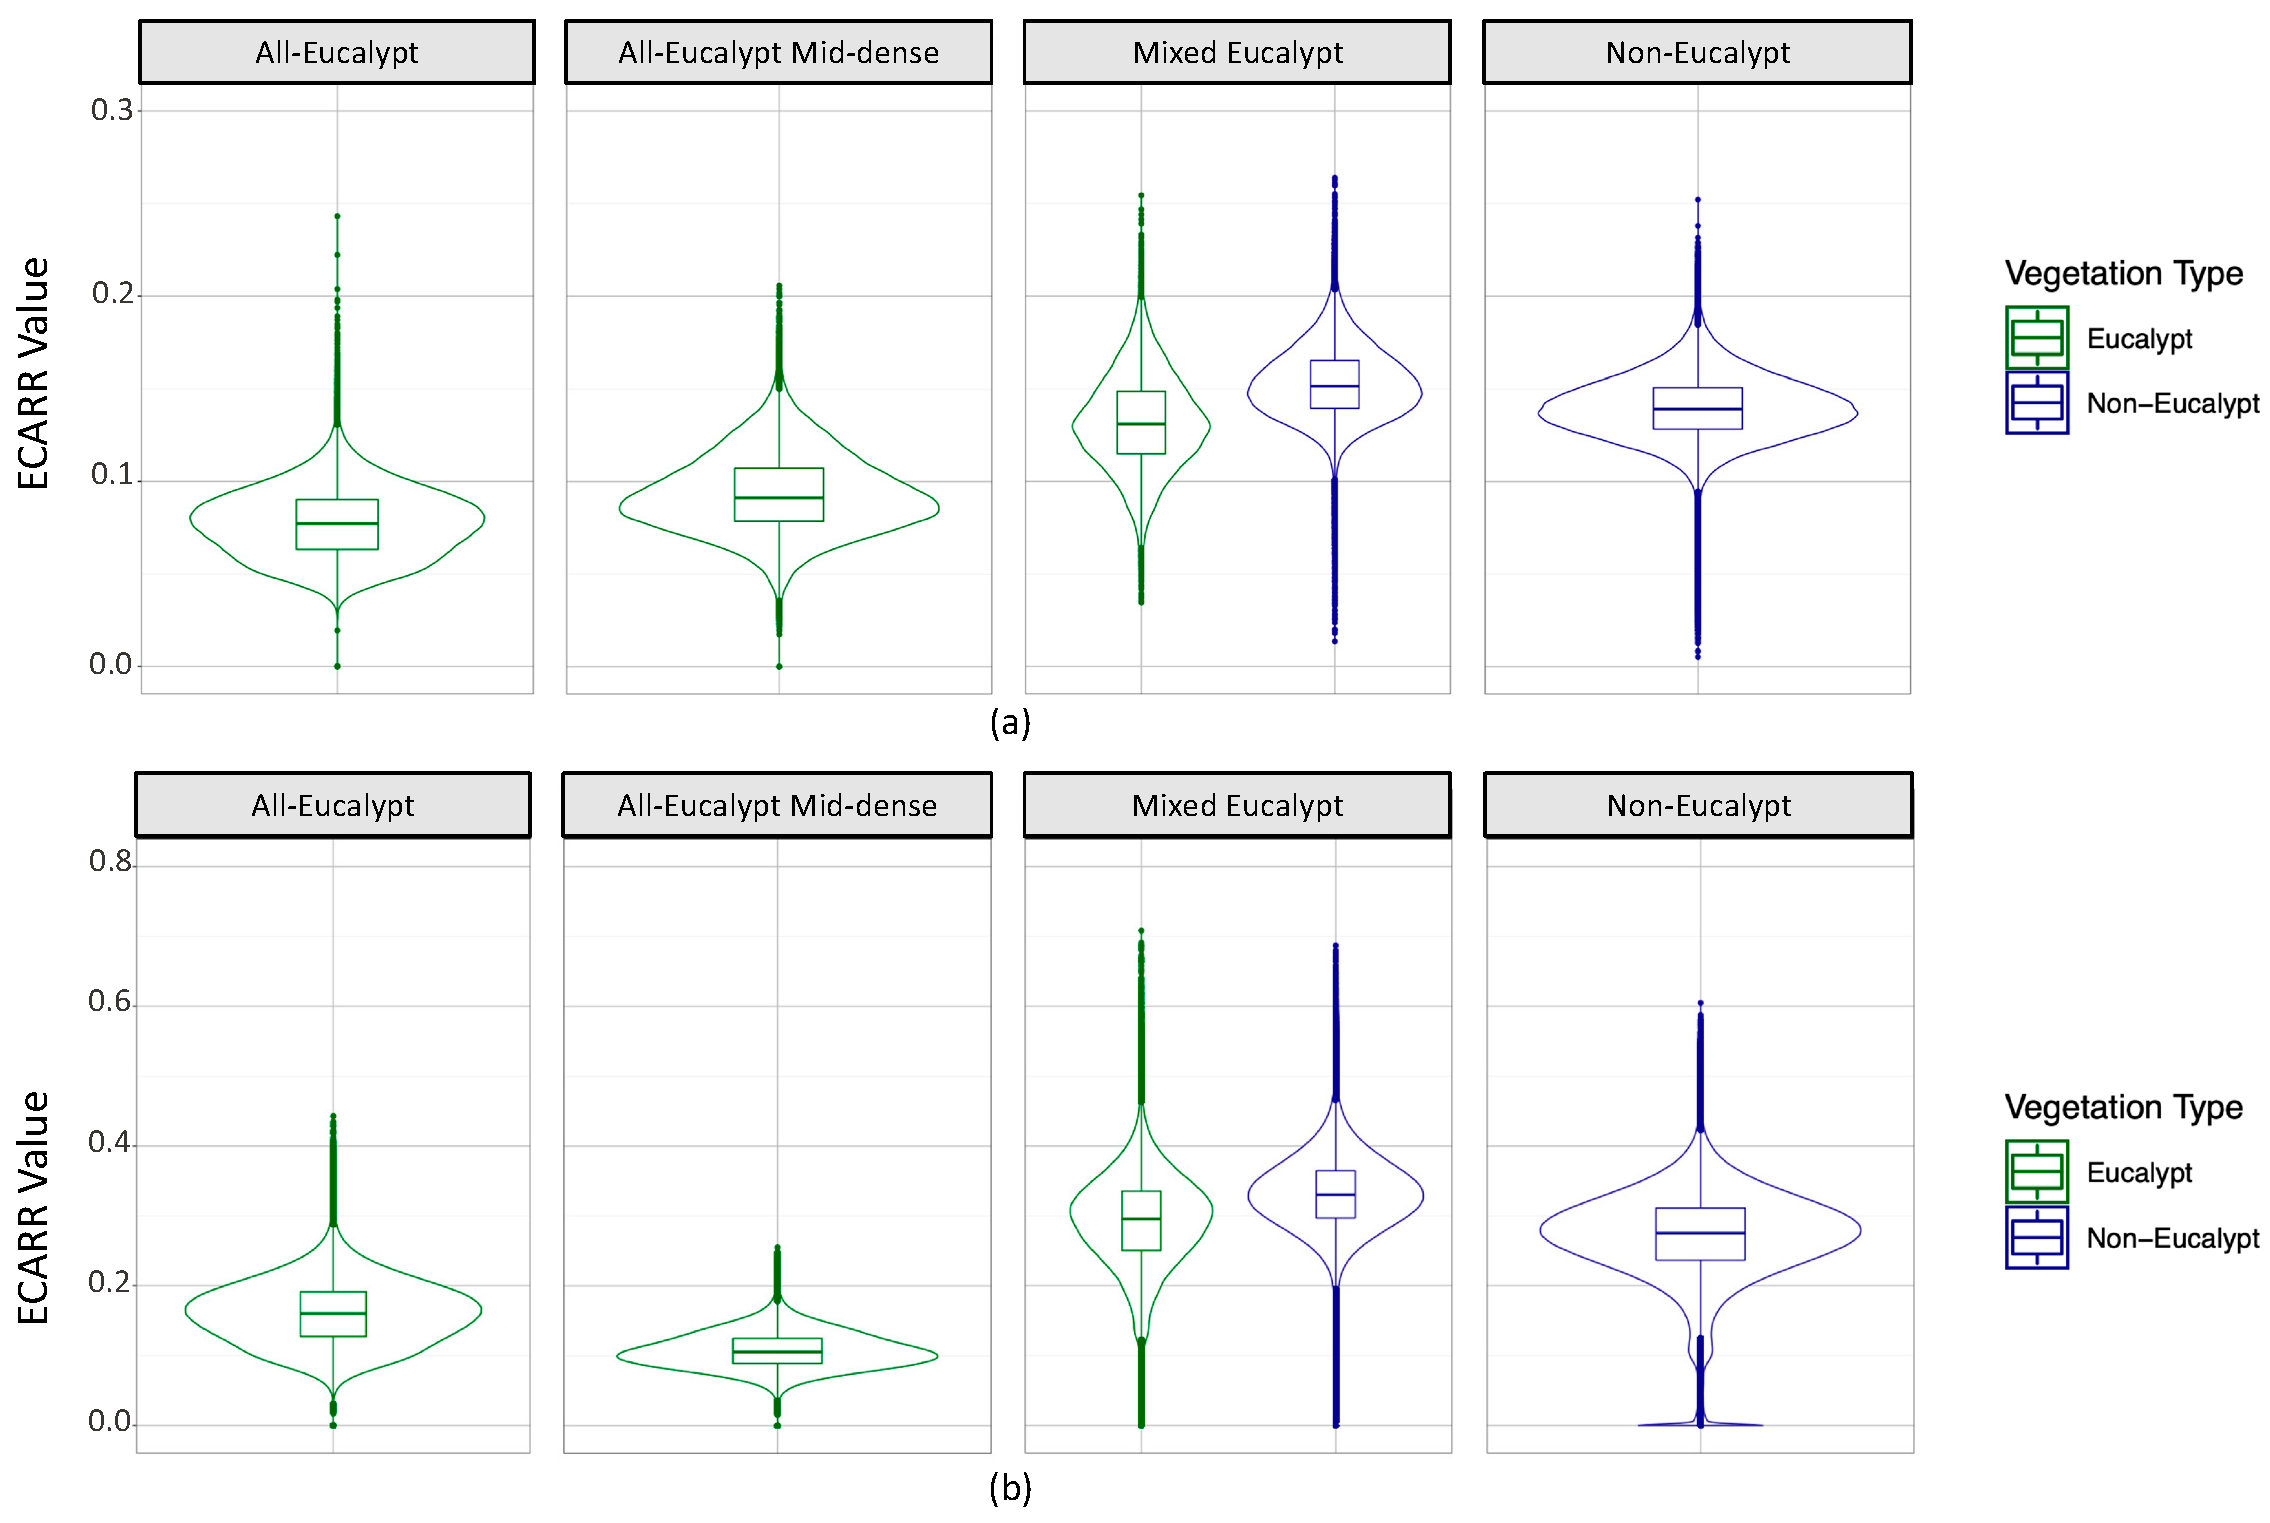
3.1. ECARR Results
3.2. ECBRR Results
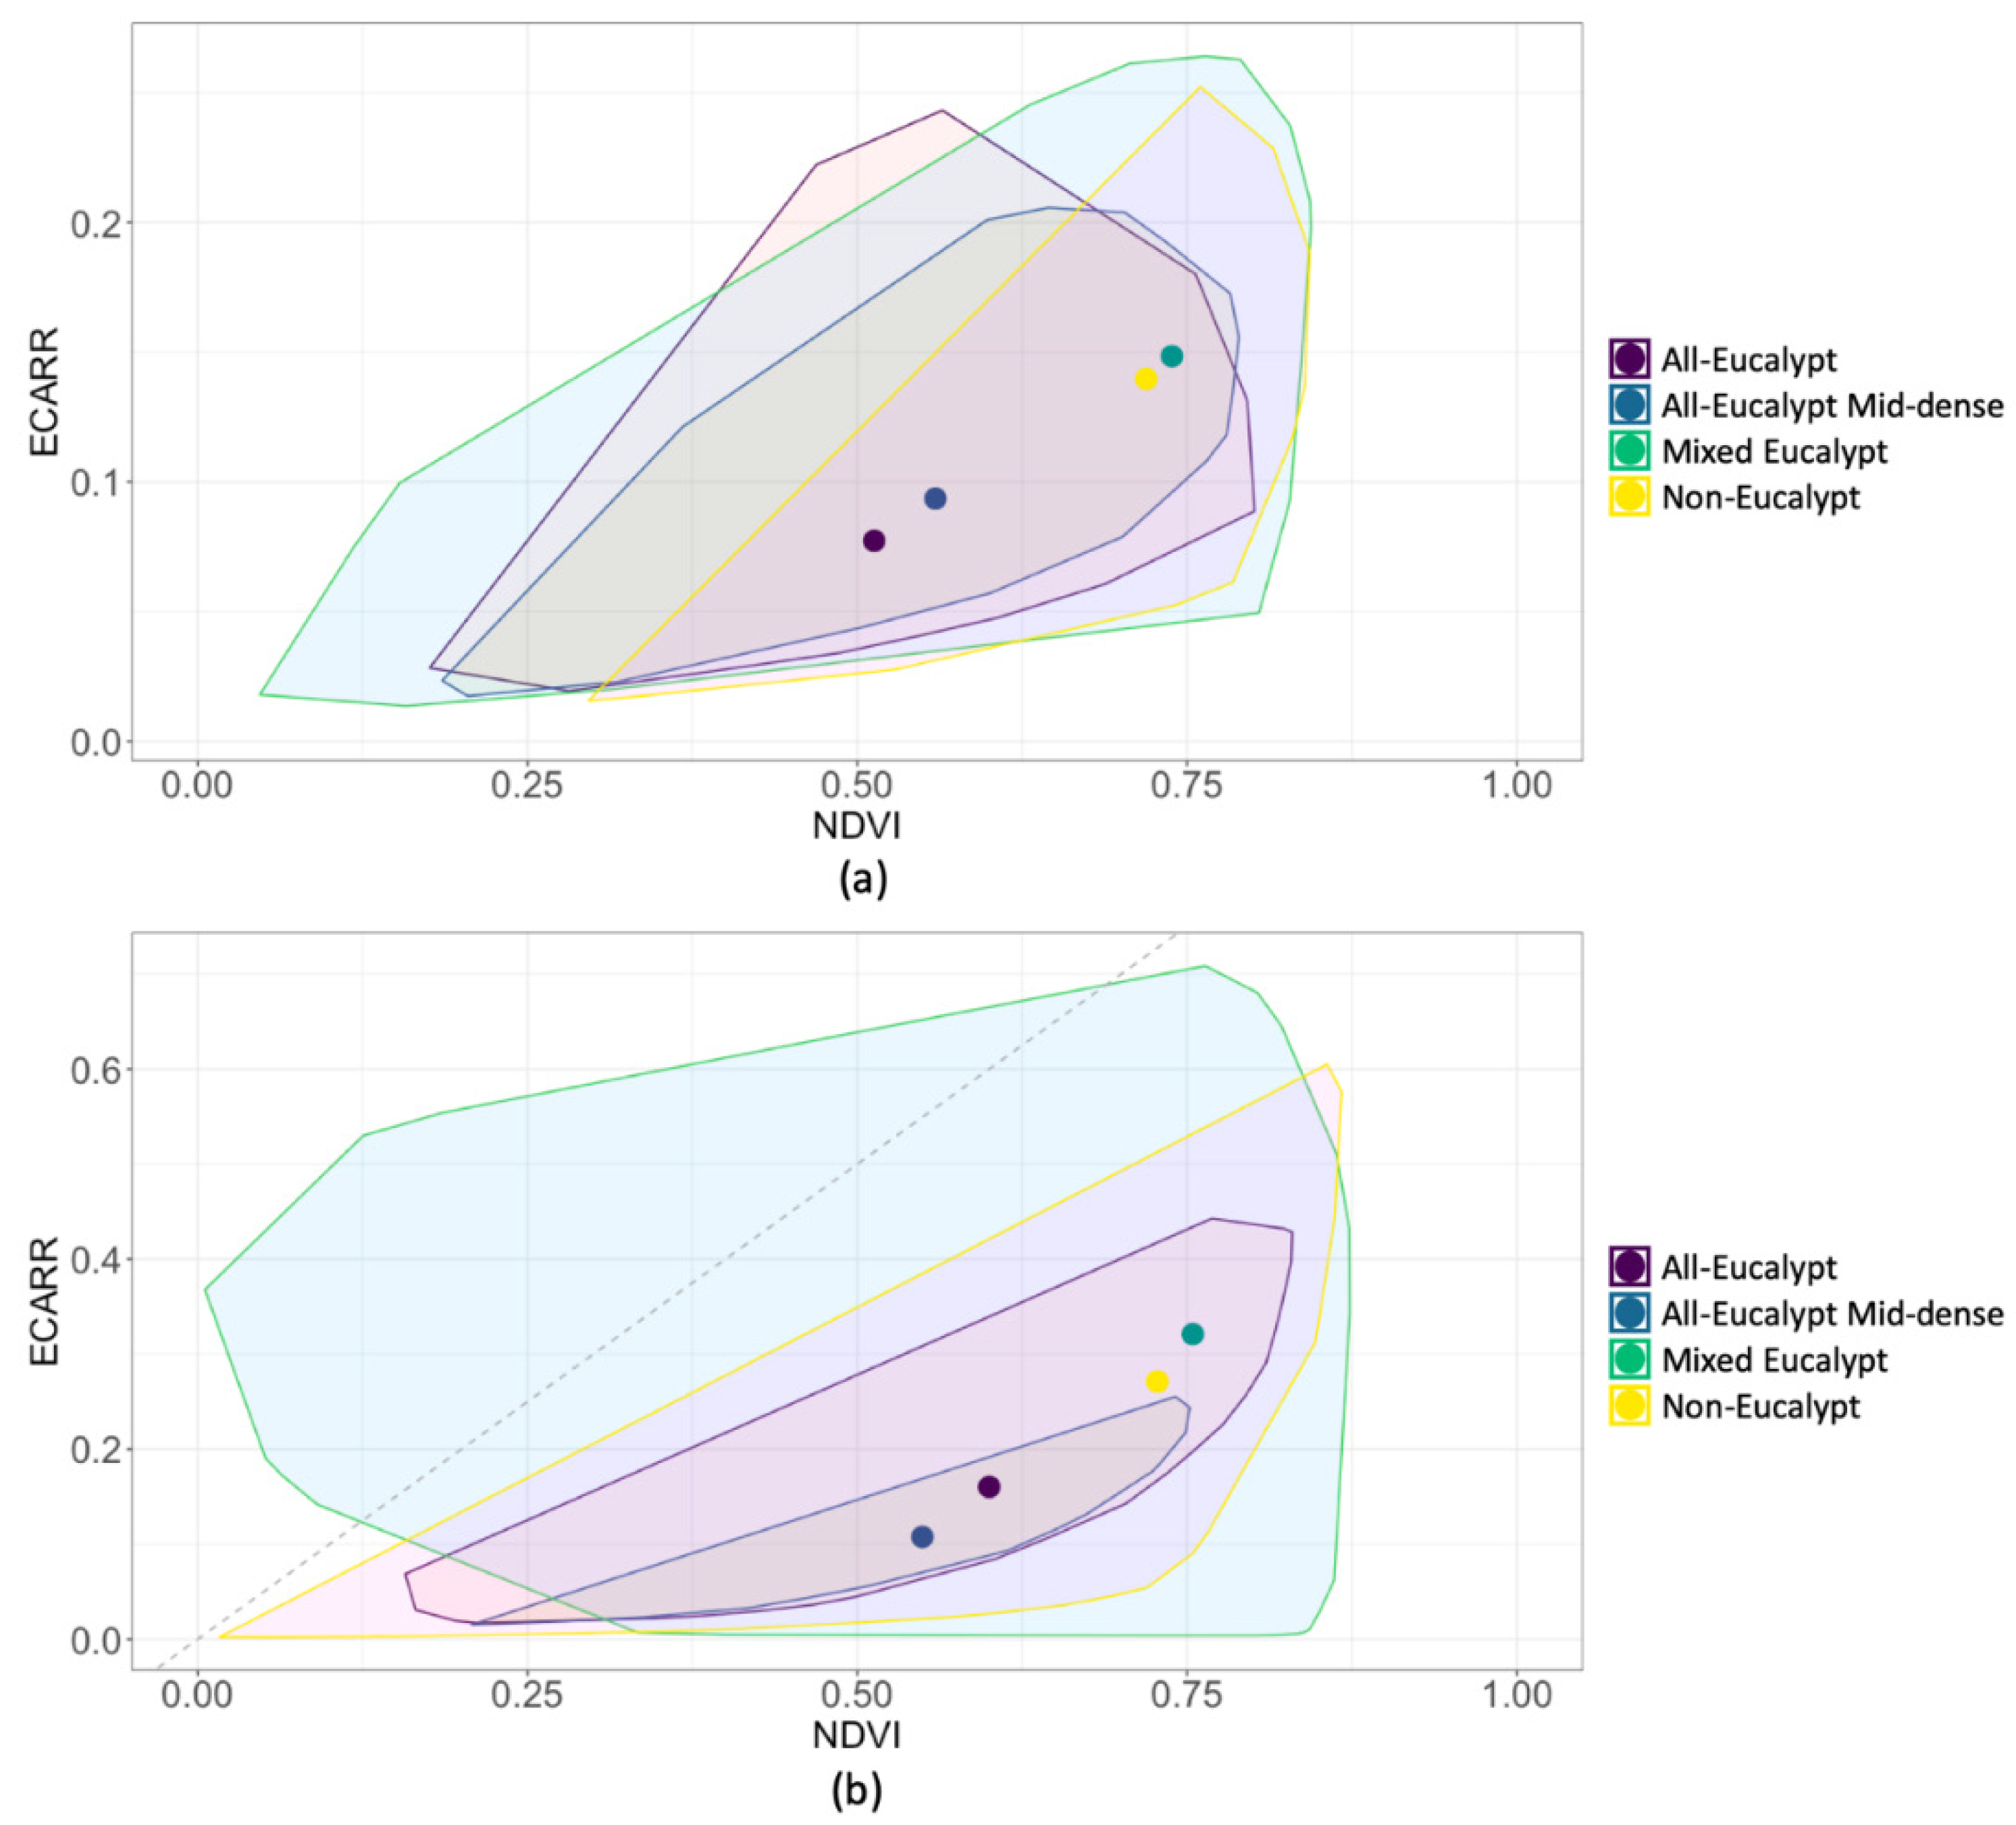
3.3. NDVI Results
4. Discussion
4.1. Eucalypt Chlorophyll-a Reflectance Ratio (ECARR)
4.2. Eucalypt Chlorophyll-b Reflectance Ratio (ECBRR)
4.3. Normalized Difference Vegetation Index (NDVI)
5. Conclusions
Supplementary Materials
Author Contributions
Funding
Conflicts of Interest
References
- Díaz, S.; Fargione, J.; Chapin, F.S.; Tilman, D. Biodiversity loss threatens human well-being. PLoS Biol. 2006, 4, 1300–1305. [Google Scholar] [CrossRef] [PubMed] [Green Version]
- Chapin, F.S.; Zavaleta, E.S.; Eviner, V.T.; Naylor, R.L.; Vitousek, P.M.; Reynolds, H.L.; Hooper, D.U.; Lavorel, S.; Sala, O.E.; Hobbie, S.E.; et al. Consequences of changing biodiversity. Nature 2000, 405, 234–242. [Google Scholar] [CrossRef] [PubMed]
- Gamfeldt, L.; Hillebrand, H.; Jonsson, P.R. Multiple Functions Increase the Importance of Biodiversity for Overall Ecosystem Functioning. Ecology 2008, 89, 1223–1231. [Google Scholar] [CrossRef] [PubMed]
- Sturrock, R.N.; Frankel, S.J.; Brown, A.V.; Hennon, P.E.; Kliejunas, J.T.; Lewis, K.J.; Worrall, J.J.; Woods, A.J. Climate change and forest diseases. Plant. Pathol. 2011, 60, 133–149. [Google Scholar] [CrossRef]
- Chornesky, E.A.; Bartuska, A.M.; Aplet, G.H.; Britton, K.O.; Cummings-Carlson, J.; Davis, F.W.; Eskow, J.; Grodon, D.R.; Gottschalk, K.W.; Haack, R.A.; et al. Science Priorities for Reducing the Threat of Invasive Species to Sustainable Forestry. Bioscience 2005, 55, 335. [Google Scholar] [CrossRef] [Green Version]
- Cahill, A.E.; Aiello-Lammens, M.E.; Caitlin Fisher-Reid, M.; Hua, X.; Karanewsky, C.J.; Ryu, H.Y.; Sbeglia, G.C.; Spagnolo, F.; Waldron, J.B.; Wiens, J.J. Causes of warm-edge range limits: Systematic review, proximate factors and implications for climate change. J. Biogeogr. 2014, 41, 429–442. [Google Scholar] [CrossRef]
- Pecl, G.T.; Araújo, M.B.; Bell, J.D.; Blanchard, J.; Bonebrake, T.C.; Chen, I.-C.; Clark, T.D.; Colwell, R.K.; Danielsen, F.; Evengård, B.; et al. Biodiversity redistribution under climate change: {Impacts} on ecosystems and human well-being. Science 2017, 355, eaai9214. [Google Scholar] [CrossRef] [PubMed]
- Brook, B.W.; O’Grady, J.J.; Chapman, A.P.; Burgman, M.A.; Resit Akçakaya, H.; Frankham, R. Predictive accuracy of population viability analysis in conservation biology. Nature 2000, 404, 385–387. [Google Scholar] [CrossRef] [PubMed]
- Ehrlén, J.; Morris, W.F. Predicting changes in the distribution and abundance of species under environmental change. Ecol. Lett. 2015, 18, 303–314. [Google Scholar] [CrossRef] [PubMed]
- Queensland Government. Queensland Herbarium Regional Ecosystem Description Database (REDD). Version 11.1 (April 2019); Queensland Government: Brisbane, Australia, 2019.
- Neldner, V.J.; Wilson, B.A.; Dillewaard, H.A.; Ryan, T.S.; Butler, D.W.; McDonald, W.J.F.; Addicott, E.P.; Appelman, C.N. Methodology for Survey and Mapping of Regional Ecosystems and Vegetation Communities in Queensland. Version 5.0., Updated March 2019; Queensland Government: Brisbane, Australia, 2019.
- Herold, M.; Mayaux, P.; Woodcock, C.E.; Baccini, A.; Schmullius, C. Some challenges in global land cover mapping: An assessment of agreement and accuracy in existing 1 km datasets. Remote Sens. Environ. 2008, 112, 2538–2556. [Google Scholar] [CrossRef]
- NASA Normalized Difference Vegetation Index (NDVI). Available online: https://earthobservatory.nasa.gov/features/MeasuringVegetation/measuring_vegetation_2.php (accessed on 20 December 2019).
- Datt, B. Remote sensing of chlorophyll a, chlorophyll b, chlorophyll a+b, and total carotenoid content in eucalyptus leaves. Remote Sens. Environ. 1998, 66, 111–121. [Google Scholar] [CrossRef]
- Coops, N.C.; Stone, C.; Culvenor, D.S.; Chisholm, L.A.; Merton, R.N. Chlorophyll content in eucalypt vegetation at the leaf and canopy scales as derived from high resolution spectral data. Tree Physiol. 2003, 23, 23–31. [Google Scholar] [CrossRef] [PubMed] [Green Version]
- Giles, J.R.; Plowright, R.K.; Peel, A.J.; Eby, P.; McCallum, H. Models of Eucalypt phenology predict bat population flux. Ecol. Evol. 2016, 6, 7230–7245. [Google Scholar] [CrossRef] [PubMed]
- Giles, J.R.; Eby, P.; Parry, H.; Peel, A.J.; Plowright, R.K.; Westcott, D.A.; McCallum, H. Environmental drivers of spatiotemporal foraging intensity in fruit bats and implications for Hendra virus ecology. Sci. Rep. 2018, 8, 9555. [Google Scholar] [CrossRef] [PubMed]
- Datt, B. A new reflectance index for remote sensing of chlorophyll content in higher plants: Tests using Eucalyptus leaves. J. Plant. Physiol. 1999, 154, 30–36. [Google Scholar] [CrossRef]
- Laperra, V.; Santos-Rodriguez, R. Spatial/Spectral Information Trade-off in Hyperspectral Images. In Proceedings of the 2015 IEEE International Geoscience and Remote Sensing Symposium (IGARSS), Milan, Italy, 26–31 July 2015; pp. 1124–1127. [Google Scholar]
- European Space Agency MultiSpetral Instrument (MSI) Overview. Available online: https://sentinel.esa.int/web/sentinel/technical-guides/sentinel-2-msi/msi-instrument (accessed on 21 December 2019).
- Planet Team Planet Application Program Interface: In Space for Life on Earth. Available online: https://developers.planet.com/docs/data/ (accessed on 22 December 2019).
- Planet Team Understanding PlanetScope Instruments. Available online: https://developers.planet.com/docs/data/sensors/ (accessed on 21 December 2019).
- USGS Earth Explorer. Available online: https://earthexplorer.usgs.gov/ (accessed on 2 November 2019).
- Planet Team Planet Explorer. Available online: https://www.planet.com/explorer/ (accessed on 22 September 2019).
- ESRI. ArcGIS Pro, Version 2.5; ESRI: Redlands, CA, USA, 2020. [Google Scholar]
- R Core Team. R: A Language and Environment for Statistical Computing; R Foundation for Statistical Computing: Vienna, Austria, 2019. [Google Scholar]
- Bureau of Meteorology. Special Climate Statements 72—Dangerous Bushfire Weather in Spring 2019; BOM: Melbourne, Australia, 2019; p. 28.
- Bradshaw, C.J.A. Little left to lose: Deforestation and forest degradation in Australia since European colonization. J. Plant. Ecol. 2012, 5, 109–120. [Google Scholar] [CrossRef]
- Greaves, B.L.; Spencer, R.D. An evaluation of spectroradiometry and multispectral scanning for differentiating forest communities. Aust. For. 1993, 56, 68–79. [Google Scholar] [CrossRef]


| Band | Spectral Range (nm) | Approximate Center Wavelength (nm) | Spatial Resolution |
|---|---|---|---|
| Band 1 | 464–517 | 490 | 3 m |
| Band 2 | 547–585 | 566 | 3 m |
| Band 3 | 650–682 | 666 | 3 m |
| Band 4 | 846–888 | 867 | 3 m |
| Band | Center Wavelength (nm) Sentinel-2A | Center Wavelength (nm) Sentinel-2B | Spatial Resolution |
|---|---|---|---|
| Band 3 | 559.8 | 559.0 | 10m |
| Band 4 | 664.6 | 664.9 | 10m |
| Band 5 | 704.1 | 703.8 | 10m |
| Band 8 | 832.8 | 832.9 | 10m |
| Band 8A | 864.7 | 864 | 20m |
| Bounding Box Coordinates | Winter Imagery Date | Spring/Summer Imagery Date | ||||
|---|---|---|---|---|---|---|
| Site | Upper Right Coordinate | Lower Left Coordinate | Planet PS2.SD | Sentinel-2 | Planet PS2.SD | Sentinel-2 |
| Large All-Eucalypt | −24.895, 148.193 | −24.980, 148.082 | 7 May 2019 | 1 April 2019 | * 15 November 2019 | 1 January 2019 |
| All-Eucalypt Mid-dense | −23.786, 149.074 | −23.880, 149.008 | 17 May 2019 | 6 May 2019 | ||
| Mixed Eucalypt | −20.982, 148.759 | −21.072, 148.655 | 7 May 2019 | 12 March 2019 | 8 November 2019 | 2 December 2018 |
| Non-Eucalypt | −17.620, 145.800 | −17.704, 145.699 | * 24 July 2019 | 13 June 2018 | 16 October 2019 | 10 November 2019 |
| Satellite | ECARR Values | Large All-Eucalypt Site | All-Eucalypt Mid-dense Site | Mixed Eucalypt Site | Non-Eucalypt Site |
|---|---|---|---|---|---|
| Sentinel-2 | Maximum | 0.243 | 0.206 | 0.264 | 0.252 |
| Minimum | 0.019 | 0.017 | 0.014 | 0.005 | |
| Mean | 0.077 | 0.094 | 0.148 | 0.140 | |
| Planet | Maximum | 0.443 | 0.255 | 0.708 | 0.605 |
| Minimum | 0.000 | 0.000 | 0.000 | 0.002 | |
| Mean | 0.160 | 0.108 | 0.321 | 0.271 |
| Satellite | ECBRR Value | Large All-Eucalypt Site | All-Eucalypt Mid-Dense Site | Mixed Eucalypt Site | Non-Eucalypt Site |
|---|---|---|---|---|---|
| Sentinel-2 | Maximum | 0.022 | 0.019 | 0.085 | 0.056 |
| Minimum | 0.000 | 0.000 | 0.000 | 0.000 | |
| Mean | 0.002 | 0.003 | 0.013 | 0.009 | |
| Planet | Maximum | 0.021 | 0.012 | 0.050 | 0.055 |
| Minimum | 0.000 | 0.000 | 0.000 | 0.000 | |
| Mean | 0.002 | 0.002 | 0.007 | 0.007 |
| Satellite | NDVI Value | Large All- Eucalypt Site | All-Eucalypt Mid-Dense Site | Mixed Eucalypt Site | Non-Eucalypt Site |
|---|---|---|---|---|---|
| Sentinel-2 | Maximum | 0.801 | 0.789 | 0.844 | 0.843 |
| Minimum | −0.041 | 0.185 | 0.047 | −0.035 | |
| Mean | 0.513 | 0.559 | 0.738 | 0.719 | |
| Planet | Maximum | 0.830 | 0.752 | 0.873 | 0.867 |
| Minimum | 0.157 | 0.208 | 0.005 | −0.101 | |
| Mean | 0.600 | 0.549 | 0.754 | 0.727 |
Publisher’s Note: MDPI stays neutral with regard to jurisdictional claims in published maps and institutional affiliations. |
© 2020 by the authors. Licensee MDPI, Basel, Switzerland. This article is an open access article distributed under the terms and conditions of the Creative Commons Attribution (CC BY) license (http://creativecommons.org/licenses/by/4.0/).
Share and Cite
Baranowski, K.; Taylor, T.; Lambert, B.; Bharti, N. Application of Reflectance Ratios on High-Resolution Satellite Imagery to Remotely Identify Eucalypt Vegetation. Remote Sens. 2020, 12, 4079. https://doi.org/10.3390/rs12244079
Baranowski K, Taylor T, Lambert B, Bharti N. Application of Reflectance Ratios on High-Resolution Satellite Imagery to Remotely Identify Eucalypt Vegetation. Remote Sensing. 2020; 12(24):4079. https://doi.org/10.3390/rs12244079
Chicago/Turabian StyleBaranowski, Kelsee, Teairah Taylor, Brian Lambert, and Nita Bharti. 2020. "Application of Reflectance Ratios on High-Resolution Satellite Imagery to Remotely Identify Eucalypt Vegetation" Remote Sensing 12, no. 24: 4079. https://doi.org/10.3390/rs12244079