A Quantile Approach for Retrieving the “Core Urban-Suburban-Rural” (USR) Structure Based on Nighttime Light
Abstract
:1. Introduction
2. Dataset and Study Area
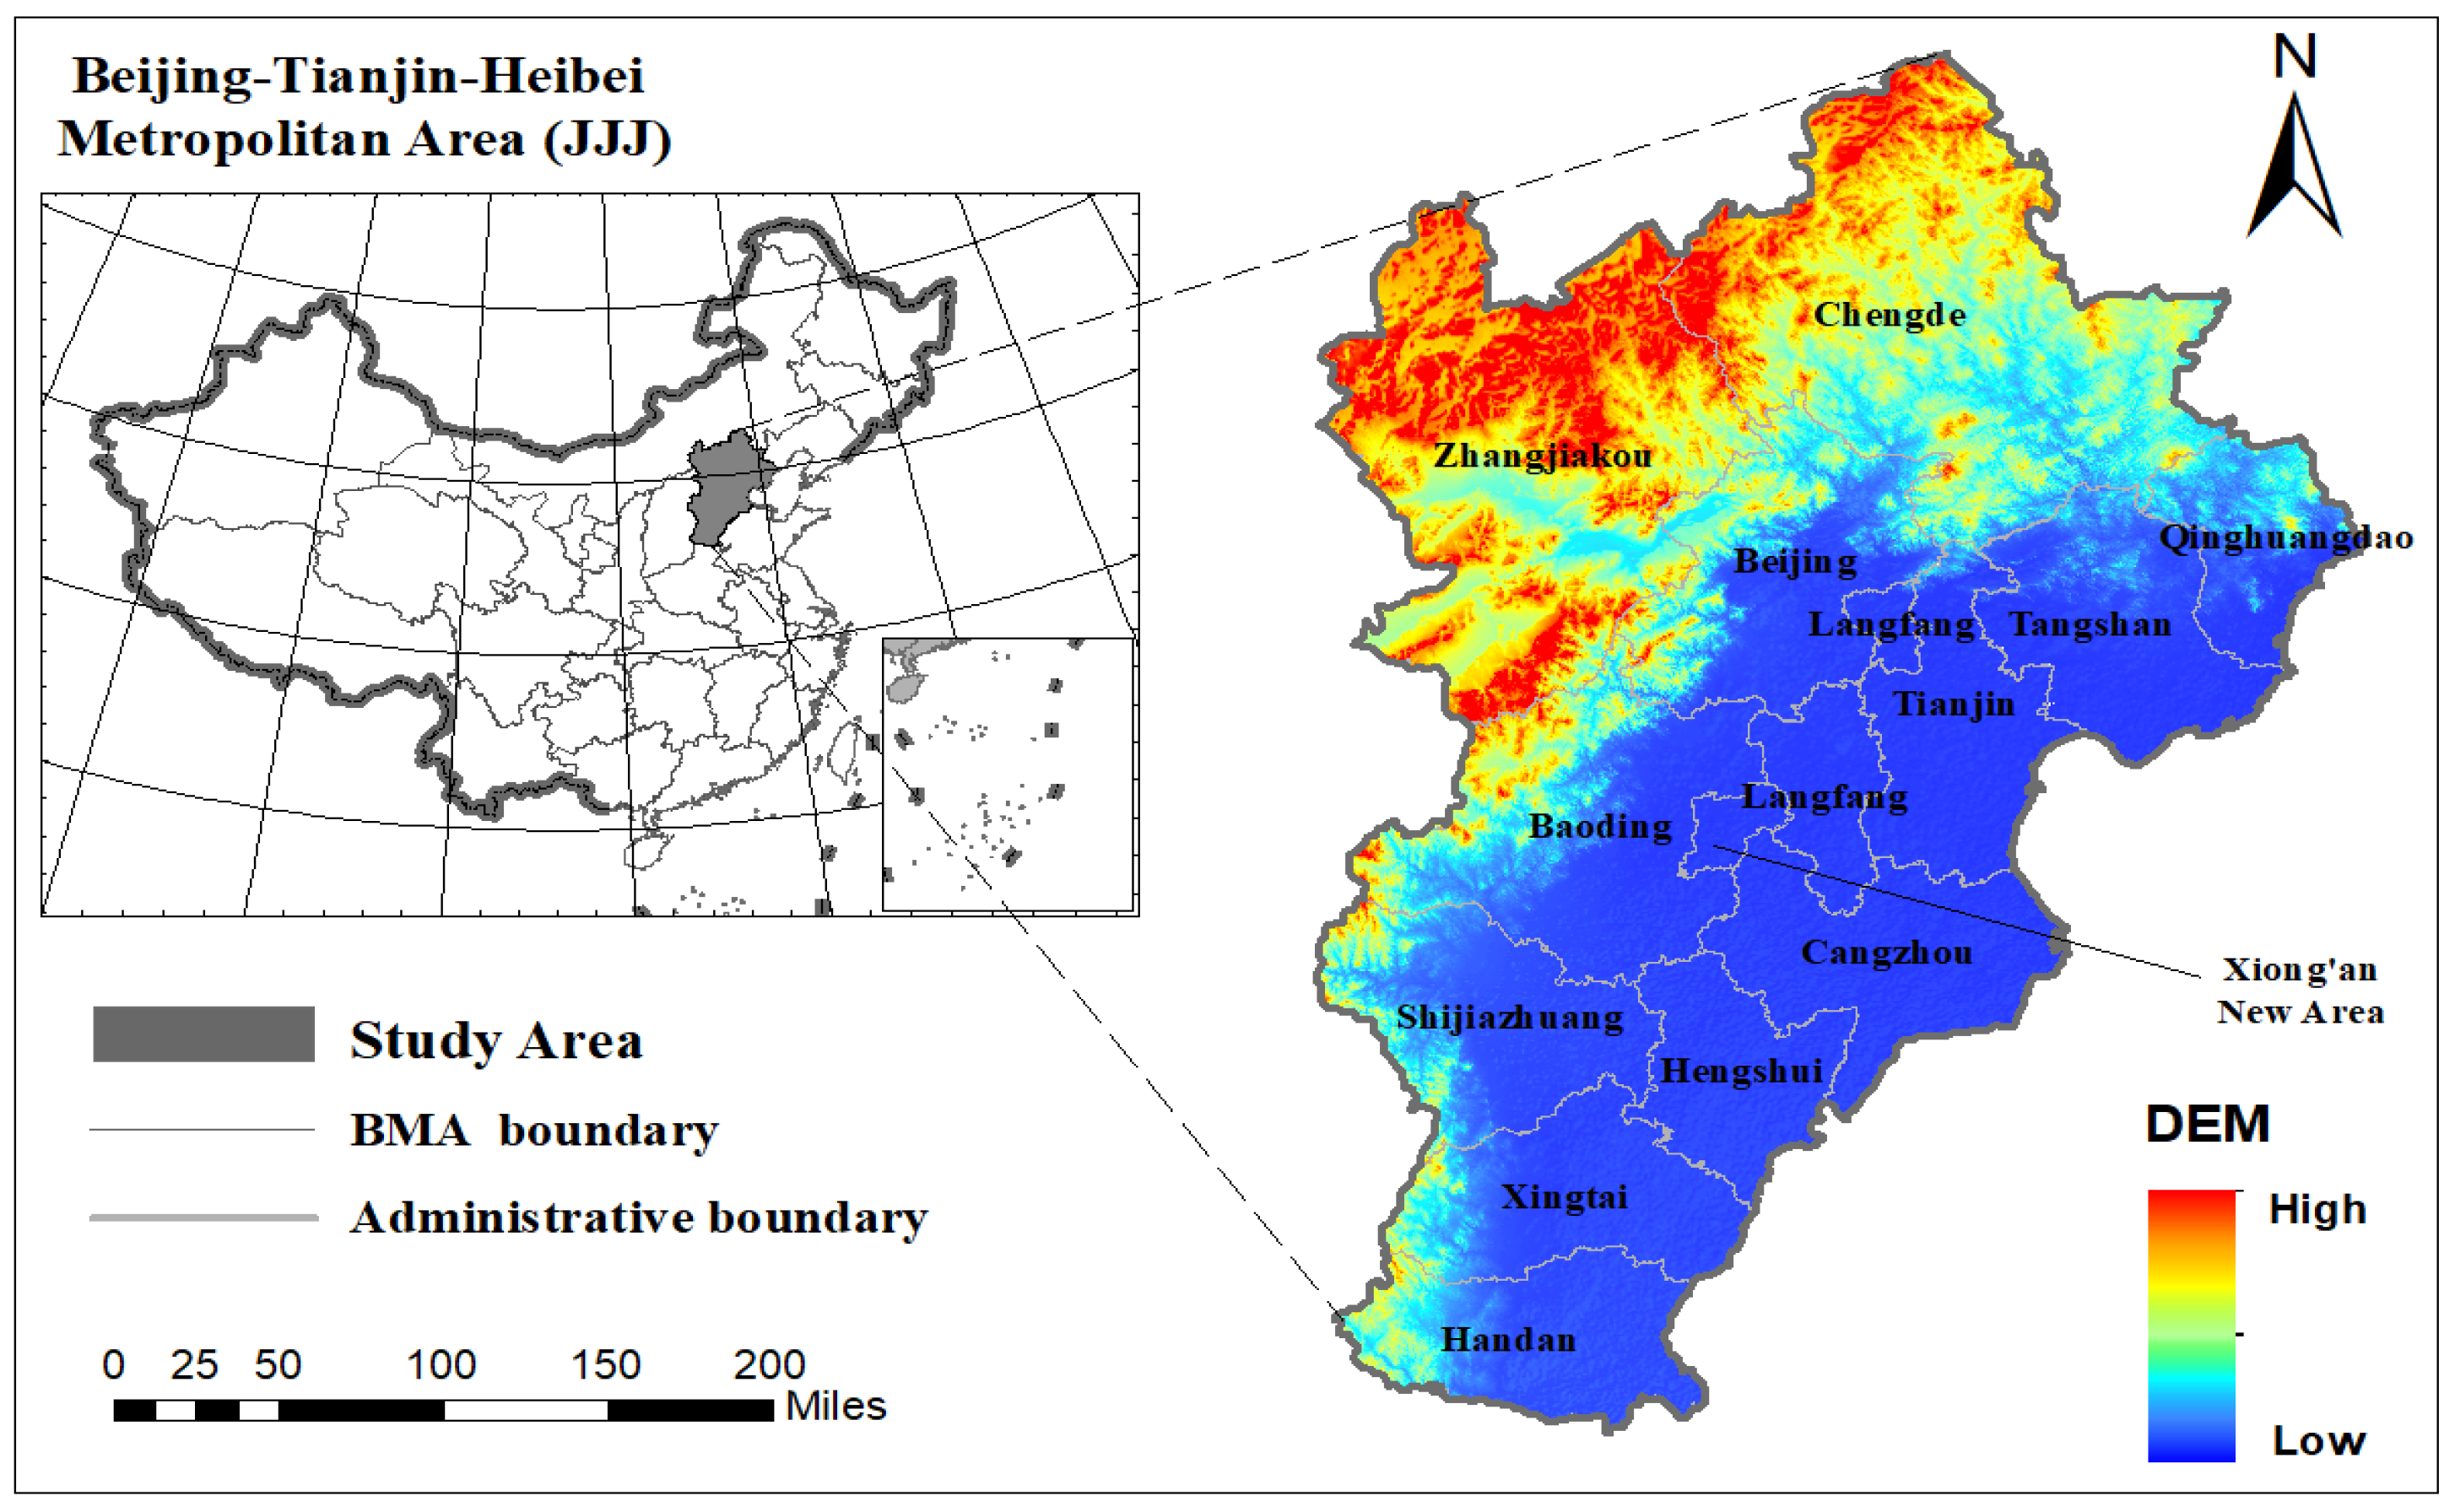
2.1. Study Area
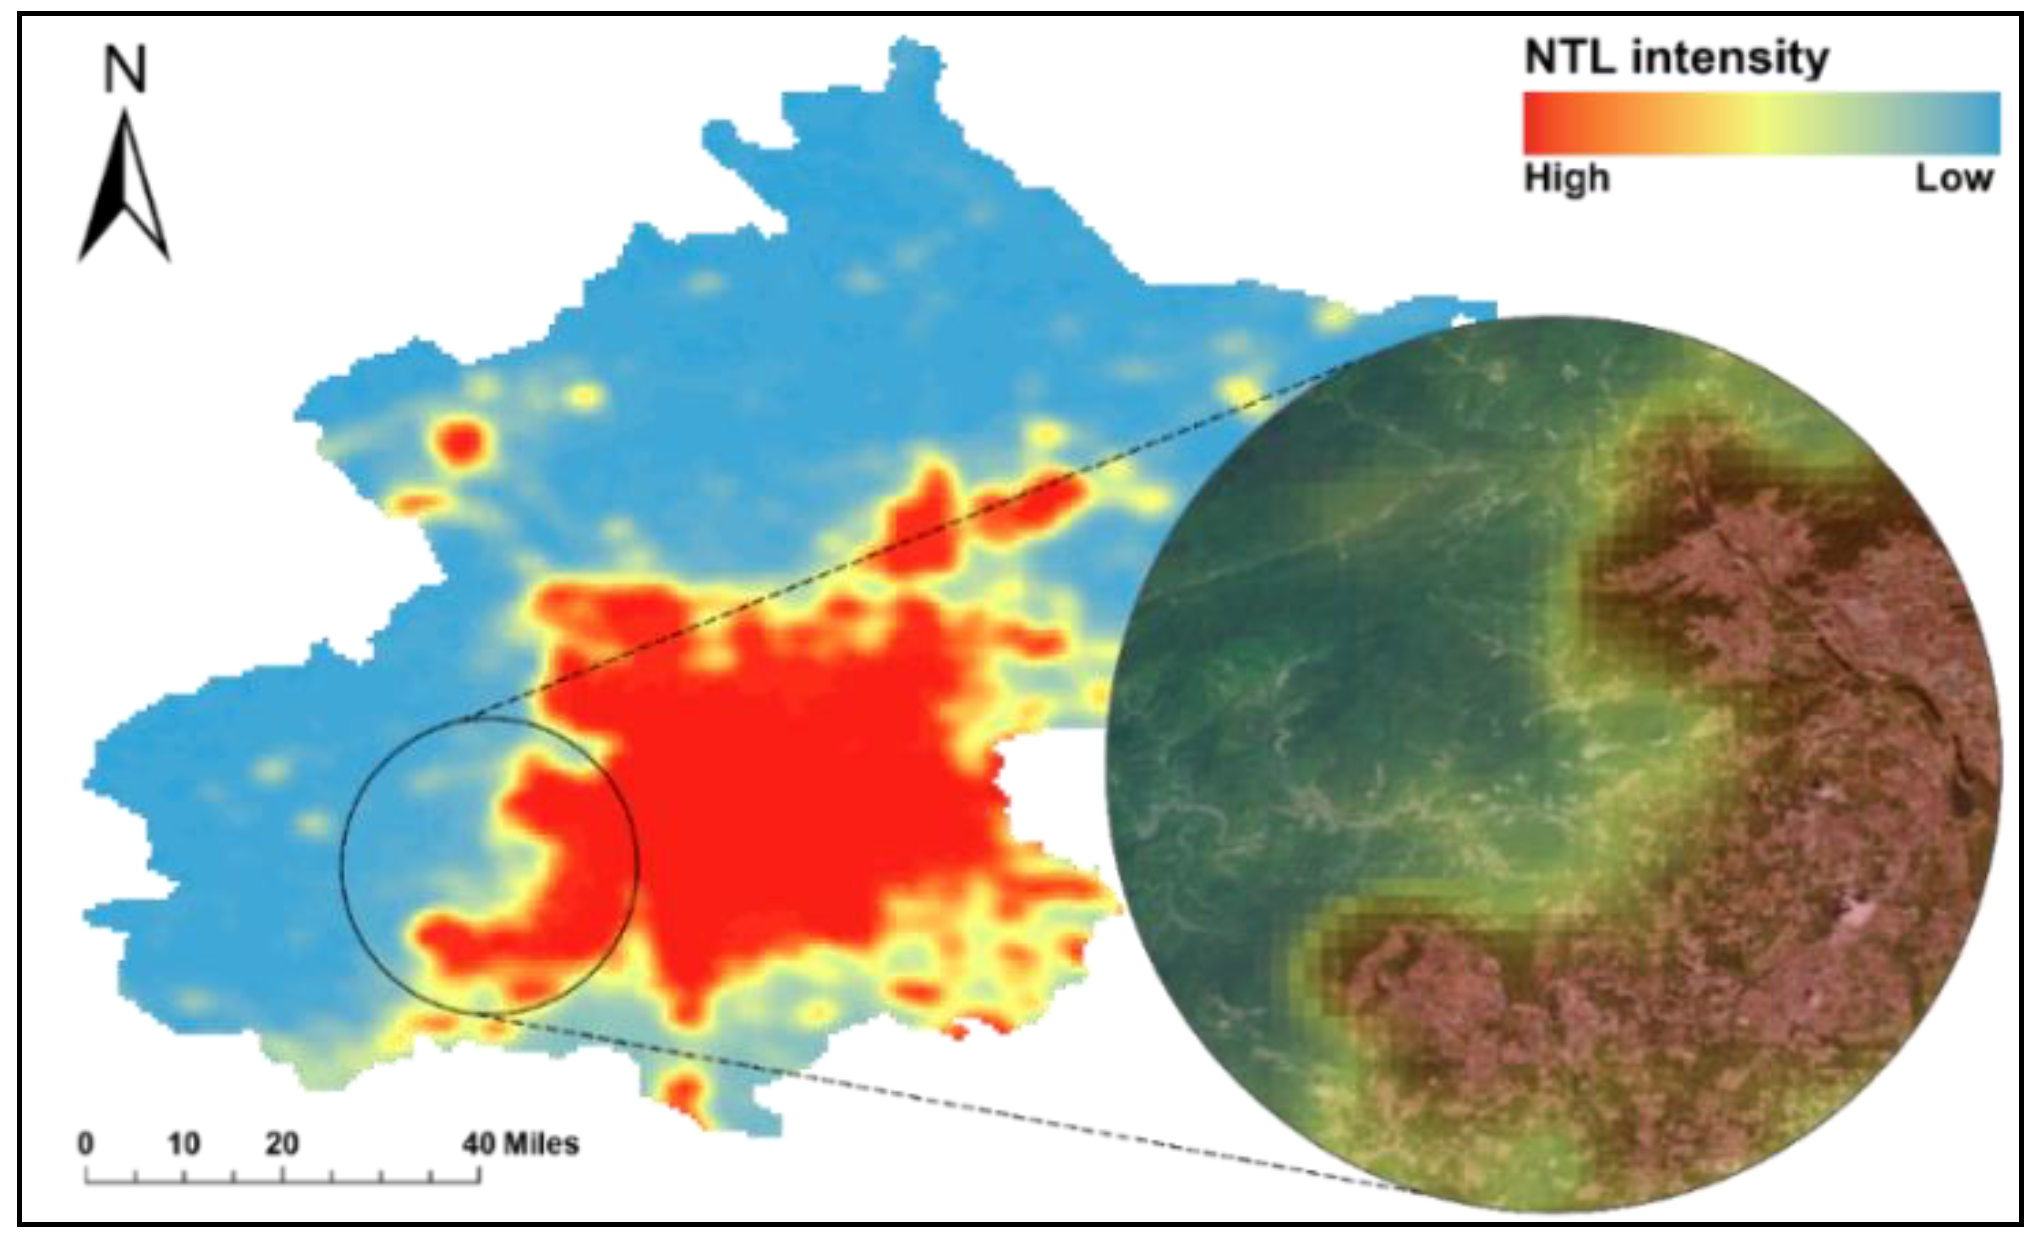
2.2. Dataset Collection and Preprocessing
3. Methods
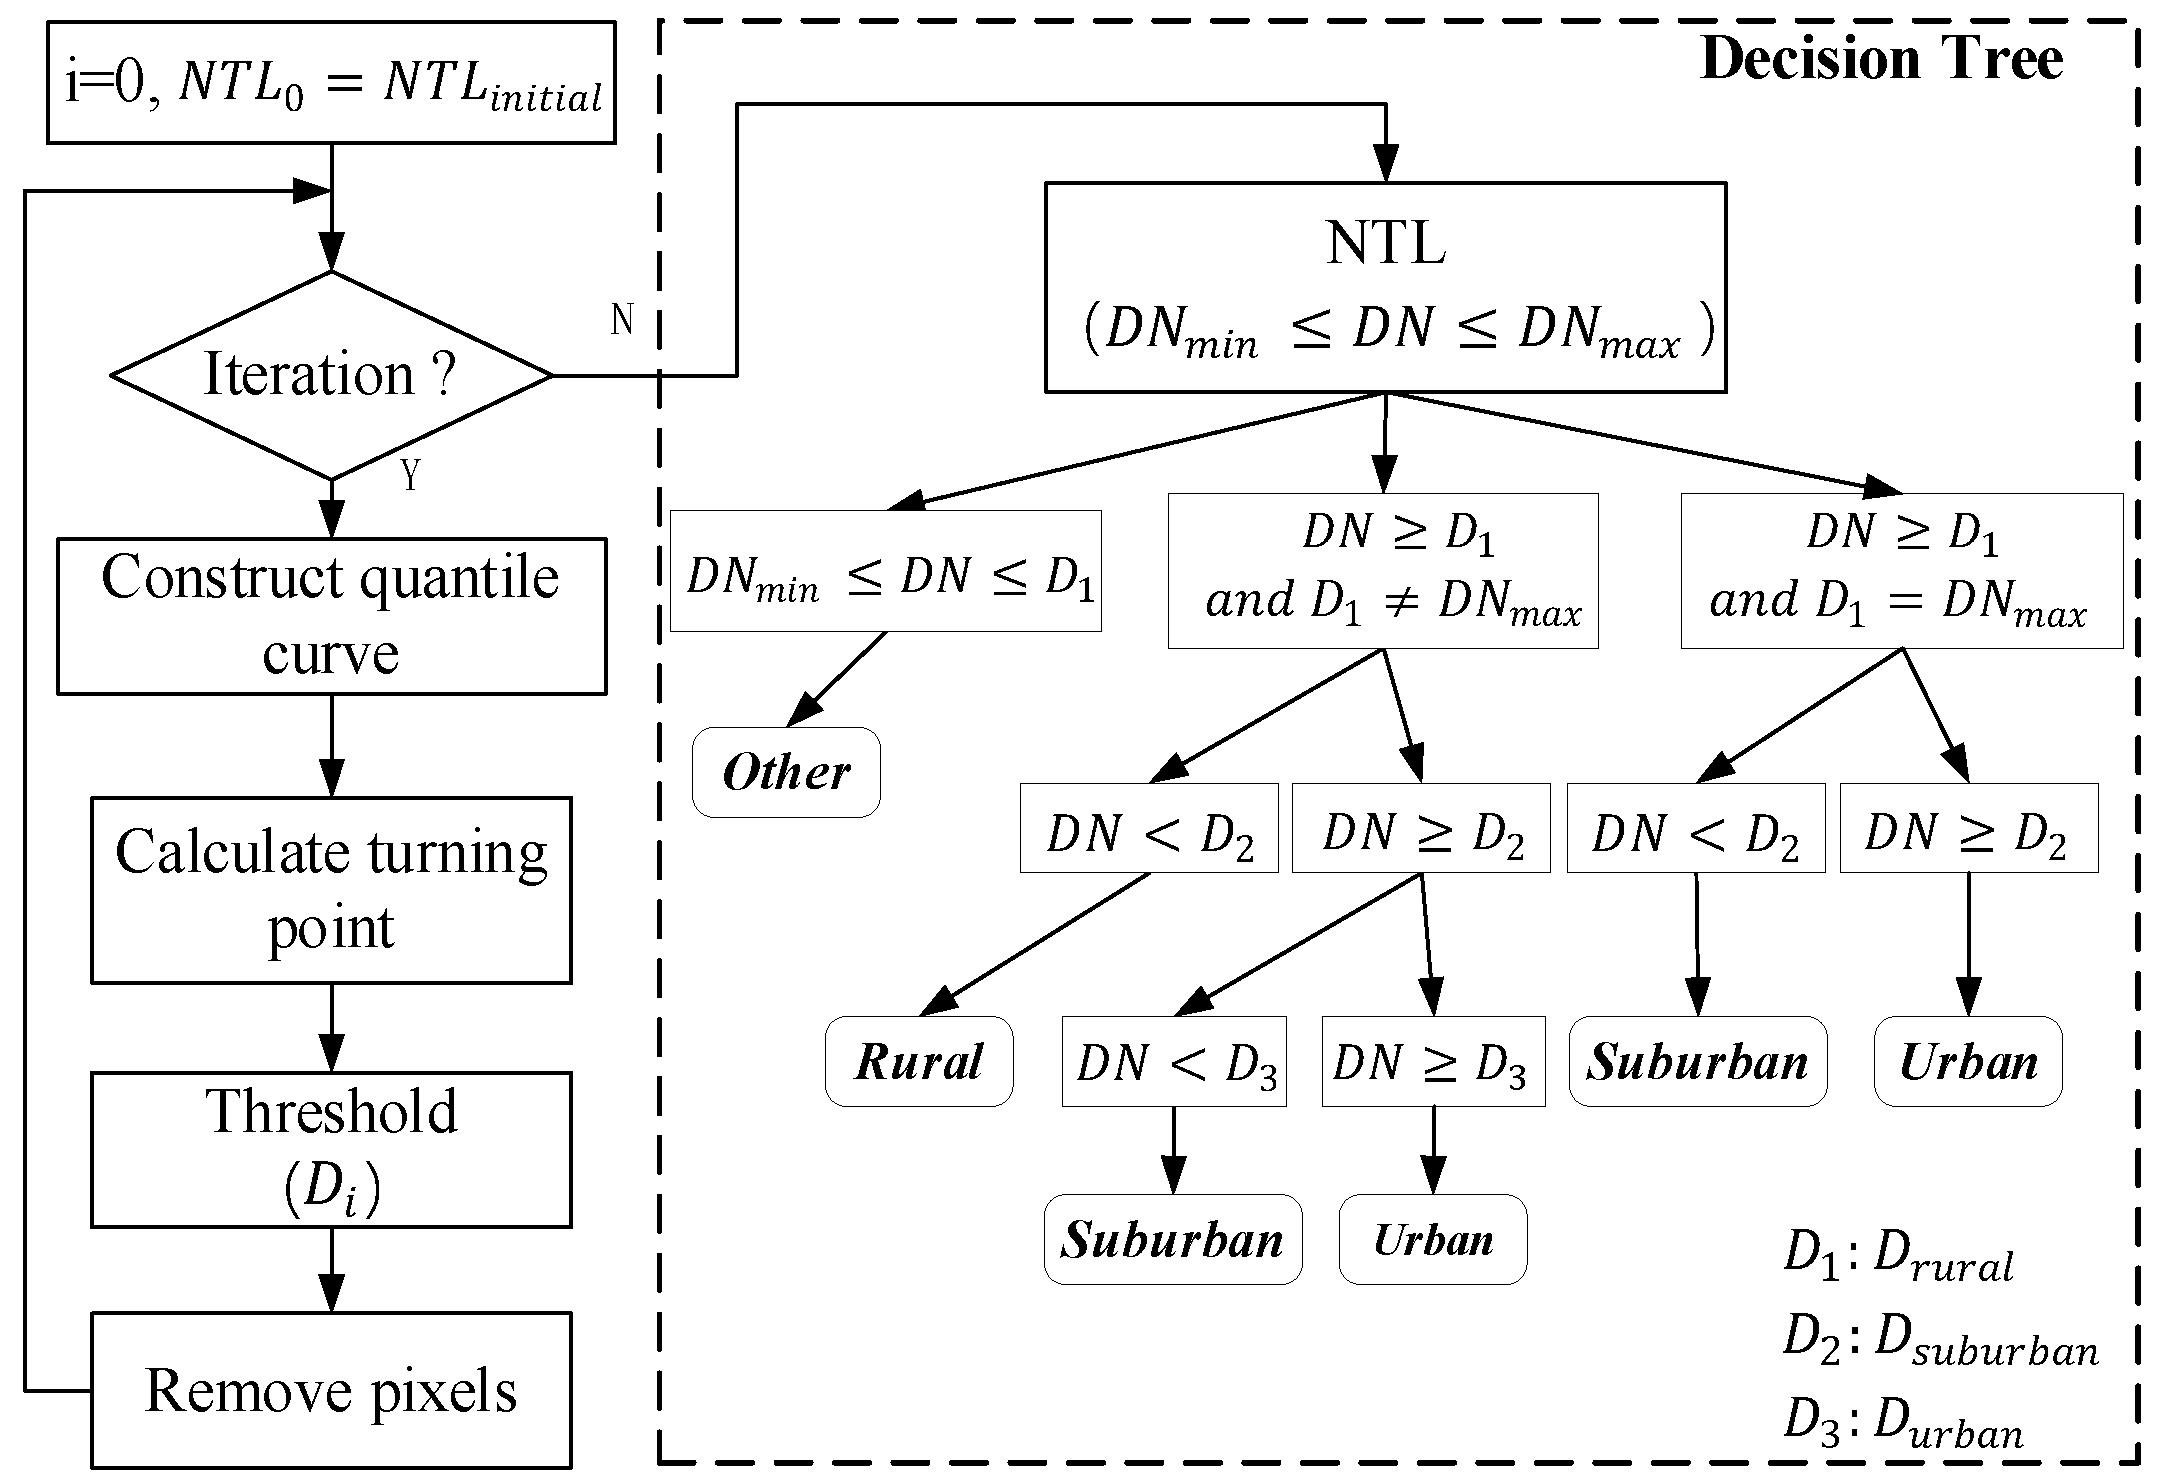
3.1. A Quantile-Based Algorithm for USR Retrieval
3.2. Validation Algorithm
4. Results
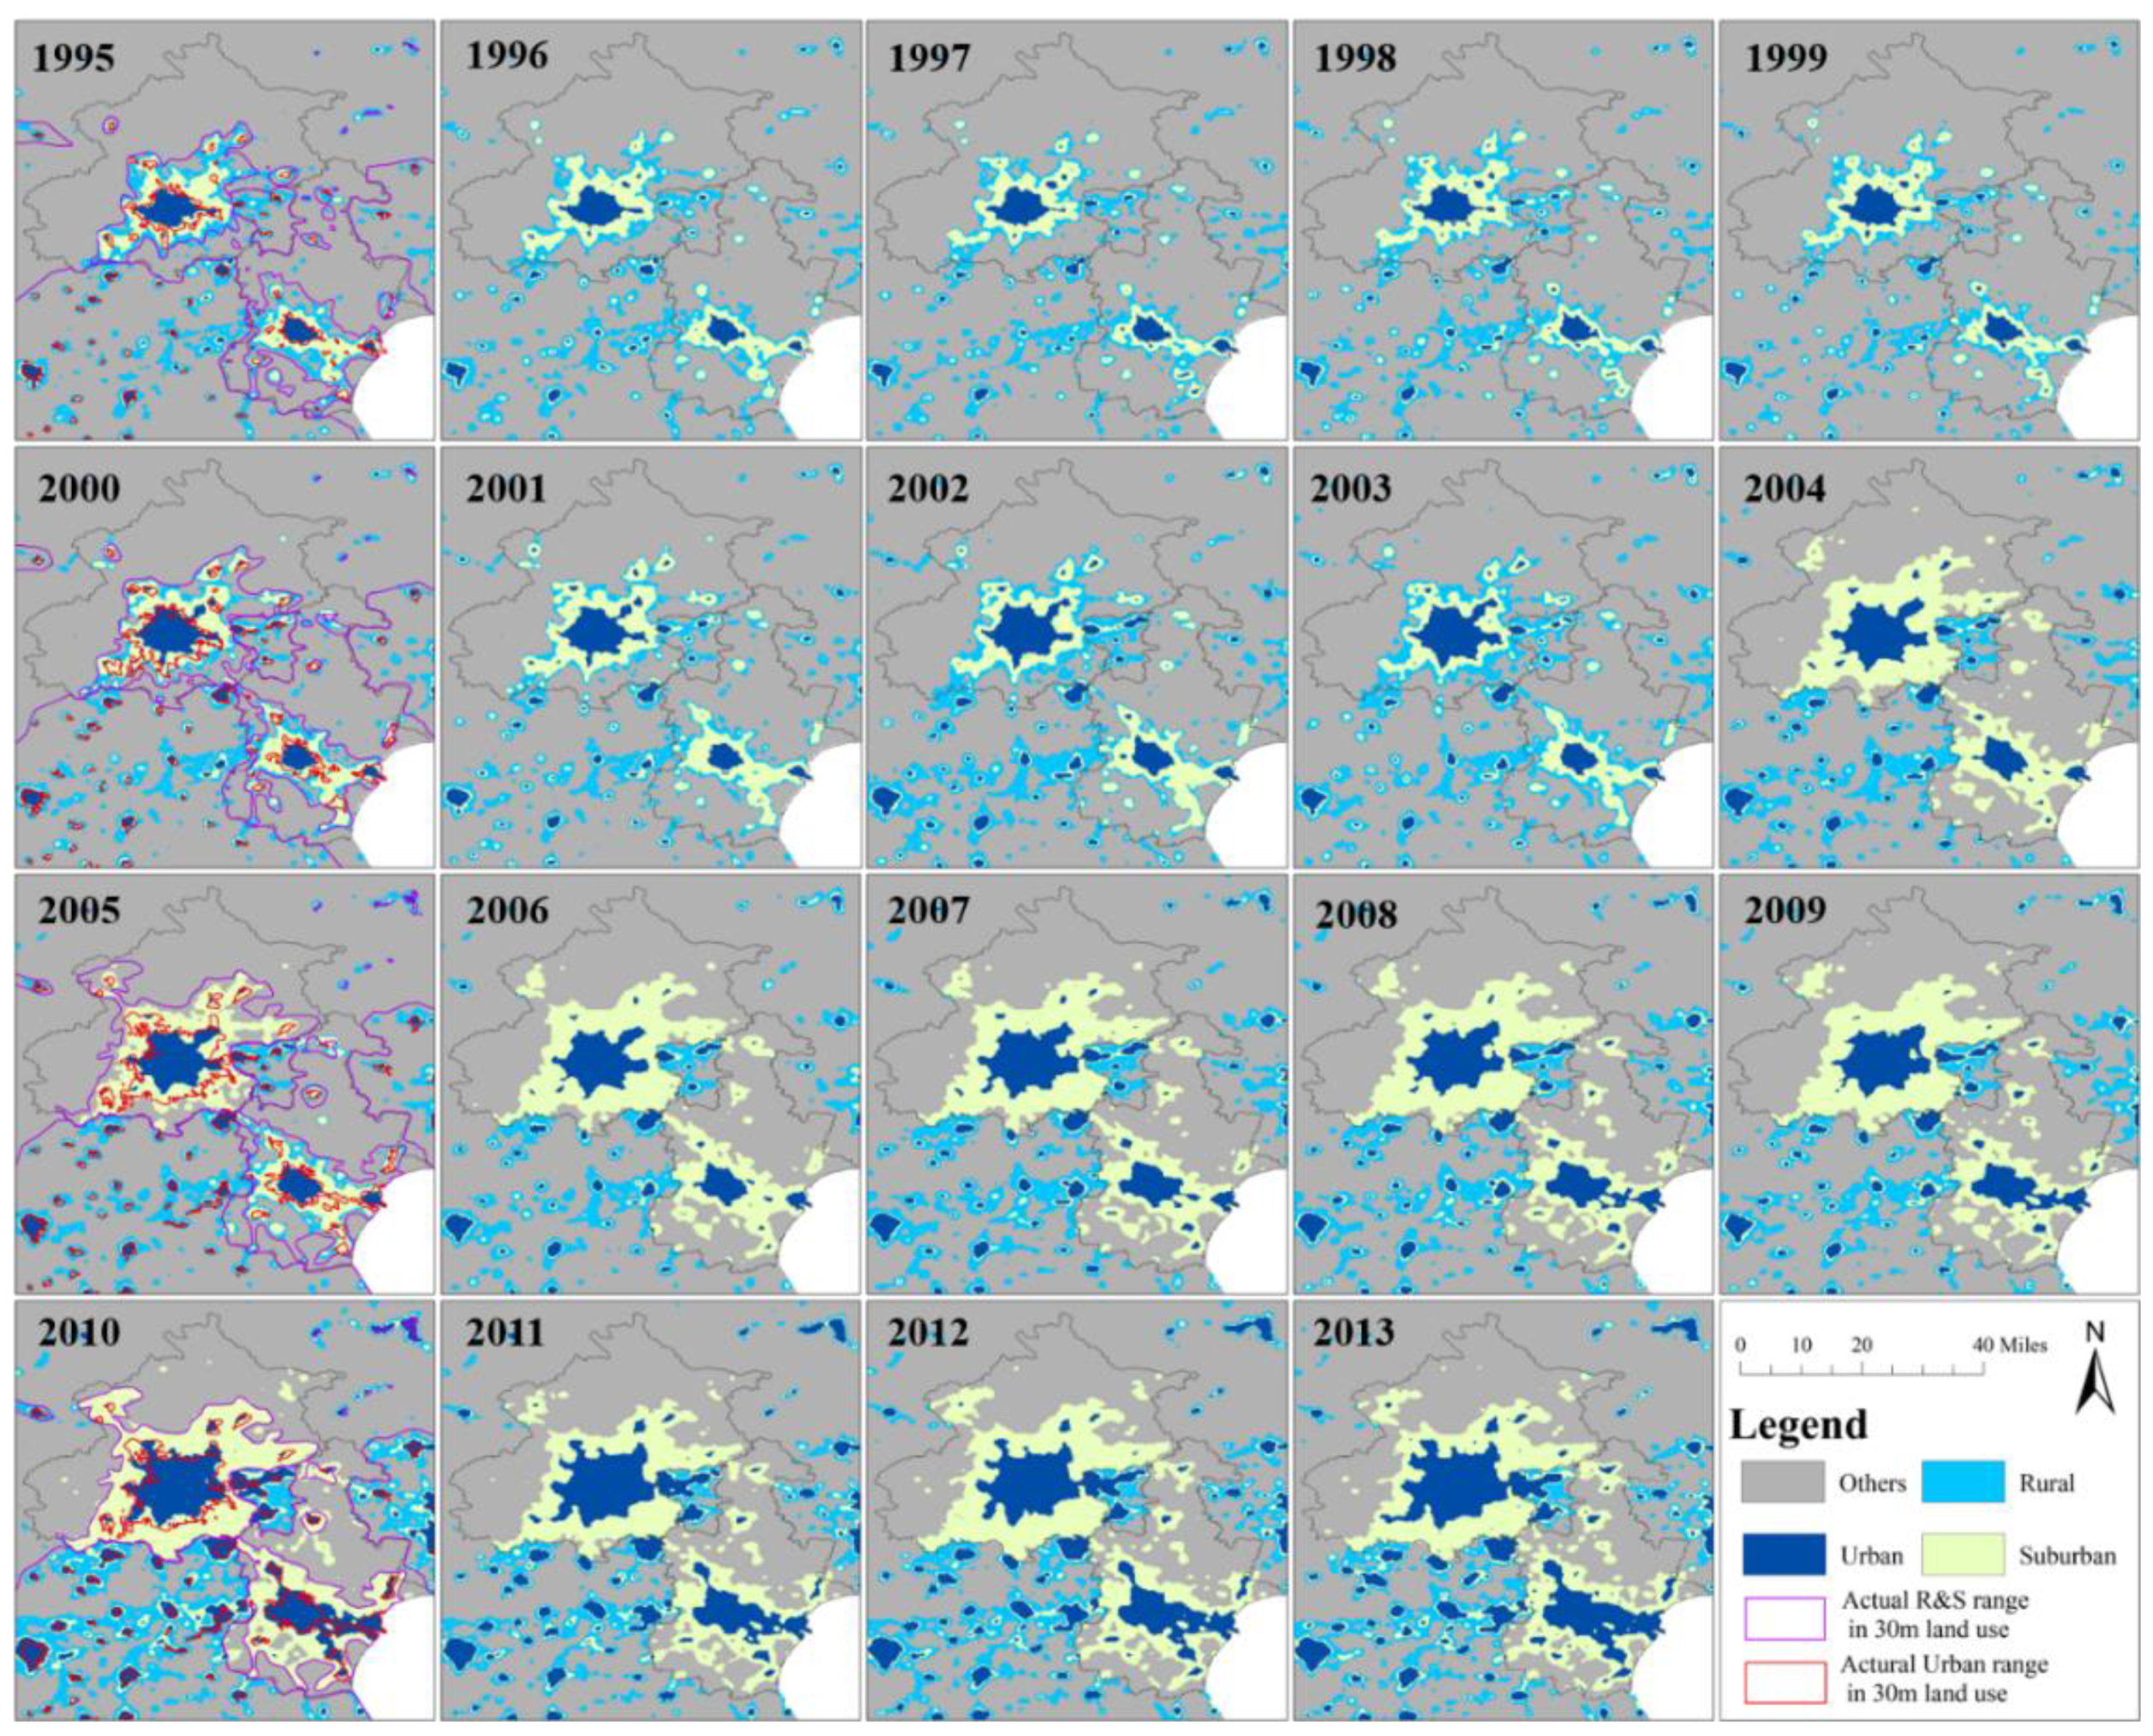
4.1. Spatial Distribution of Retrieved USR
4.2. Evaluation
5. Discussion
5.1. The Problem of Retrieving Rural Settlements
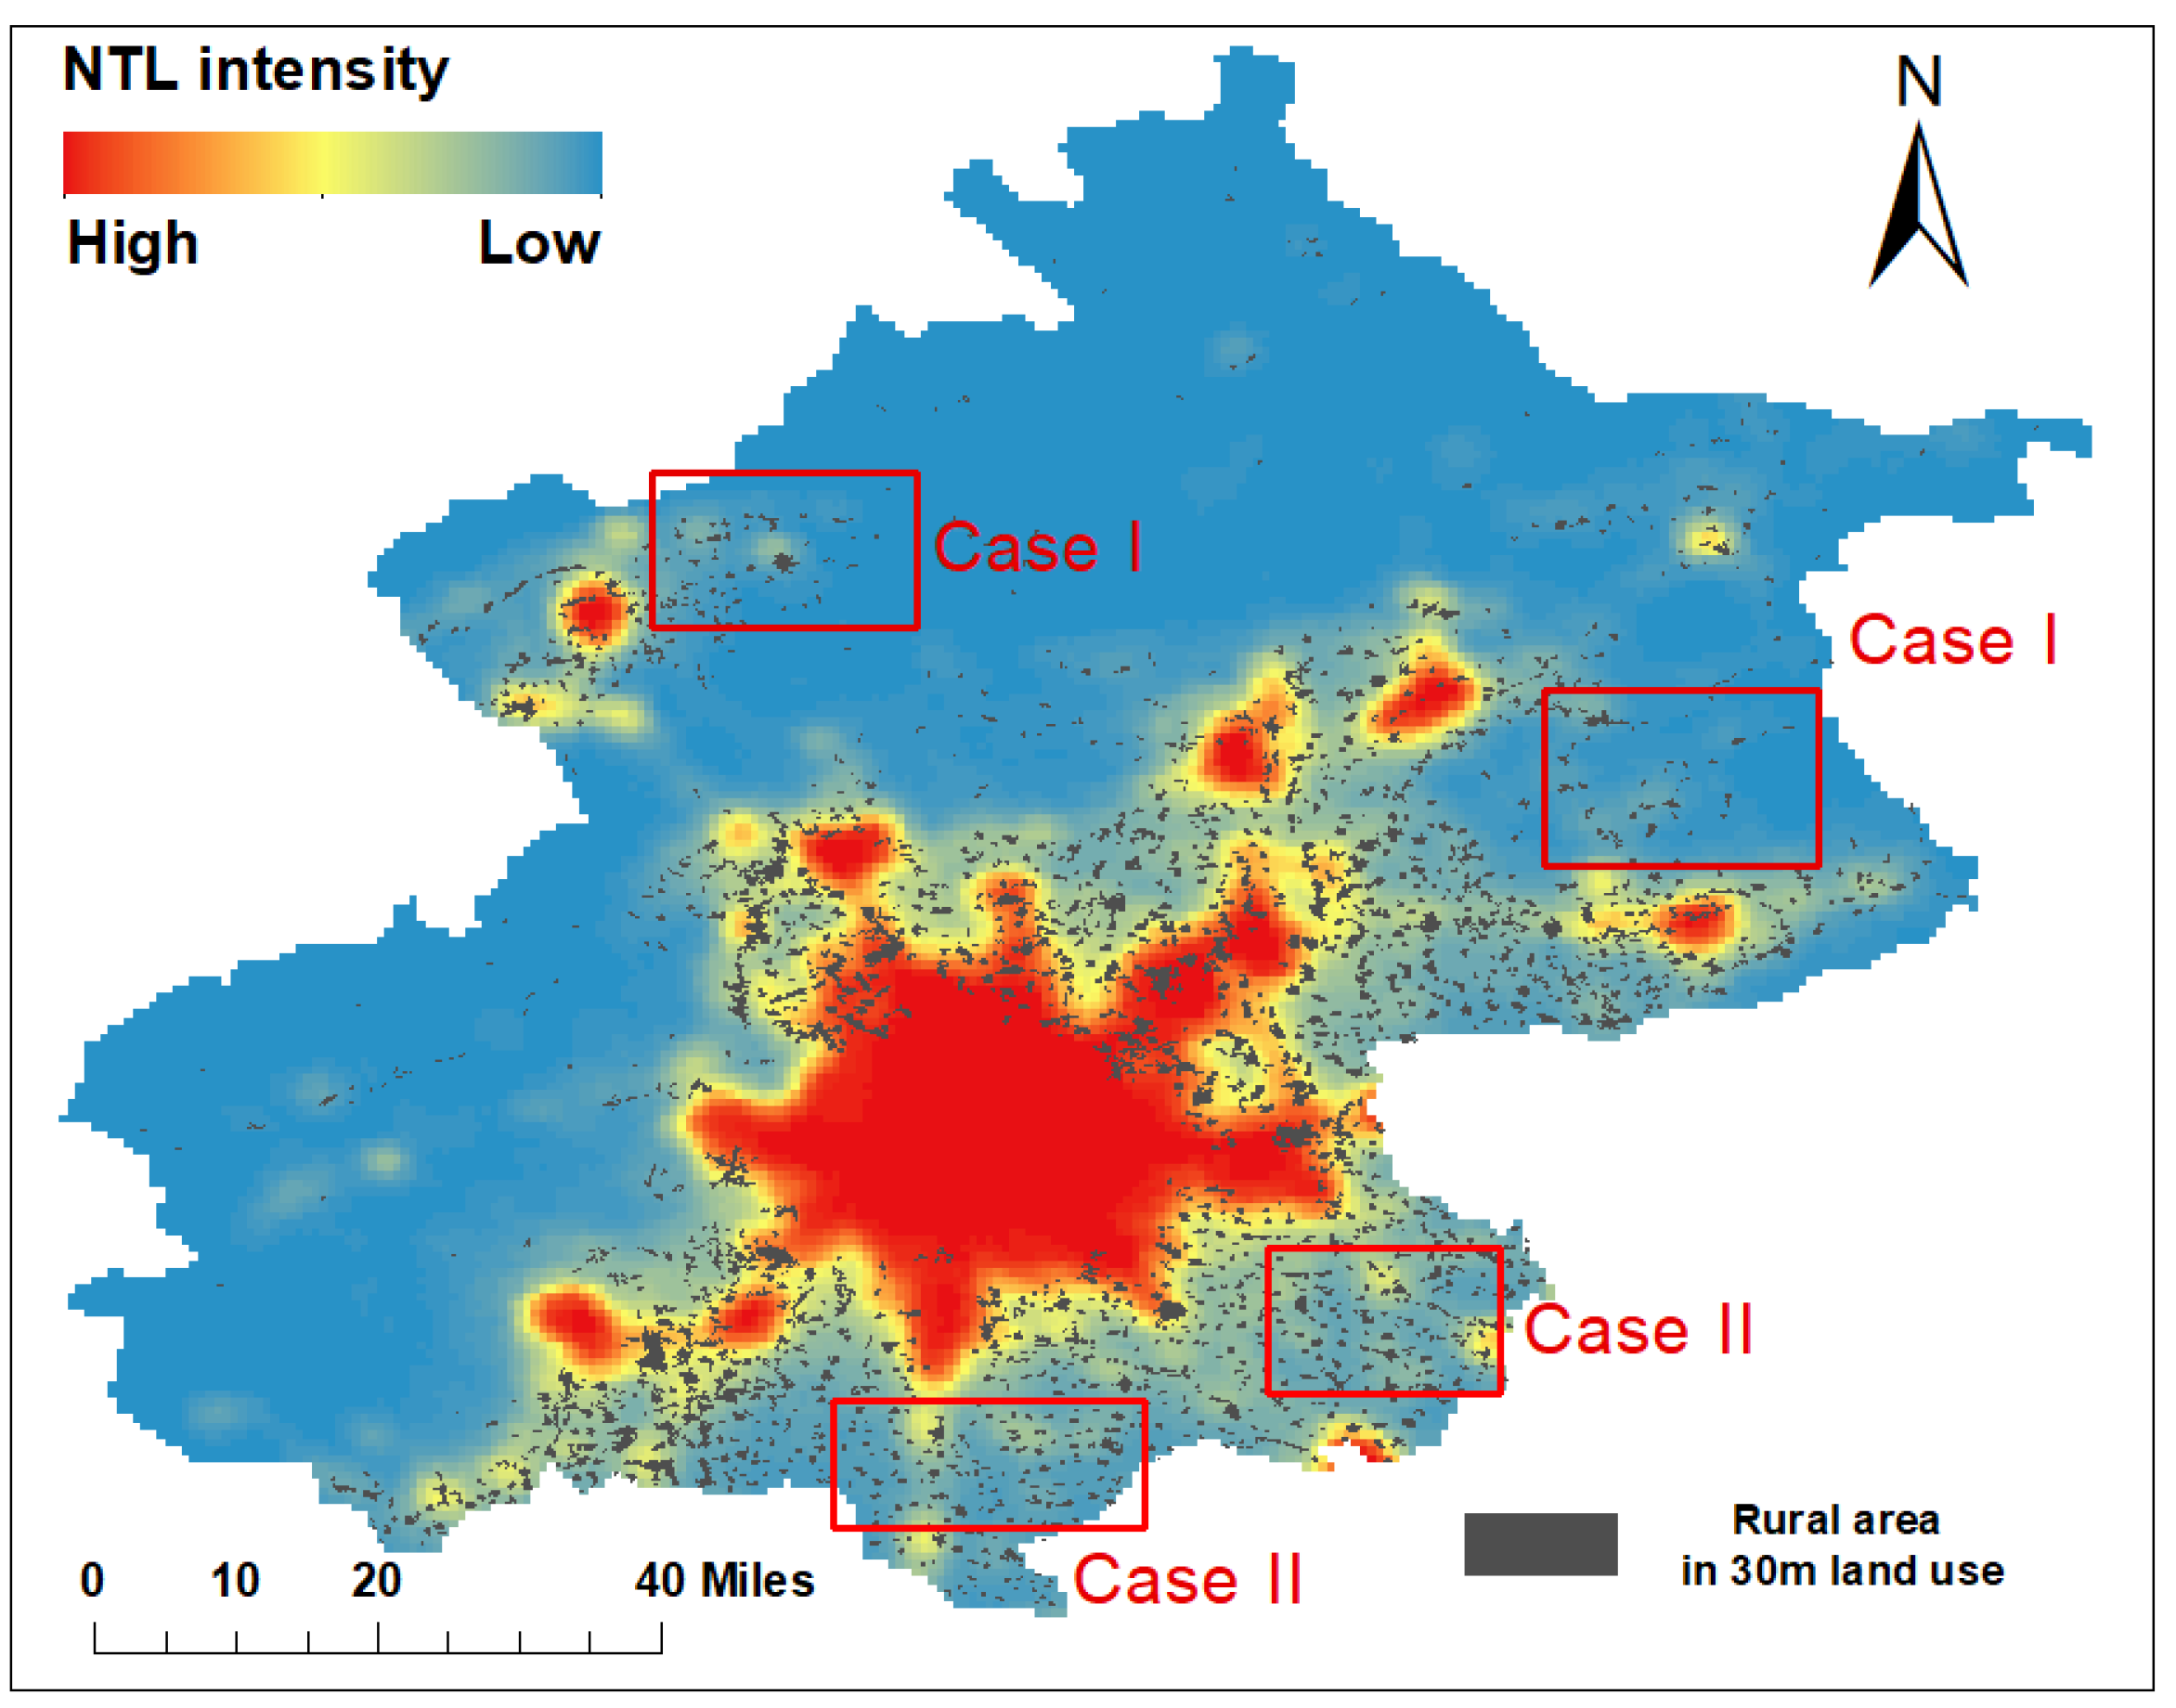
- When scattered, a DMSP/OLS sensor cannot detect the NTL intensity, and thus rural settlements will be missed. In addition, due to the blooming effect of NTL, rural settlements cannot be accurately distinguished. Due to the relatively discrete distribution of rural settlements, when there are many rural settlements, the presence of the blooming effect of the NTL causes the surrounding pixels to be identified as rural areas. As a result, the discretely distributed rural settlements are merged into one area, and so only their approximate scope can be retrieved. Unlike rural settlements, the urban land itself has a more concentrated distribution and larger area. When retrieving the urban area, the impact of the blooming effect is mostly concentrated within the city, and so the impact on the entire urban area is small (Figure 7 Case I).
- When using data from earlier years, NTL is not an effective way to identify rural areas, since in the past the economic development in those areas was relatively minor and there was a power shortage in some rural areas. With the construction of the rural infrastructure and the promotion of corresponding policies, the situation of rural electricity consumption has been greatly improved, and the situation of being omitted due to the absence of NTL is gradually reduced (Figure 7 Case II).
5.2. Differences between the Results Based on HSI or NTL
5.3. The Weakness of DMSP and Potential Problems
6. Conclusions
Author Contributions
Funding
Conflicts of Interest
Appendix A
| Year | Area (km2) | ||||||||
|---|---|---|---|---|---|---|---|---|---|
| Beijing | Tianjin | Hebei | |||||||
| Rural | Suburban | Urban | Rural | Suburban | Urban | Rural | Suburban | Urban | |
| 1995 | 2092.8 | 2822.9 | 765.8 | 1663.2 | 1789.7 | 385.4 | 9240.6 | 2245.2 | 1384.8 |
| 1995 * | - | - | 1081.8 | - | - | 577.8 | - | - | 1864.5 |
| 1996 | 1805.0 | 2559.7 | 856.6 | 1405.9 | 1597.0 | 386.3 | 10,591.2 | 2385.6 | 1583.4 |
| 1997 | 1580.0 | 2285.5 | 808.2 | 1529.0 | 1321.0 | 438.9 | 10,114.2 | 1906.2 | 1633.2 |
| 1998 | 1816.0 | 2646.3 | 835.4 | 1405.1 | 1467.1 | 444.0 | 10,702.8 | 2645.4 | 1822.2 |
| 1999 | 1608.9 | 2533.4 | 903.3 | 1432.3 | 1600.4 | 476.3 | 8249.4 | 1992.6 | 1852.2 |
| 2000 | 1511.2 | 3301.8 | 1342.3 | 1511.2 | 2333.9 | 483.9 | 9072.6 | 2536.8 | 1892.4 |
| 2000 * | - | - | 1190.3 | - | - | 601.6 | - | - | 1998.0 |
| 2001 | 1462.8 | 3301.8 | 1472.4 | 1511.2 | 2333.9 | 513.3 | 9072.6 | 2536.8 | 1892.4 |
| 2002 | 2272.8 | 2757.6 | 1538.4 | 1233.6 | 2581.8 | 614.7 | 12,408.0 | 2740.2 | 2095.6 |
| 2003 | 2547.0 | 2410.3 | 1601.2 | 4626.2 | 2026.6 | 721.5 | 12,075.0 | 2605.2 | 2101.3 |
| 2004 | 0.0 | 6450.7 | 2013.8 | 0.0 | 3482.3 | 806.6 | 13,365.0 | 2611.2 | 3766.4 |
| 2005 | 0.0 | 5417.5 | 2096.2 | 0.0 | 3960.6 | 656.3 | 11,471.4 | 2298.0 | 3100.1 |
| 2005 * | - | - | 1806.7 | - | - | - | - | - | 2778.3 |
| 2006 | 0.0 | 6980.5 | 2111.5 | 0.0 | 4177.9 | 836.3 | 12,507.6 | 2675.4 | 3138.0 |
| 2007 | 0.0 | 7009.3 | 2279.6 | 0.0 | 4113.4 | 1209.0 | 15,232.8 | 3400.8 | 4460.4 |
| 2008 | 0.0 | 7373.6 | 2419.7 | 0.0 | 4025.1 | 1405.1 | 13,473.6 | 3870.6 | 4661.4 |
| 2009 | 0.0 | 7327.7 | 2483.3 | 0.0 | 3997.9 | 1427.2 | 13,474.2 | 4017.6 | 4323.0 |
| 2010 | 0.0 | 8176.7 | 2816.1 | 0.0 | 4824.0 | 1478.1 | 17,983.2 | 6547.2 | 5340.0 |
| 2010 * | - | - | 2675.2 | - | - | 1167.3 | - | - | 4928.9 |
| 2011 | 0.0 | 6360.7 | 2962.2 | 0.0 | 4521.8 | 1516.3 | 11,727.0 | 4402.8 | 5472.0 |
| 2012 | 0.0 | 7840.5 | 2739.7 | 0.0 | 4670.3 | 1557.9 | 14,831.4 | 4740.6 | 6150.0 |
| 2013 | 0.0 | 7060.3 | 3253.4 | 0.0 | 4892.8 | 1528.2 | 12,919.2 | 5664.0 | 6720.0 |
References
- Lu, D.S.; Tian, H.Q.; Zhou, G.M.; Ge, H.L. Regional mapping of human settlements in southeastern China with multisensor remotely sensed data. Remote Sens. Environ. 2008, 112, 3668–3679. [Google Scholar] [CrossRef]
- Anarfi, K.; Hill, R.A.; Shiel, C. Highlighting the Sustainability Implications of Urbanisation: A Comparative Analysis of Two Urban Areas in Ghana. Land 2020, 9, 300. [Google Scholar] [CrossRef]
- Faria, J.R.; Mollick, A.V. Urbanization, economic growth, and welfare. Econ. Lett. 1996, 52, 109–115. [Google Scholar] [CrossRef]
- Farrell, K. The Rapid Urban Growth Triad: A New Conceptual Framework for Examining the Urban Transition in Developing Countries. Sustainability 2017, 9, 1407. [Google Scholar] [CrossRef] [Green Version]
- Ouyang, X.; Zhu, X. Spatio-temporal characteristics of urban land expansion in Chinese urban agglomerations. Acta Geogr. Sin. 2020, 75, 571–588. (In Chinese) [Google Scholar] [CrossRef]
- Ma, W.Q.; Jiang, G.H.; Chen, Y.H.; Qu, Y.B.; Zhou, T.; Li, W.Q. How feasible is regional integration for reconciling land use conflicts across the urban-rural interface? Evidence from Beijing-Tianjin-Hebei metropolitan region in China. Land Use Policy 2020, 92, 104433. [Google Scholar] [CrossRef]
- Jiang, D.; Huang, Y.H.; Zhuang, D.F.; Zhu, Y.Q.; Xu, X.L.; Ren, H.Y. A Simple Semi-Automatic Approach for Land Cover Classification from Multispectral Remote Sensing Imagery. PLoS ONE 2012, 7, e45889. [Google Scholar] [CrossRef] [Green Version]
- Friedl, M.A.; McIver, D.K.; Hodges, J.C.F.; Zhang, X.Y.; Muchoney, D.; Strahler, A.H.; Woodcock, C.E.; Gopal, S.; Schneider, A.; Cooper, A.; et al. Global land cover mapping from MODIS: Algorithms and early results. Remote Sens. Environ. 2002, 83, 287–302. [Google Scholar] [CrossRef]
- Loveland, T.R.; Reed, B.C.; Brown, J.F.; Ohlen, D.O.; Zhu, Z.; Yang, L.; Merchant, J.W. Development of a global land cover characteristics database and IGBP DISCover from 1 km AVHRR data. Int. J. Remote Sens. 2000, 21, 1303–1330. [Google Scholar] [CrossRef]
- Fritz, S.; Bartholomé, E.; Belward, A.; Hartley, A.; Stibig, H.; Eva, H.; Mayaux, P.; Bartalev, S.; Latifovic, R.; Kolmert, S.; et al. Harmonisation, Mosaicing and Production of the Global Land Cover 2000 Database (Beta Version); EUROPEAN COMMISSION: Luxembourg, 2003. [Google Scholar]
- Bicheron, P.; Defourny, P.; Brockmann, C.; Schouten, L.; Vancutsem, C.; Huc, M.; Bontemps, S.; Leroy, M.; Frédéric, A.; Herold, M.; et al. GLOBCOVER: Products Description and Validation Report; MEDIAS-France: Levallois-Perret, France, 2008. [Google Scholar]
- Tateishi, R.; Uriyangqai, B.; Al-Bilbisi, H.; Ghar, M.A.; Tsend-Ayush, J.; Kobayashi, T.; Kasimu, A.; Hoan, N.T.; Shalaby, A.; Alsaaideh, B.; et al. Production of global land cover data—GLCNMO. Int. J. Digit. Earth 2011, 4, 22–49. [Google Scholar] [CrossRef]
- Gong, P.; Liu, H.; Zhang, M.N.; Li, C.C.; Wang, J.; Huang, H.B.; Clinton, N.; Ji, L.Y.; Li, W.Y.; Bai, Y.Q.; et al. Stable classification with limited sample: Transferring a 30-m resolution sample set collected in 2015 to mapping 10-m resolution global land cover in 2017. Sci. Bull. 2019, 64, 370–373. [Google Scholar] [CrossRef] [Green Version]
- Chen, J.; Liao, A.; Cao, X.; Chen, L.; Chen, X.; He, C.; Han, G.; Lu, M.; Zhang, W.; Tong, X.; et al. Global land cover mapping at 30m resolution: A POKbased operational approach. Int. J. Photogr. Remote Sens. 2014, 103, 7–27. [Google Scholar] [CrossRef] [Green Version]
- Hay, G.J.; Niemann, K.O.; McLean, G.F. An object-specific image texture analysis of H-resolution forest imagery. Remote Sens. Environ. 1996, 55, 108–122. [Google Scholar] [CrossRef]
- Stumpf, A.; Kerle, N. Object-oriented mapping of landslides using Random Forests. Remote Sens. Environ. 2011, 115, 2564–2577. [Google Scholar] [CrossRef]
- Huang, Y.H.; Zhao, C.P.; Yang, H.J.; Song, X.Y.; Chen, J.; Li, Z.H. Feature Selection Solution with High Dimensionality and Low-Sample Size for Land Cover Classification in Object-Based Image Analysis. Remote Sens. 2017, 9, 939. [Google Scholar] [CrossRef] [Green Version]
- Liu, J.Y.; Liu, M.L.; Tian, H.Q.; Zhuang, D.F.; Zhang, Z.X.; Zhang, W.; Tang, X.M.; Deng, X.Z. Spatial and temporal patterns of China’s cropland during 1990-2000: An analysis based on Landsat TM data. Remote Sens. Environ. 2005, 98, 442–456. [Google Scholar] [CrossRef]
- Liu, J.Y.; Zhang, Z.X.; Zhuang, D.F. Remote Sensing Information Study of Land Use Change in China in 1990s; Sciences Press: Beijing, China, 2005. (In Chinese) [Google Scholar]
- Schneider, A.; Friedl, M.A.; Potere, D. Mapping global urban areas using MODIS 500-m data: New methods and datasets based on ‘urban ecoregions’. Remote Sens. Environ. 2010, 114, 1733–1746. [Google Scholar] [CrossRef]
- Zhou, Y.Y.; Li, X.C.; Asrar, G.R.; Smith, S.J.; Imhoff, M. A global record of annual urban dynamics (1992–2013) from nighttime lights. Remote Sens. Environ. 2018, 219, 206–220. [Google Scholar] [CrossRef]
- Xie, Y.H.; Weng, Q.H.; Fu, P. Temporal variations of artificial nighttime lights and their implications for urbanization in the conterminous United States, 2013–2017. Remote Sens. Environ. 2019, 225, 160–174. [Google Scholar] [CrossRef]
- Liu, Z.F.; He, C.Y.; Zhang, Q.F.; Huang, Q.X.; Yang, Y. Extracting the dynamics of urban expansion in China using DMSP-OLS nighttime light data from 1992 to 2008. Landsc. Urban Plan 2012, 106, 62–72. [Google Scholar] [CrossRef]
- Levin, N.; Kyba, C.C.M.; Zhang, Q.L.; de Miguel, A.S.; Roman, M.O.; Li, X.; Portnov, B.A.; Molthan, A.L.; Jechow, A.; Miller, S.D.; et al. Remote sensing of night lights: A review and an outlook for the future. Remote Sens. Environ. 2020, 237. [Google Scholar] [CrossRef]
- Li, X.; Zhao, L.X.; Li, D.R.; Xu, H.M. Mapping Urban Extent Using Luojia 1-01 Nighttime Light Imagery. Sensors 2018, 18, 3665. [Google Scholar] [CrossRef] [PubMed] [Green Version]
- Henderson, M.; Yeh, E.T.; Gong, P.; Elvidge, C.; Baugh, K. Validation of urban boundaries derived from global night-time satellite imagery. Int. J. Remote Sens. 2003, 24, 595–609. [Google Scholar] [CrossRef]
- Zhang, X.Y.; Li, P.J. A temperature and vegetation adjusted NTL urban index for urban area mapping and analysis. Isprs J. Photogramm. Remote Sens. 2018, 135, 93–111. [Google Scholar] [CrossRef]
- Shi, K.F.; Huang, C.; Yu, B.L.; Yin, B.; Huang, Y.X.; Wu, J.P. Evaluation of NPP-VIIRS night-time light composite data for extracting built-up urban areas. Remote Sens. Lett. 2014, 5, 358–366. [Google Scholar] [CrossRef]
- Zhou, Y.Y.; Smith, S.J.; Elvidge, C.D.; Zhao, K.G.; Thomson, A.; Imhoff, M. A cluster-based method to map urban area from DMSP/OLS nightlights. Remote Sens. Environ. 2014, 147, 173–185. [Google Scholar] [CrossRef]
- Liu, X.P.; Hu, G.H.; Ai, B.; Li, X.; Shi, Q. A Normalized Urban Areas Composite Index (NUACI) Based on Combination of DMSP-OLS and MODIS for Mapping Impervious Surface Area. Remote Sens. 2015, 7, 17168–17189. [Google Scholar] [CrossRef] [Green Version]
- Zhang, Q.; Schaaf, C.; Seto, K.C. The Vegetation Adjusted NTL Urban Index: A new approach to reduce saturation and increase variation in nighttime luminosity. Remote Sens. Environ. 2013, 129, 32–41. [Google Scholar] [CrossRef]
- Hao, R.F.; Yu, D.Y.; Sun, Y.; Cao, Q.; Liu, Y.; Liu, Y.P. Integrating Multiple Source Data to Enhance Variation and Weaken the Blooming Effect of DMSP-OLS Light. Remote Sens. 2015, 7, 1422–1440. [Google Scholar] [CrossRef] [Green Version]
- Yang, Y.Y.; Liu, Y.S.; Li, Y.R.; Li, J.T. Measure of of urban-rural transformation in Beijing-Tianjin-Hebei region in the new millennium: Population-land-industry perspective. Land Use Policy 2018, 79, 595–608. [Google Scholar] [CrossRef]
- Peerzado, M.; Magsi, H.; Sheikh, M. Land use conflicts and urban sprawl: Conversion of agriculture lands into urbanization in Hyderabad, Pakistan. J. Saudi Soc. Agric. Sci. 2019, 18, 423–428. [Google Scholar] [CrossRef]
- Elvidge, C.; Ziskin, D.; Baugh, K.; Tuttle, B.; Tilottama, G.; Pack, D.; Erwin, E.; Zhizhin, M. A Fifteen Year Record of Global Natural Gas Flaring Derived from Satellite Data. Energies 2009, 2, 595–622. [Google Scholar] [CrossRef]
- Elvidge, C.; Zhizhin, M.; Baugh, K.; Hsu, F.-C.; Tilottama, G. Methods for Global Survey of Natural Gas Flaring from Visible Infrared Imaging Radiometer Suite Data. Energies 2016, 9, 14. [Google Scholar] [CrossRef]
- Xu, X.L.; Liu, J.Y.; Zhang, S.W.; Li, R.D.; Yan, C.Z.; Wu, S.X. China Multi-period Land Use Land Cover Remote Sensing Monitoring Data Set (CNLUCC). In Data Registration and Publishing System of the Resource and Environmental Science Data Center of the Chinese Academy of Sciences [DB/OL]; Resource and Environment Science and Data Center: Beijing, China, 2018. [Google Scholar]
- Tian, Y.S.; Wang, L. The Effect of Urban-Suburban Interaction on Urbanization and Suburban Ecological Security: A Case Study of Suburban Wuhan, Central China. Sustainability 2020, 12, 1600. [Google Scholar] [CrossRef] [Green Version]
- Cohen, J. Citation-Classic—A Coefficient of Agreement for Nominal Scales. Educ. Psychol. Meas. 1960, 20, 37–46. [Google Scholar] [CrossRef]
- Blackman, N.J.M.; Koval, J.J. Interval estimation for Cohen’s kappa as a measure of agreement. Stat. Med. 2000, 19, 723–741. [Google Scholar] [CrossRef]
- Landis, J.; Koch, G. The measurement of observer agreement for categorical data. Biometrics 1977, 33, 159–174. [Google Scholar] [CrossRef] [Green Version]
- Li, D.B.; Qiu, X.H.; Lin, X.Y.; Zhu, X.D.; Zhang, W.M. Bei Jing Area Statistical Yearbook; China Statistics Press: Beijing, China, 2004. (In Chinese)
- Seto, K.C.; Fragkias, M.; Guneralp, B.; Reilly, M.K. A Meta-Analysis of Global Urban Land Expansion. PLoS ONE 2011, 6, e23777. [Google Scholar] [CrossRef]
- Li, X.C.; Zhou, Y.Y.; Zhao, M.; Zhao, X. A harmonized global nighttime light dataset 1992–2018. Sci. Data 2020, 7. [Google Scholar] [CrossRef]
- Kyba, C.C.M.; Kuester, T.; de Miguel, A.S.; Baugh, K.; Jechow, A.; Holker, F.; Bennie, J.; Elvidge, C.D.; Gaston, K.J.; Guanter, L. Artificially lit surface of Earth at night increasing in radiance and extent. Sci. Adv. 2017, 3. [Google Scholar] [CrossRef] [Green Version]


| Sensor | Product | Resolution | Acquisition Date | Type |
|---|---|---|---|---|
| DMSP/OLS | Stable light | The annual image product with the grid cell size of 1 km by 1 km | F12: 1995,1996 F14: 1997–2001 F15: 2002,2003 F16: 2004–2009 F18: 2010–2013 | Night Light |
| MODIS | MOD44W | Spatial resolution of 1 km for NDVI and EVI. The monthly data was converted into one year data by the maximum method | From 2002 to 2013 | Water Mask |
| MODIS | MOD13A3 | The annual 16 day composite MOD13A2 product with 1-km spatial resolution. Band 1 is NDVI and Band 2 is EVI. | January 2002 to December 2013 (July, August, September) | NDVI and EVI |
| Landsat | 30 meter land use | The per 5 years’ data with the grid cell size of 30 m by 30 m. | 1995/2000/2005/2010 | LUCC |
| Category in Verification Data | Category in Prediction Data | ||
|---|---|---|---|
| Others | R and S | Urban | |
| Others | |||
| R and S | |||
| Urban | |||
| Year | 1995 | 2000 | 2005 | 2010 | Average | |||||
|---|---|---|---|---|---|---|---|---|---|---|
| Province | OA | KC | OA | KC | OA | KC | OA | KC | OA | Kappa |
| Beijing | 0.919 | 0.620 | 0.904 | 0.668 | 0.909 | 0.660 | 0.914 | 0.726 | 0.912 | 0.669 |
| Tianjin | 0.926 | 0.638 | 0.859 | 0.591 | 0.900 | 0.623 | 0.895 | 0.672 | 0.895 | 0.631 |
| Hebei | 0.604 | 0.398 | 0.6107 | 0.368 | 0.622 | 0.406 | 0.664 | 0.361 | 0.625 | 0.383 |
| Province | Beijing | Tianjin | Hebei | Average | ||||||||
|---|---|---|---|---|---|---|---|---|---|---|---|---|
| Year | Others | R and S | Urban | Others | R and S | Urban | Others | R and S | Urban | Others | R and S | Urban |
| 1995 | 0.942 | 0.845 | 0.953 | 0.960 | 0.824 | 0.901 | 0.589 | 0.844 | 0.408 | 0.830 | 0.838 | 0.754 |
| 2000 | 0.949 | 0.793 | 0.755 | 0.856 | 0.800 | 0.796 | 0.596 | 0.841 | 0.405 | 0.800 | 0.811 | 0.652 |
| 2005 | 0.942 | 0.853 | 0.807 | 0.960 | 0.768 | 0.879 | 0.605 | 0.852 | 0.402 | 0.836 | 0.824 | 0.696 |
| 2010 | 0.976 | 0.841 | 0.876 | 0.928 | 0.879 | 0.823 | 0.650 | 0.880 | 0.300 | 0.851 | 0.867 | 0.860 |
| Avg. | 0.952 | 0.833 | 0.848 | 0.926 | 0.8178 | 0.859 | 0.61 | 0.8543 | 0.379 | 0.829 | 0.835 | 0.7405 |
| Fixed Threshold Method [27] | Quantile | |||||||||||
|---|---|---|---|---|---|---|---|---|---|---|---|---|
| Methods | NTL | HSI | VANUI | VTLI | TVANUI | NTL | ||||||
| Province | OA | Kappa | OA | Kappa | OA | Kappa | OA | Kappa | OA | Kappa | OA | Kappa |
| Beijing | 0.930 | 0.622 | 0.916 | 0.569 | 0.939 | 0.634 | 0.938 | 0.6283 | 0.941 | 0.681 | 0.912 | 0.669 |
| Tianjin | 0.869 | 0.638 | 0.865 | 0.593 | 0.861 | 0.612 | 0.870 | 0.626 | 0.980 | 0.656 | 0.895 | 0.631 |
| Hebei | 0.909 | 0.625 | 0.904 | 0.567 | 0.908 | 0.621 | 0.906 | 0.613 | 0.909 | 0.640 | 0.625 | 0.383 |
| Year | 1995 | 2000 | 2005 | 2010 | Average | |||||
|---|---|---|---|---|---|---|---|---|---|---|
| Province | OA | KC | OA | KC | OA | KC | OA | KC | OA | Kappa |
| Beijing | 0.892 | 0.543 | 0.901 | 0.560 | 0.779 | 0.491 | 0.821 | 0.455 | 0.848 | 0.512 |
| Tianjin | 0.844 | 0.501 | 0.859 | 0.531 | 0.801 | 0.498 | 0.798 | 0.432 | 0.823 | 0.495 |
| Hebei | 0.724 | 0.435 | 0.764 | 0.467 | 0.755 | 0.451 | 0.712 | 0.433 | 0.739 | 0.447 |
Publisher’s Note: MDPI stays neutral with regard to jurisdictional claims in published maps and institutional affiliations. |
© 2020 by the authors. Licensee MDPI, Basel, Switzerland. This article is an open access article distributed under the terms and conditions of the Creative Commons Attribution (CC BY) license (http://creativecommons.org/licenses/by/4.0/).
Share and Cite
Huang, Y.; Wu, C.; Chen, M.; Yang, J.; Ren, H. A Quantile Approach for Retrieving the “Core Urban-Suburban-Rural” (USR) Structure Based on Nighttime Light. Remote Sens. 2020, 12, 4179. https://doi.org/10.3390/rs12244179
Huang Y, Wu C, Chen M, Yang J, Ren H. A Quantile Approach for Retrieving the “Core Urban-Suburban-Rural” (USR) Structure Based on Nighttime Light. Remote Sensing. 2020; 12(24):4179. https://doi.org/10.3390/rs12244179
Chicago/Turabian StyleHuang, Yaohuan, Chengbin Wu, Mingxing Chen, Jie Yang, and Hongyan Ren. 2020. "A Quantile Approach for Retrieving the “Core Urban-Suburban-Rural” (USR) Structure Based on Nighttime Light" Remote Sensing 12, no. 24: 4179. https://doi.org/10.3390/rs12244179
APA StyleHuang, Y., Wu, C., Chen, M., Yang, J., & Ren, H. (2020). A Quantile Approach for Retrieving the “Core Urban-Suburban-Rural” (USR) Structure Based on Nighttime Light. Remote Sensing, 12(24), 4179. https://doi.org/10.3390/rs12244179


