Article

Detection of AIS Closing Behavior and MMSI Spoofing Behavior of Ships Based on Spatiotemporal Data

State Key Laboratory of Networking and Switching Technology, Beijing University of Posts and Telecommunications, Beijing 100876, China
*
Author to whom correspondence should be addressed.
Remote Sens. 2020, 12(4), 702; https://doi.org/10.3390/rs12040702
Submission received: 20 January 2020 / Revised: 13 February 2020 / Accepted: 17 February 2020 / Published: 20 February 2020

Abstract

:
In marine transportation, many ships are equipped with AIS devices. The AIS data sent by AIS devices can help the maritime authorities and other ships obtain the navigation condition of the ship, thereby ensuring the safety of ships during navigation. However, when a ship is involved in illegal activities, the crew may close the AIS device or tamper with Maritime Mobile Service Identity (MMSI) in the AIS data. To detect these two kinds of behaviors, this paper designs the AIS closing detection algorithm and MMSI spoofing detection algorithm based on the spatiotemporal data provided by AIS and radar. As the radar data does not include the ship’s identification, the associated relationship between radar data and AIS data is difficult to determine in the multi-ship scenario. To solve this problem, the D-TRAP is defined in this paper, it is applied in the process of searching for the associated AIS points of radar trajectory points, when the number of effective AIS points is reduced caused by the above two behaviors, the association method used in the paper has better performance. In addition, real data and simulation data are used to verify the two algorithms. The verification results show that when the ship is simultaneously monitored by radar and AIS, and the monitoring process continues for a period of time, the AIS closing detection algorithm has good performance. When the ship is monitored by AIS and radar before and after MMSI spoofing, and both monitoring processes continue for a period of time, the MMSI spoofing algorithm has good performance.

Graphical Abstract

1. Introduction

Nowadays, marine transportation plays an important role in international trade. In marine transportation, many ships are equipped with Automatic Identification System (AIS), which can continuously send the dynamic and static information of the ships. This information mainly includes Maritime Mobile Service Identity (MMSI) number, type, position, speed over ground, and course over ground of the ship [1]. Through the AIS data, the maritime authorities can obtain the navigation status of ships in certain sea areas, thus facilitating the management of maritime traffic.
During navigation, in addition to normal activities, some ships may participate in illegal activities, such as smuggling, pollution, piracy, and unauthorized fishing in protected areas [2]. These ships may pose a threat to maritime traffic safety and national sovereignty. Therefore, timely detection of dangerous ships with illegal behaviors is an important task in maritime management. In the current researches, the dangerous ships are identified mainly by detecting the abnormal trajectories of ships. The main basis of these researches is that the trajectories of dangerous ships are often out of the ordinary. The authors of [3] studied the abnormal fishing vessel behavior based on vessel trajectories. The authors of [4] trained a behavior/interaction model based on trajectory data of ships, and identified abnormal and possibly dangerous situations through the model. The authors of [5] considered that the vessel trajectory points that did not follow the traffic pattern are anomalous vessel behaviors, and detected anomalous vessel behavior by creating a vessel trajectory predictor. The authors of [6] proposed a framework named MT-MAD for maritime trajectory modeling and anomaly detection. The authors of [7] judged whether the ship’s trajectory was abnormal based on type of ship, traffic direction, speed, course, number of stop points, and number of phase changes. The authors of [8] used trajectory kernels with one-class SVMs to find outlying trajectories. The authors of [9] proposed a multi-class hierarchy framework to detect anomalous trajectories. However, in these researches, the abnormal trajectories are often defined subjectively, or the detected distinctive trajectories are regarded as abnormal trajectories. There is no uniform standard for the definition of the abnormal trajectory, which also limits the scope of application of related researches.
AIS is a self-reporting system; any self-reporting system is prone to “spoofing” or the intentional reporting of incorrect information [10]. Therefore, in illegal activities, on the one hand, AIS data transmitted by the ship can be spoofed, on the other hand, the AIS transponder in the ship can be turned off [11]. Therefore, from another perspective, the correct detection of AIS closing and spoofing can help maritime authorities to detect illegal activities of ships in time, so that the safety of the relevant sea areas can be guaranteed. The authors of [12] demonstrated the feasibility of radiolocation of AIS emissions, which is the basis for future anti-spoofing and AIS verification applications. The AIS data spoofing mainly includes ship identity (MMSI) spoofing and position spoofing. At this stage, there are some researches on the detection of position spoofing, the authors of [10] studied this problem with the help of radar measurements and information from the tracking system, but the research was mainly aimed at the single-target case. The authors of [13] mainly solved the problem of position spoofing by comparing the estimated AIS emitter position and position reported in AIS data, but it required related domain knowledge. The authors of [14] calculated the speed based on the distance and duration between two AIS points, and determined whether a spoofing event occurred based on the speed, this method was suitable for resolving spoofing events with large changes in position. However, there is less research on MMSI spoofing and AIS closing detection, and it is easier for ships to perform these two behaviors in illegal activities. The authors of [15] provided an idea for MMSI spoofing and AIS switch-off detection, but no further research has been done. The authors of [11] determined whether a shortage of AIS messages represented an alerting situation by exploiting the received signal strength information; however, this method relied on ship-related features, like the height of the transmitting antenna, and when the number of ships in a certain sea area is large, it is difficult to obtain the height of the transmitting antenna of each ship. This paper mainly studies the AIS closing and MMSI spoofing problems in multi-ship scenario. In this research, the spatiotemporal data provided by AIS and radar are used without the need for ship-related features, radar is an alternative sensor for maritime surveillance near the ports [16]. The work of this paper is mainly carried out by finding the association between AIS data and radar data, and analyzing the characteristics of AIS closing behavior and MMSI spoofing behavior. The authors of [17,18,19] studied the association between spatiotemporal data of ships provided by different sensors, which provided the basis for our work. The main contributions of this paper are as follows.
(1) We define the D-TRAP, with the help of D-TRAP, the accuracy of the association between trajectory points can be improved, so as to solve the problem that the associated relationship between AIS data and radar data in the multi-ship scenario is difficult to determine.
(2) We design the AIS closing detection algorithm and MMSI spoofing detection algorithm by establishing the associated AIS trajectory map of radar trajectory. The construction of the associated AIS trajectory map can break the limitation of one-to-one association of trajectories, which can expand the scope of application based on trajectory association, and also increase the robustness of the trajectory association algorithm.
(3) We simulate the AIS closing behavior and MMSI spoofing behavior using real data and simulation data, and verify the effectiveness of the proposed algorithms accordingly.

2. Problem Description

2.1. Data Provided by AIS and Radar

In maritime transportation, both radar and AIS can provide spatiotemporal information of ships. Each record provided by AIS is called an AIS point, this paper uses P A i = { M M S I , l o n , l a t , t i m e } to represent the ith AIS point. Among them, P A i . M M S I is the MMSI number of the ship; P A i . l o n and P A i . l a t are the longitude and latitude of the ship, respectively; and P A i . t i m e is the corresponding time.
Similarly, each record provided by radar is called radar point. In the original radar point, the position of the ship is represented by the angle and distance between the ship and the radar. To be consistent with AIS data, the position of the ship needs to be represented by longitude and latitude, so the angle and distance should be converted into the latitude and longitude of the ship, and these conversion formulas can be found in [20]. At this time, we use P R j = { l o n , l a t , t i m e } to represent the jth radar point, which indicates that the longitude and latitude of the radar point at P R j . t i m e are P R j . l o n and P R j . l a t .
AIS points and radar points can be displayed in figure according to their latitude and longitude. For example, in Figure 1a, the red points represent AIS points and the blue points represent radar points. In Figure 1, the horizontal axis represents longitude, and the vertical axis represents latitude. The units of longitude and latitude are degrees. The X and Y values of each red point represent the longitude and latitude of a certain ship at a certain moment provided by AIS device, respectively, and the X value and Y value of each blue point represent the longitude and latitude of a certain target (in most cases the target is a ship), respectively, at a certain moment provided by radar. Figure 1a shows latitudes and longitudes of targets provided by AIS and radar in a certain spatiotemporal range. Among them, the longitude range is [109.4600, 109.4848], the latitude range is [18.1770, 18.1917], and the time range is from 09:48:22 on 4 January 2017 to 12:02:23 on 4 January 2017.

2.2. Generation of AIS Trajectory and Radar Trajectory

These spatiotemporal data provided by AIS and radar can be combined in time series to generate trajectories. The generation of AIS trajectory is mainly based on MMSI and the time difference between adjacent AIS points. In this paper, the pth AIS trajectory is represented by T R A p , T R A p = { P A p ( 0 ) , P A p ( 1 ) , , P A p ( l ) , , P A p ( m 1 ) } . P A p ( l ) is the ( l + 1 ) th AIS trajectory point in T R A p . P A p ( 0 ) . M M S I = P A p ( 1 ) . M M S I = = P A p ( l ) . M M S I = = P A p ( m 1 ) . M M S I , and for any 0 k < l < m , there is P A p ( k ) . t i m e < P A p ( l ) . t i m e . That is, the trajectory points in the AIS trajectory all belong to the same ship, and the trajectory points are ordered in time.
The generation of radar trajectory is mainly based on the distance and time difference between adjacent radar points. Similarly, in this paper, the qth radar trajectory is represented by T R R q , T R R q = { P R q ( 0 ) , P R q ( 1 ) , , P R q ( t ) , , P R q ( n 1 ) } . P R q ( t ) is the ( t + 1 ) th radar trajectory point in T R R q . For any 0 s < t < n , there is P R q ( s ) . t i m e < P R q ( t ) . t i m e . That is, the trajectory points in the radar trajectory are ordered in time. These two trajectory generation algorithms can be found in [20]. After trajectory generation, each trajectory is given a unique identifier, which is called the trajectory ID.
Because the sampling interval of the radar is short and the performance of the radar is easily affected by weather and other factors, there are many inaccurate radar points, which will cause the “sawtooth” phenomenon of radar trajectory and affect the further analysis of radar trajectory. Therefore, the radar trajectory needs to be smoothed. During the smoothing process, every five points in the radar trajectory are merged into a new radar point, each attribute value of this new radar point is the average of the corresponding attribute values of the five points. Specifically, for a radar trajectory T R R q = { P R q ( 0 ) , P R q ( 1 ) , , P R q ( t ) , , P R q ( n 1 ) } , the smoothed trajectory is represented by T R R q _ s m o o t h , T R R q _ s m o o t h = { P R q _ s m o o t h ( 0 ) , P R q _ s m o o t h ( 1 ) , , P R q _ s m o o t h ( t ) , , P R q _ s m o o t h ( n / 5 1 ) } , where P R q _ s m o o t h ( t ) . l o n = k = 0 4 P R q ( 5 t + k ) . l o n 5 , P R q _ s m o o t h ( t ) . l a t = k = 0 4 P R q ( 5 t + k ) . l a t 5 , P R q _ s m o o t h ( t ) . t i m e = k = 0 4 P R q ( 5 t + k ) . t i m e 5 . In Figure 1b, the red lines are the AIS trajectories generated by the AIS points in Figure 1a, and the blue lines are the smoothed radar trajectories generated by the radar points in Figure 1a.

2.3. AIS Closing Behavior and MMSI Spoofing Behavior

As stated in the introduction, AIS is a self-reporting system. When a ship is involved in illegal activities, to avoid supervision, the crew may close the AIS transponder or tamper with the ship’s MMSI in the AIS data. Examples of AIS closing behavior and MMSI spoofing behavior are shown in Figure 2.
Figure 2a shows normal navigation of the ship, where radar trajectory 0 is the ship’s trajectory detected by radar, and AIS trajectory 0 is the ship’s trajectory received by AIS receiver. Figure 2b shows the AIS closing behavior during navigation. After the AIS device of the ship is closed, the AIS receiver cannot receive the data transmitted by the ship, the AIS trajectory is interrupted, as shown by AIS trajectory 0 in Figure 2b, the radar can still detect the ship that is sailing, and the radar trajectory continues to be generated, as shown by radar trajectory 0 in Figure 2b. Figure 2c shows the MMSI spoofing behavior during navigation. As the ship’s MMSI has been changed, two AIS trajectories are generated during the ship’s navigation, as shown by AIS trajectory 0 and AIS trajectory 1 in Figure 2c, the MMSI spoofing behavior has no effect on the radar, the trajectory detected by the radar is still the actual trajectory of the ship, as shown by radar trajectory 0 in Figure 2c. Through the analysis of AIS closing behavior and MMSI spoofing behavior, we find that it is difficult to detect the above two behaviors only by using AIS data; however, this problem can be solved by comparing radar trajectory with the associated AIS trajectory.

3. AIS Closing Detection Algorithm

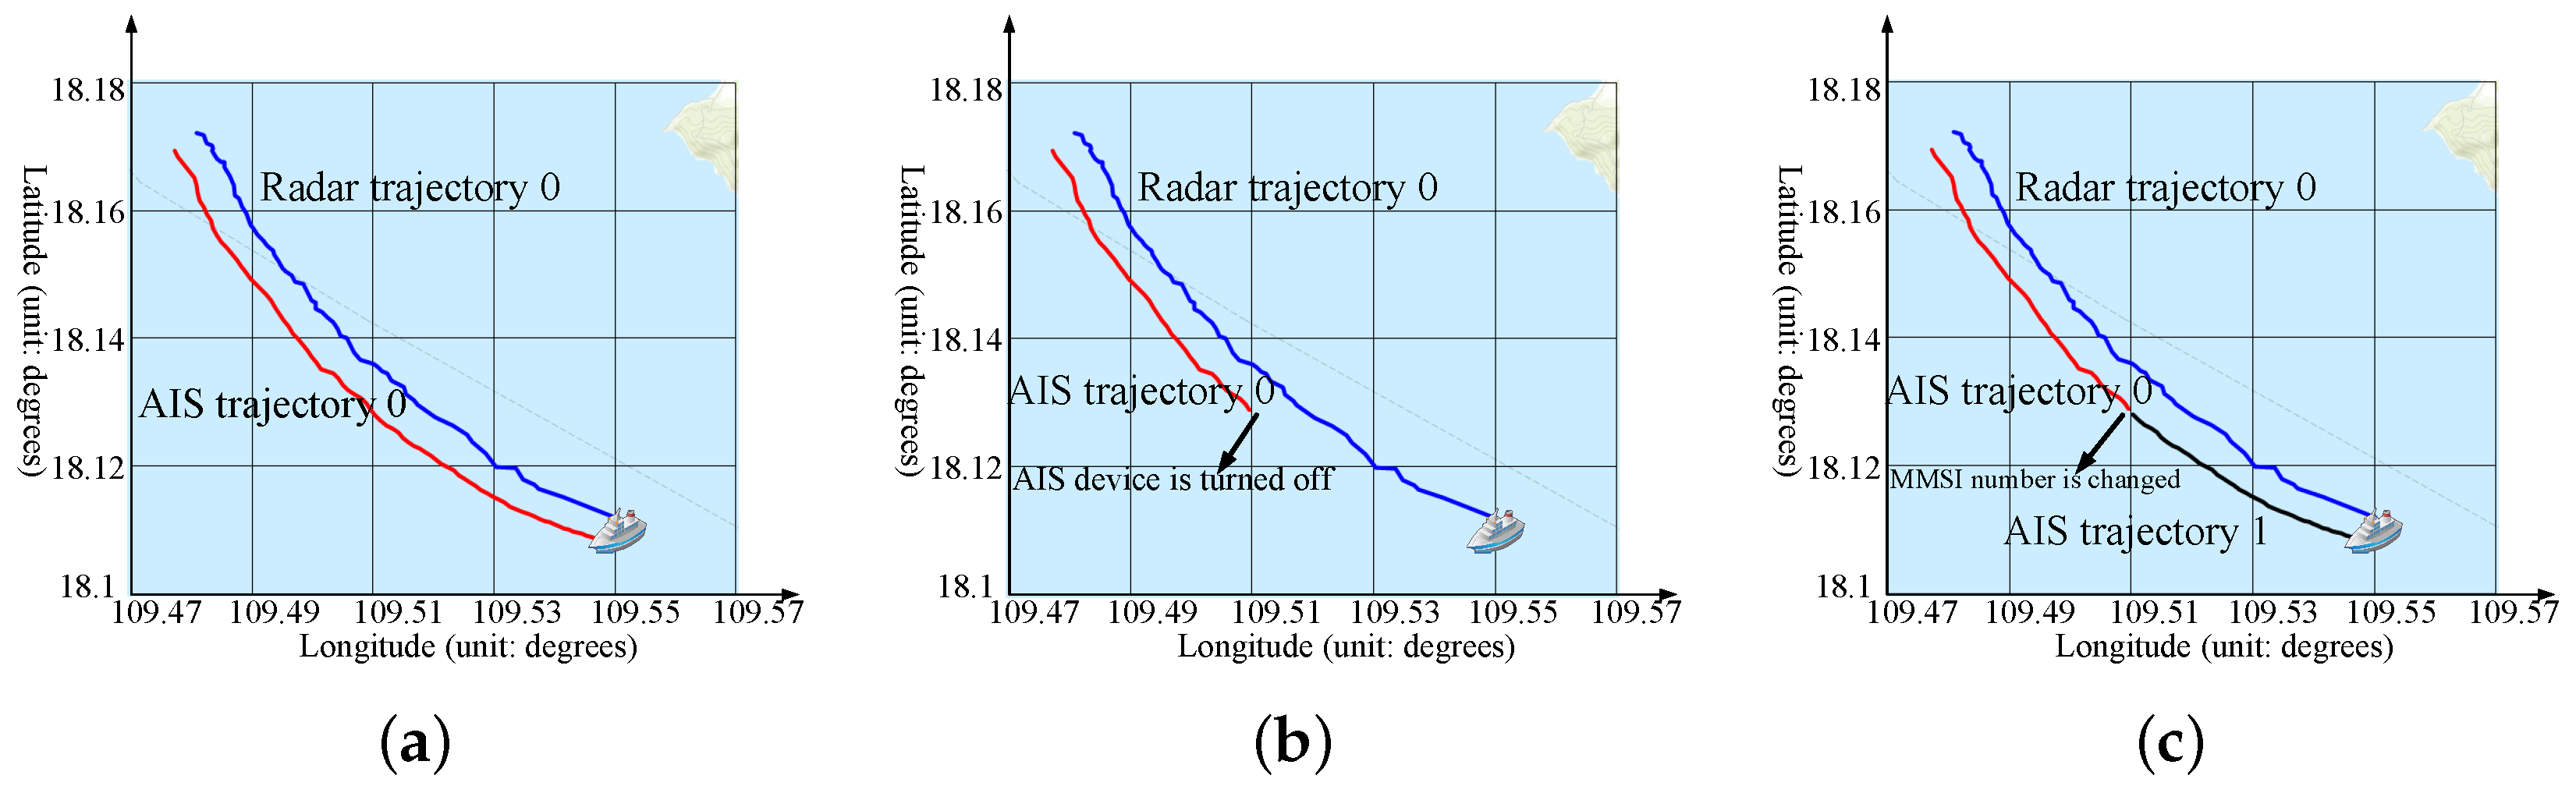
When a ship closes its AIS device, its AIS trajectory will be interrupted, and the range of the AIS trajectory will be smaller than the range of the ship’s real trajectory. Therefore, the AIS closing behavior can be detected by comparing the AIS trajectory range with the ship’s real trajectory range. The formula of trajectory range is as follows.
R a n g e ( t r a j e c t o r y ) = D i s t a n c e ( m a x P o i n t , m i n P o i n t )
In the formula, the longitude and latitude of m a x P o i n t are the maximum longitude and maximum latitude in the trajectory, and the longitude and latitude of m i n P o i n t are the minimum longitude and minimum latitude in the trajectory. D i s t a n c e refers to the distance between two points expressed in latitude and longitude.
If the radar can detect the ship before and after the AIS device is closed, the radar trajectory can be considered to some extent as real trajectory. Therefore, it is feasible to detect the AIS closing behavior by comparing the AIS trajectory with the radar trajectory. Because there are many ships in a certain sea area, many radar trajectories and AIS trajectories will be generated. Therefore, the difficulty of the research is determining the radar trajectory and the AIS trajectory generated by the same ship at the same time period, that is, to determine the associated relationship between the radar trajectory and the AIS trajectory. When the ship has AIS closing behavior, the AIS trajectory is changed, and the radar trajectory is not affected. Therefore, the radar trajectory is used as a reference when determining the associated relationship. Algorithm 1 is the pseudocode of the AIS closing detection algorithm.
When looking for the associated trajectory of the radar trajectory, first, the radar trajectory is traversed to find the associated AIS point for each radar point. Due to the large number of AIS points, the search scope needs to be reduced, in this process, the start time and end time of the radar trajectory need to be acquired, which is represented by s t a r t T i m e and e n d T i m e , respectively, AIS points with timestamps between ( s t a r t T i m e t i m e I n t e r v a l ) and ( e n d T i m e + t i m e I n t e r v a l ) are considered candidate AIS points, t i m e I n t e r v a l is the set time interval (line 1, and line 2 in Algorithm 1). When judging whether two trajectory points are associated points, in addition to considering the distance between them, the directions of the two corresponding trajectories at the two points should also be considered. For example, as shown in Figure 3, take R _ P o i n t 2 in the radar trajectory as an example, if only the distance between the trajectory points is considered, A 0 _ P o i n t 1 in trajectory AIS0 should be the associated AIS point of R _ P o i n t 2 . However, the direction of trajectory AIS0 at A 0 _ P o i n t 1 is significantly different from the direction of the radar trajectory at R _ P o i n t 2 , the two points are not generated by the same ship. Therefore, when looking for associated AIS point, the directions of trajectories at trajectory points should be considered.
To avoid the influence of detection error, the Direction of a TRajectory At a certain Point (D-TRAP) is defined as the direction of the vector from the first point successfully associated in the trajectory to the certain point. When determining whether the trajectory point P c o m p a r e is the associated point of point P in trajectory T R , the D-TRAP of T R at P needs to be computed, and the formula can be expressed as D - T R A P ( T R , P , P c o m p a r e ) = A n g l e ( t h e u n i t n o r t h v e c t o r c l o c k w i s e r o t a t i o n P f i r s t _ c o m p a r e P ) . In the paper, D-TRAP is computed when determining whether two trajectory points are associated, that is, D-TRAP occurs in pairs. To improve the accuracy, when computing the D-TRAP value of trajectory T R at point P, in addition to T R and P, the point P c o m p a r e to be compared with P also needs to be considered. According to P c o m p a r e , the trajectory T R c o m p a r e to which it belongs can be obtained, P f i r s t _ c o m p a r e is the first point associated with T R c o m p a r e in T R , the angle of clockwise rotation from the north direction to the vector P f i r s t _ c o m p a r e P is the D-TRAP value of T R at P when compared with P c o m p a r e . For example, in Figure 3, the associated point of R _ P o i n t 0 is A 1 _ P o i n t 0 , and the associated point of R _ P o i n t 1 is A 0 _ P o i n t 0 . Next, the associated point of R _ P o i n t 2 needs to be found. When judging whether A 0 _ P o i n t 1 is its associated point, first the direction of trajectory AIS0 at A 0 _ P o i n t 1 needs to be computed, the first point associated with the radar trajectory in trajectory AIS0 is A 0 _ P o i n t 0 , the direction of the vector from A 0 _ P o i n t 0 to A 0 _ P o i n t 1 is the direction of trajectory AIS0 at A 0 _ P o i n t 1 , this direction is represented by the angle of clockwise rotation from the north direction to the vector, as indicated by angle A in Figure 3. Then, the direction of the radar trajectory at R _ P o i n t 2 at this time needs to be computed, as A 0 _ P o i n t 1 to be judged belongs to trajectory AIS0, and the first point associated with trajectory AIS0 in the radar trajectory is R _ P o i n t 1 , the direction of the vector from R _ P o i n t 1 to R _ P o i n t 2 is the direction of the radar trajectory at R _ P o i n t 2 at this time, as indicated by angle B in Figure 3, angle A and angle B are significantly different, so A 0 _ P o i n t 1 is not the associated point of R _ P o i n t 2 .
At this time, the next candidate point A 1 _ P o i n t 2 is judged whether it is the associated point of R _ P o i n t 2 . Similarly, the direction of trajectory AIS1 at A 1 _ P o i n t 2 needs to be computed, the first point associated with the radar trajectory in trajectory AIS1 is A 1 _ P o i n t 0 , the direction of the vector from A 1 _ P o i n t 0 to A 1 _ P o i n t 2 is the desired direction, as indicated by angle D in Figure 3. Then, the direction of the radar trajectory at R _ P o i n t 2 at this time needs to be computed, as A 1 _ P o i n t 2 to be judged belongs to trajectory AIS1, and the first point associated with trajectory AIS1 in the radar trajectory is R _ P o i n t 0 , the direction of the vector from R _ P o i n t 0 to R _ P o i n t 2 is the desired direction, as indicated by angle C in Figure 3, angle C and angle D are basically equal, and the distance between A 1 _ P o i n t 2 and R _ P o i n t 2 is the smallest, therefore, A 1 _ P o i n t 2 is the associated point of R _ P o i n t 2 .
According to the above process, as the AIS points to be judged belong to different AIS trajectories, and the first radar point associated with the different AIS trajectories may not be the same, the direction of the radar trajectory at the same point may change with the different AIS points to be judged; this also applies to the direction of the AIS trajectory at the same point.
In line 3 with Algorithm 1, the primary key of a s s o c i a t e d M a p is the AIS trajectory ID, and the value is the number of associated AIS points from the corresponding AIS trajectory. The primary key of a s s o c i a t e d R a d a r M a p is the AIS trajectory ID, the value is the sequence of radar points associated with the corresponding AIS trajectory, a s s o c i a t e d R a d a r M a p is mainly used to compute the direction of the radar trajectory at a certain radar point. The primary key of a s s o c i a t e d A I S M a p is the AIS trajectory ID, and the value is the sequence of AIS points associated with the radar trajectory in the corresponding AIS trajectory, a s s o c i a t e d A I S M a p is mainly used to compute the direction of the AIS trajectory at a certain AIS point.
After defining the D-TRAP, the associated AIS point of each point in the radar trajectory can be found in the candidate AIS points. For each radar point, when determining whether a candidate AIS point is its associated point, first, the AIS trajectory to which the candidate AIS point belongs is recorded, and this AIS trajectory is called belonging AIS trajectory. Then, the first point associated with the radar trajectory in the belonging AIS trajectory and the first point associated with the belonging AIS trajectory in the radar trajectory are obtained. Next, the direction of the belonging AIS trajectory at the candidate AIS point and the direction of the radar trajectory at the current radar point are computed, if the difference is small enough, that is, the two directions are basically the same, the distance between the candidate AIS point and the current radar point is computed. If the distance is the shortest distance and meets the set threshold, the candidate AIS point is regarded as the associated AIS point of the current radar point, and update associatedMap, associatedRadarMap, associatedAISMap (lines 4–12 in Algorithm 1).
When all associated AIS points of the radar trajectory have been found, a s s o c i a t e d M a p is sorted by value from big to small, and the AIS trajectory with the largest number of associated AIS points is used as the primary associated trajectory of the radar trajectory (line 13 and line 14 in Algorithm 1). At this time, the timestamp of the earliest AIS point associated with the radar trajectory in the primary associated trajectory is obtained, and the range of the primary associated trajectory after the timestamp is computed, and the result is used as the AIS trajectory range of the ship. Similarly, the timestamp of the earliest radar point associated with the primary associated AIS trajectory in the radar trajectory is obtained, the range of the radar trajectory after the timestamp is computed, and the result is used as the radar trajectory range of the ship (lines 15–18 in Algorithm 1). If the ratio of the AIS trajectory range to the radar trajectory range is less than t h r e s h o l d , it means that the AIS trajectory is interrupted and the corresponding ship has AIS closing behavior (lines 19–21 in Algorithm 1).
Algorithm 1 AIS closing detection algorithm.
Input: Radar Trajectory, R T ; Parameter when searching for candidate AIS points, t i m e I n t e r v a l ; threshold to determine whether AIS closing behavior occurs, t h r e s h o l d .
Output: AIS trajectory ID with AIS closing behavior.
1: s t a r t T i m e , e n d T i m e a c q u i r e S t a r t A n d E n d T i m e ( R T )
2: c a n A I S L i s t s e a r c h C a n A I S P t s ( s t a r t T i m e , e n d T i m e , t i m e I n t e r v a l )
3:Create associatedMap, associatedRadarMap, associatedAISMap.
4:for each radar point r a d a r P t in R T do
5:     a s s A I S P t f i n d A s s o A I S P t ( c a n A I S L i s t , r a d a r P t , a s s o c i a t e d R a d a r M a p , a s s o c i a t e d A I S M a p )
6:    if a s s A I S P t is not null then
7:         t r a j e c t o r y I d a s s A I S P t . t r a j e c t o r y I d
8:        Update a s s o c i a t e d M a p
9:        Update a s s o c i a t e d R a d a r M a p
10:        Update a s s o c i a t e d A I S M a p
11:    end if
12:end for
13:Sort a s s o c i a t e d M a p by value from big to small.
14: p r i A I S T r I d g e t P r i K e y ( a s s o c i a t e d M a p )
15: a i s S t a r t T i m e g e t A I S S t a r t T i m e ( a s s o c i a t e d A I S M a p , p r i A I S T r I d )
16: r a d a r S t a r t T i m e g e t R a d a r S t a r t T i m e ( a s s o c i a t e d R a d a r M a p , p r i A I S T r I d )
17: A I S T r a R a n g e c o m p u t e A I S T r a R a n g e ( p r i A I S T r I d , a i s S t a r t T i m e )
18: r a d a r T r a R a n g e c o m p u t e R a d a r T r a R a n g e ( R T , r a d a r S t a r t T i m e )
19:if A I S T r a R a n g e / r a d a r T r a R a n g e < t h r e s h o l d then
20:    Print out AIS trajectory ID with AIS closing behavior: p r i A I S T r I d .
21:end if

4. MMSI Spoofing Detection Algorithm

As the generation of the AIS trajectory is based on the MMSI number, if the ship changes the MMSI number in the AIS data during navigation, two different AIS trajectories will be generated before and after the MMSI spoofing, and the two AIS trajectories do not overlap in time, so the MMSI spoofing detection algorithm can be designed based on these features. The pseudocode of the algorithm is shown in Algorithm 2.
Algorithm 2 MMSI spoofing detection algorithm.
Input: Radar Trajectory, R T ; Parameter when searching for candidate AIS points, t i m e I n t e r v a l ; threshold to determine whether MMSI spoofing behavior occurs, t h r e s h o l d .
Output: AIS trajectory ID before MMSI spoofing, and AIS trajectory ID after MMSI spoofing.
1: s t a r t T i m e , e n d T i m e a c q u i r e S t a r t A n d E n d T i m e ( R T )
2: c a n A I S L i s t s e a r c h C a n A I S P t s ( s t a r t T i m e , e n d T i m e , t i m e I n t e r v a l )
3:Create associatedMap, associatedRadarMap, associatedAISMap.
4:for each radar point r a d a r P t in R T do
5:     a s s A I S P t f i n d A s s o A I S P t ( c a n A I S L i s t , r a d a r P t , a s s o c i a t e d R a d a r M a p , a s s o c i a t e d A I S M a p )
6:    if a s s A I S P t is not null then
7:         t r a j e c t o r y I d a s s A I S P t . t r a j e c t o r y I d
8:        Update a s s o c i a t e d M a p
9:        Update a s s o c i a t e d R a d a r M a p
10:        Update a s s o c i a t e d A I S M a p
11:    end if
12:end for
13:Sort a s s o c i a t e d M a p by value from big to small.
14: p r i A I S T r I d g e t P r i K e y ( a s s o c i a t e d M a p )
15:for each AIS trajectory ID A I S T r I d in the sorted a s s o c i a t e d M a p do
16:    if i s I n d e p e n d e n t ( A I S T r I d , p r i A I S T r I d ) then
17:        if trajectory A I S T r I d is earlier than trajectory p r i A I S T r I d then
18:              b e f o r e A I S I d A I S T r I d ;
19:              a f t e r A I S I d p r i A I S T r I d ;
20:        else
21:              b e f o r e A I S I d p r i A I S T r I d ;
22:              a f t e r A I S I d A I S T r I d ;
23:        end if
24:        Break;
25:    end if
26:end for
27:if b e f o r e A I S I d is not null then
28:     a i s S t a r t T i m e g e t A I S S t a r t T i m e ( a s s o c i a t e d A I S M a p , b e f o r e A I S I d )
29:     r a d a r S t a r t T i m e g e t R a d a r S t a r t T i m e ( a s s o c i a t e d R a d a r M a p , b e f o r e A I S I d )
30:     A I S T r a R a n g e c o m p u t e A I S T r a R a n g e ( b e f o r e A I S I d , a i s S t a r t T i m e )
31:     r a d a r T r a R a n g e c o m p u t e R a d a r T r a R a n g e ( R T , r a d a r S t a r t T i m e )
32:    if A I S T r a R a n g e / r a d a r T r a R a n g e < t h r e s h o l d then
33:        AIS trajectory ID before MMSI spoofing: b e f o r e A I S I d , and AIS trajectory ID after MMSI spoofing: a f t e r A I S I d .
34:    end if
35:end if
In the MMSI spoofing detection algorithm, it is also necessary to find the associated AIS point of each point in the radar trajectory, all associated AIS points are counted according to their belonging AIS trajectories, and these associated AIS trajectories are sorted according to the number of associated AIS points. The AIS trajectory with the largest number of associated AIS points is used as the primary associated trajectory of the radar trajectory, these steps are the same as the corresponding part in the AIS closing detection algorithm (lines 1–14 in Algorithm 2). After obtaining the primary associated AIS trajectory, the AIS trajectory that is independent of the primary associated AIS trajectory in time needs to be found from the associated AIS trajectories, and this AIS trajectory is named the independent AIS trajectory. If the independent AIS trajectory exists, the chronological order of the independent AIS trajectory and the primary associated AIS trajectory need to be determined, the earlier trajectory is recorded as b e f o r e A I S I d , and the later trajectory is recorded as a f t e r A I S I d (lines 15–26 in Algorithm 2). Then, it is determined whether trajectory b e f o r e A I S I d has AIS closing behavior, and this process is consistent with the corresponding part in the AIS closing detection algorithm. If the trajectory has AIS closing behavior, it means that trajectory b e f o r e A I S I d is interrupted, and the corresponding radar trajectory is still continuing. It is known that trajectory a f t e r A I S I d appears after the end of trajectory b e f o r e A I S I d , and trajectory a f t e r A I S I d is also the associated trajectory of the radar trajectory. At this time, it can be judged that the corresponding ship has MMSI spoofing behavior, trajectory b e f o r e A I S I d is the trajectory generated before MMSI spoofing, and trajectory a f t e r A I S I d is the trajectory generated after MMSI spoofing (lines 27–35 in Algorithm 2).

5. Case Study

5.1. Dataset

The experiment mainly uses two datasets. The first dataset is real AIS data and real radar data. The second data set is real AIS data, and radar data generated based on these AIS data.

5.1.1. Real AIS Data and Real Radar Data

Real AIS data and real radar data were collected in the sea area near Sanya, China from 4 January 2017 to 6 January 2017. These data were collected by inverse synthetic aperture radar and land-based AIS receiver built on land. The inverse synthetic aperture radar can actively obtain the position, radial speed, and other data of moving targets. The land-based AIS receiver can accept AIS data sent by AIS devices on ships. In this dataset, there are 412,786 AIS points and 95,823 radar points. The area where the data is collected is shown by the red rectangle in Figure 4a. Its longitude range is [108.9689, 110.3278] and latitude range is [17.7792, 18.3998].
Based on these points, a total of 1113 AIS trajectories and 794 radar trajectories are generated. According to the definition of trajectory range in Chapter 3, the average range of AIS trajectories is 8594 meters and the average range of radar trajectories is 1754 meters. Histograms of the radar trajectory range and the AIS trajectory range are shown in Figure 4b and Figure 4c, respectively. From the two histograms, it can be seen that the ranges of most radar trajectories are within 5000 meters, and the ranges of most AIS trajectories are within 20,000 meters. The ranges of the radar trajectories are generally smaller than the ranges of the AIS trajectories, which is caused by the insufficient detection capability of the radar used in the experiment.

5.1.2. Real AIS Data and Simulated Radar Data

During the data collection process, due to the limitation of radar detection capability, the amount of effective radar data obtained is small. Therefore, to further verify the effectiveness of the algorithms proposed in this paper, in addition to the real radar data, some radar data are also generated through a radar simulation program based on real AIS data. The radar simulation program simulates the working process of the radar. In the simulation program, the minimum scanning angle of the radar is 61.7, the maximum scanning angle is 307.6, and the radar scans 5 degrees per second. When scanning to the boundary, the scanning direction is changed. The specific steps are as follows.
(1) The current time is represented by c u r r e n t T i m e , and the current angle of the radar is represented by c u r r e n t D e g r e e .
(2) The AIS data are organized into trajectories, for each AIS trajectory, a new AIS point is generated based on the two points of the trajectory before and after the current time. Each attribute of the new AIS point is a weighted sum of the corresponding attributes of the two points, and the weight of the point closer to the current time is greater.
(3) The angle between the new AIS point and the radar is computed. If the difference between the angle and c u r r e n t D e g r e e is less than the set threshold, a radar point is generated based on the new AIS point, the position of the radar point is the position of the new AIS point plus random noise. The distance between the radar and the radar point is computed, if the distance is within the radar scanning range, it means that the generated radar point meets the requirements and saves it.
(4) c u r r e n t T i m e and c u r r e n t D e g r e e are updated. Continue (1)–(4) until the c u r r e n t T i m e is greater than the set threshold or the timestamps of all AIS trajectory points.
These AIS data used to generate radar data were collected in the sea area near Sanya, China from 1 January 2017 to 3 January 2017. Through the radar simulation program, a total of 25,225 effective radar points were generated.

5.2. Evaluation of Algorithms

In the experiment, F1 score is used to evaluate the AIS closing detection and MMSI spoofing detection algorithms. The formula of F1 score is as follows.
F 1 = 2 P R P + R
Among them, P is precision, P = T P T P + F P , R is recall, and R = T P T P + F N . It can be seen from the formula that the F1 score takes precision and recall into consideration, which can evaluate the algorithms more comprehensively.
In the evaluation of the AIS closing detection algorithm, T P indicates that the AIS trajectory generated by the ship that close the AIS transponder is detected to have AIS closing behavior, F P indicates that the AIS trajectory generated by the ship that do not close the AIS transponder is detected to have AIS closing behavior, and F N indicates that the AIS trajectory generated by the ship that close the AIS transponder is not detected to have AIS closing behavior. In the specific use process, it is known that the number of trajectories with AIS closing behavior is N _ c l o s e . Assuming that the number of trajectories with AIS closing behavior detected by the AIS closing detection algorithm is D _ c l o s e , and the number of correctly detected trajectories is C _ c l o s e , T P = C _ c l o s e , F P = D _ c l o s e C _ c l o s e , FN = N _ c l o s e C _ c l o s e .
In the MMSI spoofing detection algorithm, the correct detection of MMSI spoofing mainly includes two parts, one is that the MMSI spoofing behavior is found, and the other is that the trajectory ID after MMSI spoofing is correctly detected. In the evaluation of the MMSI spoofing detection algorithm, T P indicates that the AIS trajectory with MMSI spoofing is detected correctly, F P indicates that the detected MMSI spoofing behavior does not conform to the real MMSI spoofing behavior, and F N indicates that the AIS trajectory with MMSI spoofing is not detected correctly. In the specific use process, it is known that the number of trajectories with MMSI spoofing behavior is N _ s p o o f . Assuming that the number of trajectories with MMSI spoofing behavior detected by the MMSI spoofing detection algorithm is D _ s p o o f , and the number of correctly detected trajectories is C _ s p o o f . Similarly, T P = C _ s p o o f , F P = D _ s p o o f C _ s p o o f , F N = N _ s p o o f C _ s p o o f .

5.3. AIS Closing Detection Experiment

5.3.1. Simulation of AIS Closing Behavior

In the experiment, AIS closing behavior should be simulated. Due to the limitation of radar detection capability, on the one hand, the AIS trajectory often lasts for a period of time before it is associated with the radar trajectory, as the lack of associated relationship, the trajectories before association are meaningless to our research, therefore, only the trajectories after association are studied, as shown in Figure 5; on the other hand, when the ship is sailing normally, the range of the primary associated AIS trajectory after association is larger than the range of the radar trajectory after association, that is, there is no AIS closing behavior. Therefore, to simulate the AIS closing behavior, the primary associated AIS trajectory needs to be truncated, that is, the ship closes the AIS device at the truncation time of the AIS trajectory. Truncation ratio is expressed by t r _ r a t i o , t r _ r a t i o = A I S _ r a n g e r a d a r _ r a n g e , among them, r a d a r _ r a n g e is the range of the radar trajectory after association and A I S _ r a n g e is the range of the AIS trajectory between association and the truncation time, as shown in Figure 5. The AIS trajectory points after truncation time are deleted, so that the AIS closing behavior is simulated, and by changing the value of t r _ r a t i o , the behavior of the ship closing the AIS device at different times can be simulated. The simulation steps are as follows.
(1) A new AIS trajectory named t e m p _ A I S T r a is created. The points of the AIS trajectory are added to t e m p _ A I S T r a in order starting from the earliest AIS point associated with the radar trajectory.
(2) The range of t e m p _ A I S T r a is computed, and the result is represented by a i s _ r a n g e . If a i s _ r a n g e < t r _ r a t i o r a d a r _ r a n g e , new AIS point needs to be added to t e m p _ A I S T r a , and if a i s _ r a n g e t r _ r a t i o r a d a r _ r a n g e , the newly added AIS point need to be deleted from t e m p _ A I S T r a .
(3) The timestamp of the last point in t e m p _ A I S T r a is obtained, and the timestamp is represented by l a s t P t T i m e .
(4) Points in the AIS trajectory that are later than l a s t P t T i m e are deleted, that is, the ship generating the AIS trajectory closed the AIS device at l a s t P t T i m e .
Through the above steps, the AIS closing behavior can be simulated. At this time, the range of the truncated AIS trajectory is less than t r _ r a t i o r a d a r _ r a n g e , and it is the AIS trajectory with the largest range under this condition.
If the threshold for detecting AIS closing behavior is set to a value greater than or equal to t r _ r a t i o (in this experiment, the threshold is set equal to t r _ r a t i o ), the simulated AIS closing behavior can be detected according to Algorithm 1. In this experiment, we set t r _ r a t i o to 95%, 90%, 85%, 80%, 75%, 70%, 65%, 60%, 55%, 50%, 45%, 40%, 35%, 30%, 25%, 20%, 15%, 10%, and 5%, respectively, to evaluate the performance of AIS closing detection algorithm under different truncation ratios. The effect of simulating AIS closing behavior is shown in Figure 6, the blue lines are radar trajectories, and the red lines are AIS trajectories, for the convenience of explanation, the trajectories in Figure 6 are the trajectories that can be effectively associated. Figure 6a shows the AIS trajectories and radar trajectories of ships during normal navigation. Figure 6b shows the AIS trajectories and radar trajectories when t r _ r a t i o is 80%. At this time, the range of the AIS trajectory is less than 80% of the range of the corresponding radar trajectory, that is, the ship turns off the AIS device when the range of the AIS trajectory is about to reach 80% of the range of the corresponding radar trajectory. Figure 6c shows the AIS trajectories and radar trajectories when t r _ r a t i o is 40%. The figures of other truncation ratios are not listed here.

5.3.2. Experimental Results

In the AIS closing detection experiment, the two datasets mentioned above are used, the first dataset contains real AIS data and real radar data, among them, 50 AIS trajectories that can be identified as the primary associated AIS trajectories are used for the experiment, and the second dataset contains real AIS data and simulated radar data, among them, 100 AIS trajectories that can be identified as the primary associated AIS trajectories are used for the experiment. First, the primary associated AIS trajectory is truncated according to different ratios, that is, the behavior of the ship closing AIS device at different times is simulated, and then the performance of the AIS closing detection algorithm at different truncation ratios is tested. The experimental results are shown in Table 1; the numbers without brackets are the test results of the first dataset, and the numbers with brackets are the test results of the second dataset.
The trend of F1 scores of the AIS closing detection algorithm under different truncation ratios is shown in Figure 7. Among them, the horizontal axis represents the truncation ratio and the vertical axis represents the F1 score. The blue line is the trend of the F1 scores of the algorithm in the first dataset, and the red line is the trend of the F1 scores of the algorithm in the second dataset.

5.3.3. Result Analysis

As can be seen from Table 1 and Figure 7, when t r _ r a t i o 55 % , the F1 scores of the AIS closing detection algorithm are all greater than 0.8, the algorithm has good performance. The F1 score of the algorithm decreases as t r _ r a t i o decreases. This is because if t r _ r a t i o is small, that is, the range of the remaining AIS trajectory is small, which means that the AIS device of the ship is closed prematurely, and the number of corresponding AIS points will also be small. This may result in the AIS trajectory not being recognized as the primary associated trajectory, and it is impossible to detect whether the ship generating the AIS trajectory has AIS closing behavior. Therefore, when using this algorithm to detect the AIS closing behavior, the range of the AIS trajectory after association cannot be too small, that is, the process of the ship being monitored by the radar and AIS at the same time should last for a period of time.

5.4. MMSI Spoofing Detection Experiment

5.4.1. Simulation of MMSI Spoofing Behavior

In the experiment, MMSI spoofing behavior should also be simulated. AIS points with different MMSI numbers will generate different AIS trajectories: the AIS trajectories generated before and after MMSI spoofing are different. Therefore, the primary associated AIS trajectory can be truncated into two parts to simulate the MMSI spoofing behavior, the trajectory ID in the first half is unchanged, and the trajectory ID in the second half is changed to a new trajectory ID, that is, the ship has MMSI spoofing behavior at the truncation time of the AIS trajectory, the second half of the trajectory is the trajectory generated by AIS points after MMSI spoofing.
The steps for simulating MMSI spoofing behavior are similar to the steps for simulating AIS closing behavior, except that the last step is different. In the simulation program, instead of deleting the points in the AIS trajectory later than l a s t P t T i m e , the trajectory ID to which these trajectory points belong is updated to a new trajectory ID, In other words, the ship performed MMSI spoofing at l a s t P t T i m e , and the AIS points after l a s t P t T i m e generated a new AIS trajectory. Similarly, in this experiment, we also set t r _ r a t i o to 95%, 90%, 85%, 80%, 75%, 70%, 65%, 60%, 55%, 50%, 45%, 40%, 35%, 30%, 25%, 20%, 15%, 10%, and 5%, respectively, to simulate the MMSI spoofing behavior of the ship at different times. The effect of simulating MMSI spoofing behavior is shown in Figure 8, the blue lines are radar trajectories, the red lines are the AIS trajectories before MMSI spoofing, and the black lines are the AIS trajectories after MMSI spoofing, for the convenience of explanation, the trajectories in Figure 8 are the trajectories that can be effectively associated. Figure 8a shows the AIS trajectories and radar trajectories of ships during normal navigation. Figure 8b shows the radar trajectories and the AIS trajectories before and after MMSI spoofing when t r _ r a t i o is 80%. At this time, the range of the AIS trajectory before MMSI spoofing is less than 80% of the range of the corresponding radar trajectory, that is, the ship performs the MMSI spoofing behavior when the range of the AIS trajectory is about to reach 80% of the range of the corresponding radar trajectory, and a new AIS trajectory is generated based on the AIS points after MMSI spoofing. Figure 8c shows the radar trajectories and the AIS trajectories before and after MMSI spoofing when t r _ r a t i o is 40%. The figures of other truncation ratios are not listed here.

5.4.2. Experimental Results

In the experiment, the two datasets mentioned above are also used. First, the primary associated AIS trajectory is truncated according to different ratios, and the trajectory ID in the second half is changed to a new trajectory ID, that is, the MMSI spoofing behavior of the ship at different times is simulated. Then, the performance of the MMSI spoofing detection algorithm at different truncation ratios is tested. The experimental results are shown in Table 2; the numbers without brackets are the test results of the first dataset, and the numbers with brackets are the test results of the second dataset.
The trend of F1 scores of the MMSI spoofing detection algorithm under different truncation ratios is shown in Figure 9. Among them, the horizontal axis represents the truncation ratio, the vertical axis represents the F1 score. The blue line is the trend of the F1 scores of the algorithm in the first dataset, the red line is the trend of the F1 scores of the algorithm in the second dataset.

5.4.3. Result Analysis

As can be seen from Table 2 and Figure 9, in the first dataset containing real AIS data and real radar data, when t r _ r a t i o is between 65% and 25%, the F1 scores are all greater than 0.8, and the algorithm has good performance. When t r _ r a t i o is greater than 65%, the F1 score of the algorithm decreases as t r _ r a t i o increases, and when t r _ r a t i o is less than 25%, the F1 score decreases as t r _ r a t i o decreases. In the second dataset containing real AIS data and simulated radar data, the F1 score of the algorithm has a similar trend.
This is because when t r _ r a t i o is small, the range of the AIS trajectory before MMSI spoofing that can be associated with the radar trajectory is small, and the number of corresponding AIS points is also small. When looking for associated AIS points of the radar trajectory, due to the influence of noise and AIS points of other ships, these AIS points may not be considered as the associated points, and the AIS trajectory generated before MMSI spoofing is not considered as the associated trajectory. This will result in the inability to find two AIS trajectories that are independent in time, and thus the MMSI spoofing behavior cannot be detected. Similarly, when t r _ r a t i o is large, the range of the AIS trajectory after MMSI spoofing that can be associated with the radar trajectory is small, and the corresponding number of AIS points is also small, and therefore the AIS trajectory generated after MMSI spoofing may not be considered as the associated trajectory, and the MMSI spoofing behavior cannot be detected. Therefore, when detecting MMSI spoofing behavior, the ship needs to be monitored by AIS and radar at the same time before and after MMSI spoofing, and both monitoring processes need to continue for a period of time.

5.5. Discussion on the Impact of AIS Packet Loss on the Algorithm

During the transmission of AIS data packets from the AIS device on the ship to the land-based AIS receiver, packet loss may occur. To test the impact of AIS packet loss on the algorithms, we delete each trajectory point in the AIS trajectory with a probability of p _ l o s s , so as to simulate the situation where the packet loss rate increases p _ l o s s , p _ l o s s is set to 5%, 10%, 15%, 20%, and 25%, respectively. As the internal mechanism of the AIS closing detection algorithm and the MMSI spoofing detection algorithm are the same, the AIS closing detection algorithm is used as an example to test the performance of the algorithm under different packet loss probabilities. In the experiment, the first dataset containing real radar data and AIS data is used. When simulating AIS closing behavior, t r _ r a t i o is set to 80%, 60%, 40%, and 20%, respectively. Similarly, the F1 score is used to evaluate the performance of the algorithm. The experimental results are shown in Table 3.
It can be known from Table 3 that when p _ l o s s 15 % , the F1 scores of the algorithm under each t r _ r a t i o drop by 0.06 at most, that is, when the packet loss rate of the AIS data increases within 15%, the performance of the algorithm is relatively stable and has a certain anti-interference ability.

6. Discussion

This research focuses on the detection of AIS closing and MMSI spoofing during ship navigation. Before designing the corresponding algorithms, the associated relationship between AIS data and radar data needs to be determined. In the multi-ship scenario, this problem is difficult to solve, and when the ship has AIS closing behavior and MMSI spoofing behavior, the corresponding AIS data volume will be reduced, which makes the problem more difficult. Therefore, we introduce the concept of the D-TRAP. According to the aforementioned, this will improve the association accuracy between points, and accordingly, the association accuracy between radar trajectories and their primary associated AIS trajectories will also increase.
Here, we prove it experimentally. The experiment use 175 radar trajectories generated from simulated radar points, and three methods are used to find their associated AIS trajectories. The first two methods are to achieve trajectory association by finding associated AIS points of radar trajectory points, among them, the first is the method proposed in the paper (distance +D-TRAP), and the second is the method based only on distance (only distance). The third is the traditional trajectory association method by computing the distance between trajectories (trajectory-to-trajectory). The simulated radar points are generated based on the AIS points, the associated relationship between them is determined, and therefore the associated results can be measured.
In the experiment, we first obtain AIS trajectories corresponding to these 175 radar trajectories, and then truncate these AIS trajectories according to different ratios, so as to test the associated results of the three methods under different AIS data volumes. When truncating AIS trajectories, we define the truncation ratio as t r _ r a t i o = A I S L e f t _ R a n g e / A I S _ R a n g e , where A I S _ R a n g e is the range of the original AIS trajectory, and A I S L e f t _ R a n g e is the AIS trajectory range after truncation. In the experiment, we set t r _ r a t i o to 100%, 80%, 60%, 40%, and 20%, respectively. In the experiment, F1 score is used to evaluate the three trajectory association algorithms, among them, T P is the number of radar trajectories correctly associated, F P is the number of radar trajectories with incorrect association, and F N is the total number of radar trajectories minus T P . The experimental results are shown in Table 4.
According to Table 4, the F1 scores of the method proposed in this paper are all greater than or equal to the F1 scores of the method based only on distance, which shows that with the help of D-TRAP, the accuracy of the association between trajectory points can be improved. When the amount of AIS data is reduced ( 20 % t r _ r a t i o 80 % ), the proposed method has better performance than traditional trajectory association method, which shows that the proposed method has stronger robustness for reduction of effective AIS data. When a ship has AIS closing behavior and MMSI spoofing behavior, the number of corresponding AIS points will decrease. Therefore, it is necessary to use the method proposed in the paper when determining the associated relationship between trajectories.
Based on real data and simulation data, this research simulates the AIS closing behavior and MMSI spoofing behavior of ships at different times, and tests these two algorithms. The test results show that the AIS closing detection algorithm has good performance when the ship does not close the AIS device prematurely; when the ship does not perform the MMSI spoofing behavior too early or too late, the MMSI spoofing detection algorithm has good performance. The test results are consistent with the actual situation. When the ship closes the AIS device prematurely, the amount of AIS data of the ship is small, which will result in the failure to form an AIS trajectory, or it is difficult to obtain the associated relationship between the AIS trajectory and the radar trajectory. At this time, only the radar trajectory can be observed, the ship to which the radar trajectory belongs cannot be determined, and the AIS closing behavior of the ship cannot be detected. When the ship performs MMSI spoofing behavior prematurely, the number of AIS points of the ship before the MMSI spoofing is small, which may also lead to the failure to form an AIS trajectory, or the associated relationship between the AIS trajectory before MMSI spoofing and the radar trajectory is difficult to obtain. At this time, only the AIS trajectory after the MMSI spoofing and the corresponding radar trajectory can be associated, and the MMSI spoofing behavior of the ship cannot be detected. Similarly, when the ship performs MMSI spoofing behavior too late, only the AIS trajectory before the MMSI spoofing and the corresponding radar trajectory can be associated, which will also cause the MMSI spoofing behavior of the ship to be undetectable. Therefore, in the following research, when looking for the associated AIS points of radar points, the accuracy of the association can be improved by comparing other attributes of trajectory points, such as speed in trajectory point, so that the application range of the AIS closing detection algorithm and the MMSI spoofing detection algorithm can be expanded.
The research in this paper can be applied to the ship data service system of the maritime authority. The maritime authority can establish radar, AIS receiver, and other data acquisition devices to obtain multisensor data of ships within its jurisdiction. At this stage, the multisensor data in most ship data service systems is often isolated, and the systems do not take full advantage of the multisensor data to achieve functions that cannot be achieved by using single-sensor data. This paper mainly uses the radar data and AIS data of ships to detect AIS closing behavior and MMSI spoofing behavior through D-TRAP and related algorithms, and these two types of illegal behaviors are difficult to detect through single-sensor data.

7. Conclusions

This research focuses on the detection of AIS closing and MMSI spoofing in multi-ship scenario. In this research, the associated relationship between the radar trajectory and the AIS trajectory is determined based on the distance between trajectory points and the directions of trajectories at trajectory points, and the AIS closing detection algorithm and the MMSI spoofing detection algorithm are designed by establishing the associated AIS trajectory map of radar trajectory. This study simulates AIS closing behavior and MMSI spoofing behavior based on real and simulated data, and tests the two algorithms. The test results show that the algorithms proposed in this paper can detect AIS closing behavior and MMSI spoofing behavior under certain conditions.
In AIS spoofing, in addition to MMSI spoofing, there is also position spoofing, but in the multi-ship scenario, the AIS points after position spoofing will affect the determination of the associated relationship between the radar trajectory and the AIS trajectory. Therefore, in future research, to detect the position spoofing behavior in the multi-ship scenario, first, the trajectory can be partitioned into trajectory segments, and then the trajectory segment with a small range can be used as a reference to further determine the associated relationship between trajectories.

Author Contributions

Methodology, T.Z.; Writing—original draft preparation, T.Z.; Writing—review and editing, S.Z., B.C., J.C.; funding acquisition, S.Z. All authors have read and agreed to the published version of the manuscript.

Funding

This work is supported by Beijing Natural Science Foundation (Grant No. 4182042), Beijing Nova Program of Science and Technology (Grant No. Z191100001119031), National Key Research and Development Program of China (No. 2018YFB1003804), and National Natural Science Foundation of China (U1536111, U1536112).

Conflicts of Interest

The authors declare no conflicts of interest.

References

  1. Harati-Mokhtari, A.; Wall, A.; Brooks, P.; Wang, J. Automatic Identification System (AIS): Data reliability and human error implications. J. Navig. 2007, 60, 373–389. [Google Scholar] [CrossRef]
  2. Fiorini, M.; Capata, A.; Bloisi, D.D. AIS data visualization for Maritime Spatial Planning (MSP). Int. J. Navig. Marit. Econ. 2016, 5, 45–60. [Google Scholar] [CrossRef]
  3. Marzuki, M.I.; Gaspar, P.; Garello, R.; Kerbaol, V.; Fablet, R. Fishing gear identification from vessel-monitoring-system-based fishing vessel trajectories. IEEE J. Ocean. Eng. 2017, 43, 689–699. [Google Scholar] [CrossRef]
  4. Castaldo, F.; Palmieri, F.A.; Regazzoni, C.S. Bayesian analysis of behaviors and interactions for situation awareness in transportation systems. IEEE Trans. Intell. Transp. Syst. 2015, 17, 313–322. [Google Scholar] [CrossRef]
  5. Zhao, L.; Shi, G. Maritime Anomaly Detection using Density-based Clustering and Recurrent Neural Network. J. Navig. 2019, 72, 894–916. [Google Scholar] [CrossRef]
  6. Lei, P.R. A framework for anomaly detection in maritime trajectory behavior. Knowl. Inf. Syst. 2016, 47, 189–214. [Google Scholar] [CrossRef]
  7. Fu, P.; Wang, H.; Liu, K.; Hu, X.; Zhang, H. Finding abnormal vessel trajectories using feature learning. IEEE Access 2017, 5, 7898–7909. [Google Scholar] [CrossRef]
  8. De Vries, G.K.D.; Van Someren, M. Machine learning for vessel trajectories using compression, alignments and domain knowledge. Expert Syst. Appl. 2012, 39, 13426–13439. [Google Scholar] [CrossRef]
  9. Smith, J.; Nouretdinov, I.; Craddock, R.; Offer, C.; Gammerman, A. Conformal anomaly detection of trajectories with a multi-class hierarchy. In Proceedings of the International Symposium on Statistical Learning and Data Sciences, Egham, UK, 20–23 April 2015; pp. 281–290. [Google Scholar]
  10. Katsilieris, F.; Braca, P.; Coraluppi, S. Detection of malicious AIS position spoofing by exploiting radar information. In Proceedings of the 16th International Conference on Information Fusion, Istanbul, Turkey, 9–12 July 2013; pp. 1196–1203. [Google Scholar]
  11. Mazzarella, F.; Vespe, M.; Tarchi, D.; Aulicino, G.; Vollero, A. AIS reception characterisation for AIS on/off anomaly detection. In Proceedings of the 2016 19th International Conference on Information Fusion (FUSION), Heidelberg, Germany, 5–8 July 2016; pp. 1867–1873. [Google Scholar]
  12. Papi, F.; Tarchi, D.; Vespe, M.; Oliveri, F.; Borghese, F.; Aulicino, G.; Vollero, A. Radiolocation and tracking of automatic identification system signals for maritime situational awareness. IET Radar Sonar Navig. 2014, 9, 568–580. [Google Scholar] [CrossRef] [Green Version]
  13. Guo, S. Space-based detection of spoofing AIS signals using Doppler frequency. In Proceedings of the Multisensor, Multisource Information Fusion: Architectures, Algorithms, and Applications 2014, Baltimore, MD, USA, 6–7 May 2014; Volume 9121, p. 912108. [Google Scholar]
  14. Kontopoulos, I.; Spiliopoulos, G.; Zissis, D.; Chatzikokolakis, K.; Artikis, A. Countering Real-Time Stream Poisoning: An architecture for detecting vessel spoofing in streams of AIS data. In Proceedings of the 2018 IEEE 16th Intl Conf on Dependable, Autonomic and Secure Computing, 16th Intl Conf on Pervasive Intelligence and Computing, 4th Intl Conf on Big Data Intelligence and Computing and Cyber Science and Technology Congress (DASC/PiCom/DataCom/CyberSciTech), Athens, Greece, 12–15 August 2018; pp. 981–986. [Google Scholar]
  15. Varlamis, I.; Tserpes, K.; Etemad, M.; Júnior, A.S.; Matwin, S. A Network Abstraction of Multi-vessel Trajectory Data for Detecting Anomalies. In Proceedings of the EDBT/ICDT Workshops 2019, Lisbon, Portugal, 26–29 March 2019. [Google Scholar]
  16. Habtemariam, B.K.; Tharmarasa, R.; Meger, E.; Kirubarajan, T. Measurement level AIS/radar fusion for maritime surveillance. In Proceedings of the Signal and Data Processing of Small Targets 2012, Baltimore, MD, USA, 25–27 April 2012; Volume 8393, p. 83930I. [Google Scholar]
  17. Nikolic, D.; Stojkovic, N.; Popovic, Z.; Tosic, N.; Lekic, N.; Stankovic, Z.; Doncov, N. Maritime Over the Horizon Sensor Integration: HFSWR Data Fusion Algorithm. Remote Sens. 2019, 11, 852. [Google Scholar] [CrossRef] [Green Version]
  18. Kazimierski, W. Proposal of neural approach to maritime radar and automatic identification system tracks association. IET Radar Sonar Navig. 2016, 11, 729–735. [Google Scholar] [CrossRef]
  19. Zheng, J.C.; Wang, Y.; Lin, C.C.; Zhang, X.L.; Liu, J.; Ji, L.W. A fusion algorithm of target dynamic information for asynchronous multisensors. Microsyst. Technol. 2018, 24, 3995–4005. [Google Scholar] [CrossRef]
  20. Zhang, T.; Zhao, S.; Chen, J. Research on Ship Classification Based on Trajectory Association. In Proceedings of the International Conference on Knowledge Science, Engineering and Management, Athens, Greece, 28–30 August 2019; pp. 327–340. [Google Scholar]
Figure 1. (a) Automatic Identification System (AIS) points and radar points. (b) AIS trajectories and radar trajectories.
Remotesensing 12 00702 g001
Figure 2. (a) Normal navigation. (b) AIS closing behavior. (c) Maritime Mobile Service Identity (MMSI) spoofing behavior.
Remotesensing 12 00702 g002
Figure 3. The directions of trajectories at trajectory points.
Remotesensing 12 00702 g003
Figure 4. (a) The area where the data is collected. (b) Histogram of radar trajectory range. (c) Histogram of AIS trajectory range.
Remotesensing 12 00702 g004
Figure 5. Related definitions of t r _ r a t i o .
Remotesensing 12 00702 g005
Figure 6. (a) AIS closing_No truncation. (b) AIS closing_Truncation ratio is 80%. (c) AIS closing_Truncation ratio is 40%.
Remotesensing 12 00702 g006
Figure 7. The trend of F1 scores of the AIS closing detection algorithm.
Remotesensing 12 00702 g007
Figure 8. (a) MMSI spoofing_No truncation. (b) MMSI spoofing_Truncation ratio is 80%. (c) MMSI spoofing_Truncation ratio is 40%.
Remotesensing 12 00702 g008
Figure 9. The trend of F1 scores of the MMSI spoofing detection algorithm.
Remotesensing 12 00702 g009
Table 1. The performance of the AIS closing detection algorithm at different truncation ratios.
t r _ r a t i o TPFPFNPRF1
95%47 (97)9 (0)3 (3)0.84 (1.00)0.94 (0.97)0.89 (0.98)
90%45 (97)8 (0)5 (3)0.85 (1.00)0.90 (0.97)0.87 (0.98)
85%45 (96)7 (0)5 (4)0.87 (1.00)0.90 (0.96)0.88 (0.98)
80%44 (91)7 (0)6 (9)0.86 (1.00)0.88 (0.91)0.87 (0.95)
75%44 (87)6 (0)6 (13)0.88 (1.00)0.88 (0.87)0.88 (0.93)
70%42 (84)5 (0)8 (16)0.89 (1.00)0.84 (0.84)0.87 (0.91)
65%39 (81)3 (0)11 (19)0.93 (1.00)0.78 (0.81)0.85 (0.90)
60%40 (79)3 (0)10 (21)0.93 (1.00)0.80 (0.79)0.86 (0.88)
55%37 (75)2 (0)13 (25)0.95 (1.00)0.74 (0.75)0.83 (0.86)
50%31 (69)0 (0)19 (31)1.00 (1.00)0.62 (0.69)0.77 (0.82)
45%30 (65)0 (0)20 (35)1.00 (1.00)0.60 (0.65)0.75 (0.79)
40%28 (55)0 (0)22 (45)1.00 (1.00)0.56 (0.55)0.72 (0.71)
35%26 (37)0 (0)24 (63)1.00 (1.00)0.52 (0.37)0.68 (0.54)
30%24 (25)0 (0)26 (75)1.00 (1.00)0.48 (0.25)0.65 (0.40)
25%22 (19)0 (0)28 (81)1.00 (1.00)0.44 (0.19)0.61 (0.32)
20%20 (12)0 (0)30 (88)1.00 (1.00)0.40 (0.12)0.57 (0.21)
15%17 (7)0 (0)33 (93)1.00 (1.00)0.34 (0.07)0.51 (0.13)
10%12 (1)0 (0)38 (99)1.00 (1.00)0.24 (0.01)0.39 (0.02)
5%5 (0)0 (0)45 (100)1.00 (null)0.10 (0.00)0.18 (null)
Table 2. The performance of the MMSI spoofing detection algorithm at different truncation ratios.
t r _ r a t i o TPFPFNPRF1
95%11 (1)0 (0)39 (99)1.00 (1.00)0.22 (0.01)0.36 (0.02)
90%15 (1)0 (0)35 (99)1.00 (1.00)0.30 (0.01)0.46 (0.02)
85%20 (4)1 (0)30 (96)0.95 (1.00)0.40 (0.04)0.56 (0.08)
80%26 (8)2 (0)24 (92)0.93 (1.00)0.52 (0.08)0.67 (0.15)
75%28 (15)1 (0)22 (85)0.97 (1.00)0.56 (0.15)0.71 (0.26)
70%32 (29)0 (0)18 (71)1.00 (1.00)0.64 (0.29)0.78 (0.45)
65%34 (43)0 (0)16 (57)1.00 (1.00)0.68 (0.43)0.81 (0.60)
60%33 (48)0 (0)17 (52)1.00 (1.00)0.66 (0.48)0.80 (0.65)
55%35 (54)0 (0)15 (46)1.00 (1.00)0.70 (0.54)0.82 (0.70)
50%34 (58)0 (0)16 (42)1.00 (1.00)0.68 (0.58)0.81 (0.73)
45%36 (55)0 (0)14 (45)1.00 (1.00)0.72 (0.55)0.84 (0.71)
40%34 (46)0 (0)16 (54)1.00 (1.00)0.68 (0.46)0.81 (0.63)
35%34 (36)0 (0)16 (64)1.00 (1.00)0.68 (0.36)0.81 (0.53)
30%37 (23)0 (0)13 (77)1.00 (1.00)0.74 (0.23)0.85 (0.37)
25%35 (12)0 (0)15 (88)1.00 (1.00)0.70 (0.12)0.82 (0.21)
20%29 (4)0 (0)21 (96)1.00 (1.00)0.58 (0.04)0.73 (0.08)
15%24 (2)0 (0)26 (98)1.00 (1.00)0.48 (0.02)0.65 (0.04)
10%21 (0)0 (0)29 (100)1.00 (null)0.42 (0.00)0.59 (null)
5%8 (0)0 (0)42 (100)1.00 (null)0.16 (0.00)0.28 (null)
Table 3. The performance of the algorithm under different packet loss probabilities.
p _ l o s s 0% (No Loss)5%10%15%20%25%
t r _ r a t i o
80%0.870.850.810.810.820.79
60%0.860.840.840.820.720.77
40%0.720.700.680.680.700.65
20%0.570.570.570.510.550.44
Table 4. Association performance of the three methods.
t r _ r a t i o Distance + D-TRAPOnly DistanceTrajectory-to-Trajectory
PrecisionRecallF1PrecisionRecallF1PrecisionRecallF1
100%0.95100.77710.85530.95100.77710.85530.93490.90290.9186
80%0.90770.67430.77380.90080.67430.77120.73960.71430.7267
60%0.84210.54860.66440.82760.54860.65980.62130.60000.6105
40%0.67820.33710.45040.63040.33140.43450.37870.36570.3721
20%0.22730.08570.12450.17570.07430.10440.10060.09710.0988

