Article

Improving Sea Level Anomaly Precision from Satellite Altimetry Using Parameter Correction in the Red Sea

by
Ahmed M. Taqi
1,2,*,
Abdullah M. Al-Subhi
1,
Mohammed A. Alsaafani
1 and
Cheriyeri P. Abdulla
1
1
Department of Marine Physics, King Abdulaziz University, Jeddah 80200, Saudi Arabia
2
Department of Marine Physics, Hodeidah University, Hodeidah 3114, Yemen
*
Author to whom correspondence should be addressed.
Remote Sens. 2020, 12(5), 764; https://doi.org/10.3390/rs12050764
Submission received: 8 January 2020 / Revised: 30 January 2020 / Accepted: 13 February 2020 / Published: 27 February 2020
(This article belongs to the Section Ocean Remote Sensing)

Abstract

:
An improved Fourier series model (FSM01) method is used in geophysical and environmental corrections to enhance the final product of the along-track Jason-2 sea level anomaly (SLA) data and extend it near the Red Sea borders. In this study, the ionospheric correction range, wet tropospheric correction range, sea state bias correction range, and dry tropospheric correction range are enhanced and improved using FSM01, which helped to retrieve three more tracks (106, 170, and 234) earlier neglected by the distribution centers and extend the tracks toward the coast. The FSM01 SLA is compared with Jason-2 SLA and Archiving Validation and Interpretation of Satellite Oceanographic (AVISO) SLA for the available five tracks, in which the FSM01 SLA shows a good agreement and higher correlation with the Jason-2 SLA compared with that of AVISO, in addition to filling the gaps in the times series of all tracks. The newly retrieved tracks are also compared with those retrieved by AVISO, and both data points show similar variability, with FSM01 SLA showing no gaps in the time series. The FSM01 SLA was also extended toward the coast and showed high correlation with the coastal tide measurements.

Graphical Abstract

1. Introduction

The sea surface topography has been measured using satellite altimetry from space for more than three decades. These altimetric measurements are considered a cornerstone for any observing system in oceans, since they are used extensively to comprehend the ocean dynamics such as ocean observation and prediction models and in the management of climate change consequences [1,2]. Therefore, these products are most directly affected by quality and availability at the appropriate times of altimeter data [2].
Since the late 1980s, several altimetry projects have been started. Open ocean radar and data processing tools have been improved, while sea level observation has faced some difficulties in coastal areas, leading to deterioration in data accuracy near the coast at a distance of about 30 to 50 km [3,4,5]. This is due to the complex conditions faced by coastal areas, including their closeness to the land, the effect of the coastal bottom topography, and water dynamics, which cause a difficulty in extracting usable information directly from the waveform, as well as additional difficulties and challenges for measuring sea surface height using satellite altimetry near the coasts, such as radar echo, which is affected by land surroundings, and the inland water surface reflection. These difficulties have complicated the interpretation of signals within coast borders that extend 5 to 10 km [4,6,7]. The second challenge is that geophysical and environmental corrections in the coastal areas are not as good as in the open ocean (e.g., dry troposphere, ionosphere, sea state bias, wave height, high-frequency wind effect, and tides) [8]. During the distribution of the data, the satellite operations centers usually remove the sea level anomaly (SLA) data within about 50 km from the coast. Additionally, because of the low capture for a wide range near the coast, satellite altimetry faces difficulties regarding the place and time of sampling [9].
However, coastal ocean observation is extremely important: the coastal ocean is considered a region of high biological production, and economic areas are directly influenced by the activity of humans. Moreover, climate change can likely exacerbate many problems faced by coastal environments, such as coastal erosion, the flooding of the coastal area, water pollution, exertion, and damage to coastal biodiversity [10]. To achieve this goal, altimetry data must be improved in shallow waters [11]. In the last decades, there have been excellent enhancements to data processing and algorithms [11,12]. One of the important improvements in coastal altimetry data was conducted through the French–Italian project ALBICOCCA (Altimeter-Based Investigations in Corsica, Capraia, and Contiguous Areas). One of its resulting products was the establishment of data for the northwestern Mediterranean at the coast, as shown in [13]. Another study used Topex/Poseidon(T/P) data with in situ current data as well as tidal measurements in the Corsica channels. Several other studies have dealt with the constraints on coastal altimetry, with possible improvements in recent years, including those shown in [6,7,14,15,16].
These improvements have created considerable momentum, and AVISO launched two major projects dedicated to the advancement of coastal altimetry products for specific assignments: Prototype Innovant de Système de Traitement pour les Applications Côtières et l’Hydrologie (PISTACH), funded by the French Space Agency (CNES) for the processing of the coastal heights of Jason-1 and Jason-2 [17]; and Coastal Altimetry (COASTALT) (www.coastalt.eu), funded by the European Space Agency (ESA) for the design and implementation of a model for coastal region altimetry processing for Envisat. In addition to that, NASA has performed their own coastal region altimetry research through a specific research and development project in response to the final Ocean Surface Topography Science Team (OSTST) call in 2008 [18].
Recent developments in improving corrections and data processing in coastal zones make it possible to increase data quality and quantity [19]; for example, the study of the coasts of the Northwest Mediterranean in some T/P tracks improved data near coastal waters and in the open sea compared to the AVISO products.
Many studies have shown that there is a continuous need for additional improvements to altimetric records near the coast, which should not depend only on the consequent processing of higher data but, more importantly, should consider preprocessing (i.e., the reconstruction of waveforms or the use of data with a higher reprocessed ratio). For example, ERS-2 data have been recently suggested in [6]. The waveform retracking techniques play a significant role in expanding satellite data toward the coast and improving the values of sea surface height (SSH) (e.g., [6,7,14,20,21,22]). In addition to that, recent developments in improving corrections and data processing in coastal zones allow the increasing of the quality and quantity of data [19].
The Red Sea is a narrow body of seawater separating the African and Asian continents. It is oriented north and northwest between 12° and 30° N and is about 2300 km long and 280 km wide on average. The main connection to the Gulf of Aden and Indian Ocean is via the Strait of Bab el Mandeb from the south, and in the north, it is divided into two narrow Gulfs—the Gulf of Suez and the Gulf of Aqaba—while connecting the Mediterranean Sea through the Suez Canal. The marine environment in the Red Sea plays an important economic role, with abundant mineral resources including oil and gas. The sea influences the country’s strategy, which has special importance in maritime transport. In most cases, the marginal sea (semi-enclosed basin) plays an important role in the world’s navigation routes, maritime transport, and connecting countries. The lack of sea level data is the main constraint for the analysis of sea level changes in coastal areas, especially for the Red Sea. There are no previous studies using satellite SLA near the coast in the Red Sea, except those shown in [23,24]. They extrapolate the Jason-2 SLA data from family operational geophysical data records (OGDR) toward the coast by applying the Fourier series model (FSM) to the SLA data only for the available OGDR Jason-2 tracks. Unfortunately, due to the narrow width of the Red Sea, the operation centers remove unreliable data prior to OGDR product distribution, and hence some tracks are neglected in the Red Sea (for example, tracks 106, 170, and 234). Therefore, the main aim of this study is to use OGDR Jason-2 data to recover the neglected tracks and improve the accuracy of the SLA data in the entire Red Sea. In this study, the Fourier series model introduced in [19] is used for range corrections to improve the final production of SLA data for Jason-2 tracks and enhance SLA data near the coast. Not only that, but it helps to retrieve the neglected tracks by distributing centers. The sections of this paper are as follows: material and methods are presented in the second section, the third section represents the results and discussions, and the final section gives the conclusion.

2. Materials and Methods

2.1. Data

The obtained data in delayed time with the geophysical data records were provided by space agencies (GDR products), which, divided into three families, are the Operation Geophysical Data Record (OGDR), Interim Geophysical Data Record (IGDR), and Geophysical Data Record (GDR). This study uses Jason-2 along-tracks (level_2) from family operational geophysical data records (OGDR) in a weekly time span from June 2009 (cycle 33) to December 2014 (cycle 239). Those data are available through the JPL Physical Oceanography Distribution Active Archive center (ftp://podaac.jpl.nasa.gov/allData/ostm/preview/L2/GPS-OGDR/) (for more details, see [25]). The sea surface height accuracy and spatial resolution of all Jason-2 tracks are 3.4 cm and 11.2 km (along) × 5.1 km (across), respectively (Desai 2009).
The Archiving Validation and Interpretation of Satellite Oceanographic (AVISO) data can be downloaded from (ftp://ftp.AVISO.oceanobs.com/pub/oceano/AVISO/SSH/duacs/Data_Test/global/delayed-time/along-track/). The four tide gauge stations used for the validation of the FSM01 SLA data were obtained from the General Commission of Survey (SGS) in the Kingdom of Saudi Arabia, and details are shown in Table 1.
For studies of sea surface variations, it is most appropriate to refer to the sea surface height to the average sea level height—the so-called sea level anomaly hsla—as the following equation:
h s l a = H ( R o b s R d r y R w e t R i o n o R s s b ) ( h a t m h t i d h g e o ) m s s
where H represents the satellite orbit above the reference ellipsoid, R and h values are corrections for the different components (range (Robs), dry tropospheric correction (Rdry), wet tropospheric correction (Rwet), ionospheric correction (Rion), sea state bias (Rssb), dynamic atmosphere correction (hatm), tide correction (htid), and geoid correction (hgeo)). Robs = ct/2, R is the calculated range of travel time (t) observed by the onboard ultra-stable oscillator (USO), and c is the velocity of the radar pulse that ignores refraction.

2.2. Methods

Several studies have been devoted to assessing and improving some of the altimeter corrections in coastal oceanographic environments [8,23,26,27,28]. However, very few studies included analyses of the various corrective terms in their entirety, with the aim of increasing the amount of coastal SLA data for the end-users.
In this study, an improved FSM01 method is used for data for the parameter correction range and for the production of SLA data for all tracks in the level-2 Jason-2 in the Red Sea, where the used parameter correction range is obtained from the product of SLA OGDR, as follows.
The first step is to use the mean and standard deviation (σ) to remove the anomalies from the correction data (Rdry, Rwet, Rion, Rssb) to produce SLA, forming Equation (2):
Correction range < =mean ± 3σ
The second step is to reconstruct the correction using the Fourier series equation along the track using Equation (3) [29,30]:
s l a ( x ) f o u r = a 0 + i = 1 D ( a i c o s ( w n x ) + b i s i n ( w n x ) )
where a is intercept, ai and bi represent the amplitude of the cosine and sine, respectively, w shows the fundamental frequency of the signal, D is the number of degrees estimated in Equation (4) following [30,31], and x is the distance between track points.
D = 2 n m
The third step is the calculation of the SLA data by using Equation (1). The fourth step is the removal of anomalies from the SLA data by using filters of the mean and standard deviation (3σ). In the final step, the linear interpolation is applied to the SLA over time to create new data called FSM01 (see the chart for each step of this method, as shown in Figure 1).
Jason-2 satellite tracks do not intersect with tide stations on the coast. Yanbu station is the closest station to tracks 132 and 246; the distances between the station and track 132 and track 246 are 4 and 6 kilometers, respectively. The station data were used to compare the results of the FSM01 method and station data at the intersection of the Jason-2 track with the coast by a linear interpolation from Yanbu station.

3. Result and Discussion

Altimetry has shown notable success in the open ocean by delivering SLA data with high accuracy. However, in the coastal zones, the accuracy is degraded due to the surrounding terrain effects, combined with the lack of precision in some of the geophysical corrections and rapid changes in sea level. Several studies have been applied to assess and improve some altimeter corrections in coastal areas [10,21,23]. In order to improve the accuracy and completeness of SLA data in the Red Sea region derived from satellite altimetry, the FSM01 method was developed to improve the geophysical and environmental corrections. The present analysis was able to improve the geophysical and environmental corrections along tracks for Jason-2 in the Red sea.

3.1. Ionospheric Correction

Ionospheric correction (Rion) is one the components used to estimate sea level from a satellite altimeter; where it is noisy, it must be filtered spatially before removing it from the altimeter range. Figure 2a illustrates the original along-track record of cycle 116 of Jason-2 along track 132 in the Red Sea, where the Rion was smoothed by using the FSM01 method. Figure 2b,c exhibits the Hovmöller diagram of track 132 before and after Rion, respectively. This shows that the FSM01 method helps to increase and enhance the original along-track record of ionospheric corrections (IOC), as shown in Figure 2, especially near the coast.

3.2. Wet Tropospheric Correction

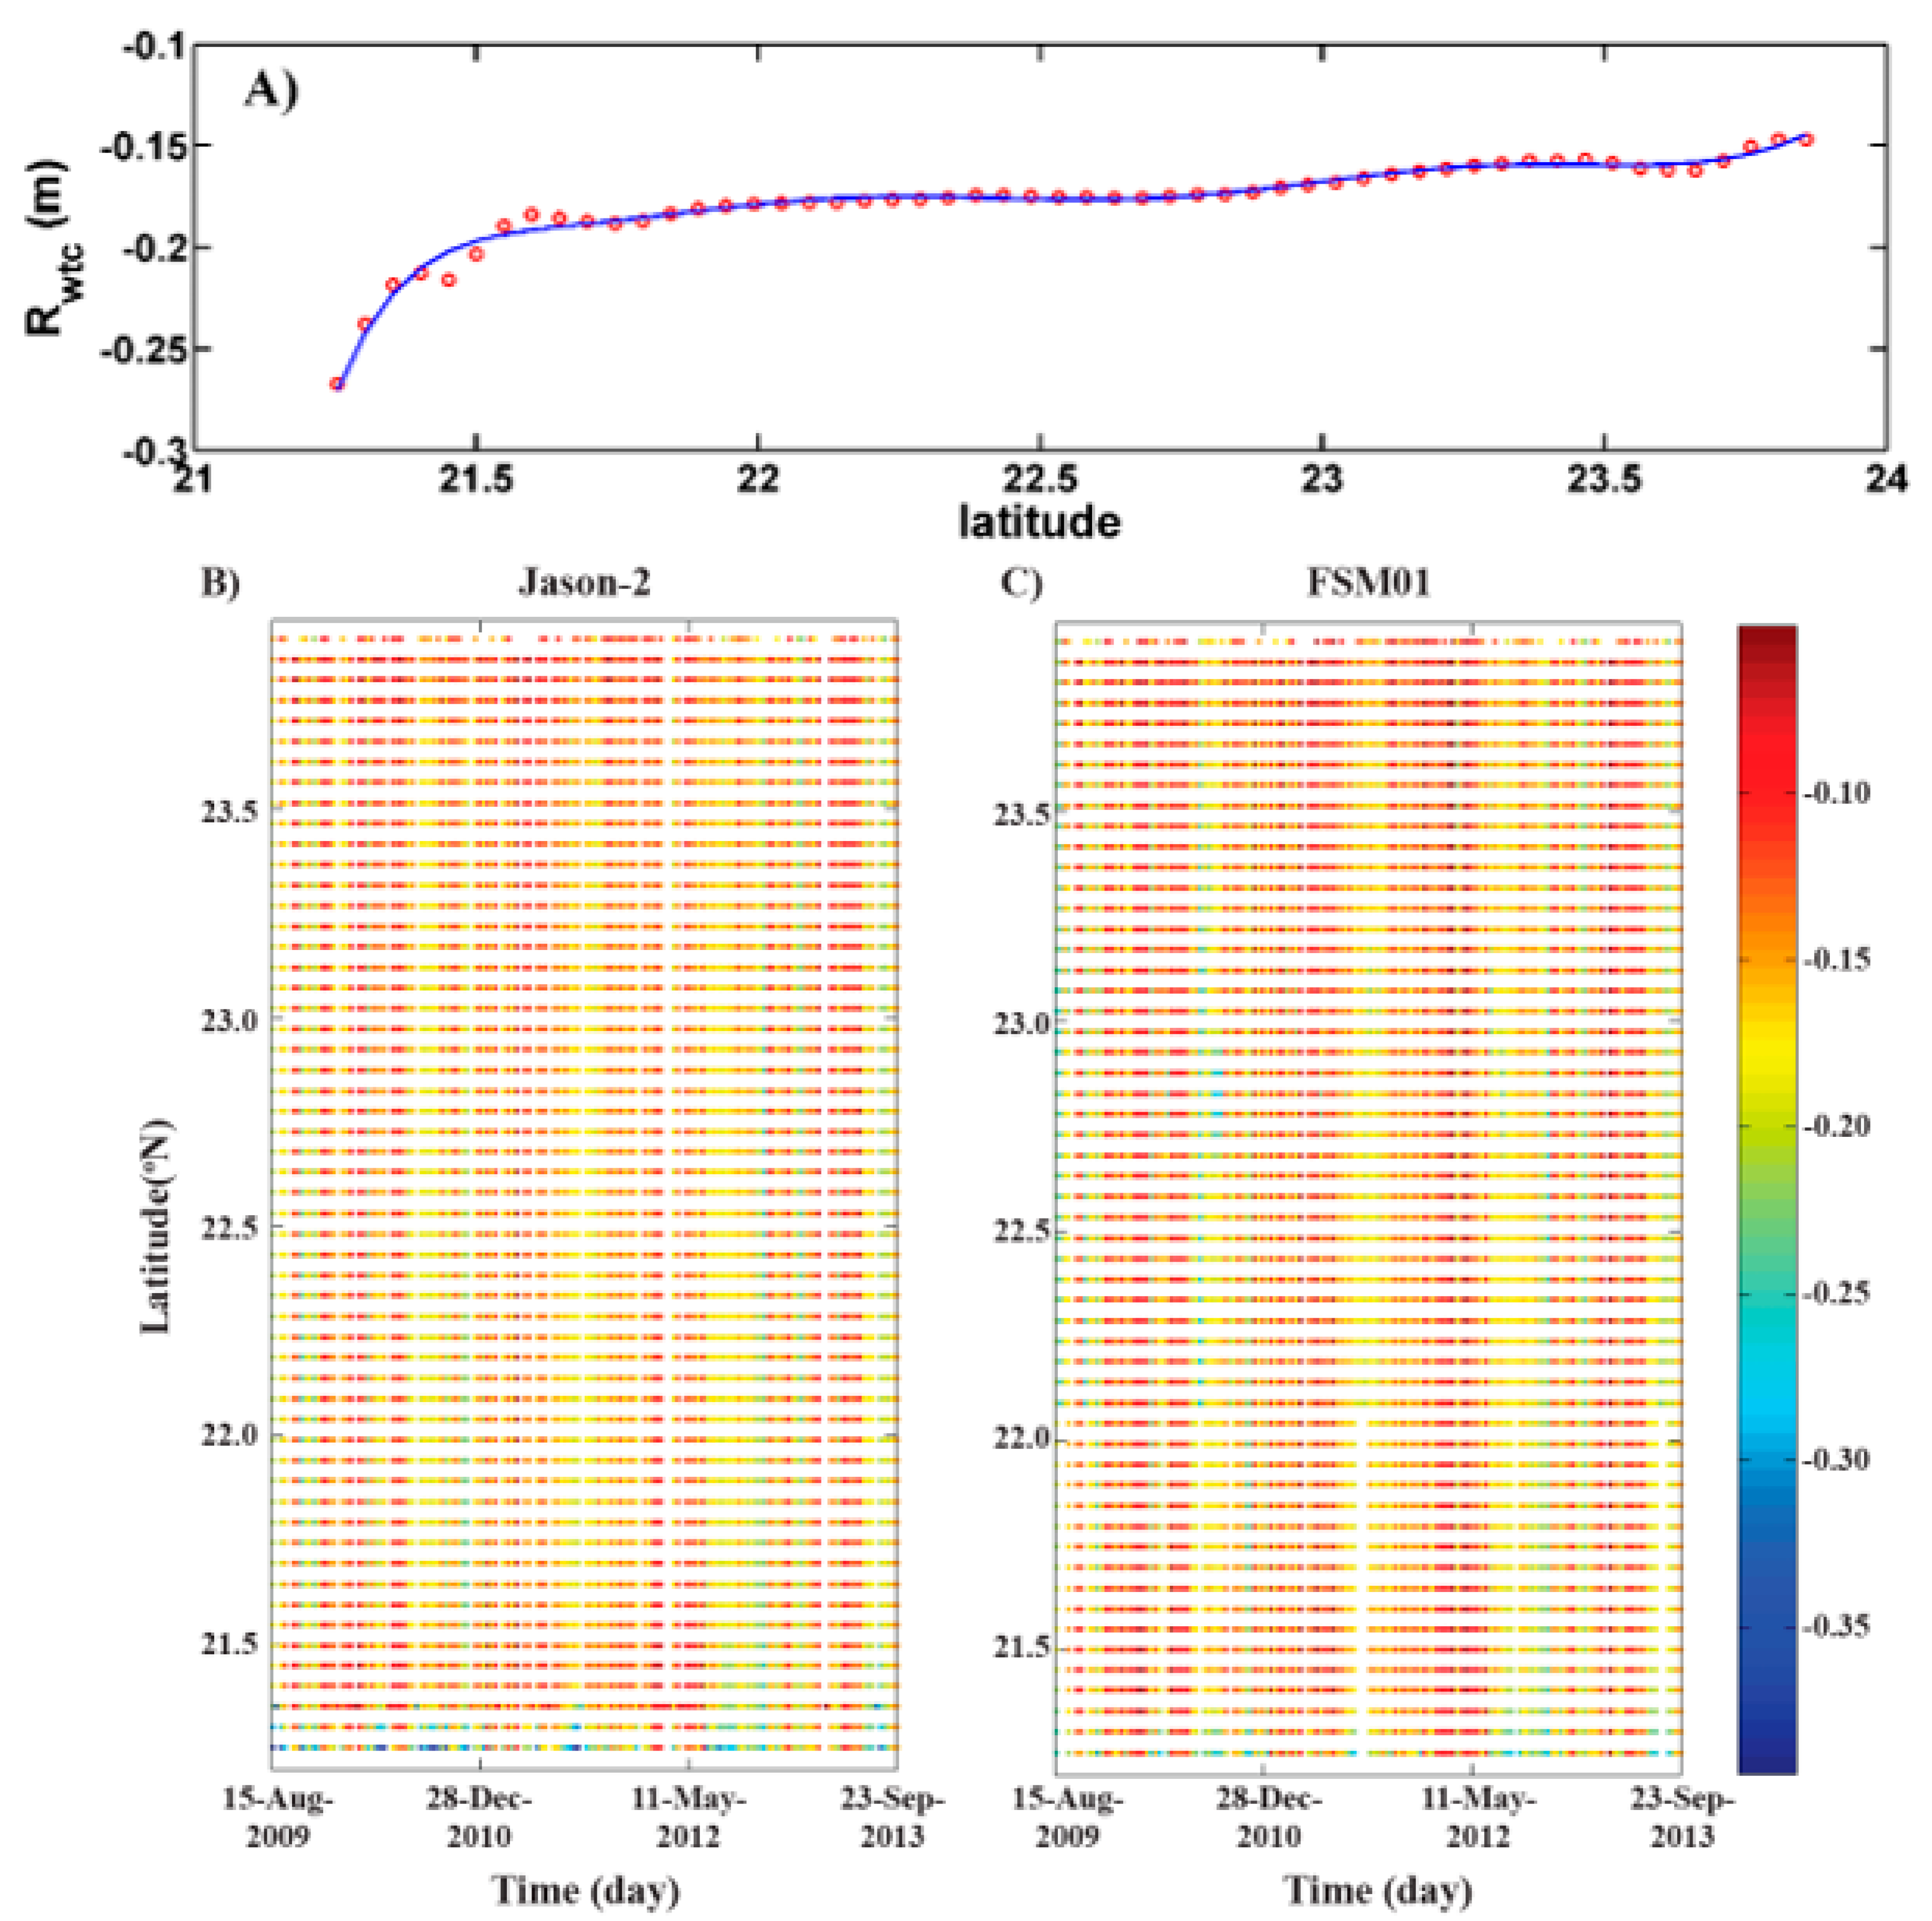
The wet tropospheric correction (Rwet) is the path delay correction due to cloud liquid water and water vapor [32]. It is one of the major sources of errors in altimeter sea level in coastal areas [8]. The standard along-track register for Rwet was included in the FSM01 model. Figure 3a presents the comparison between the original along-track data and the corrected Rwet, and it illustrates that the corrected values are smoother than the original along-track Jason-2. Figure 3b,c shows the Hovmöller diagram for the original along-track record and the result of Rwet, respectively. The FSM01 method was able to fill the gap in the data, which will enhance the production of SLA.

3.3. Sea State Bias Correction

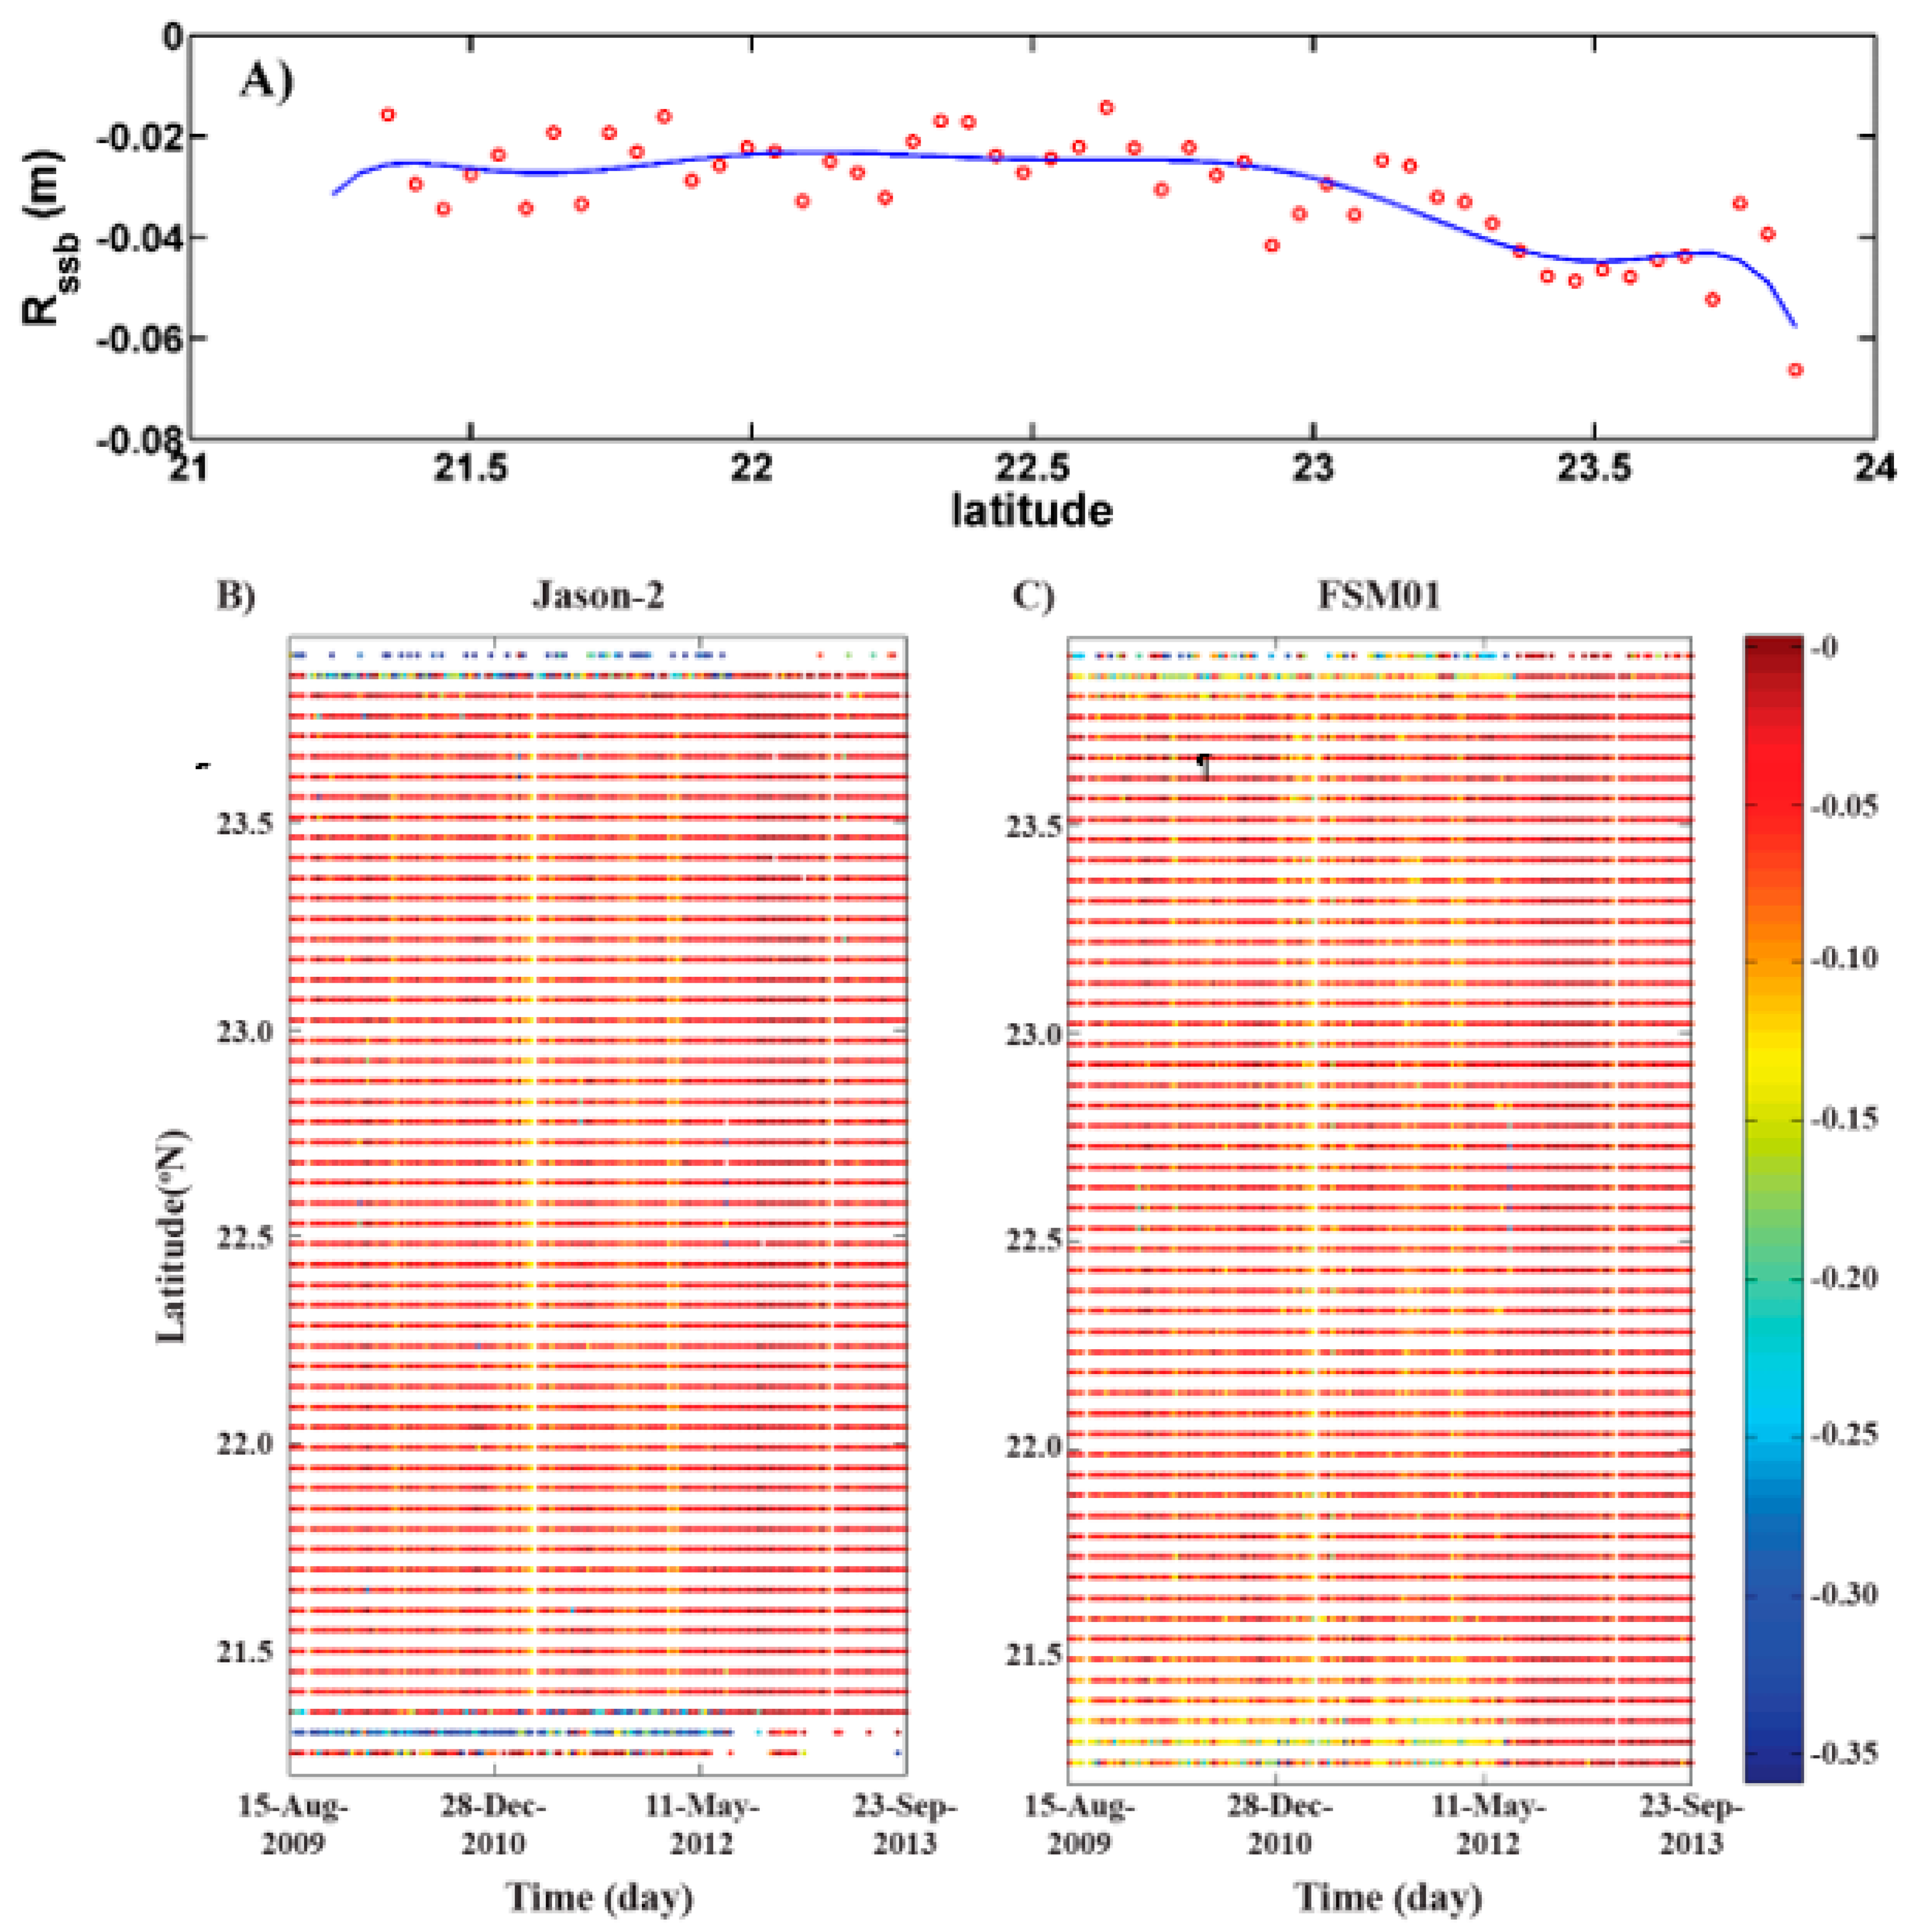
Sea state bias (Rssb) is an altimeter ranging error due to the presence of ocean waves on the surface. The rapidly changing properties of wind and waves form a noise waveform that causes a major problem facing coastal altimetry. Figure 4a illustrates cycle 116 of Jason-2 along track 132 in the Red Sea; the result of FSM01 is compared with the original. Figure 4b,c presents the Hovmöller diagram for the original and FSM01, where the FSM01 method was able to create new data more accurately than the original near the Red Sea coast.

3.4. Dry Tropospheric Correction (Rdry)

Dry tropospheric correction (Rdry) depends on the dry gas component of the atmosphere. It is by far the largest adjustment range in satellite altimetry. With a magnitude of about 2.3 m at sea level and a range of about 0.2 m [33], its temporal variation is low. The dry tropospheric range depends on the sea level pressure and latitude. The FSM01 method was used in dry tropospheric correction to enhance accuracy near the coast. Figure 5a–c shows that the FSM01-corrected Rdry matched the original data. FSM01 enhanced Rdry data near the coast (as seen in the Hovmöller diagram, Figure 5c), which in turn contributed to improving the SLA data (see Section 4).

3.5. SLA Quality Inferred from FSM01

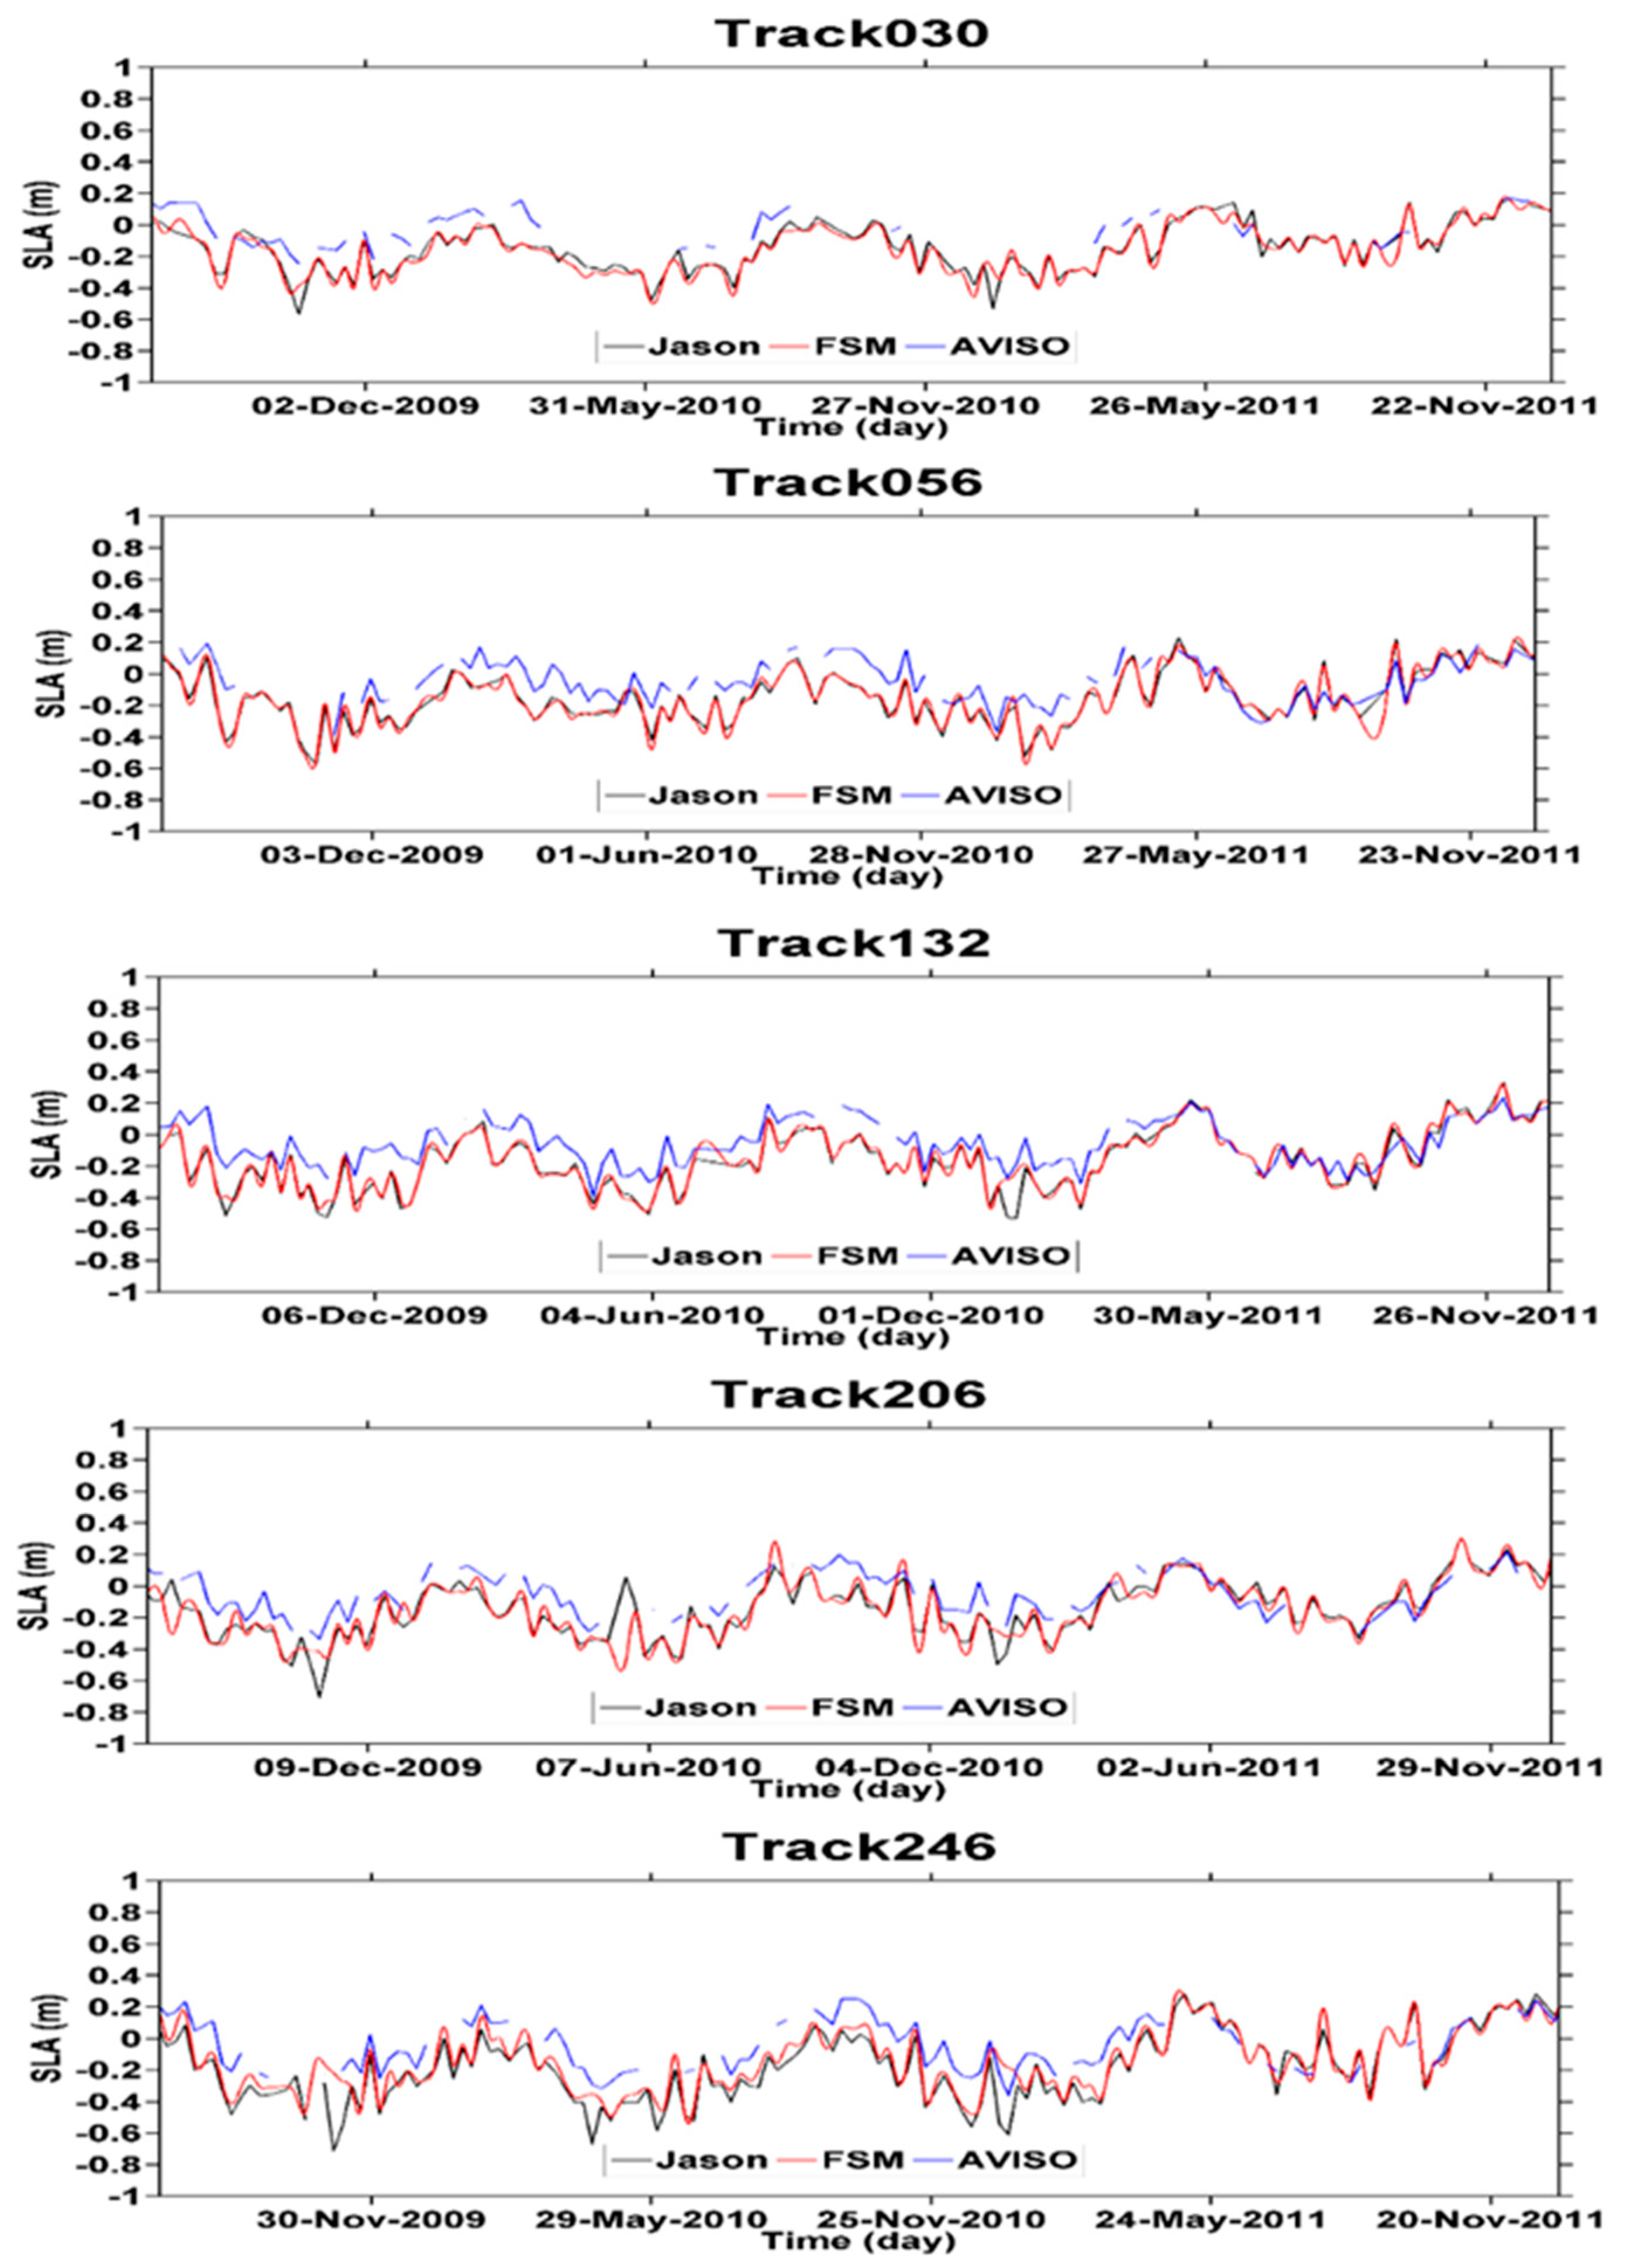
The accuracy of the altimeter SLA depends on many of the corrections used to produce sea level data, namely, geophysical and environmental corrections. The FSM01 method was used for the geophysical and environmental corrections, which required the estimation of the product of OGDR Jason-2 SLA data. The method allowed us to enhance and improve the correction ranges, which in turn helped us to retrieve new tracks which were earlier neglected by the distribution centers and extend the SLA data to the coast. In this section, the SLA from the FSM01 method is compared with the Jason-2 SLA and AVISO SLA for the period 2009–2014 for the available five tracks (Figure 6). The time series of the five available tracks show that FSM01 SLA agrees well with Jason-2 SLA variability and also fills the gaps within the time series more than AVISO SLA, as shown in Figure 6.
The correlation coefficient and root mean square error (RMSE) are estimated for the FSM01 SLA and AVISO with Jason-2 in Table 2 and Figure 6. The FSM01 data coincide with Jason-2 SLA within about 50 km of the coast, while the lowest relationship with AVISO data appears in all tracks. The FSM01 data show a higher correlation coefficient with Jason-2 SLA compared with that of AVISO SLA (Table 2). The last row of Table 2 shows the average correlation coefficient for five tracks between the FSM01 and AVISO with Jason-2 SLA, which also shows that the FSM01 SLA matches well with Jason-2 with a correlation coefficient of 0.973. The scatter index for FSM01 is almost 0.3 m, which is lower than that of AVISO (0.83 m).
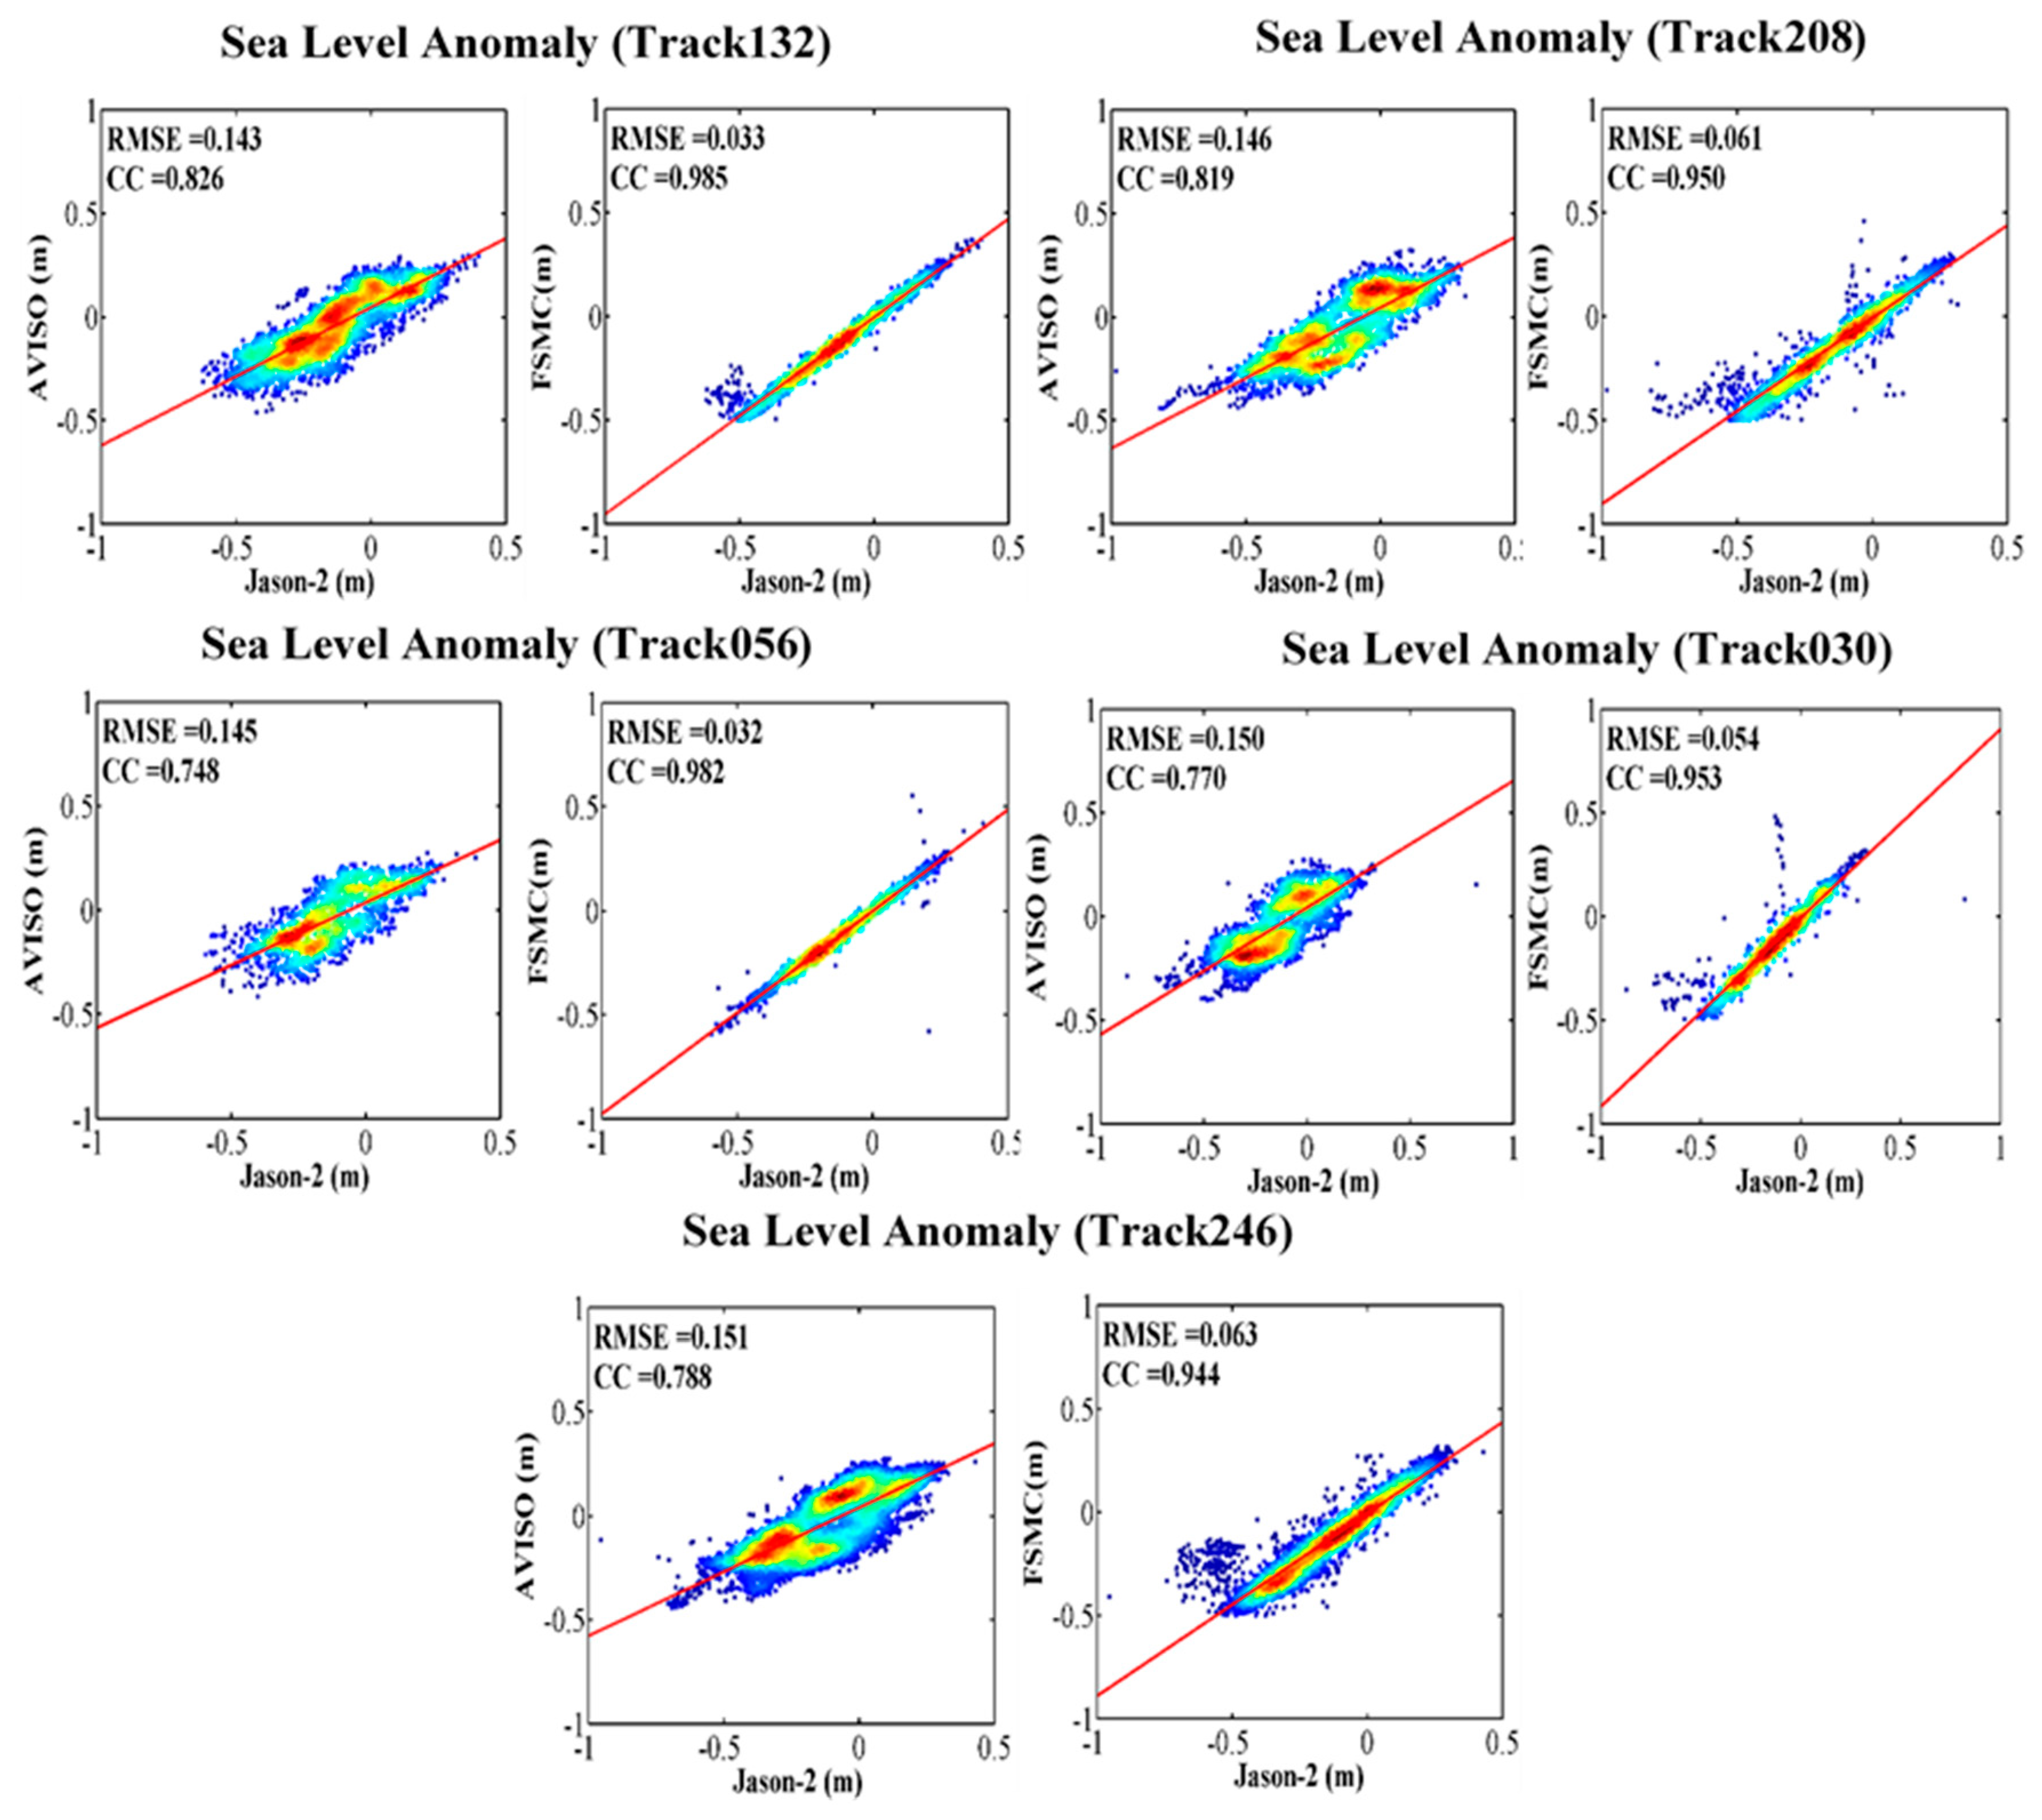
Figure 7 shows the density scatter diagram for the five tracks between FSM01 and AVISO with OGDR for Jason-2. There is a clear fit between FSM01 SLA and Jason-2 SLA, with a slope close to unity, while that of AVISO SLA with Jason-2 SLA deviated from unity. The additional advantage of this study is the retrieval of the neglected tracks by the final product (tracks 106, 170, and 234). Even though the AVISO product reproduces those tracks, with a good accuracy for open sea as seen, it still contains a large number of gaps in the coastal area, and FSM01 shows better agreement with the coastal station SLA.
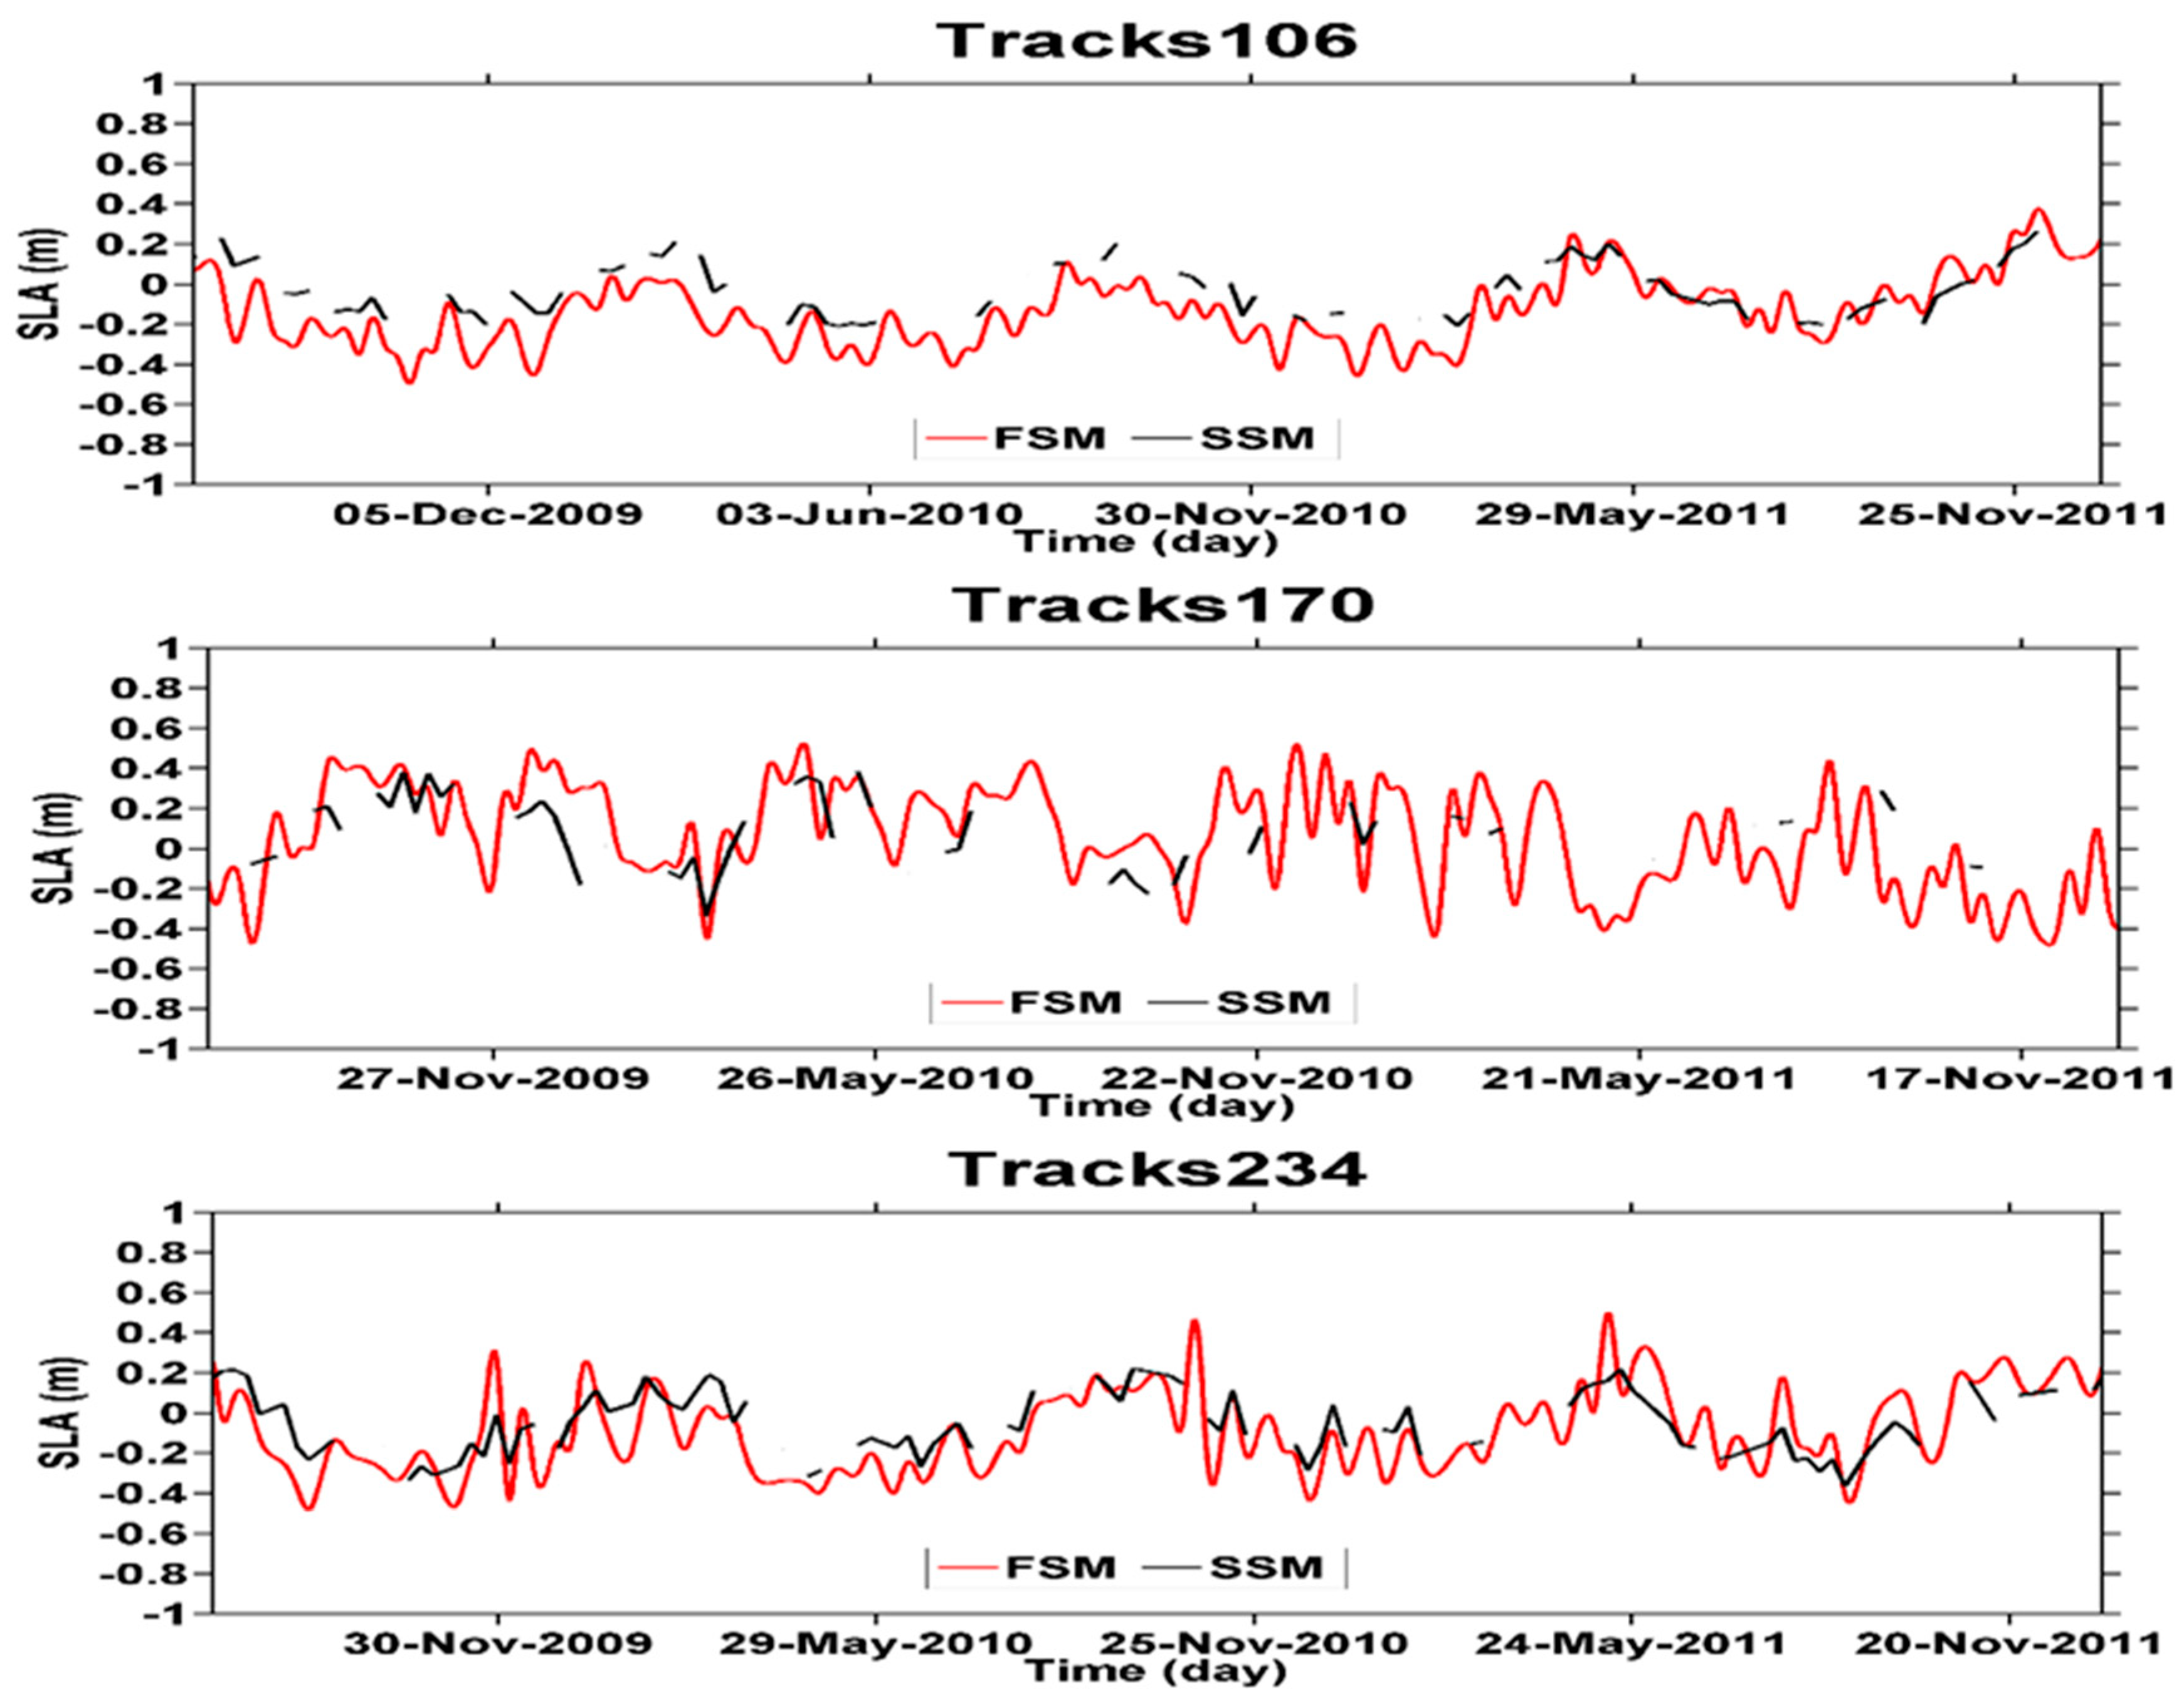
Figure 8 shows a time series for the SLA of three retrieved tracks from AVISO and FSM01, for the closest point of the AVISO tracks to the coast. Both data sets show a similar variability of SLA, with FSM01 producing continuous data, while the AVISO-retrieved SLA shows discontinuity for all three tracks.
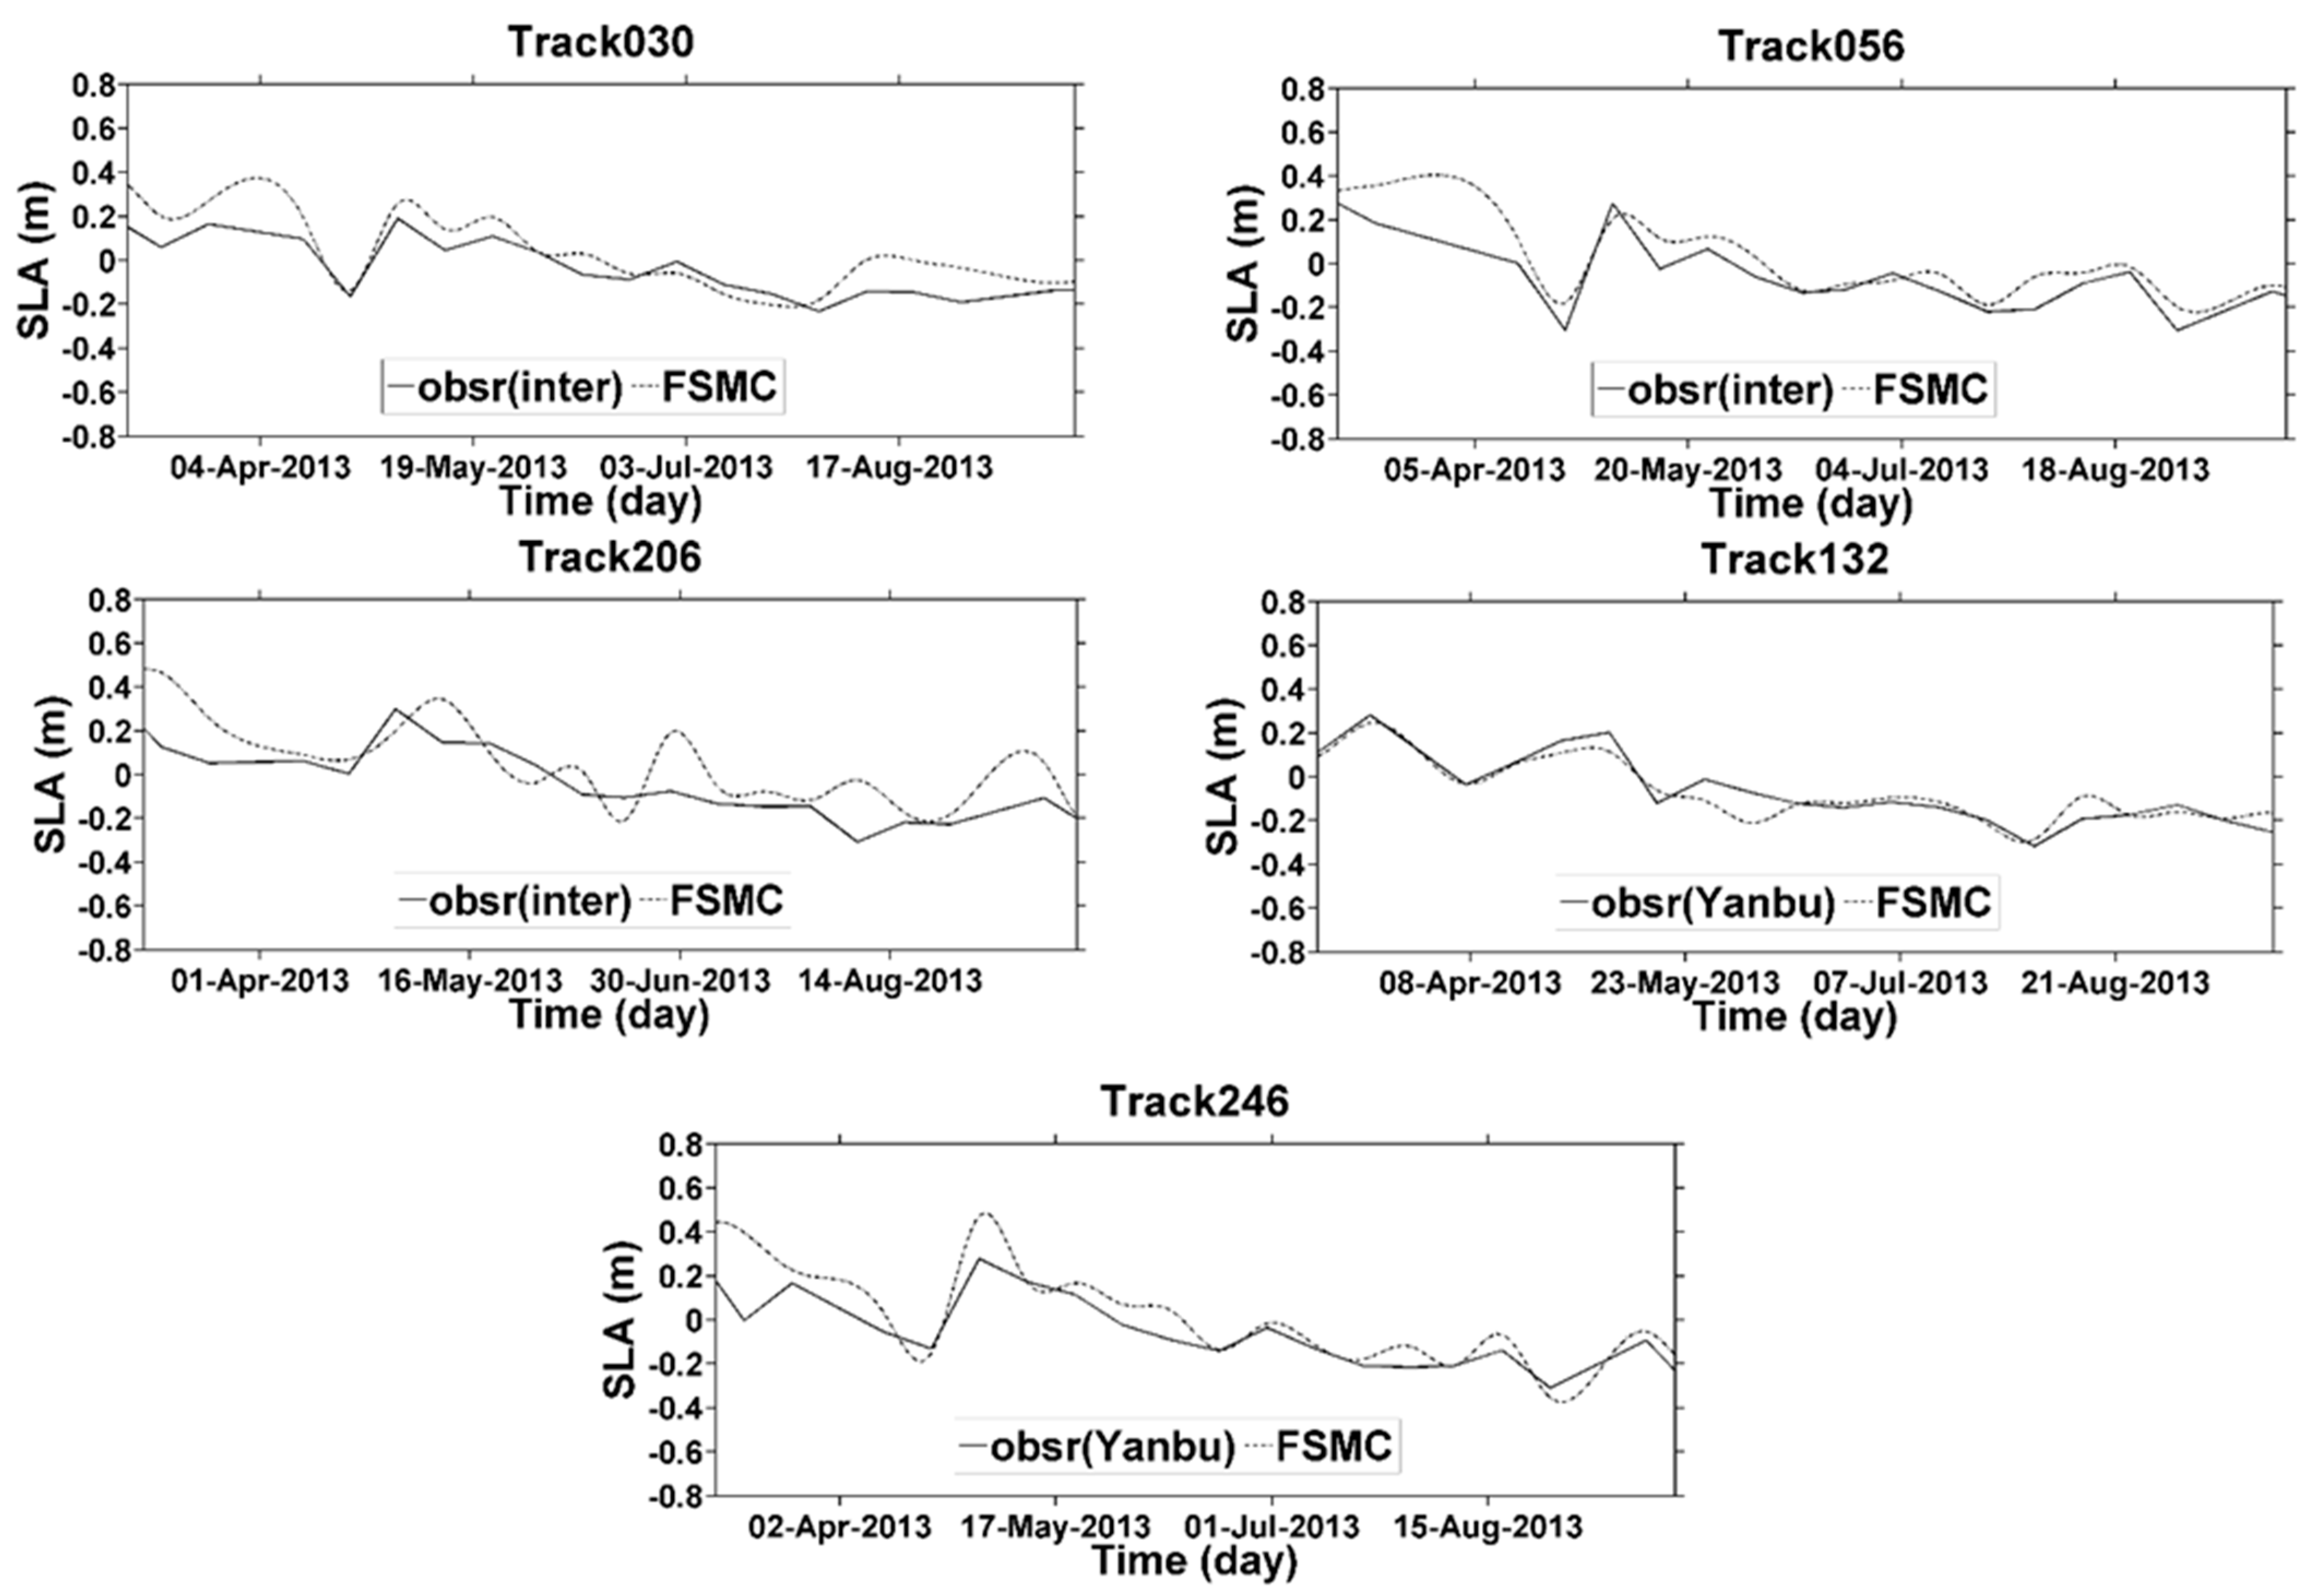
Figure 9 illustrates the time series for tide gauge data and the FSM01 SLA between January 2013 and December 2013. There is reasonable agreement between the two datasets, as the correlation coefficients are very high for all tracks, especially for tracks 132 and 246 near the tidal station in Yanbu, as shown in Table 3 where the correlation coefficient is greater than 0.90. The RMSE, bias, and standard error obtained from the relationship between the observed SLA and the FSM01 SLA are reasonably good, and the values are very small. Regarding where tracks 30, 56, and 208 intersect with the coastline, the coastal SLA has been interpolated linearly from the four stations, as mentioned above, and also shows high correlation with the tracks data.
Figure 10a,b shows the Hovmöller diagram of Jason-2 SLA along track 132 and for FSM01. It is clear from the figure that the FSM01 is able to fill the gaps in the time series and extend the SLA toward both coasts of the Red Sea.

4. Conclusions

Generally, in this study, the FSM01 method was used in geophysical and environmental corrections to enhance SLA Jason-2 along-track data and extend it near the coast of the Red Sea. This study improves the SLA data along the satellite tracks using an enhanced and improved ionospheric correction range, wet tropospheric correction range, sea state bias correction range, and dry tropospheric correction range by the FSM01 method. The FSM01 method is reliable in the detection of anomalous values in satellite altimeter corrections and performs a better reconstruction of lost or rejected values. The FSM01 SLA shows higher correlation with Jason-2 SLA for the available five tracks as compared with that of AVISO SLA. In addition to that, it fills the gaps in the time series of the tracks. This method has retrieved three additional tracks (106, 170, and 234) which were earlier neglected by the distribution centers. Even though those tracks were retrieved by AVISO, the newly retrieved data by FSM01 show no gaps in the time series. This study found that the FSM01 method is efficient in extending data to the coast and shows high correlation with the coastal tide gauge data.

Author Contributions

Conceptualization, A.M.T., A.M.A.-S., and M.A.A.; methodology, A.M.T.; software, A.M.T.; validation, A.M.T., A.M.A.-S., and M.A.A.; formal analysis, A.M.T.; investigation, A.M.T.; resources, A.M.T. and A.M.A.-S.; data curation, A.M.T.; writing—original draft preparation, A.M.T.; writing—review and editing, A.M.A.-S., M.A.A., and C.P.A; visualization, A.M.A.-S., M.A.A., and C.P.A.; supervision, A.M.A.-S.; funding acquisition, A.M.A.-S. All authors have read and agreed to the published version of the manuscript.

Funding

This work was funded by the Deanship of Scientific Research (DSR), King Abdulaziz University, Jeddah, under grant No. (D1441-45-150).

Acknowledgments

This work was funded by the Deanship of Scientific Research (DSR), King Abdulaziz University, Jeddah, under grant No. (D1441-45-150). The authors acknowledge the General Commission for Survey, Saudi Arabia (GCS) for providing hourly tide gauge data along the coast of the Red Sea. They are also grateful to the High-Performance Computing Center at King Abdulaziz University (http://hpc.kau.edu.sa) for giving us a chance to use their facilities during the data analyses. The authors acknowledge the data providers: the JPL-PODAAC and AVISO.

Conflicts of Interest

The authors declare no conflict of interest.

References

  1. Chelton, D.B.; Schlax, M.G.; Samelson, R.M. Progress in Oceanography Global observations of nonlinear mesoscale eddies. Prog. Oceanogr. 2011, 91, 167–216. [Google Scholar] [CrossRef]
  2. Le Traon, P.Y. From satellite altimetry to Argo and operational oceanography: Three revolutions in oceanography. Ocean Sci. 2013, 9, 901–915. [Google Scholar] [CrossRef] [Green Version]
  3. Birol, F.; Delebecque, C. Using high sampling rate (10/20 Hz) altimeter data for the observation of coastal surface currents: A case study over the northwestern Mediterranean Sea. J. Mar. Syst. 2014, 129, 318–333. [Google Scholar] [CrossRef]
  4. Gommenginger, C.; Thibaut, P.; Fenoglio-Marc, L.; Quartly, G.; Deng, X.; Gómez-Enri, J.; Challenor, P.; Gao, Y. Retracking altimeter waveforms near the coasts. In Coastal Altimetry; Springer: Berlin/Heidelberg, Germany, 2011; pp. 61–101. [Google Scholar]
  5. Anzenhofer, M.; Shum, C.K.; Rentsh, M. Coastal altimetry and applications. Ohio State Univ. Geod. Sci. Surv. Tech. Rep. 1999, 464, 36. [Google Scholar]
  6. Deng, X.; Featherstone, W.E. A coastal retracking system for satellite radar altimeter waveforms: Application to ERS-2 around Australia. J. Geophys. Res. 2006, 111, 1–16. [Google Scholar] [CrossRef] [Green Version]
  7. Hwang, C.; Guo, J.; Deng, X.; Hsu, H.Y.; Liu, Y. Coastal gravity anomalies from retracked Geosat/GM altimetry: Improvement, limitation and the role of airborne gravity data. J. Geod. 2006, 80, 204–216. [Google Scholar] [CrossRef]
  8. Andersen, O.B.; Scharroo, R. Range and geophysical corrections in coastal regions: And implications for mean sea surface determination. In Coastal Altimetry; Vignudelli, S., Kostianoy, A.G., Cipollini, P., Benveniste, J., Eds.; Springer-Verlag: Berlin/Heidelberg, Germany, 2011; pp. 103–145. [Google Scholar]
  9. Birol, F.; Cancet, M.; Estournel, C. Aspects of the seasonal variability of the Northern Current (NW Mediterranean Sea) observed by altimetry. J. Mar. Syst. 2010, 81, 297–311. [Google Scholar] [CrossRef]
  10. Harley, C.D.G.; Randall Hughes, A.; Hultgren, K.M.; Miner, B.G.; Sorte, C.J.B.; Thornber, C.S.; Rodriguez, L.F.; Tomanek, L.; Williams, S.L. The impacts of climate change in coastal marine systems. Ecol. Lett. 2006, 9, 228–241. [Google Scholar] [CrossRef] [Green Version]
  11. Vignudelli, S.; Kostianoy, A.G.; Cipollini, P.; Benveniste, J. Coastal Altimetry; Springer cience & Business Media: Berlin/Heidelberg, Germany, 2011; ISBN 9783642127953. [Google Scholar]
  12. Passaro, M.; Cipollini, P.; Vignudelli, S.; Quartly, G.D.; Snaith, H.M. ALES: A multi-mission adaptive subwaveform retracker for coastal and open ocean altimetry. Remote Sens. Environ. 2014, 145, 173–189. [Google Scholar] [CrossRef] [Green Version]
  13. Vignudelli, S.; Snaith, H.M.; Lyard, F.; Cipollini, P.; Venuti, F.; Centre, N.O.; Way, E.; Southampton, S.O. Satellite radar altimetry from open ocean to coasts: Challenges and perspectives. Remote Sens. Mar. Environ. 2006, 6406, 1–12. [Google Scholar]
  14. Ghosh, S.; Kumar Thakur, P.; Garg, V.; Nandy, S.; Aggarwal, S.; Saha, S.K.; Sharma, R.; Bhattacharyya, S. SARAL/AltiKa Waveform Analysis to Monitor Inland Water Levels: A Case Study of Maithon Reservoir, Jharkhand, India. Mar. Geod. 2015, 38, 597–613. [Google Scholar] [CrossRef]
  15. Deng, X.; Featherstone, W.E.; Hwang, C.; Shum, C.K. Improved Coastal Marine Gravity Anomalies at the Taiwan Strait from Altimeter Waveform Retracking. In Proceedings of the International Workshop on Satellite Altimetry for Geodesy, Geophysics and Oceanography, Wuhan, China, 8–13 September 2001; pp. 1–9. [Google Scholar]
  16. Brooks, R.L.; Lockwood, D.W.; Lee, J.E.; Iii, D.W.H.; Hayne, G.S. Land Effects on TOPEX Radar Altimeter Measurements in Pacific Rim Coastal Zones. In Remote Sensing of the Pacific by Satellites; Brown, R.A., Ed.; Earth, Ocean, & Space Pty.: Glebe, Australia, 1998; pp. 175–198. [Google Scholar]
  17. Mercier, F.; Ablain, M.; Carrère, L.; Dibarboure, G.; Dufau, C.; Labroue, S.; Obligis, E.; Sicard, P.; Thibaut, P.; Commien, L.; et al. A CNES Initiative for Improved Altimeter Products in Coastal Zone; PISTACH, 2008; Available online: http://www.aviso.oceanobs.com/fieadmin/documents/OSTST/2008/Mercier_PISTACH.pdf (accessed on 26 February 2020).
  18. Drinkwater, M.; Bonekamp, H.; Bontempi, P.; Chapron, B.; Donlon, C.; Fellous, J.L.; DiGiacomo, P.; Harrison, E.; LeTraon, P.Y.; Wilson, S. Status and outlook for the space component of an integrated ocean observing system. In Proceedings of the OceanObs09: Sustained Ocean Observations and Information for Society, Venice, Italy, 21–25 September 2009. [Google Scholar] [CrossRef] [Green Version]
  19. Cipollini, P.; Vignudelli, S.; Lyard, F.; Roblou, L. 15 years of altimetry at various scales over the Mediterranean. In Remote Sensing of the European Seas; Springer: Berlin/Heidelberg, Germany, 2008; pp. 295–306. [Google Scholar]
  20. Guo, J.; Chang, X.; Gao, Y.; Sun, J.; Hwang, C. Lake level variations monitored with satellite altimetry waveform retracking. IEEE J. Sel. Top. Appl. Earth Obs. Remote Sens. 2009, 2, 80–86. [Google Scholar] [CrossRef]
  21. Guo, J.Y.; Gao, Y.G.; Hwang, C.W.; Sun, J.L. A multi-subwaveform parametric retracker of the radar satellite altimetric waveform and recovery of gravity anomalies over coastal oceans. Sci. China Earth Sci. 2010, 53, 610–616. [Google Scholar] [CrossRef]
  22. Khaki, M.; Forootan, E.; Sharifi, M.A. Satellite radar altimetry waveform retracking over the Caspian Sea. Int. J. Remote Sens. 2014, 35, 6329–6356. [Google Scholar] [CrossRef]
  23. Taqi, A.M.; Al-Subhi, A.M.; Alsaafani, M.A. Extension of Satellite Altimetry Jason-2 Sea Level Anomalies Towards the Red Sea Coast Using Polynomial Harmonic Techniques. Mar. Geod. 2017, 1–14. [Google Scholar] [CrossRef]
  24. Taqi, A.M.; Al-Subhi, A.M.; Alsaafani, M.A.; Abdulla, C.P. Estimation of geostrophic current in the Red Sea based on sea level anomalies derived from extended satellite altimetry data. Ocean Sci. 2019, 15, 477–488. [Google Scholar] [CrossRef] [Green Version]
  25. Dumont, J.P.; Rosmorduc, V.; Picot, N.; Bronner, E.; Desai, S.; Bonekamp, H.; Figa, J.; Lillibridge, J.; Scharroo, R. OSTM/Jason-2 Products Handbook; PL: STM-29-1237, NOAA/NESDIS: Polar Series/OSTM J; 2015; Volume 400. [Google Scholar]
  26. Obligis, E.; Desportes, C.; Eymard, L.; Fernandes, M.J.; Lázaro, C.; Nunes, A.L. Tropospheric Corrections for Coastal Altimetry. In Coastal Altimetry; Vignudelli, S., Kostianoy, A.G., Cipollini, P., Benveniste, J., Eds.; Springer-Verlag: Berlin/Heidelberg, Germany, 2011; pp. 147–176. ISBN 9783642127953. [Google Scholar]
  27. Imani, M.; You, R.; Kuo, C. Accurate Forecasting of the Satellite-Derived Seasonal Caspian Sea Level Anomaly Using Polynomial Interpolation and Holt-Winters Exponential Smoothing. Terr. Atmos. Ocean. Sci. 2013, 24, 521–530. [Google Scholar] [CrossRef] [Green Version]
  28. Fernandes, M.J.; Lázaro, C.; Ablain, M.; Pires, N. Remote Sensing of Environment Improved wet path delays for all ESA and reference altimetric missions. Remote Sens. Environ. 2015, 169, 50–74. [Google Scholar] [CrossRef] [Green Version]
  29. Bloomfield, P. Fourier analysis of time series: An introduction. J. R. Stat. Soc. Ser. A Gen. 2000, 140, 237. [Google Scholar]
  30. Thomson, R.E.; Emery, W.J. Data Analysis Methods in Physical Oceanography, 3rd ed.; Elsevier: Boston, MA, USA, 2014; ISBN 978-0-12-387782-6. [Google Scholar] [CrossRef]
  31. Daniell, P.J. Discussion on symposium on autocorrelation in time series. Suppl. J. R. Stat. Soc. 1946, 8, 88–90. [Google Scholar]
  32. Desportes, C.; Obligis, E.; Eymard, L. On Wet Tropospheric Correction for Altimetry in Coastal Regions. In Proceedings of the Envisat Symposium 2007, Montreux, Switzerland, 23–27 April 2007; pp. 23–27. [Google Scholar]
  33. Fernandes, M.J.; Lázaro, C.; Nunes, A.L.; Scharroo, R. Atmospheric Corrections for Altimetry Studies over Inland Water. Remote Sens. 2014, 6, 4952–4997. [Google Scholar] [CrossRef] [Green Version]
Figure 1. Schematic streamline for the steps of the Fourier series model (FSM01) method. SLA: Sea Level Anomaly.
Remotesensing 12 00764 g001
Figure 2. The Rion for (A) cycle 116 of Jason-2 along track 132 in the Red Sea, before (red circles) and after (blue line), and the Hovmöller diagram for the Rion data (B) original and (C) after applying FSM01.
Remotesensing 12 00764 g002
Figure 3. Cycle 116 of Jason-2 along track 132 in the Red Sea, before (red circles) and after (blue line) the Rwet correction, and the Hovmöller diagram for the Rwet data (B) original and (C) after applying FSM01.
Remotesensing 12 00764 g003
Figure 4. (A) The sea state bias correction for cycle 116 of Jason-2 along track 132 in the Red Sea, before (red circles) and after (blue line), and the Hovmöller diagram for the Rssb data (B) original and (C) after applying FSM01.
Remotesensing 12 00764 g004
Figure 5. Cycle 116 of Jason-2 along track 132 in the Red Sea, before (red circles) and after (blue line) the Rdry correction, and the Hovmöller diagram for the Rdry data (B) original and (C) after applying FSM01.
Remotesensing 12 00764 g005
Figure 6. Time series of SLA for closest point of the tracks to the coast for Jason-2 SLA (black), with FSM01 SLA (red) and Archiving Validation and Interpretation of Satellite Oceanographic (AVISO) (blue).
Remotesensing 12 00764 g006
Figure 7. The scatter distribution comparison between SLA Jason-2 with FSM01 and AVISO for five tracks.
Remotesensing 12 00764 g007
Figure 8. Comparison of all the tracks: FSM01 SLA (red) and AVISO (black).
Remotesensing 12 00764 g008
Figure 9. Comparing the coastal station SLA and interpolated SLA with the FSM01 SLA at the intersection with the coast.
Remotesensing 12 00764 g009
Figure 10. The Hovmöller diagram of SLA along track 132 for (a) Jason-2 and (b) FSM01 from cycle 33 to cycle 239.
Remotesensing 12 00764 g010
Table 1. Coastal tide gauge station positions and time periods.
Name of StationLatitudeLongitudeTime
Jazan16°52′12″N42°33′00″E1 January 2012 to 31 December 2013
Jeddah21°25′12″N39°9′00″E1 January 2012 to 31 December 2013
Yanbu23°57′00″N38°15′00″E1 January 2012 to 31 December 2013
Duba27°19′12″N35°43′12″E1 January 2012 to 31 December 2013
Table 2. The statistical analysis of FSM01 and AVISO SLA compared with Jason-2 SLA.
MethodBiasRMSEΣCorrelation
Track030Aviso0.0980.1500.1140.770
FSM010.0060.0560.0560.950
Track056Aviso0.0870.1460.1170.748
FSM010.0010.0330.0330.982
Track132Aviso0.0920.1450.1130.829
FSM010.0000.0270.0270.991
Track206Aviso0.0920.1460.1130.820
FSM01−0.0010.0390.0390.981
Track246Aviso0.0940.1510.1190.788
FSM01−0.0010.0680.0680.938
All TracksAviso0.0930.1490.1160.794
FSM010.0020.0440.0440.973
Table 3. The statistics of the FSM01 data with observation in the coastal region.
BiasRMSEStdCorrelation
Track0300.070.100.070.92
Track0560.090.140.100.84
Track1320.020.080.080.92
Track2060.140.190.130.80
Track2460.080.120.080.91