Article

A New Remote Sensing Images and Point-of-Interest Fused (RPF) Model for Sensing Urban Functional Regions

1
College of Electronics and Information Engineering, Sichuan University, Chengdu 610065, China
2
Key Laboratory of Wireless Power Transmission of Ministry of Education, Chengdu 610065, China
3
Chengdu Institute of Urban Planning and Design, No. 399 Fucheng Avenue, Chengdu 610081, China
4
Department of Computing and Mathematics, Manchester Metropolitan University, Manchester M15 6BH, UK
*
Author to whom correspondence should be addressed.
Remote Sens. 2020, 12(6), 1032; https://doi.org/10.3390/rs12061032
Submission received: 7 February 2020 / Revised: 17 March 2020 / Accepted: 19 March 2020 / Published: 23 March 2020

Abstract

:
For urban planning and environmental monitoring, it is essential to understand the diversity and complexity of cities to identify urban functional regions accurately and widely. However, the existing methods developed in the literature for identifying urban functional regions have mainly been focused on single remote sensing image data or social sensing data. The multi-dimensional information which was attained from various data source and could reflect the attribute or function about the urban functional regions that could be lost in some extent. To sense urban functional regions comprehensively and accurately, we developed a multi-mode framework through the integration of spatial geographic characteristics of remote sensing images and the functional distribution characteristics of social sensing data of Point-of-Interest (POI). In this proposed framework, a deep multi-scale neural network was developed first for the functional recognition of remote sensing images in urban areas, which explored the geographic feature information implicated in remote sensing. Second, the POI function distribution was analyzed in different functional areas of the city, then the potential relationship between POI data categories and urban region functions was explored based on the distance metric. A new RPF module is further deployed to fuse the two characteristics in different dimensions and improve the identification performance of urban region functions. The experimental results demonstrated that the proposed method can efficiently achieve the accuracy of 82.14% in the recognition of functional regions. It showed the great usability of the proposed framework in the identification of urban functional regions and the potential to be applied in a wide range of areas.

Graphical Abstract

1. Introduction

In recent years, urbanization has developed rapidly and globally [1]. As a vital part of urbanization, land use and land cover (LULC) play a seriously important role in environmental protection, infrastructure construction and urban planning [2,3,4,5]. Due to the urbanization development and anthropogenic activities, different urban areas play diverse and sophisticated urban region functions, including business districts, residential areas and industrial areas [6]. These functions and scopes of urban regions are determined not only by governmental instrumentality, but also by people’s actual lifestyle, which may frequently change in the process of urbanization [7]. On the other hand, the actual geographical distribution of urban functional zones is significant to satisfy the lifestyles of citizens and the availability of urban space regions [8]. The fine-scale urban functional zones division not only helps distinguish between working and living areas, but also copes with problems such as traffic congestion, air pollution and waste of land resources [9,10]. Hence, perceiving urban spatial structures accurately and identifying urban functional zones precisely are of great significance for the formulation of productive urban planning policies and regulations.
With the rapid advance of technologies, the remote sensing images with high spatial resolution possess a great potential to extract and analyze urban region functions. It has become a continuously developing research and has been proved to be one of the most useful and effective method in many aspects such as earth observation applications, analysis of urban structure and so on [11,12]. Bratasanu [13] did case study in Romania and first introduced the concept of scene classification which extracting virtual words from spectral features in high-resolution remote sensing images. Zhang [14] have mainly focused on how to combine BoVW and probabilistic topic models to recognize urban region types in Beijing and Zhuhai, China by low-resolution semantic information. Kaliraj [15] researched the Kanyakumari coast in India and exploited Maximum Likelihood Classifier (MLC) algorithm from Landsat ETM+ and TM images to analyze the land use and land cover characteristics. LI [16] investigated a neural network based on deep learning to classify the high spatial resolution remote sensing (HSRRS) images. From the above studies, remote sensing technology can effectively extract the spatial and geographic characteristics of urban functional areas in remote sensing maps [17], which is considered to be the key technology to study the functional alteration of urban land use [18,19,20,21]. In particular, high spatial resolution remote sensing images have led to a satisfactory promotion in fine granularity identification of urban region functions [22,23,24,25]. However, remote sensing techniques perform well in extracting physical characteristics, which include land surface buildings and urban spatial structure but are incapable of reflecting the information of human activities or understand dynamic environments [17,26]. In addition, remote sensing methods can only extract semantic features in urban region information without considering spatial relationships among ground objects and artificial actions. Therefore, it is difficult to accurately sense the urban functional regions only through remote sensing images. The urban region functions are also related to the functional facilities and human activities.
To some extent, social perception and human activities are considered to be better methods of dynamic perception and identification in urban planning [26,27]. There are diverse types of social sensing data, such as POI, mobile phone signals, human mobility, bus swipe data and social media data etc. POI generally refers to all geographic objects that can be abstracted as points, such as schools, restaurants, gas stations, hospitals, banks, supermarkets, etc. [28]. In addition, POI with geographic coordinates generally represents the distribution of functional facilities in urban regions. It plays an important role in social sensing data and has been widely used in amount of research [29]. In contrast to remote sensing methods, social sensing data is widely used to understand urban functional information in different levels with fine spatial-temporal resolution [30]. Hobel and Abdalla [31] researched two European capital cities and demonstrated a semantic region growing method which used the density of POI on OpenStreetMap to analyze the different human activities in different urban function regions, e.g., shopping areas. Yao [6] established an innovative framework which incorporated POI into World2Vec model in the scale of traffic analysis areas(TAZ) and verified in Guangdong, China. The spatial distributions of POI and TAZs have been mentioned, and K-means clustering model was used to research the correlation between POI and TAZs vectors in this research. Based on the correlation, the urban land use types were classified by random forest algorithm (RFA) model. The enormous social data containing spatial attributes can be collected from a various of channels, such as mobile phones, social media, internet and GPS. Above rich social sensing techniques have advantages in urban studies because of their promptness, quantity, and human-social attributes that helps to bridge the semantic gap between region function classification and urban areas. Moreover, POI is the main static data in social data which could provide comprehensive land use information based on anthropogenic activity and geographic location [32], and it is easy to be acquired from various open source tools.
However, the above method analyzed the urban functional regions through single type of data source, ignoring the multi-dimensional information that was acquired from various data source and could reflect the attribute or function about the urban functional regions. To our best knowledge, only a few studies have analyzed urban functional regions mapping by incorporating remote sensing images with social sensing data [33,34,35,36,37]. However, these methods still only use one of the remote sensing images or social sensing data as the dominant data to analyze urban functional regions where the other as the auxiliary one, and concentrated on specific cities or areas. In this study, a multi-mode framework was developed to recognize the urban region functions based on high-resolution remote sensing images and associated POI data. A statistical study of most major cities in China was conducted and a universal method was proposed for identifying urban functional regions. To do so, a deep neural network was first exploited to extract the spatial geographic features in urban regions from high-resolution remote sensing image. Then the relationship between the functional distribution features of various types of POI and the land use function in the region was explored by distance metric. Finally, the two characteristics of different scales at the data-level were integrated to comprehensively identify the functions of urban areas.

2. Data Source

2.1. Functional Classification

According to the urban land use situation of China and the reference of urban land use and planning standards of development land (GB50137-2011) [38], urban functional regions were divided into the following six categories: (a) Green space and square, (b) Industrial area, (c) Administration and public service, (d) Commercial and business facility, (e) Transportation zone, (f) Residence. The detailed information of the functional zone classification is shown in Table 1.

2.2. Remote Sensing Images

The high-resolution remote sensing images used in our research was obtained from Google earth satellite imagery (without any watermarks). It had a 0.60-m spatial resolution and was captured on 3 October 2019. These images were collected from different cities and regions in China, which covered more than 25 provinces, included nearly 300 independent and single functional regions. As is shown in Table 1, the urban land use and planning standards of development land (GB50137-2011) [38] mentioned in Section 2.1 clearly define the sub-functional regions of the six urban region functions. Therefore, the remote sensing images that meet these standards were extracted according to the corresponding categories. In addition, the height and the reflectivity of the objects in remote sensing images are not concerned in this study, so the Digital Surface Model (DSM) was not used for orthorectification. In addition, there were few images that got excessive changes in appearances for the extreme slanting buildings or the effect of the atmosphere. In this case, these images have been abandoned to ensure the rationality of the data. To facilitate the processing of deep neural network, all the images were segmented into 200 × 200 pixels, totaling approximately 16,000 images in all. Some examples are shown in Figure 1 and the map and list of the major regions where remote sensing images were extracted are shown in Figure 2.

2.3. Point-of-Interest

POI is a term in geographic information system, which generally refers to all geographic objects that can be abstracted as points, such as gas stations, hospitals, supermarkets, schools, etc. POI with geographic coordinates generally represents the distribution of functional facilities in urban regions. Meanwhile, some POI can also reflect human activities information, which can be used in population density estimation and other population related fields. In this study, the POI dataset was extracted via application programming interfaces (APIs) provided by Gaode Map Services, which is one of the most widely used search engine and map service provider in China. Developers could acquire information about the POI in the urban regions, which includes name, latitude and longitude, address, type and contact information. Specifically, for the purpose of recognizing the urban region function by combining both remote sensing image features and POI functional features, the POI data associated with above remote sensing regions was obtained. Nearly 220,000 points were extracted and had 19 types, as is shown in Table 2.

3. Methods

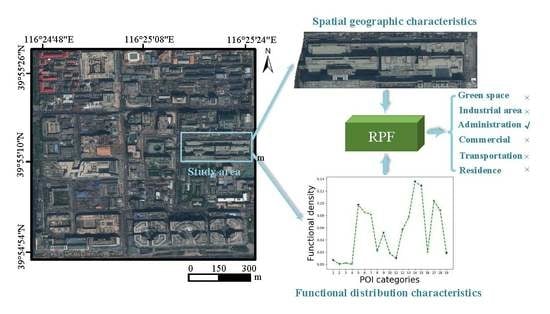
3.1. The Proposed Framework

In this study, a framework is developed that used two different data source and processed these two data with different modes and methods, and then integrated the information in remote sensing images and POI Fused (RPF) module. The proposed multi-mode framework for urban region function recognition is specifically described in Figure 3. First, a deep neural network was designed to extract spatial geographic characteristics from remote sensing images. Second, in order to sensing urban functional regions based on POI data, the functional distribution characteristics were extracted based on the distance metric of POI distribution. Finally, a novel structure named RPF module was proposed to adequately fuse both characteristics which locate at different level in data dimension. The following subsections will demonstrate the detail of above-mentioned modules.

3.2. Urban Functional Regions Classification Based on Remote Sensing Images

In recent years, deep neural network has shown excellent performance in the task of remote sensing image classification and segmentation [16,39,40,41]. Feature maps output from different layers in neural network reflect different characteristics of remote sensing images. Specifically, the high-resolution feature maps output from the shallow layers contain rich outlines and corner points information, and the examples are shown in Figure 4b,e. These feature maps contain abundant detailed information, but lack of the more abstract information [42]. The low-resolution feature maps output from the deep layers contain semantic information, and the examples are shown in Figure 4c,f. These features are abstract and contain a more essential description of images, but the useful detailed information would be lost [43,44]. To make full use of the detailed information in high-resolution feature maps and the semantic information in low-resolution feature maps, a multi-resolution feature fusion model is proposed which is inspired by the research of Ke Sun in pose estimation [45]. The detailed architecture of the network shows in Figure 5a.
In contrast to most existing works in remote sensing classification, our network connects high-to-low subnetwork modules in parallel rather than in series. The network consists of three stages and integrated unit which contain several subnetwork blocks. The first stage contains four residual blocks same to the ResNet-50, which are formed by the bottleneck blocks. In this stage, high-resolution features in remote sensing images are extracted which play a significant role in classification. The second stage is connected by one convolution without reducing the resolution of feature maps output from first stage. In addition, this stage also contains four residual blocks, but the actual architecture is formed by the basic blocks. The bottleneck block and basic block structures are shown in Figure 5b,c. Because the resolution of feature maps has not changed in second stage, the high-resolution information is maintained in the network. The third stage is connected by one 3 × 3 convolution to the first stage and halve the resolution of the feature map. This stage also contains four basic blocks and feature maps contained the low-resolution features. Therefore, the parallel connections between second and third stage make full use of the information of feature maps in different resolution.
Specifically, in order to maintain the high-resolution information which contained rich outlines and corner points information but would be lost in low-resolution features adequately and make the third stage acquire the information of the high-resolution feature maps in second stage for improving the information richness in third stage, we concatenated the feature maps output from each blocks in second and third stages as the input features of the next block in third stages. It allows the features in different levels completely flowing in our network and feature maps output from third stage involves both semantic information and detailed information of images. To fuse the multi-level resolution information, we designed the integrated unit across parallel stage where each resolution information repeatedly fused from other parallel stage. To describe the structure of the integrated unit more clearly, we split this module into three parts in Figure 6. The first part in Figure 6a indicates that the high-resolution feature maps output from second stage is maintained and fused with the low-resolution feature maps output from third stage. The second part in Figure 6b indicates that the low-resolution feature maps output from second stage is maintained and fused with the high-resolution feature maps output from third stage. In addition, the third part in Figure 6c indicates that both feature maps in second and third stage are downsampled by convolution layers and integrated as the new feature maps with lower resolution. The integrated unit fuse the feature maps in second and third stage into different resolution, and the information of each stage is sufficiently used in our model.
The formulation of the integrated unit is shown as follows:
Y i = j = 1 S c X j i
where the X and Y represent the output, feature maps in different stages and integrated unit. S represented the number of stages connected with integrated unit. The function c X j i consists of upsampling or downsampling X from resolution j to resolution i. We adopt 3 × 3 convolutions with stride 2 for downsampling, and adopt the 1 × 1 deconvolutions with stride 2 for upsampling to aligning the number of channels. Through the integrated unit, the high-resolution features and low-resolution features are sufficiently fused. Eventually the spatial geographic characteristics of the urban region are obtained via average pooling layer and fully connected layer behind.
As is mentioned in Section 2.2, the remote sensing images that meet classification standards were extracted according to the corresponding categories. In addition, every image was labeled according to their actual categories. The training data were put into our deep neural network batch by batch with labels, and the output from the average pooling layer was the tensor which shaped (batch size, 16,384). Then the tensor was input to the fully connected layer and SoftMax layer at the end of our neural network and acquired the tensor G shaped (batch size, 6). The values S i of the tensor G are calculated by the SoftMax layer as follows:
S i = S o f t m a x ( G output ) = e S i o u t p u t a = 1 Q e S a o u t p u t , i = 1 , , Q
where G o u t p u t is the tensor output from the fully connected layer, Q is the number of categories and is equal to six in our study. S i o u t p u t is the value in tensor G o u t p u t .
The values S i of the tensor G reflected the probability of different classes for the corresponding images. Therefore, by selecting the category with the largest probability value, we get the prediction classes of the current images. Finally, the network parameters are adjusted through the back propagation of the cross-entropy loss between the predicted classes and the actual labels.

3.3. Urban Functional Regions Classification Based on POI

The above method had indicated the process of urban region function classification based on the remote sensing images. However, there are also various limitations based on single data source of images. To the different functional regions, some images are similar in shape, color and texture but totally different in POI distribution, as is shown in Figure 7. Thus, we used the social sensing data in urban region function classification simultaneously. In this study, we used POI as social data to sense urban functional regions.
GIS map (e.g., Openstreetmap, Baidu map, Gaode map) contains abundant POI information, which are spatial feature points with attribute message such as name, category, longitude and latitude. In addition, these are basically urban spatial information for public needs, which can describe all kinds of engineering and social service facilities in urban space, and contain rich human economy and natural characteristics. Therefore, it is a significant basic geographic data for urban spatial data analysis.
With respect to the POI data in urban regions, the proportion of category and quantity is the main aspect we concern. In this case, we referred the statistical methods in study [7] of POI vectors, and calculated the frequency density f i and functional density d i of the i-th POI category in area r, the formulation show as follow:
f i = N i S r
d i = N i K r
where N i is the number of POIs of the i-th POI category, S r is the area of region r and K r is the total number of POIs in region r. The frequency density vector of region r is denoted by p r = f 1 , f 2 , , f M , the functional density vector of region r is denoted by t r = d 1 , d 2 , , d M , where the M is the number of POI categories. Both of the vectors are defined as spatial distribution vectors and can reflect the spatial distribution characteristics of the urban regions.
To explore the influence of the frequency density f i and functional density d i of POI categories on sensing urban functional regions, the spatial distribution of POI is counted in all of the cities and areas we have acquired in Gaode map. Based on the method of clustering, we divide the spatial distributions of the same urban functional regions into the same category and calculate the mean frequency density p mean Q and mean functional density t mean Q as cluster centroids by Equations (5) and (6):
p mean Q = c = 1 R Q p c R Q
t mean Q = c = 1 R Q t c R Q
where Q is the categories of urban functional regions, R Q is the number of regions we calculated in type Q and c is the c-th region in this urban functional regions. The cluster centroid can reflect the universal statistical characteristics of POI distribution in urban functional regions.
The urban regions in the same category are likely to have the similar POI spatial distributions and the divergences of POI distribution exists in different categories. Therefore, in order to explore the potential relationship between the POI distribution and urban region functions, we propose a method based on distance metric to recognize urban region functions from POI data.
Distance metric is a method to judge the similarity between samples. There are a great many of ways to measure the distance between samples, such as Euclidean distance, cosine distance and Chebyshev distance. Compared with the other methods, cosine similarity metric pays more attention to the difference of direction between the two vectors, rather than the absolute distance or length. In addition, it is widely used in text data process for the sensitiveness in directionality [46,47].
For the above reasons, the spatial distribution characteristic vectors of similar POI categories have roughly the same orientations and angles in high dimension space [6]. Thus, we used the cosine distance to measure the similarity and judge the actual region functions eventually. To estimate the urban region functions by the spatial distribution of POI categories, the cosine distance between the spatial distribution vector of the j-th predicted region and the cluster centroid of the k-th urban functional region is formulated mathematically as follows:
L j cos ine k = 1 t j t k t j t k = 1 n = 1 M t j m × t k m n = 1 M t j m 2 × m = 1 M t k m 2
In Equation (7), t j t k t j t k is the cosine distance from the spatial distribution vector of the j-th predicted region to the cluster centroid of the k-th urban functional region in the range of [−1, 1], t j m and t k m are the spatial distribution vectors with dimensions M, and M is the number of POI categories.
According to the distance measurement between the predicted zone and six urban region functions, we acquired the vector V j = L j 1 , L j 2 , , L j M of the functional distribution characteristic in the predicted area. It contains the distance information which indicates the similarity of high-dimensional POI categories characteristic to the different urban function. Therefore, the predict result based on the POI function distribution is determined by equation:
s = arg min V j
which select the most similar urban region function. Consequently, according to the high-dimensional spatial distribution characteristics of POI categories, we can determine to which urban functional region this area is most likely to belong.

3.4. Urban Functional Regions Classification by Integrating Remote Sensing Images and POI

As is discussed before, the remote sensing images reflect the spatial geographical characteristics and the POI data reflects the functional distribution characteristics in the urban regions. Therefore, to sense urban functional regions more comprehensively, the RPF module is proposed to integrate the two kinds of information in different dimensions, as is shown in Figure 8.
With respect to a special urban region, the remote sensing images and POI can reflect the spatial geographic characteristic and functional distribution characteristic separately. As is shown in Figure 8, the spatial geographic characteristics are extracted through the fully connected layer of the neural network from the remote sensing data. The form of this characteristic is: G j = S j 1 , S j 2 , S j 3 , S j 4 , S j 5 , S j 6 , of which each dimension represents the probability distribution of the region belongs to the corresponding land function. Then the functional distribution characteristics are acquired based on distance metric of this urban region V j = L j 1 , L j 2 , L j 3 , L j 4 , L j 5 , L j 6 , which reflects the cosine similarity between the distribution vector of POI categories in the study region and the cluster centroids of various urban functions.
Both features reflect disparate attributes and obtain diverse dimensions. Otherwise, the functional distribution vector V consists of distribution distance of which the minimum dimension reflects the actual urban function but it is opposed that the maximum dimension in the spatial geographic vector G reflects the actual one. Hence, to fuse both different level features at the data stage, both feature vectors should be normalized through our RPF module. The normalized method shows as follows:
G * , V * = M I N M A X ( G , 1 / V )
the G * and V * are the normalized distribution vectors and the formulation of MINMAX ( X ) is described as follows:
X i * = X i M I N M A X M I N
where X i is the i-th dimension of the vector, M I N and M A X separately represent the minimum and maximum value in the vector.
The spatial geographic features and functional distribution features are normalized to the same data dimension and attain the same degree and level which can be effectively integrated. To further enhance the effect of the fusion of both characteristics and improve the performance of our proposed model, we consider in assigning different weights W G and W V to diverse dimensions of the distribution vectors. For instance, the remote sensing images of commercial areas represent substantial divergence which influence the recognition based on images. In this case, the commercial dimensionality of the spatial geographic characteristics acquired relatively low confidence and would be performed smaller weights. The characteristics of remote sensing images in green space and square are extremely obvious and it improves the performance in images and the corresponding weight would be given more. In this way, the accuracy of the recognition based on remote sensing images in each urban region functions is used as the weight W G of the spatial geographic characteristics and is shown as follows:
W j G = A j j = 1 N A j × N
where W j G describes the j-th dimension of assigned weights, A j is the accuracy of the j-th urban functional region and N is the number of types of urban functional regions.
In addition, the functional distribution characteristics reflect the similarity between the real POI distribution of the region and cluster centroids of each categories, so each dimension has the same degree of confidence. Therefore, we set W j V = 1 . Finally, the multi-dimensional characteristics of urban functional regions are shown as follows:
F j = S U M G j * × W G , V j * × W V
the actual function prediction result of urban area is as follows:
s = arg max F j
By assigning different weights to spatial geographic features and functional distribution features before integrating process, urban function identification can be more accurate.

4. Results

4.1. Experiments and Settings

4.1.1. Experimental Data Description

(a) remote sensing images: All the images were labeled based on the actual categories of urban functional regions. The acquisition of remote sensing images and ground truth labels had been described in Section 2.2 in detail. The urban regions were divided into training set, validation set and test set according to the proportion of 7:1:2, and labeled from 0–5, which indicated the real category of six urban region functions. At the same time, all the images were segmented into 200 × 200 pixels to suit the input of our deep neural network.
(b) POI Data: For the purpose of recognizing urban region functions by fusing features of remote sensing images and POI data, we obtained the POI data corresponding to the urban regions of remote sensing images mentioned above. Some incorrect POI data were manually deleted, such as those duplicate or missing content in collection. There are almost 221,803 POI at all with 19 categories in our theoretical research. The frequency density and functional density of POI distribution for each urban area we collected were counted. At the same time, the cluster centroids of POI distribution in training set were calculated by Equations (5) and (6). The cosine distance metric was used to measure the distance between the POI distribution of urban regions in test set and the cluster centroids of six urban regions functions.

4.1.2. Settings

In this work, our deep neural network was deployed based on the TensorFlow framework. The batch size was set as 64 to cater to the computer memory. The learning rate was set as 0.001, and the cross-entropy loss was used as our loss function. The model was trained until the training loss converged (nearly 100 epochs). In addition, we used the Adam optimizer which was the most popular adaptive learning algorithm. Certainly, the network could be optimized with other methods, such as Momentum, Adagrad, Adadelta and so on. However, it was not the main concern of this paper, we did not do the relevant discussions and experiments here. We trained our model on the Ubuntu 16.04 operating system with 2.5GHZ 48-core E5-2678 v3CPU and 64GB memory. In addition, one NVIDIA GTX 2080ti graphics processing unit (GPU) was used to accelerate. The input of this network is image shaped 200 × 200 × 3 and the output is the category of urban functional regions. The details have been described clearly in Section 3.2.

4.1.3. Experiments

Experiments are designed in the following aspects to verify the superiority and accuracy of the model: (1) The results for sensing urban regions only based on remote sensing images. In this part, we compare the accuracy of our neural network with other commonly used neural network. In addition, the training curve and the confusion matrix was shown to visualize our training process and classification results based on remote sensing images. (2) The results of sensing urban regions only based on POI data. In this part, we make a statistical analysis on the POI distribution of each urban functional area to verify the rationality of the classification method based on POI data. The accuracy of different distance metric was compared, and the confusion matrix was shown to reflect the reasonable of method based on POI data. (3) The results of sensing urban regions based on the fusion of both data. The final accuracy and the confusion matrix of fused model was established to illustrate the effectiveness of our model. (4) The examples of the classification results. It presents the strength and weakness of our model.

4.2. Classification Results Based on Single Remote Sensing Images

To evaluate the performance of our method, we compared our network with the commonly used neural network structures in remote sensing image classification, such as Alexnet [48], Resnet50 [49], Resnet101 [49] and Inceptionv3 [50]. The result shows in Table 3.
Table 3 shows that our deep neural network is actually available in urban region function classification. Meanwhile, the architecture we proposed in this study achieve an accuracy of 71.8%, which is higher than the traditional common neural networks.
To illustrate the effectiveness and rationality of this method, the training curve is shown in Figure 9. With the increase of the number of epochs, the errors in loss function shows an overall downward trend, and tends to be flat and close to zero when approaching 100 epochs. It indicates that the model has converged and learnt most of the image information in the training set.
Figure 10 is the normalized confusion matrix of identifying results based on single remote sensing images. It indicates that the method in our study can achieve high accuracy on image recognition for most of the urban functional regions. However, for some categories, such as commercial and business facility, the accuracy of this urban functional region is 62%, because some of the images in this category are too similar to those in other categories, which causes confusion and disturbance on the recognition process.

4.3. Classification Results Based on Single POI Data

4.3.1. Statistical Analysis of POI Data for Different Urban Functional Regions

To verify the correctness and rationality of the classification method based on POI data, the mean frequency density and mean functional density of each urban functional regions are visualized in Figure 11 and the comparison in Figure 12. From Figure 11 and Figure 12, we find that the mean spatial distribution of various urban function regions is discrepant, which reflects the main functional attributes of the specific urban area to some extent. In addition, we can obtain the following phenomenon:
Industrial area: As is shown in Figure 11, the most POI category in this functional region is the company business, with an extremely higher distribution density than other POI categories in this region. Actually, the industrial areas consist mainly of companies and factories which are all labeled as company business in POI map. In general, the functional attributes in this area are relatively simplex. Compared in Figure 12, we found that otherwise the functional density of company business is higher than other areas, but the frequency density is lowest in every POI category. It means that industrial areas acquired minimum total number of POI in per unit area. Because the geographical location of such functional area is always remote from city center, without a variety of functional facilities in usual.
Residence: This function area is used as residence of citizens since it has a comparatively balanced POI distribution which is shown in Figure 11. Food and beverage, shopping service and life service are the highest three categories which commonly exist in resident areas. It reveals the normal needs of urban residents in their daily life. The other POI categories distribution is relatively flat, and the total POI quantity is moderate.
Administration and public service: The proportion of Healthcare service, Government agency and social organizations, Science and education culture in this urban function area are much higher than that of other functional areas. However, Figure 12 shows that the distribution of above POI categories is not all the most in this region function, since such POI categories like Healthcare and government agencies and social organizations are not always appearing frequently. In addition, in actual urban planning, government institution, schools and hospitals are regularly located in this area.
Green space and square: As is shown in Figure 12, these areas have the second fewest POI in most of the POI categories, which have little functional infrastructure due to the relatively remote geographical location. In addition, in the POI categories distribution of this area, the famous scenery is less than POI types such as food and beverage, shopping service, because this kind of POI is comparatively special and only appears in a specific area, whose total number is generally at miniature level. Nevertheless, the famous scenery plays the significant roles of POI configuration in this function region, which almost hardly occurs in other function areas. In real urban stage, the famous scenery of each city is mainly distributed in this functional area, which is mainly for tourism and leisure. Therefore, shopping and food service POI are relatively abundant, which is conducive to people’s daily life and entertainment needs.
Transportation zone: Compared with other urban function regions, the transport facility service makes greatly efforts to the main distribution of POI configuration in Figure 11. In a word, the function attribute is specialized and unitary in this area. People usually reach these regions only when they need to make transportation and travel in daily life. Accordingly, it consists mainly of stations and a large number of roads with some affiliated shopping and catering services.
Commercial and business facility: Regarding the other urban region functions, the frequency density of nearly all the POI categories are higher than the above areas in Figure 12. That indicates the absolute quantity of POI in this region far exceeds that of other regions, since these areas are always located in the urban center, which is a large collection of POI in this city. Moreover, the shopping service and company business are the two most abundant POI categories in this functional region which are extremely higher than other POI distribution. There are a great many shopping malls, convenience stores and commercial office buildings with various company business settled in the urban status.
As is discussed above, the mean spatial distribution of each urban region functions is quite different from each other, so the method we proposed to calculate the distance between POI distribution of study area and the cluster centroids of each urban region functions is reasonable and can achieve superior results.

4.3.2. Sensing Results Based on POI Data

For activity-based urban function analysis, the POI distribution is the most important data in urban regions. For the sake of exploring the influence of frequency density and function density in distance metric as well as the effect of different distance measures, the contrast experiments were taken and shown in Table 4.
From Table 4, we figure that the frequency density and functional density embody different urban function attribute. To some extent, the result indicates that the functional density is more effective than frequency density based on the distance metric method proposed in our study. Compared with various metric method, the cosine distance makes best performance with accuracy of 69.7%. It proves that the cosine distance is more valid than other traditional distance metric in text data process, which concerns directionality except the numerical value. In addition, the Pearson coefficient is the decentration of cosine distance, so the results are close with each other.
Figure 13 is the normalized confusion matrix of sensing results based on single POI data. It represents that the recognition method based on POI data in our research can achieve quite fine results in most urban functional regions. However, the accuracy of green space and square is just 33%. It shows that there is still weakness in some urban functional regions based on the single data source.

4.4. Classification Results Based on Data Fused

In the cause of effectively distinguishing the urban region function of a specific urban area, the RPF module plays a significant role in the multi-mode fusion framework we proposed since the spatial geographic characteristics and functional distribution characteristics locate in different dimensions. Accordingly, the selection of appropriate normalization mode in RPF module would strongly affect the result of data fusion. Meanwhile, the dissimilar urban region function made diverse influence of characteristic vectors in the study area. We assign different weights to each dimension of the characteristic vectors, and the W G is normalized by the accuracy of identification based on remote sensing images. To assess the capability of our RPF module for data fusion, we compared the image-based, POI-base and fusion method in all. All the results are shown in Table 5 and Table 6.
We report the results of diverse normalization methods used in the RPF module. Among them, SoftMax and minmax normalization methods were widely used in the field of data processing. However, SoftMax normalization would cause some data externalization, which would influence the integration of characteristics. Table 6 manifests that compared with functional identification of urban regions based on single data source, our multi-mode fusion framework improves the performance obviously. In addition, assigning different weights to different dimensions make further efforts to enhance the model performance.
To further analyze the algorithm in this study, a confusion matrix is shown in Table 7. It showed that the framework we proposed of sensing urban functional regions had achieved overall accuracy of 82.14% and kappa coefficient of 75.2%. The area of transportation reached the highest user accuracy of 90%, the lowest for industrial area was 72%. In addition, the producer accuracy of residence attained 99% which was the highest in regions. However, the lowest producer accuracy of 38% was for the commercial and business facility. Because not only the spatial geographic characteristic of this area in remote sensing images were similar to that of the industrial area, but also the functional distribution characteristic in POI data were semblable in these two areas in some extent. In addition, the total number of commercial and business facility was less than industrial area, so the identification results may be dominant by the features of industrial area. Except for commercial and business facility, the accuracy of other regions is higher or flat compared to the results based on the single data source, and more than 75%.

4.5. Examples of Sensing Urban Functional Regions

To illustrate that urban region functions can be recognized from integrating remote sensing images and POI data in urban areas, we demonstrated some dynamic results in different situation in Figure 14.
As we can find that in some case such as the example of transportation zone, the classification based on remote sensing images or POI both acquired the correct results, so the final fused model also got the right result. However, in some instance, such as the examples of industrial area and Administration and public service, the result based on single remote sensing image was correct because of the obviously spatial geographic characteristic, and the result based on POI got the fallacious classification because the actual POI distribution is similar to that of other categories. In addition, our multi-mode framework integrated the different data source adequately and acquired the correct results. Otherwise, such as the examples of residence, green space and square and commercial and business facility had the highly similarity in POI distribution between the actual situation with the ground truth and got the surefire result based on POI data. Despite the remote sensing images reflecting the incorrect spatial geographic characteristic and led the error result, the final fused method also identified the urban functional regions accurately.
Despite the high accuracy of our model, there are still few urban functional regions that are difficult to be identified accurately. Some examples of the false results in our model are shown in Figure 15. The false are mainly focused on the commercial and business facility for the low accuracy which have been shown in Table 7, and we will discuss the accuracy assessment in the next section.

5. Discussion

Our experiments and results showed that the final accuracy was 82.14%, and it was higher than the results of sensing urban functional regions based on single data source. Spatial geographical characteristics in remote sensing images and functional distribution characteristics in POI data were fused in our model to accurately identify urban functional regions. The proportion of these two characteristics would affect the final recognition results of the model.
Specifically, the fused recognition results will be correct if both the sensing results based on remote sensing images and POI data are accurate in urban regions. In addition, there are some urban regions, whose POI distribution are very close to the cluster centroid of the actual category, and are correctly labeled by the method based on single POI data. However, the sensing results of these regions based on remote sensing images are wrong because of some fuzzy appearance features. Through the fusion of characteristics in remote sensing images and POI data, these urban regions can be correctly identified. Similarly, some urban functional regions are correctly labeled based on remote sensing images, and their POI distribution are recognized as other categories. However, if their inter-class discrepancy in the POI distribution is not large enough to outweigh the characteristics from remote sensing images, these urban regions can also be correctly identified by the fusion of spatial geographical characteristics in remote sensing images and functional distribution characteristics in POI data.
In addition, some urban regions are difficult to be correctly labeled by our model. For example, the sensing results based on remote sensing images and POI data are both incorrect, or the discrepancy of spatial geographical characteristics or functional distribution characteristics is so large that these regions cannot be identified accurately. To further solve these deficiencies, we discuss the improvement and solution from remote sensing images and social sensing data, respectively.
On the one hand, for part of remote sensing images in different urban functional regions, their appearance features could be very similar in vertical angle, which would increase classification errors. For this kind of situation, we take more three-dimensional information into account, such as the height of the buildings, etc. which could be acquired from LIDAR or other sources. In addition, the atmosphere factor will also affect the appearances of images, the suitable atmospheric correction will be used in future research. The spatial geographical characteristics of urban functional regions will be reflected more comprehensively by these ways, and different categories will be better differentiated.
On the other hand, apart from POI data, many social sensing data can also be obtained, such as mobile phone data, public transport data and social media data. In the future research, more social sensing data will be further integrated into our model, and the impact of human activities will be considered for refined sensing urban functional regions. Meanwhile, there are many mixed urban region function types in the city, which cannot be accurately identified by the existing methods. Therefore, how to build a more professional and reasonable model to sensing these special mixed functional regions is also one of our research directions.
Despite the above shortcomings, the model proposed in this study can accurately sense the main urban functional regions. In addition, this research can not only help urban planners to make more reasonable urban planning schemes and accurately sense the changes of urban region functions, but also would play an important role in other fields such as environment protection and infrastructure construction.

6. Conclusions

In this paper, a new multi-mode framework is developed for the recognition of urban region functions by integrating spatial geographic characteristics of remote sensing images and functional distribution characteristics of social sensing data of POI. The two characteristics in different dimensions are fused to further improve the identification performance of urban land use functions. The experimental results showed that the integration of remote sensing images and POI could refine the classification and improve accuracy in urban region function recognition based on single data resource previously. The final accuracy of our model is 82.14%. It represents that the spatial geographical characteristics in remote sensing images and the functional distribution characteristics in POI data play positive roles in the recognition of urban functional regions. In addition, an effective new method is proposed for integrating these two data in sensing urban functional regions. A big city will be better understood through the accurate sensing of urban functional regions and it will benefit a variety of aspects, such as urban planning and infrastructure construction.
In future research, we will further consider 3D information in remote sensing images and integrating additional social sensing data into our framework, such as human mobility and public transport data. Otherwise, the recognition of mixed urban functional regions is also one of our future research directions.

Author Contributions

Conceptualization, S.X. and L.Q.; methodology, validation, formal analysis, investigation, S.X.; software, resources, data curation, S.X. and M.L.; writing—original draft preparation, S.X.; writing—review and editing, L.Q., L.H. and Y.P.; visualization, S.X.; supervision, L.Q. and L.S.; project administration and funding acquisition, L.Q. and L.H. All authors have read and agreed to the published version of the manuscript.

Funding

This work was funded by the National Natural Science Foundation of China under the grant 61871278.

Acknowledgments

We acknowledge the funding received from the National Natural Science Foundation of China under the grant 61871278. And we thank the suggestion and support of Chengdu Institute of Urban Planning and Design.

Conflicts of Interest

The authors declare no conflicts of interest.

References

  1. Cohen, B. Urbanization in developing countries: Current trends, future projections, and key challenges for sustainability. Technol. Soc. 2006, 28, 63–80. [Google Scholar] [CrossRef]
  2. Plimmer, F.; Olawore, A. Land Administration for Sustainable Development. Prop. Manag. 2009, 29, 324. [Google Scholar]
  3. Jie, Y.; Yin, Z.; Zhong, H.; Xu, S.; Hu, X.; Wang, J.; Wu, J. Monitoring urban expansion and land use/land cover changes of Shanghai metropolitan area during the transitional economy (1979–2009) in China. Environ. Monit. Assess. 2011, 177, 609–621. [Google Scholar]
  4. Liu, X.; Ma, L.; Li, X.; Ai, B.; Li, S.; He, Z. Simulating urban growth by integrating landscape expansion index (LEI) and cellular automata. Int. J. Geogr. Inf. Sci. 2014, 28, 148–163. [Google Scholar] [CrossRef]
  5. Regan, C. Real options analysis for land use management: Methods, application, and implications for policy. J. Environ. Manag. 2015, 161, 144–152. [Google Scholar] [CrossRef] [PubMed]
  6. Yao, Y.; Xia, L.; Liu, X.; Liu, P.; Ke, M. Sensing spatial distribution of urban land use by integrating points-of-interest and Google Word2Vec model. Int. J. Geogr. Inf. Sci. 2016, 31, 1–24. [Google Scholar] [CrossRef]
  7. Yuan, J.; Zheng, Y.; Xie, X. Discovering regions of different functions in a city using human mobility and POIs. In Proceedings of the 18th ACM SIGKDD international conference on Knowledge Discovery and Data Mining, Beijing, China, 12–16 August 2012; pp. 186–194. [Google Scholar]
  8. Li, M.; Shen, Z.; Hao, X. Revealing the relationship between spatio-temporal distribution of population and urban function with social media data. Geojournal 2016, 81, 1–17. [Google Scholar] [CrossRef]
  9. Huang, W.; Fan, H.; Qiu, Y.; Cheng, Z.; Xu, P.; Qian, Y. Causation mechanism analysis for haze pollution related to vehicle emission in Guangzhou, China by employing the fault tree approach. Chemosphere 2016, 151, 9–16. [Google Scholar] [CrossRef]
  10. Tonne, C.; Halonen, J.I.; Beevers, S.D.; Dajnak, D.; Anderson, H.R. Long-term traffic air and noise pollution in relation to mortality and hospital readmission among myocardial infarction survivors. Int. J. Hyg. Environ. Health 2015, 219, 72–78. [Google Scholar] [CrossRef] [Green Version]
  11. Richter, M.; Weiland, U. Monitoring Urban Land Use Changes with Remote Sensing Techniques; Wiley-Blackwell: Oxford, UK, 2011. [Google Scholar]
  12. Herold, M.; Couclelis, H.; Clarke, K.C. The role of spatial metrics in the analysis and modeling of urban land use change. Comput. Environ. Urban Syst. 2005, 29, 369–399. [Google Scholar] [CrossRef]
  13. Bratasanu, D.; Nedelcu, I.; Datcu, M. Bridging the Semantic Gap for Satellite Image Annotation and Automatic Mapping Applications. IEEE J. Sel. Top. Appl. Earth Obs. Remote Sens. 2011, 4, 193–204. [Google Scholar] [CrossRef] [Green Version]
  14. Zhang, X.; Du, S. A Linear Dirichlet Mixture Model for decomposing scenes: Application to analyzing urban functional zonings. Remote Sens. Environ. 2015, 169, 37–49. [Google Scholar] [CrossRef]
  15. Kaliraj, S.; Chandrasekar, N.; Ramachandran, K.; Srinivas, Y.; Saravanan, S. Coastal landuse and land cover change and transformations of Kanyakumari coast, India using remote sensing and GIS. Egypt. J. Remote Sens. Space Sci. 2017, 20, 169–185. [Google Scholar] [CrossRef]
  16. Li, W.; Liu, H.; Wang, Y.; Li, Z.; Jia, Y.; Gui, G. Deep Learning-Based Classification Methods for Remote Sensing Images in Urban Built-up Areas. IEEE Access 2019, 7, 36274–36284. [Google Scholar] [CrossRef]
  17. Pei, T.; Sobolevsky, S.; Ratti, C.; Shaw, S.L.; Li, T.; Zhou, C. A new insight into land use classification based on aggregated mobile phone data. Int. J. Geogr. Inf. Sci. 2014, 28, 1988–2007. [Google Scholar] [CrossRef] [Green Version]
  18. Coulter, L.L.; Stow, D.A.; Tsai, Y.H.; Ibanez, N.; Shih, H.c.; Kerr, A.; Benza, M.; Weeks, J.R.; Mensah, F. Classification and assessment of land cover and land use change in southern Ghana using dense stacks of Landsat 7 ETM+ imagery. Remote Sens. Environ. 2016, 184, 396–409. [Google Scholar] [CrossRef]
  19. Gómez, C.; White, J.C.; Wulder, M.A. Optical remotely sensed time series data for land cover classification: A review. ISPRS J. Photogramm. Remote Sens. 2016, 116, 55–72. [Google Scholar] [CrossRef] [Green Version]
  20. Pagliarella, M.C.; Sallustio, L.; Capobianco, G.; Conte, E.; Corona, P.; Fattorini, L.; Marchetti, M. From one- to two-phase sampling to reduce costs of remote sensing-based estimation of land-cover and land-use proportions and their changes. Remote Sens. Environ. 2016, 184, 410–417. [Google Scholar] [CrossRef]
  21. Peng, F.; Weng, Q. A time series analysis of urbanization induced land use and land cover change and its impact on land surface temperature with Landsat imagery. Remote Sens. Environ. 2016, 175, 205–214. [Google Scholar]
  22. Comber, A.J.; Brunsdon, C.; Farmer, C. Community detection in spatial networks: Inferring land use from a planar graph of land cover objects. Int. J. Appl. Earth Obs. Geoinf. 2012, 18, 274–282. [Google Scholar] [CrossRef] [Green Version]
  23. Li, M.; Stein, A.; Bijker, W.; Zhan, Q. Urban land use extraction from Very High Resolution remote sensing imagery using a Bayesian network. ISPRS J. Photogramm. Remote Sens. 2016, 122, 192–205. [Google Scholar] [CrossRef]
  24. Pacifici, F.; Chini, M.; Emery, W.J. A neural network approach using multi-scale textural metrics from very high-resolution panchromatic imagery for urban land-use classification. Remote Sens. Environ. 2009, 113, 1276–1292. [Google Scholar] [CrossRef]
  25. Voltersen, M.; Berger, C.; Hese, S.; Schmullius, C. Object-based land cover mapping and comprehensive feature calculation for an automated derivation of urban structure types at block level. Remote Sens. Environ. 2014, 154, 192–201. [Google Scholar] [CrossRef]
  26. Liu, Y.; Liu, X.; Gao, S.; Gong, L.; Kang, C.; Zhi, Y.; Chi, G.; Shi, L. Social Sensing: A New Approach to Understanding Our Socioeconomic Environments. Ann. Assoc. Am. Geogr. 2015, 105, 512–530. [Google Scholar] [CrossRef]
  27. Yang, H.; Wolfson, O.; Zheng, Y.; Capra, L. Urban Computing: Concepts, Methodologies, and Applications. ACM Trans. Intell. Syst. Technol. 2014, 5, 38. [Google Scholar]
  28. Hu, Y.; Han, Y. Identification of Urban Functional Areas Based on POI Data: A Case Study of the Guangzhou Economic and Technological Development Zone. Sustainability 2019, 11, 1385. [Google Scholar] [CrossRef] [Green Version]
  29. Chi, M.; Sun, Z.; Qin, Y.; Shen, J.; Benediktsson, J.A. A Novel Methodology to Label Urban Remote Sensing Images Based on Location-Based Social Media Photos. Proc. IEEE 2017, 105, 1926–1936. [Google Scholar] [CrossRef]
  30. Gao, S.; Janowicz, K.; Couclelis, H. Extracting urban functional regions from points of interest and human activities on location-based social networks. Trans. GIS 2017, 21, 446–467. [Google Scholar] [CrossRef]
  31. Hobel, H.; Abdalla, A.; Fogliaroni, P.; Frank, A.U. A Semantic Region Growing Algorithm: Extraction of Urban Settings. In AGILE 2015: Geographic Information Science as an Enabler of Smarter Cities and Communities; Fernando, B., Maribel, Y.S., Eds.; Springer International Publishing: Cham, Switzerland, 2015. [Google Scholar]
  32. Song, J.; Lin, T.; Li, X.; Prishchepov, A.V. Mapping Urban Functional Zones by Integrating Very High Spatial Resolution Remote Sensing Imagery and Points of Interest: A Case Study of Xiamen, China. Remote Sens. 2018, 10, 1737. [Google Scholar] [CrossRef] [Green Version]
  33. Liu, X.; He, J.; Yao, Y.; Zhang, J.; Ye, H. Classifying urban land use by integrating remote sensing and social media data. Int. J. Geogr. Inf. Sci. 2017, 31, 1675–1696. [Google Scholar] [CrossRef]
  34. Hu, T.; Yang, J.; Li, X.; Gong, P. Mapping Urban Land Use by Using Landsat Images and Open Social Data. Remote Sens. 2016, 8, 151. [Google Scholar] [CrossRef]
  35. Zhang, Y.; Li, Q.; Huang, H.; Wu, W.; Du, X.; Wang, H. The Combined Use of Remote Sensing and Social Sensing Data in Fine-Grained Urban Land Use Mapping: A Case Study in Beijing, China. Remote Sens. 2017, 9, 865. [Google Scholar] [CrossRef] [Green Version]
  36. Benza, M.; Weeks, J.R.; Stow, D.A.; López-Carr, D.; Clarke, K.C. A pattern-based definition of urban context using remote sensing and GIS. Remote Sens. Environ. 2016, 183, 250–264. [Google Scholar] [CrossRef] [Green Version]
  37. Jia, Y.; Ge, Y.; Ling, F.; Guo, X.; Wang, J.; Wang, L.; Cheng, Y.; Li, X. Urban land use mapping by combining remote sensing imagery and mobile phone positioning data. Remote Sens. 2018, 10, 446. [Google Scholar] [CrossRef] [Green Version]
  38. Haiyan, X.; Wangfeng, Z.; Huailu, C.; Shouqian, C. Comparative Analysis of New and Old “Code for Classification of Urban Land Use and Planning Standards of Development Land”. Modern Urban Res. 2015, 11, 69–75. [Google Scholar]
  39. Krylov, V.A.; Martino, M.D.; Moser, G.; Serpico, S.B. Large urban zone classification on SPOT-5 imagery with convolutional neural networks. In Proceedings of the IGARSS 2016—2016 IEEE International Geoscience and Remote Sensing Symposium, Beijing, China, 10–15 July 2016. [Google Scholar]
  40. Kampffmeyer, M.; Salberg, A.B.; Jenssen, R. Urban Land Cover Classification with Missing Data Modalities Using Deep Convolutional Neural Networks. IEEE J. Sel. Top. Appl. Earth Obs. Remote Sens. 2018, 11, 1758–1768. [Google Scholar] [CrossRef] [Green Version]
  41. Maggiori, E.; Tarabalka, Y.; Charpiat, G.; Alliez, P. Fully convolutional neural networks for remote sensing image classification. In Proceedings of the IGARSS 2016—2016 IEEE International Geoscience and Remote Sensing Symposium, Beijing, China, 10–15 July 2016. [Google Scholar]
  42. Yi, S.; Wang, X.; Tang, X. Deep Convolutional Network Cascade for Facial Point Detection. In Proceedings of the 26th IEEE Conference on Computer Vision and Pattern Recognition, Portland, OR, USA, 23–28 June 2013. [Google Scholar]
  43. Hinton, G.; Salakhutdinov, R. Reducing the Dimensionality of Data with Neural Networks. Science 2006, 313, 504–507. [Google Scholar] [CrossRef] [Green Version]
  44. Ouyang, W.; Luo, P.; Zeng, X.; Qiu, S.; Tian, Y.; Li, H. DeepID-Net: Deformable Deep Convolutional Neural Networks for Object Detection. IEEE Trans. Pattern Anal. Mach. Intell. 2016, 39, 1320–1334. [Google Scholar] [CrossRef]
  45. Sun, K.; Xiao, B.; Liu, D.; Wang, J. Deep High-Resolution Representation Learning for Human Pose Estimation. In Proceedings of the 2019 IEEE Conference on Computer Vision and Pattern Recognition (CVPR), Long Beach, CA, USA, 16–20 June 2019. [Google Scholar]
  46. France, S.; Carroll, D. Is the Distance Compression Effect Overstated? Some Theory and Experimentation. In International Workshop on Machine Learning and Data Mining in Pattern Recognition; Springer: Berlin/Heidelberg, Germany, 2009; pp. 280–294. [Google Scholar]
  47. Strehl, A.; Ghosh, J.; Mooney, R. Impact of similarity measures on web-page clustering. In Workshop on Artificial Intelligence for Web Search (AAAI); AAAI: Menlo Park, CA, USA, 2000; Volume 58, p. 64. [Google Scholar]
  48. Gong, C.; Junwei, H.; Xiaoqiang, L. Remote Sensing Image Scene Classification: Benchmark and State of the Art. Proc. IEEE 2017, 105, 1865–1883. [Google Scholar]
  49. He, K.; Zhang, X.; Ren, S.; Jian, S. Deep Residual Learning for Image Recognition. In Proceedings of the 2016 IEEE Conference on Computer Vision and Pattern Recognition (CVPR), Las Vegas, NV, USA, 27–30 June 2016. [Google Scholar]
  50. Christian, S.; Vincent, V.; Sergey, I.; Jonathon, S.; Zbigniew, W. Rethinking the inception architecture for computer vision. In Proceedings of the 2016 IEEE Conference on Computer Vision and Pattern Recognition (CVPR), Las Vegas, NV, USA, 27–30 June 2016. [Google Scholar]
Figure 1. The remote sensing images of different urban functional regions. (a) Commercial and business facility, (b) Industrial area, (c) Green space and square, (d) Administration and public service, (e) Residence, (f) Transportation zone.
Remotesensing 12 01032 g001
Figure 2. The major regions of the remote sensing images collected.
Remotesensing 12 01032 g002
Figure 3. The framework for discovering urban functional regions.
Remotesensing 12 01032 g003
Figure 4. Feature maps in different resolution. (a,d) The original remote sensing images. (b,e) The high-resolution feature maps that contain the outlines and corner points information of images. (c,f) The low-resolution feature maps that contain the semantic information of images.
Remotesensing 12 01032 g004
Figure 5. The architecture of our proposed neural network and the module of the bottleneck block and basic block. (a) The architecture of our network. (b) The architecture of the bottleneck block. (c) The architecture of the basic block.
Remotesensing 12 01032 g005
Figure 6. Three parts of the integrated unit. Different resolution feature maps are fused by the output feature maps of second and third stage. The blue blocks are the high-resolution feature maps. The green blocks are the low-resolution feature maps. The orange block is the lower resolution feature maps. (a) The high-resolution features are maintained. (b) The low-resolution features are maintained. (c) The lower resolution features are extracted.
Remotesensing 12 01032 g006
Figure 7. Different urban functional regions would be similar in shape, color or texture of remote sensing images, but totally different in POI distribution. These urban regions would be confused by remote sensing images, but clearly differentiated by POI data.
Remotesensing 12 01032 g007
Figure 8. The architecture of the RPF module.
Remotesensing 12 01032 g008
Figure 9. The training curve of the model. The training curve of the model. With the increase of epochs, the loss decreases gradually, and the accuracy of the model is improved.
Remotesensing 12 01032 g009
Figure 10. The confusion matrix of the identifying results based on remote sensing images.
Remotesensing 12 01032 g010
Figure 11. The POI categories distribution in terms of Frequency density (bold line) and Functional density (dash line) for various urban functional regions.
Remotesensing 12 01032 g011
Figure 12. Comparison of POI distribution in these urban functional regions.
Remotesensing 12 01032 g012
Figure 13. The confusion matrix of the identifying results based on POI data.
Remotesensing 12 01032 g013
Figure 14. Some right examples of our proposed method in different situation. The ground truth represents the urban region function of example area. The remote sensing image represents the spatial geographic scenery of this area. The Actual POI distribution represents the actual POI distribution in this area. The POI distribution of ground truth represents the POI distribution in this urban functional region. The Normalized distribution vector V * = L C , L I , L G , L A , L R , L T represents the similarity calculated by our distance metric method. In addition, the “C-Commercial and business facility”, “I-Industrial area”, “G-Green space and square”, “A-Administration and public service”, “R-Residence”, “T-Transportation zone”. The Result represents the identification of urban functional regions base on different data source.
Remotesensing 12 01032 g014
Figure 15. Some false examples of our proposed method in different situation. The special results of our proposed method in different situation. The ground truth represents the urban region function of example area. The remote sensing image represents the spatial geographic scenery of this area. The Actual POI distribution represents the actual POI distribution in this area. The POI distribution of ground truth represents the POI distribution in this urban functional region. The Normalized distribution vector V * = L C , L I , L G , L A , L R , L T represents the similarity calculated by our distance metric method. In addition, the “C-Commercial and business facility”, “I-Industrial area”, “G-Green space and square”, “A-Administration and public service”, “R-Residence”, “T-Transportation zone”. The Result represents the identification of urban functional regions base on different data source.
Remotesensing 12 01032 g015
Table 1. The categories of urban functional regions based on the urban land use and planning standards of development land (GB50137-2011) [38].
First LevelSecond LevelThird Level
Residence/Residential areas
Industrial area/Factory, Industrial zone
Transportation zoneTraffic hinge landAirport, Railway station, Bus station
Administration and public serviceAdministrative landParty and government organizations, Public institution
Cultural facilities landScience and technology museum, Library, Art museum
Education and research landColleges and universities, Middle schools, Primary schools
Medical and sanitary landGeneral hospital, Specialized hospital
Commercial and business facilityCommercial facility landCatering and other services land, Commercial and hotel
Commercial neighborhoodBusiness office building
Green space and squarePublic parkPark, Botanical garden
Scenic spots landScenic area, National park
Table 2. POI category taxonomy.
CodePOI CategoryCodePOI Category
1Car service11Famous scenery
2Car sale12Business residence
3Vehicle maintenance13Government agency and Social organization
4Motorcycle service14Science and Education culture
5Food and Beverage15Transport facility service
6Shopping service16Financial and Insurance service
7Life service17Company business
8Sports leisure service18Place name address information
9Healthcare service19Communal facility
10Accommodation service
Table 3. The accuracy of single stage in remote sensing images.
 ModelAccuracy
 Alexnet [48]56.7%
 Resnet50 [49]64.0%
 Resnet101 [49]65.7%
 Inceptionv3 [50]67.7%
Ours71.8%
Table 4. The accuracy of single stage in different metric method based on POI attribute.
POI AttributeMetric MethodAccuracy
Frequency densityEuclidean distance51.5%
Chebyshev distance54.6%
Pearson coefficient63.6%
Cosine distance60.6%
Functional densityEuclidean distance63.6%
Chebyshev distance57.6%
Pearson coefficient66.7%
Cosine distance69.7%
Table 5. The accuracy of different normalization method.
POI AttributeNormalization MethodAccuracy
Frequency densitySoftMax72.1%
Minmax-pro59.3%
Minmax72.2%
Functional densitySoftMax76.7%
Minmax-pro58.9%
Minmax77.8%
Table 6. The accuracy of single stage in remote sensing images.
 MethodAccuracy
 Remote sensing image-only71.8%
 POI-only69.7%
 Data fuse77.8%
Data fuse(assign weights)82.1%
Table 7. The confusion matrix of the urban functional region extraction.
Urban Functional
Regions
Commercial and
Business Facility
Industrial
Area
Green Space
and Square
Administration and
Public Service
ResidenceTransportationProducer
Accuracy
Commercial and
business facility
861252140138%
Industrial area13260780080%
Green space
and square
21028527321276%
Administration and
public service
00353321090%
Residence1002373299%
Transportation001122013180%
User Accuracy79%72%86%73%88%90%
Overall accuracy = 82.14%, kappa coefficient = 75.24%.

