Letter

Evaluation of the Simard et al. 2011 Global Canopy Height Map in Boreal Forests

Center for Environmental Remote Sensing, Chiba University, Chiba 263-8522, Japan
*
Author to whom correspondence should be addressed.
Remote Sens. 2020, 12(7), 1114; https://doi.org/10.3390/rs12071114
Submission received: 14 January 2020 / Revised: 29 March 2020 / Accepted: 30 March 2020 / Published: 31 March 2020
(This article belongs to the Section Environmental Remote Sensing)

Abstract

:
Light detection and ranging (LiDAR) provides a state-of-the-art technique for measuring forest canopy height. Nevertheless, it may miss some forests due to its spatial separation of individual spots. A number of efforts have been made to overcome the limitation of global LiDAR datasets to generate wall-to-wall canopy height products, among which a global satellite product produced by Simard et al. (2011) (henceforth, the Simard-map) has been the most widely applied. However, the accuracy of the Simard-map is uncertain in boreal forests, which play important roles in the terrestrial carbon cycle and are encountering more extensive climate changes than the global average. In this letter, we evaluated the Simard-map in boreal forests through a literature review of field canopy height. Our comparison shows that the Simard-map yielded a significant correlation with the field canopy height (R2 = 0.68 and p < 0.001). However, remarkable biases were observed with the root mean square error (RMSE), regression slope, and intercept of 6.88 m, 0.448, and 10.429, respectively. Interestingly, we found that the evaluation results showed an identical trend with a validation of moderate-resolution imaging spectroradiometer (MODIS) tree-cover product (MOD44B) in boreal forests, which was used as a crucial input data set for generating the Simard-map. That is, both the Simard-map and MOD44B yielded an overestimation (underestimation) in the lower (upper) tails of the scatterplots between the field and satellite data sets. This indicates that the MOD44B product is the likely source of error for the estimation biases of the Simard-map. Finally, a field calibration was performed to improve the Simard-map in boreal forests by compensating for the estimation biases and discarding non-forest areas, which provided a more reliable canopy height product for future applications.

Graphical Abstract

1. Introduction

Forest canopy height is regarded as one of the most important forest attributes, in terms of indicating forest biomass, carbon storage, species diversity, and other forest ecosystem functions [1,2,3]. Moreover, canopy height has also been used to facilitate the generation of global land-cover maps by separating the forests from other vegetation types in several widely used classification schemes, including the International Geosphere-Biosphere Programme (IGBP) and the Food and Agriculture Organization (FAO) [4,5].
Forest canopy height is traditionally measured through non-destructive methods in field surveys by using instruments such as a dendrometric table, Blume Leiss, and Bitterlich relascope. The rationale for measuring canopy height is based on the trigonometric relationships between the distance from the measurement point to a tree and the angle between the displacements from the measurement point to the top and base of the tree [6]. The field measurement of canopy height can be of high accuracy if clear visibility is available for both the top and the base of a target tree. However, it is usually very time-consuming, labor-intensive, and difficult to implement on a large scale over long-term periods.
In contrast, light detection and ranging (LiDAR) provides a state-of-the-art remote-sensing technique for measuring canopy height accurately and efficiently on a large scale [7,8]. As the first space-borne LiDAR system, the Geoscience Laser Altimeter System (GLAS) launched in 2003 has achieved unprecedented scientific successes in providing forest canopy height and biomass at regional-to-global scales in an operational manner [9,10]. Consequently, several successive space-borne LiDAR projects, such as the Ice, Cloud, and Land Elevation Satellite-2 (ICESat-2) [11] and Global Ecosystem Dynamics Investigation (GEDI) [12] of the National Aeronautics and Space Administration (NASA) and the Multi-footprint Observation Lidar and Imager (MOLI) of the Japan Aerospace Exploration Agency (JAXA) [13], have been launched or are in the planning stage. However, space-borne LiDAR may miss some measurements of forest areas because of its spatial separation of individual spots. For example, the GLAS observations can only provide the footprints of 65 m in diameter spaced by 170 m along track and several tens of kilometers across tracks [14].
To overcome the limitation of the GLAS-based canopy height, many efforts have been made to generate wall-to-wall canopy-height products at a national-to-global scale in recent decades. For example, Lefsky [15] developed an empirical regression model to generate the first global forest canopy-height product based on a combination of GLAS and moderate-resolution imaging spectroradiometer (MODIS) data at 500 m spatial resolution. Simard et al. [14] produced the second global wall-to-wall canopy height product at 1 km resolution using a random forest algorithm based on the combination of GLAS data and seven ancillary variables of climatic and remote-sensing data. Los et al. [16] also generated a canopy height product between 60° S and 60° N with a coarse resolution (0.5° × 0.5°) using all the GLAS data collected from 2003 to 2009. Moreover, Wang et al. [17] generated the global distributions of mean forest canopy height at 500 m resolution using the GLAS data collected from 2005 to 2006 and 13 ancillary variables. Huang et al. [18] mapped vegetation heights in China using the slope correction GLAS data, Shuttle Radar Topography Mission (SRTM)-based, MODIS-based, and climatic data sets.
Among these wall-to-wall canopy height products, the one generated by Simard et al. [14] has been the most widely applied in many respects, possibly due to its easy availability and reliability in the existing validations. For example, the product has been used for estimating forest stand age in China [19,20], revealing the relationship between the spatial distribution of water availability and forest canopy height [21], and analyzing the aboveground carbon stocks of the global mangrove canopy [22]. However, it has also been pointed out that the canopy height product of Simard et al. [14] showed remarkable biases in various study areas, including the forests in China [18,19] and the tropical forests in central Africa [23]. More extensive evaluation efforts in different regions are needed to derive a more comprehensive assessment of this global canopy height product. This is helpful not only for improving the quality of this product but also for guaranteeing the reliability of related applications. Specifically, it is unclear how the product performs in boreal forests, which play a crucial role in global terrestrial carbon cycles and are encountering more extensive climate change than global averages [24].
Consequently, the objectives of this study were (1) to evaluate the performances of the global canopy product of Simard et al. [14] in boreal forests using the field measurements of tree height derived from literature surveys, and (2) to analyze the possible means to further improve the product in boreal forests.

2. Materials and Methods

2.1. Global Satellite Product of Canopy Height and Moderate-Resolution Imaging Spectroradiometer (MODIS) Data

We downloaded the global satellite product of canopy height in 2005 with a spatial resolution of 1 km developed by Simard et al. [14] (the Simard-map). The Simard-map was generated by a random forest-based algorithm using the combined datasets of the GLAS-based canopy height, climate and elevation data sets, and the MODIS percent tree-cover product in 2005 (i.e., MOD44B Collection 4 version) [25]. It provides an estimation of maximum canopy height within an area of 1 km × 1 km. The Simard-map yielded an acceptable accuracy with root mean square error (RMSE) and coefficient of determination (R2) of 6.1 m and 0.5, respectively, through the validation based on the in situ canopy heights measured at 66 FLUXNET sites mainly located in broadleaved deciduous and needleleaved evergreen forests.
We also downloaded the MODIS land-cover product (MCD12Q1) [26] and MODIS tree-cover product (MOD44B) [27] in 2005 from the Land Processes Distributed Active Archive Center (LP DAAC) for comparison analysis.

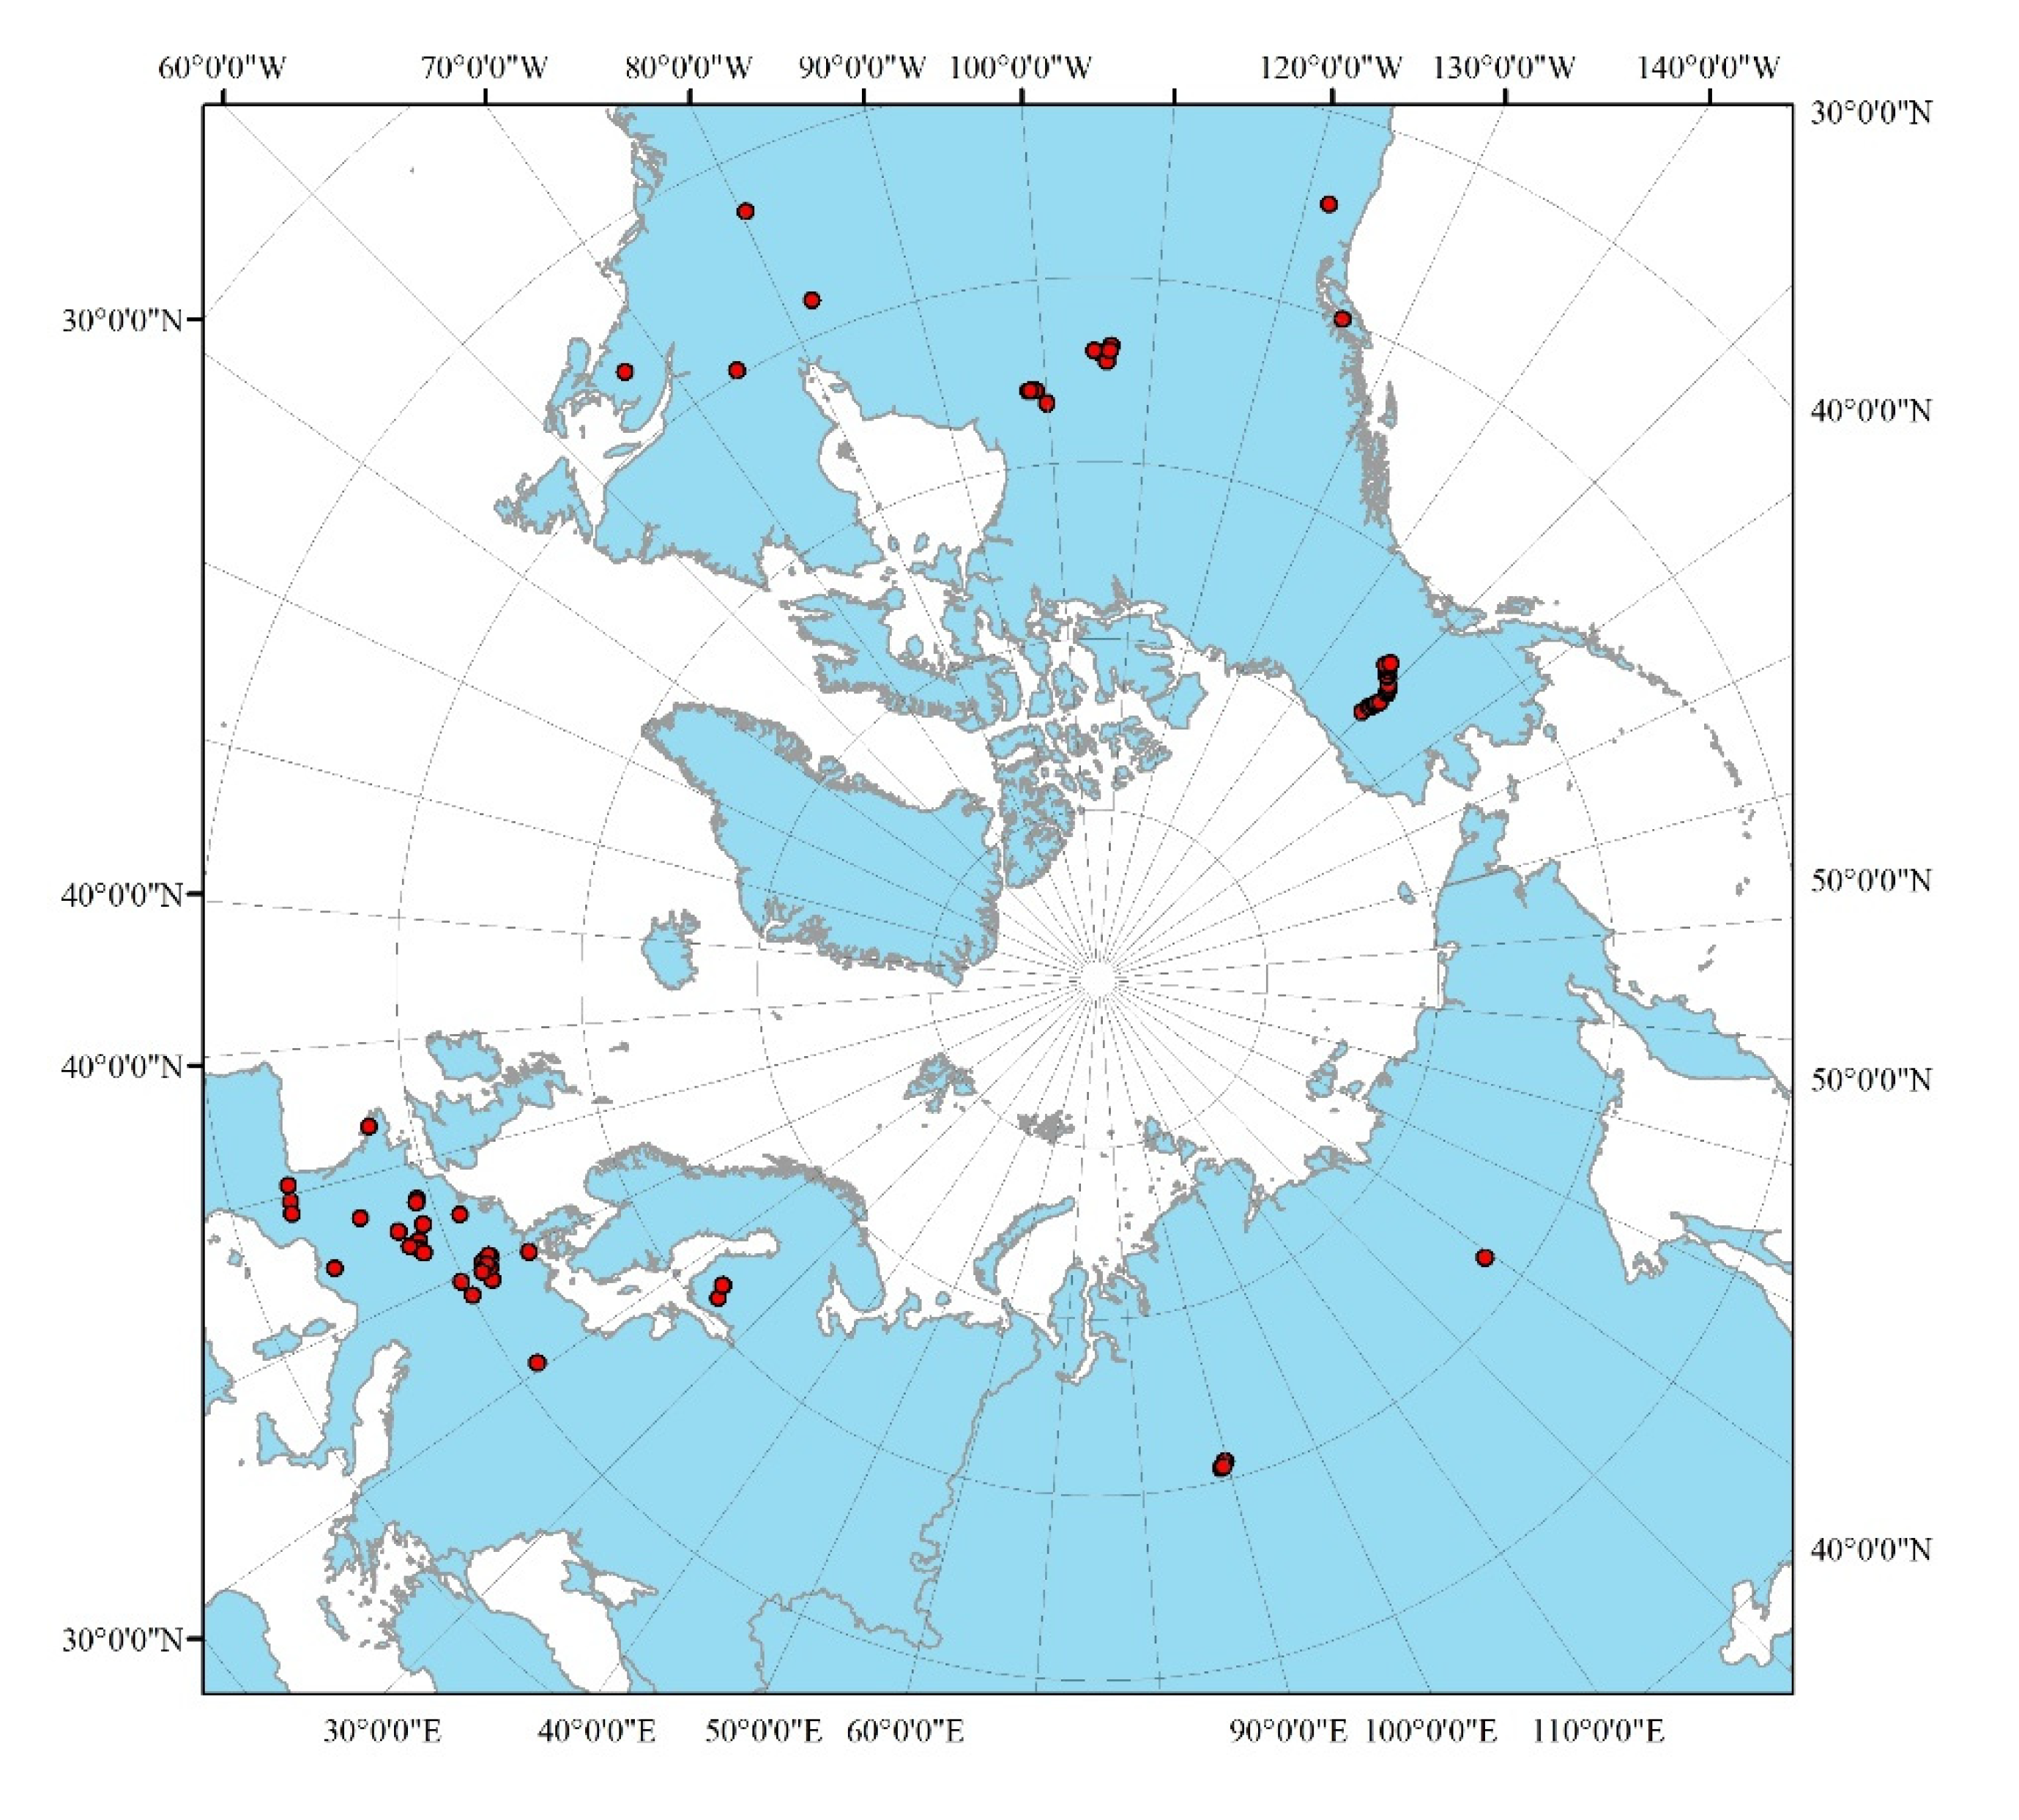
2.2. Collection of Field Canopy Heights from the Literature

We collected the field canopy heights measured in boreal forests (i.e., latitude higher than 40° N) from the literature to quantitatively evaluate the Simard-map. We conducted a literature survey based on online databases (e.g., the Institute for Scientific Information (ISI) Web of Science and Google Scholar) using the search terms “forest” and “tree/canopy height” with the filter for publication year set to later than 1995. Moreover, we also referred to the literature list provided by Iio et al. [28]. In total, we reviewed 448 literature resources (see Supplementary Materials for detail).
The minimum criteria for inclusion of canopy height data are as follows: (1) the latitude and longitude of the study plots were provided; (2) the investigation year and forest stand age were presented; and (3) the observed plots were nominally “homogenous” in the description of the literature. We extracted the following data: in situ measurements of canopy height, site location information (latitude and longitude), forest stand age, investigation year as well as other ancillary information including leaf area index (LAI), diameter at breast height (DBH), tree species, and tree density (see Table S1 in the Supplementary Materials). For sites with more than one measurement of canopy height, the maximum value was used for evaluation, to get the match-up with the estimation of maximum canopy of the Simard-map for any given 1 km × 1 km area. It is worth noting that the canopy heights in the reviewed literature were mainly measured by methods based on relascope, clinometer, flux tower observations, and DBH–height relationship derived from destructive measurements. These are all commonly used methods for measuring forest canopy height [6], which suggests that the assembled canopy height measurements are comparable.

2.3. Evaluation and Calibration Methods

Because the Simard-map of canopy height was generated for the year 2005, we first screened the field data measured in 2005. Correspondingly, there were only 17 sites retained for 2005. Therefore, we defined a forest age criterion to gather more applicable validation data as follows. Considering the asymptotic trend of canopy height increase to tree age [29], we applied the percentage ratio of the difference between the measurement year (Ymeas) and 2005 to the forest age (AGE) to define the selection criterion (SC):
S C = 100 % × | Y m e a s 2005 | A G E
The sites with SC values lower than 5% were also collected and used as evaluation datasets. Through this, we finally obtained 88 observation sites in total (Figure 1 and Table S1).
The root mean square error (RMSE) was used in the accuracy assessment of the Simard-map:
R M S E = i = 1 N ( X f i e l d , i X p r o d u c t , i ) 2 N
where N is the number of field samples used for evaluation; Xfield,i and Xproduct,i indicate the field measurements and the Simard-map of canopy height, respectively. The coefficient of determination (R2) between Xfield,i and Xproduct,i was also computed.
Moreover, the derived linear regression relationship between Xfield,i and Xproduct,i was applied to calibrate the Simard-map located in boreal forests (i.e., latitude higher than 40° N).

3. Results

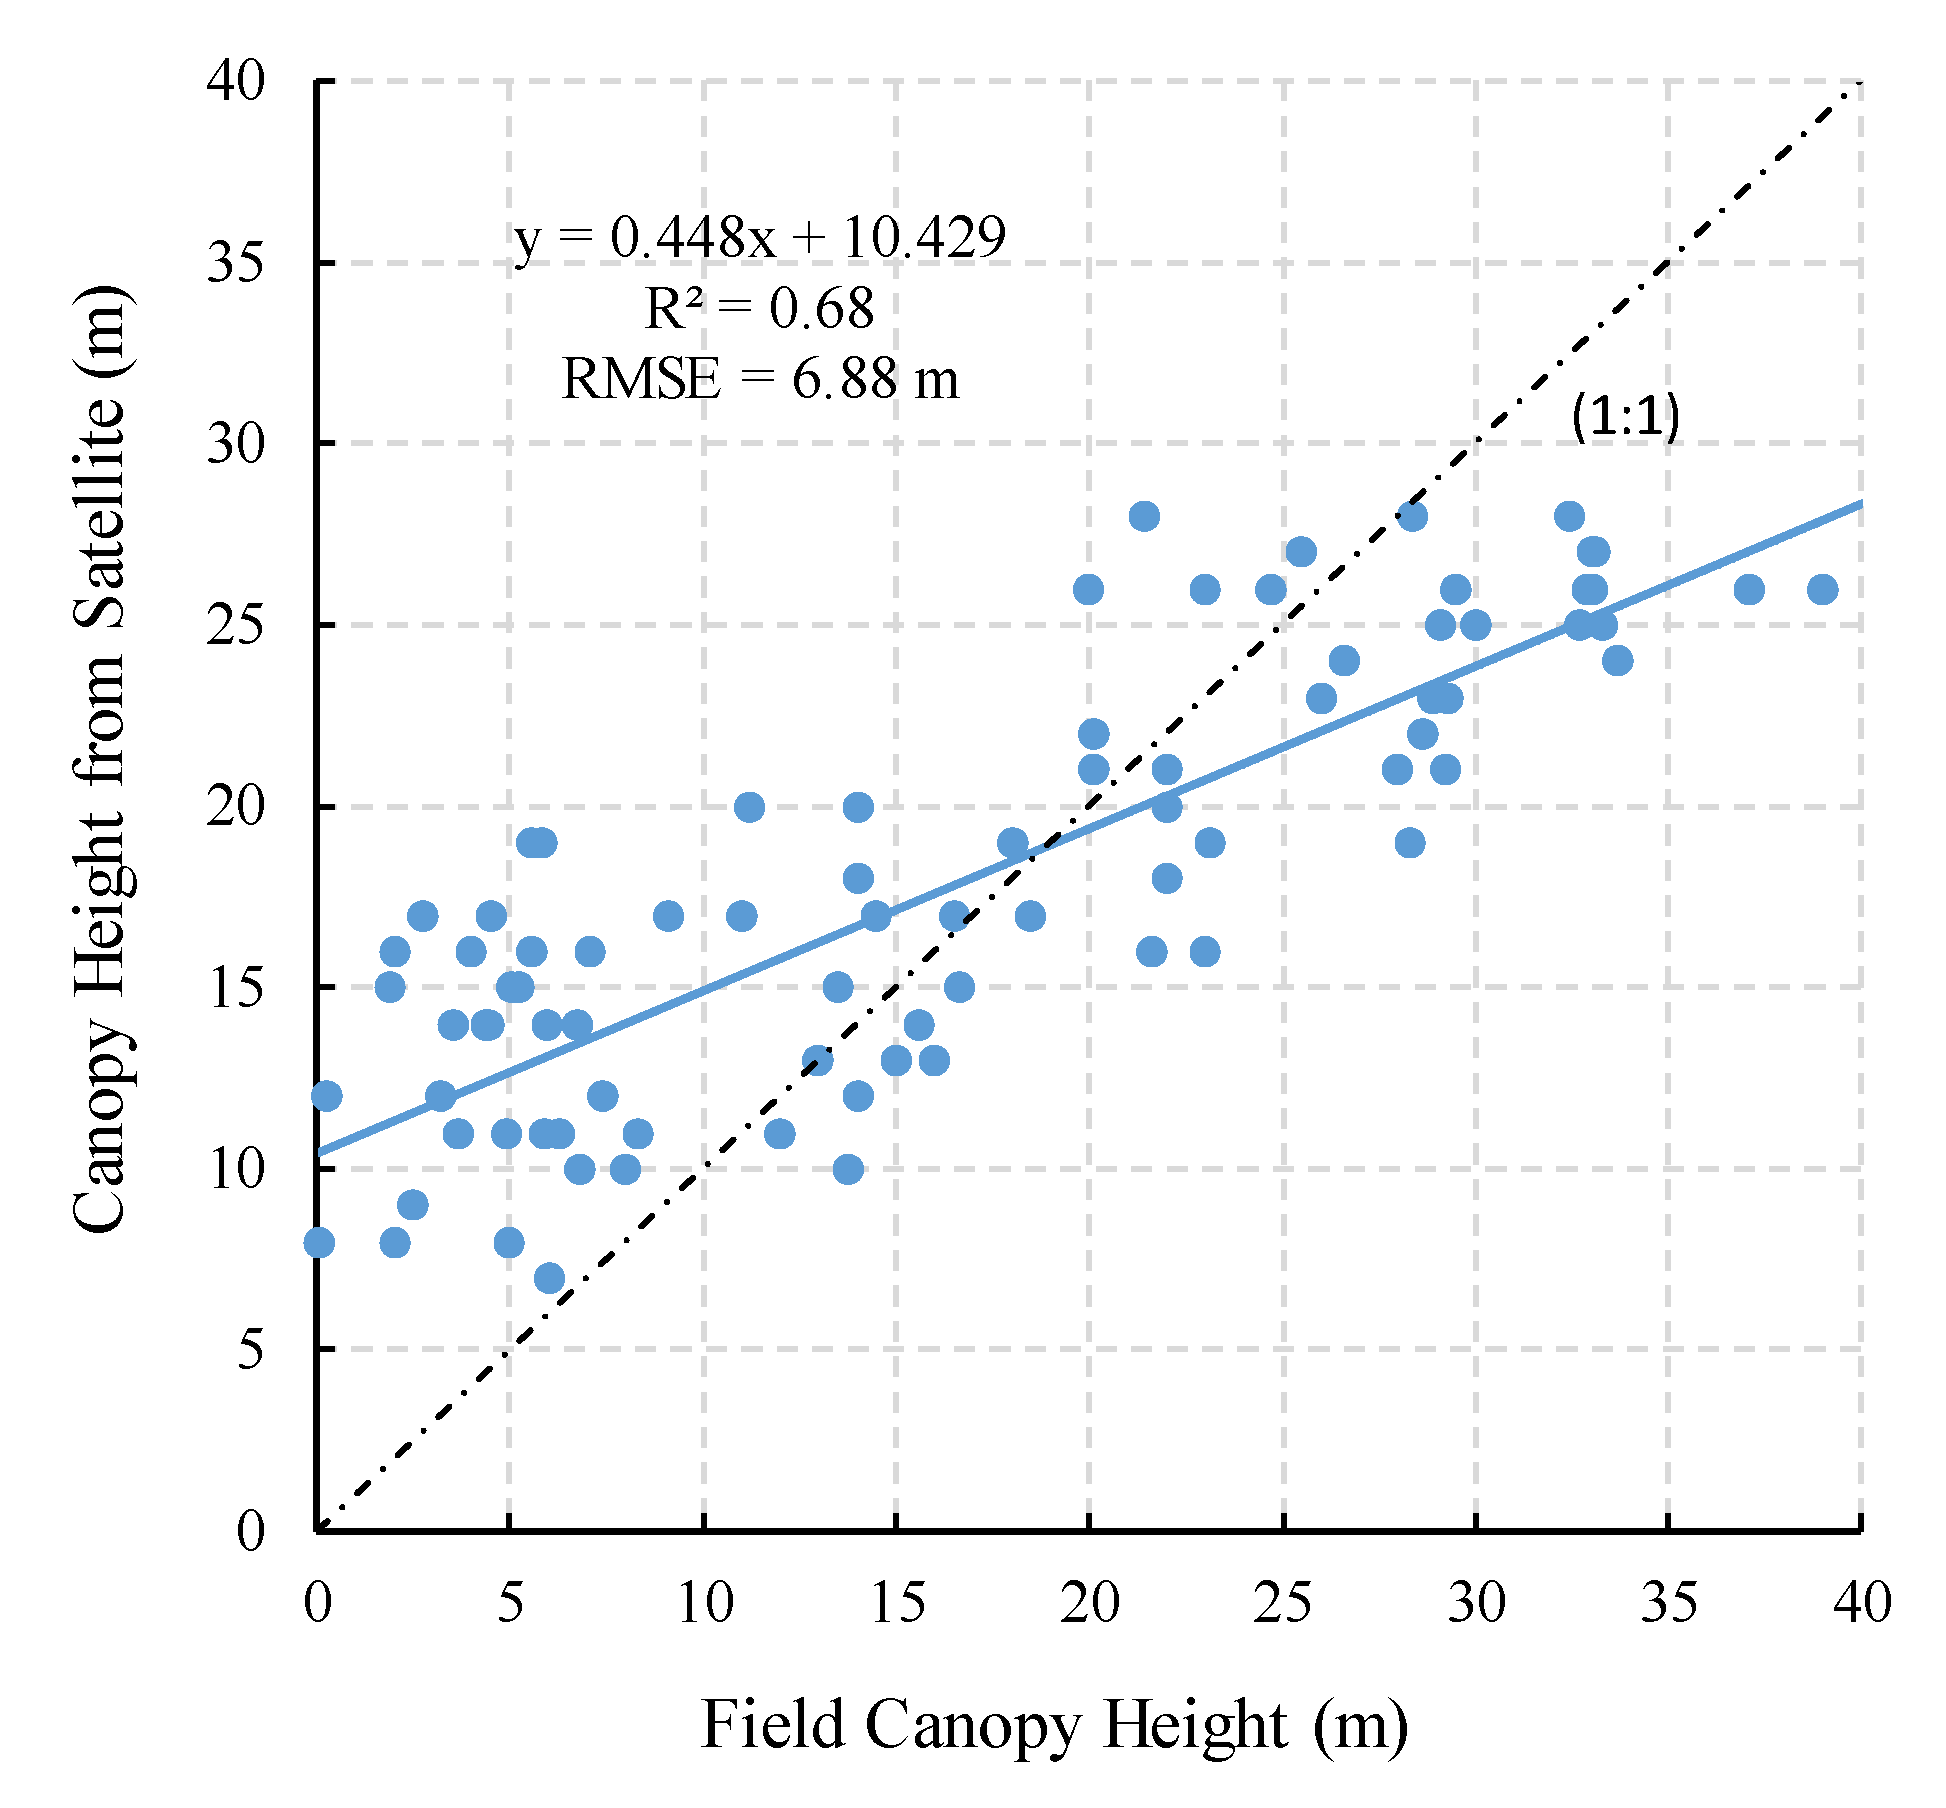
3.1. Comparison between Field Measurements and Simard-Map of Canopy Height

Figure 2 shows the scatterplot between the field measurements of canopy height derived from literature surveys and the corresponding pixel values extracted from the Simard-map. It can be seen that the two data sets yielded a significant correlation with R2 of 0.68 (p < 0.001). Although the RMSE (6.88 m) was comparable with the RMSE (~6.1 m) of the validations presented in Simard et al. [14], remarkable discrepancies were observed with the slope and intercept around 0.45 and 10.43, respectively. Specifically, the canopy height was noticeably overestimated when it was approximately lower than 10 m, and underestimated when it was approximately higher than 25 m (Figure 2). In addition to this study, the underestimation of the Simard-map was also observed in central African tropical forests when the canopy height was higher than 30 m (see Figure 12 in reference [23]).

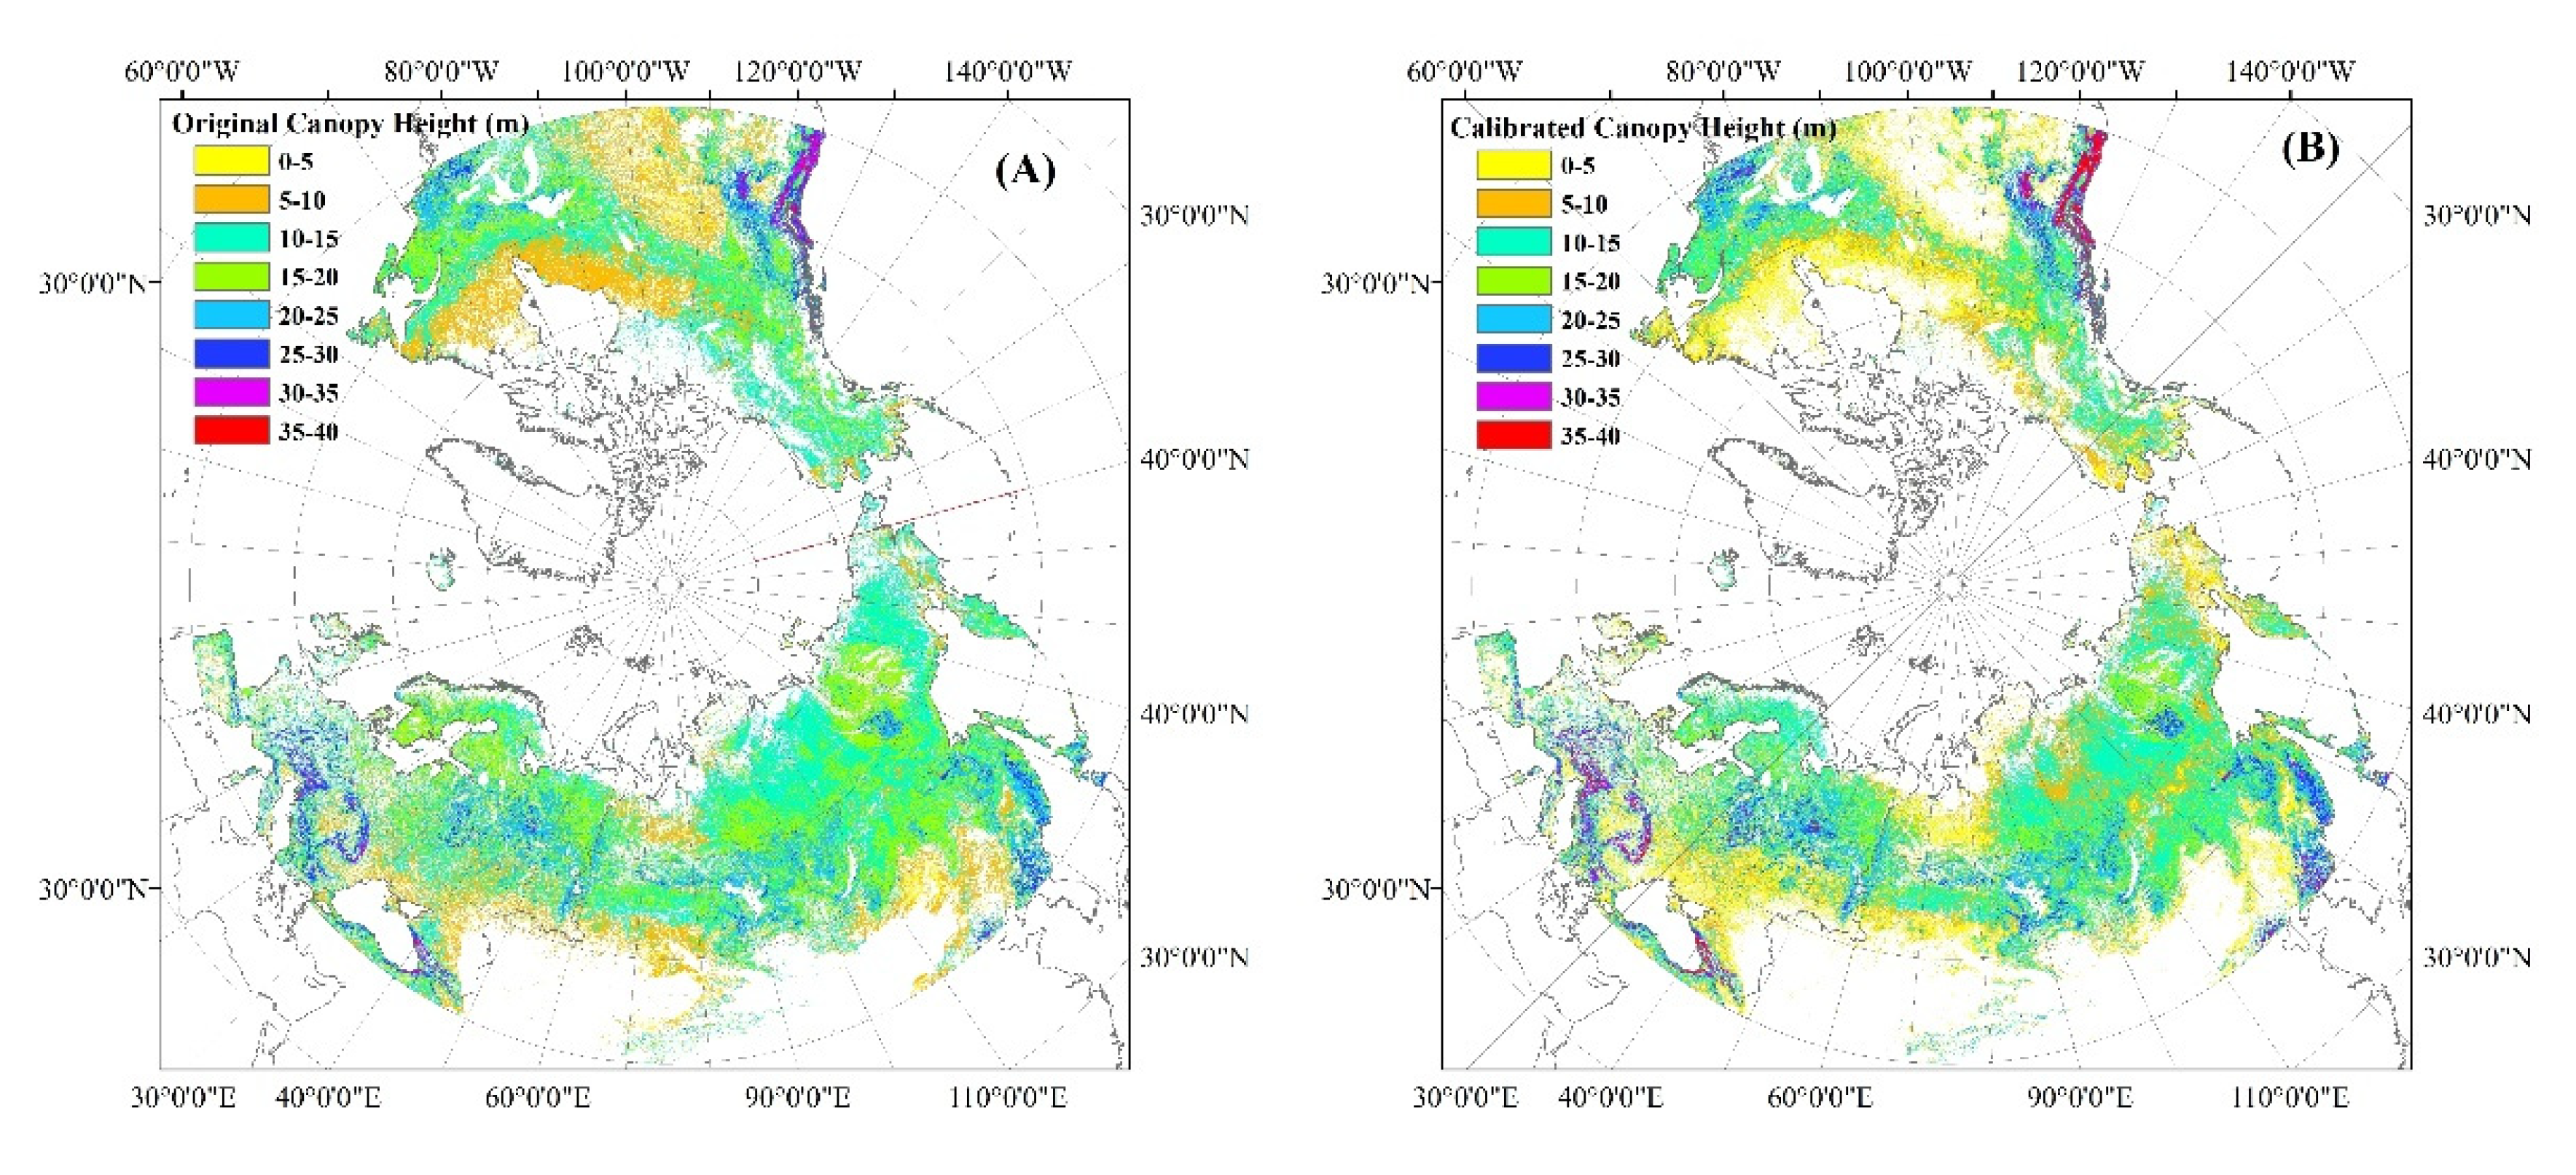
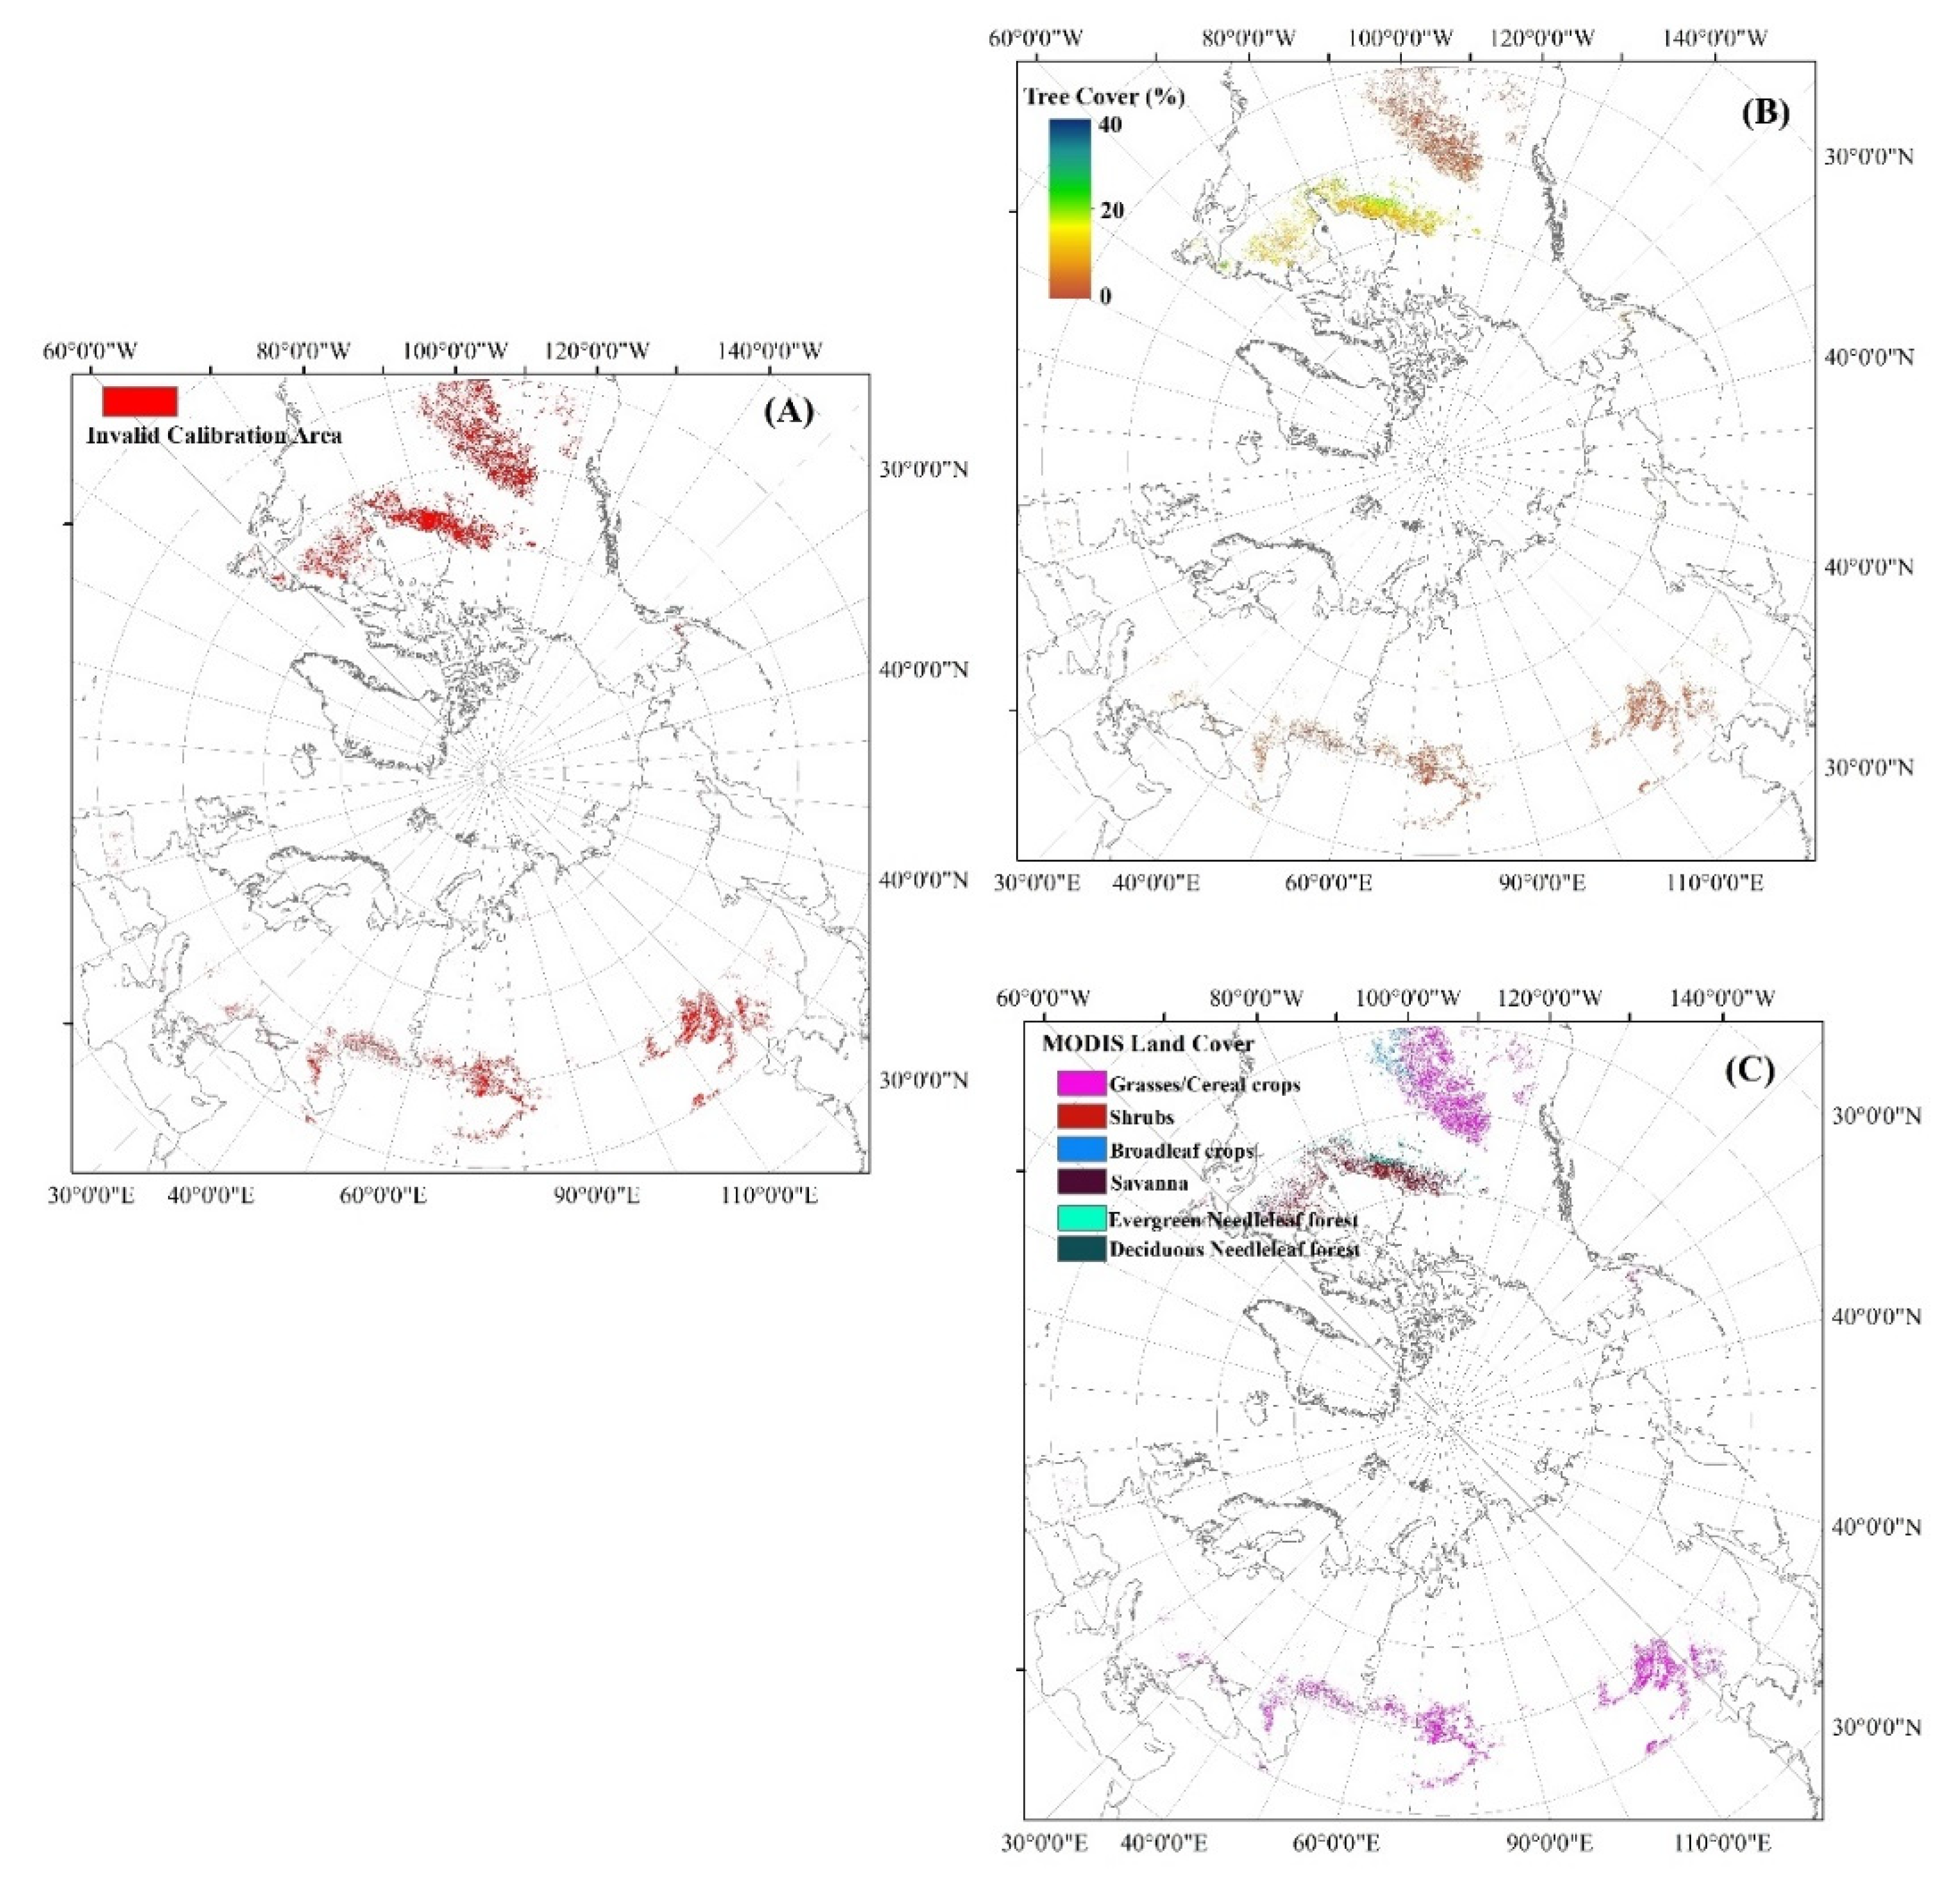
3.2. Calibration of the Simard-Map in Boreal Forests

We carried out a simple calibration to the Simard-map in boreal forests using the relationship between the field and satellite canopy height:
H c a l = 1.519 × H o r i 10.645
where Hori and Hcal indicate the original and calibrated canopy height of the Simard-map, respectively. It should be noted that this calibration equation is different from the relationship as shown in Figure 2, because the independent variable was set as the satellite canopy height instead of the field measurement.
Figure 3 shows a comparison between the spatial distributions of the original and calibrated Simard-map of canopy height in boreal forests. It can be seen that some lower (higher) areas in the original Simard-map were decreased (increased) in the newly calibrated data. Moreover, the areas with the original canopy heights lower than 7 m were discarded because of the invalid calibrated values (i.e., with calibrated canopy height less than 0). We further checked the tree-cover values (i.e., MOD44B) and land-cover type (i.e., MCD12Q1) for the invalid calibration areas (Figure 4). It was found that these areas were generally with tree cover lower than 15%, and belonged to the land-cover types classified as crops, shrubs and savanna. That is, the discarded areas through the calibration process were highly prone to be non-forest areas. This indirectly verified the effectiveness of the simple calibration for the Simard-map based on field data derived from literature surveys. Nevertheless, this calibration is not applicable to the areas beyond boreal forests because it depends on the empirical relationship derived from the regression analysis based on field data sets.

4. Discussion

4.1. Consistency with the Performance of MOD44B Product in Boreal Forests

The MODIS tree-cover product (i.e., MOD44B) is a crucial input data set for generating the Simard-map. Therefore, we compared the consistency between our results and a validation study of the 2005 MOD44B product in boreal forests [30]. It was found that they presented an identical trend to that shown in Figure 2. That is, the tree cover was overestimated when it was approximately lower than 20%, and overestimated when it was approximately higher than 70% in the boreal forests (see Figure 8 in reference [30]). This indicates that the uncertainty of MOD44B in boreal forests is a likely reason for the discrepancies between the Simard-map and field measurements of canopy height presented in this study. However, improving the MOD44B is a daunting task because a large amount of training data of ground tree cover is required [30]. Therefore, we conducted a simple calibration of the Simard-map in boreal forests instead, as shown in Section 3.2.

4.2. Influences of Spatial Heterogeneity of the Validation Sites

Spatial heterogeneity of field sites is usually inevitable for validation of satellite products [31]. Removal of sites with high heterogeneity is often helpful for improving the validation results. For example, the accuracy of the Simard-map was increased (RMSE decreased from 6.1 m to 4.4 m) by excluding seven FLUXNET sites with land-cover heterogeneity, as presented in reference [14]. Unfortunately, we were unable to collect the field information on spatial heterogeneity of the validation sites utilized in this study.
Instead, we used the satellite data itself (i.e., the Simard-map) to analyze the possible influences of site heterogeneity on the evaluation of canopy height. At first, we calculated the standard deviation (SD) of the pixels of the Simard-map within a 3 × 3 window centered by each field site derived from the literature surveys. Then, we separated the validation sites into two groups: one was with the SD smaller than 2.0 m, the other was with the SD larger than 2.0 m. Finally, we compared the in situ canopy height with the Simard-map for these two groups, as shown in Figure 5. These two groups did not show significantly different performances in the evaluation of the Simard-map, both with R2, slope, and intercepts around 0.69, 0.45, and 10.0, respectively. It indicated that the evaluation results of this study had not been biased by the spatial heterogeneity of the field sites. This might be attributed to the issue that the validation sites were relatively homogeneous. It might also be partially owing to the issue that the Simard-map estimated the maximum canopy height within a pixel, and we extracted the maximum value of the in situ canopy height if several measurements were available.

5. Conclusions

In this study, we evaluated a global wall-to-wall canopy height product (the Simard-map, which has been widely applied to various applications) in boreal forests with latitudes higher than 40° N. We collected the field measurements of canopy height in the boreal forests by reviewing 448 literature resources, and compared the derived field data with the Simard-map at 88 selected observation sites. Evaluation results demonstrated that the Simard-map yielded a significant correlation with field canopy height with R2 = 0.68 and p < 0.001. However, remarkable biases were also observed with the RMSE, regression slope, and intercepts of 6.88 m, 0.448, and 10.429, respectively; that is, the Simard-map yielded overestimations and underestimations in the lower and taller boreal forests, respectively.
Interestingly, we found that the evaluation of the Simard-map in boreal forests showed an identical trend with a validation of MODIS tree-cover product (MOD44B) in the same areas, which was used as a crucial input data set for generating the Simard-map. That is, both the Simard-map and MOD44B yielded overestimation (underestimation) in the lower (upper) tails of the scatterplots between the field and satellite data sets. This indicates that the input of MOD44B data would be a crucial error source for the biases of the Simard-map in boreal forests.
Finally, we carried out a simple calibration on the Simard-map for boreal forests using the relationship between field and satellite measurement of canopy height. Correspondingly, the lower (higher) canopy heights were decreased (increased) through the calibration. Moreover, some non-forest areas were removed from the Simard-map in boreal forests. This calibration has the potential to provide a more reliable wall-to-wall canopy height product for boreal forests for future application studies. All the data sets generated in this study are available by request.

Supplementary Materials

The following are available online at https://www.mdpi.com/2072-4292/12/7/1114/s1: Table S1. Data sets derived from the literature survey; List of reviewed literature resources.

Author Contributions

W.Y. conceived the idea, designed the research, collected data, conducted the experiments, and drafted the initial manuscript. A.K. contributed to the discussions of the results and the revision of the manuscript. All authors have read and agreed to the published version of the manuscript.

Funding

This research is funded by JAXA Second Research Announcement on the Earth Observations (GCOM-C no. 106), as well as a JSPS Grant-Aid for Scientific Research (C) no. 17K00540.

Acknowledgments

The authors are thankful to Hideki Kobayashi and Akira Hama for their help in literature surveys. The authors would also like to thank the authors of [14,28] for making their canopy height product and supporting information of the literature list freely available. The authors would also like to express their thanks to the anonymous reviewers and the editor for their comments on improving this manuscript.

Conflicts of Interest

The authors declare no conflict of interest.

References

  1. MacArthur, R.H.; MacArthur, J.W. On Bird Species Diversity. Ecology 1961, 42, 594–598. [Google Scholar] [CrossRef]
  2. Fang, J.; Brown, S.; Tang, Y.; Nabuurs, G.-J.; Wang, X.; Shen, H. Overestimated Biomass Carbon Pools of the Northern mid- and High Latitude Forests. Clim. Chang. 2006, 74, 355–368. [Google Scholar] [CrossRef]
  3. Moles, A.T.; Warton, D.I.; Warman, L.; Swenson, N.G.; Laffan, S.W.; Zanne, A.E.; Pitman, A.; Hemmings, F.A.; Leishman, M.R.; Pitman, A.J. Global patterns in plant height. J. Ecol. 2009, 97, 923–932. [Google Scholar] [CrossRef]
  4. Bontemps, S.; Defourny, P.; Van Bogaert, E.; Arino, O.; Kalogirou, V.; Perez, J.R. GLOBCOVER 2009 Products Description and Validation Report; Université Catholique de Louvain (UCL) & European Space Agency: Paris, France, 2011. [Google Scholar]
  5. Hansen, M.C.; DeFries, R.S.; Townshend, J.R.G.; Sohlberg, R. Global land cover classification at 1 km spatial resolution using a classification tree approach. Int. J. Remote Sens. 2000, 21, 1331–1364. [Google Scholar] [CrossRef]
  6. Wang, Y.; Lehtomäki, M.; Liang, X.; Pyörälä, J.; Kukko, A.; Jaakkola, A.; Liu, J.; Feng, Z.; Chen, R.; Hyyppä, J. Is field-measured tree height as reliable as believed—A comparison study of tree height estimates from field measurement, airborne laser scanning and terrestrial laser scanning in a boreal forest. ISPRS J. Photogramm. Remote Sens. 2019, 147, 132–145. [Google Scholar] [CrossRef]
  7. Harding, D.J.; Carabajal, C.C. ICESat waveform measurements of within-footprint topographic relief and vegetation vertical structure. Geophys. Res. Lett. 2005, 32, 21. [Google Scholar] [CrossRef] [Green Version]
  8. Lee, S.; Ni-Meister, W.; Yang, W.; Chen, Q. Physically based vertical vegetation structure retrieval from ICESat data: Validation using LVIS in White Mountain National Forest, New Hampshire, USA. Remote Sens. Environ. 2011, 115, 2776–2785. [Google Scholar] [CrossRef]
  9. Rosette, J.; North, P.; Suárez, J.C. Vegetation height estimates for a mixed temperate forest using satellite laser altimetry. Int. J. Remote Sens. 2008, 29, 1475–1493. [Google Scholar] [CrossRef]
  10. Fatoyinbo, T.L.; Simard, M. Height and biomass of mangroves in Africa from ICESat/GLAS and SRTM. Int. J. Remote Sens. 2012, 34, 668–681. [Google Scholar] [CrossRef]
  11. MABEL Lidar Data, MABEL ICESat-2 Simulation Data, Version 9; NASA: Greenbelt, MD, USA, 2014.
  12. Coyle, D.B.; Stysley, P.R.; Chirag, F.L.; Frese, E.A.; Poulios, D. The Global Ecosystem Dynamics Investigation (GEDI) LiDAR laser transmitter. Infrared Remote Sens. Instrum. XXVII 2019, 11128, 111280L. [Google Scholar]
  13. Murooka, J.; Mitsuhashi, R.; Sakaizawa, D.; Imai, T.; Asai, K.; Mizutani, K. Development status of MOLI (Multi-footprint Observation lidar and Imager). Sens. Syst. Next-Gener. Satell. XXIII 2019, 11151, 1115106. [Google Scholar]
  14. Simard, M.; Pinto, N.; Fisher, J.B.; Baccini, A. Mapping forest canopy height globally with spaceborne lidar. J. Geophys. Res. Space Phys. 2011, 116, 04021. Available online: http://lidarradar.jpl.nasa.gov/ (accessed on 1 February 2020). [CrossRef]
  15. Lefsky, M.A. A global forest canopy height map from the Moderate Resolution Imaging Spectroradiometer and the Geoscience Laser Altimeter System. Geophys. Res. Lett. 2010, 37, 15401. [Google Scholar] [CrossRef] [Green Version]
  16. Los, S.O.; Rosette, J.A.B.; Kljun, N.; North, P.R.J.; Suárez, J.C.; Hopkinson, C.; Hill, R.A.; Chasmer, L.; van Gorsel, E.; Mahoney, C.; et al. Vegetation height products between 60_ S and 60_ N from ICESat GLAS data. Geosci. Model Dev. Discuss. 2011, 4, 2327–2363. [Google Scholar] [CrossRef] [Green Version]
  17. Wang, Y.; Li, G.; Ding, J.; Guo, Z.; Tang, S.; Wang, C.; Huang, Q.; Liu, R.; Chen, J.M. A combined GLAS and MODIS estimation of the global distribution of mean forest canopy height. Remote Sens. Environ. 2016, 174, 24–43. [Google Scholar] [CrossRef]
  18. Huang, H.; Liu, C.; Wang, X.; Biging, G.S.; Chen, Y.; Yang, J.; Gong, P. Mapping vegetation heights in China using slope correction ICESat data, SRTM, MODIS-derived and climate data. ISPRS J. Photogramm. Remote Sens. 2017, 129, 189–199. [Google Scholar] [CrossRef]
  19. Zhang, C.; Ju, W.; Chen, J.M.; Li, D.; Wang, X.; Fan, W.; Li, M.; Zan, M. Mapping forest stand age in China using remotely sensed forest height and observation data. J. Geophys. Res. Biogeosci. 2014, 119, 1163–1179. [Google Scholar] [CrossRef]
  20. Zhang, Y.; Yao, Y.; Wang, X.; Liu, Y.; Piao, S. Mapping spatial distribution of forest age in China. Earth Space Sci. 2017, 4, 108–116. [Google Scholar] [CrossRef]
  21. Klein, T.; Randin, C.F.; Körner, C. Water availability predicts forest canopy height at the global scale. Ecol. Lett. 2015, 18, 1311–1320. [Google Scholar] [CrossRef]
  22. Simard, M.; Fatoyinbo, T.L.; Smetanka, C.; Rivera-Monroy, V.H.; Castañeda-Moya, E.; Thomas, N.; Van Der Stocken, T. Mangrove canopy height globally related to precipitation, temperature and cyclone frequency. Nat. Geosci. 2018, 12, 40–45. [Google Scholar] [CrossRef]
  23. Magruder, L.; Leigh, H.; Neuenschwander, A. Evaluation of terrain and canopy height products in central African tropical forests. Int. J. Remote Sens. 2016, 37, 5365–5387. [Google Scholar] [CrossRef]
  24. Gray, V. Climate Change 2007: The Physical Science Basis Summary for Policymakers. Energy Environ. 2007, 18, 433–440. [Google Scholar] [CrossRef] [Green Version]
  25. Hansen, M.C.; DeFries, R.S.; Townshend JR, G.; Carroll, M.; Dimiceli, C.; Sohlberg, R.A. Global percent tree cover at a spatial resolution of 500 meters: First results of the MODIS vegetation continuous fields algorithm. Earth Interact. 2003, 7, 1–15. [Google Scholar] [CrossRef] [Green Version]
  26. Friedl, M.; Sulla-Menashe, D. MCD12Q1 MODIS/Terra+Aqua Land Cover Type Yearly L3 Global 500m SIN Grid V006 [Data set]; NASA EOSDIS Land Processes DAAC: Sioux Falls, SD, USA, 2019. Available online: https://lpdaac.usgs.gov (accessed on 1 February 2020).
  27. Dimiceli, C.; Carroll, M.; Sohlberg, R.; Kim, D.H.; Kelly, M.; Townshend, J.R.G. MOD44B MODIS/Terra Vegetation Continuous Fields Yearly L3 Global 250m SIN Grid V006 [Data set]; NASA EOSDIS Land Processes DAAC: Sioux Falls, SD, USA, 2015. Available online: https://lpdaac.usgs.gov (accessed on 1 February 2020).
  28. Iio, A.; Hikosaka, K.; Anten, N.P.R.; Nakagawa, Y.; Ito, A. Global dependence of field-observed leaf area index in woody species on climate: A systematic review. Glob. Ecol. Biogeogr. 2013, 23, 274–285. [Google Scholar] [CrossRef]
  29. Thomas, S.C. Asymptotic height as a predictor of growth and allometric characteristics in Malaysian rain forest trees. Am. J. Bot. 1996, 83, 556–566. [Google Scholar] [CrossRef]
  30. Montesano, P.M.; Nelson, R.; Sun, G.; Margolis, H.; Kerber, A.; Ranson, K.J. MODIS tree cover validation for the circumpolar taiga–tundra transition zone. Remote Sens. Environ. 2009, 113, 2130–2141. [Google Scholar] [CrossRef] [Green Version]
  31. Fang, H.; Wei, S.; Liang, S. Validation of MODIS and CYCLOPES LAI products using global field measurement data. Remote Sens. Environ. 2012, 119, 43–54. [Google Scholar] [CrossRef]
Figure 1. Distribution of validation sites collected from literature surveys.
Remotesensing 12 01114 g001
Figure 2. Comparison between field measurement and satellite product of canopy height.
Remotesensing 12 01114 g002
Figure 3. Spatial distributions of the original (A) and calibrated (B) Simard-map of canopy height in boreal forests.
Remotesensing 12 01114 g003
Figure 4. Spatial distributions of the invalid calibration areas (A), moderate-resolution imaging spectroradiometer (MODIS) tree cover (B), and MODIS land-cover types (C).
Remotesensing 12 01114 g004
Figure 5. Scatter plots for the two groups of evaluations sites: one is with the standard deviation (SD) of satellite canopy height within the site-centered 3 × 3 window smaller than 2.0 m (i.e., SD < 2.0, dark red diamonds) and the other group with SD > 2.0 (blue circles).
Remotesensing 12 01114 g005

