1. Introduction
Global climate change has been projected to reduce global net primary production (NPP) and carbon stocks from soil [
1], and has become a global threat to humans. To date, tremendous efforts have been made to reduce the impact of global climate change, for which the control of greenhouse gases (GHGs) emissions has become a popular solution [
2]. Such an effort could be more effective if supported by increased reforestation, as tree species and all chlorophyll plants are important for mitigation purposes, since leaves capture CO
2 from the atmosphere, and combine it with water and energy from the sun to produce carbohydrates, a well-known process called photosynthesis that is critical for the carbon cycle [
3,
4].
To understand the role of photosynthesis in the carbon cycle, a comprehensive study of the dynamics of photosynthesis parameters is necessary. The proposed model by Farquhar et al. [
5] has become a basic tool for assessing the photosynthetic capacity of each species [
6]. Its two critical parameters, the maximum rate of rubisco carboxylation (V
cmax), and the maximum rate of photosynthesis electron transport (J
max), are essential to the model, and are, thus, important to understand the exchange of carbon between the atmosphere and the terrestrial ecosystem [
7].
Conventional approaches to obtain information on these two parameters usually involve long-term field work, even for one leaf sample [
8,
9], and can only be done on a small scale due to the time-consuming and highly labor-intensive work required. Alternatively, the approach of utilizing remote sensing information has increasingly attracted attention, and may potentially be used for estimating plant physiological, biochemical, and biophysical properties [
10,
11].
The utilization of remote sensing information generally involves two common approaches: empirical ways based on multispectral or hyperspectral information obtained from satellites, such as Hyperion, TianGong-1, EnMAP (Environmental Mapping and Analysis Program) and HyspIRI (Hyperspectral Infrared Imager) [
12], or a radiative-transfer-model-based inversion like using SCOPE (Soil Canopy Observation, Photochemistry and Energy fluxes) [
13], 4-Scale [
14], or ProSAIL (Prospect + Scattering by Arbitrarily Inclined Leaves) [
15]. However, most of the currently available radiative transfer models (RTMs) have not included photosynthesis parameters, especially V
cmax and J
max, as input variables, meaning that they are impossible to retrieve inversely. As an exception, the SCOPE model incorporated both radiative transfer and physiological processes, with V
cmax as one of the dozens (more than 30) inputting parameters [
13,
16]. Recent work by Camino et al. estimated V
cmax in wheat phenotyping trials using airborne hyperspectral-based solar-induced chlorophyll fluorescence (SIF) retrievals through SCOPE model inversions [
17]. Their work involved the determination of numerous parameters, including the meteorological, leaf biophysical and structural parameters, leaf inclination angle distribution function (LIDF) parameters, and the broadband incoming shortwave radiation. As SCOPE is a very complex model, which has integrated different modules, the parameterization complexities can induce large errors in its application [
16,
18]. In addition, rather than obtained directly from reflectance, V
cmax used for the model was estimated from a previously established relationship with SIF. Therefore, directly remote sensing retrieval of physiological parameters to date has relied more on empirical approaches.
Since Rouse et al. proposed the popularly applied normalized difference vegetation index (NDVI) [
19], the empirical approach has been widely followed and a number of indices have been developed for diverse purposes, including Gamon et al.’s photochemical reflectance index (PRI) [
20] for physiological parameters [
21,
22,
23,
24,
25]. To date, a large number of indices have been developed to fulfill the needs for monitoring and assessing plant structural and biochemical aspects [
26,
27,
28], and most of the well-known indices reported were developed in multispectral information but with certain adjustments, such that these indices could potentially be used for hyperspectral reflectance. However, even though the use of vegetation indices for a quick assessment of photosynthesis or photosynthetic parameters has been attempted in several previous works [
29,
30,
31,
32,
33], no consensus has yet been reached [
34], and is dramatically behind the indices for structural or biochemical parameters. Furthermore, the few reported indices are generally only applicable to a specific area and specific forest stands depending on the condition for the index developed, or for specific leaf groups [
35]. Our previous efforts to filter a universal index to trace photosynthetic parameters failed and no hyperspectral index has ever been applicable, especially for trees in alpine deciduous forests.
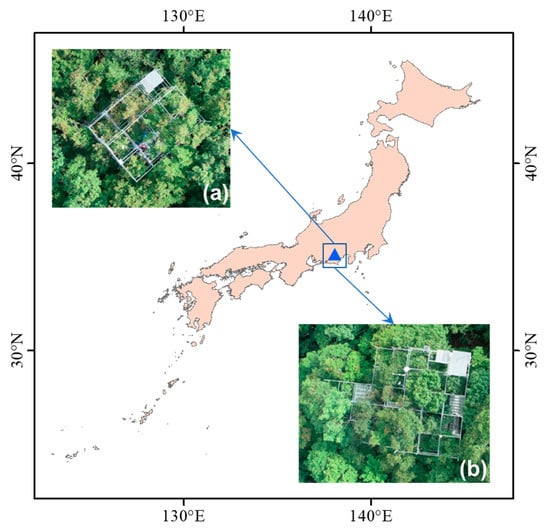
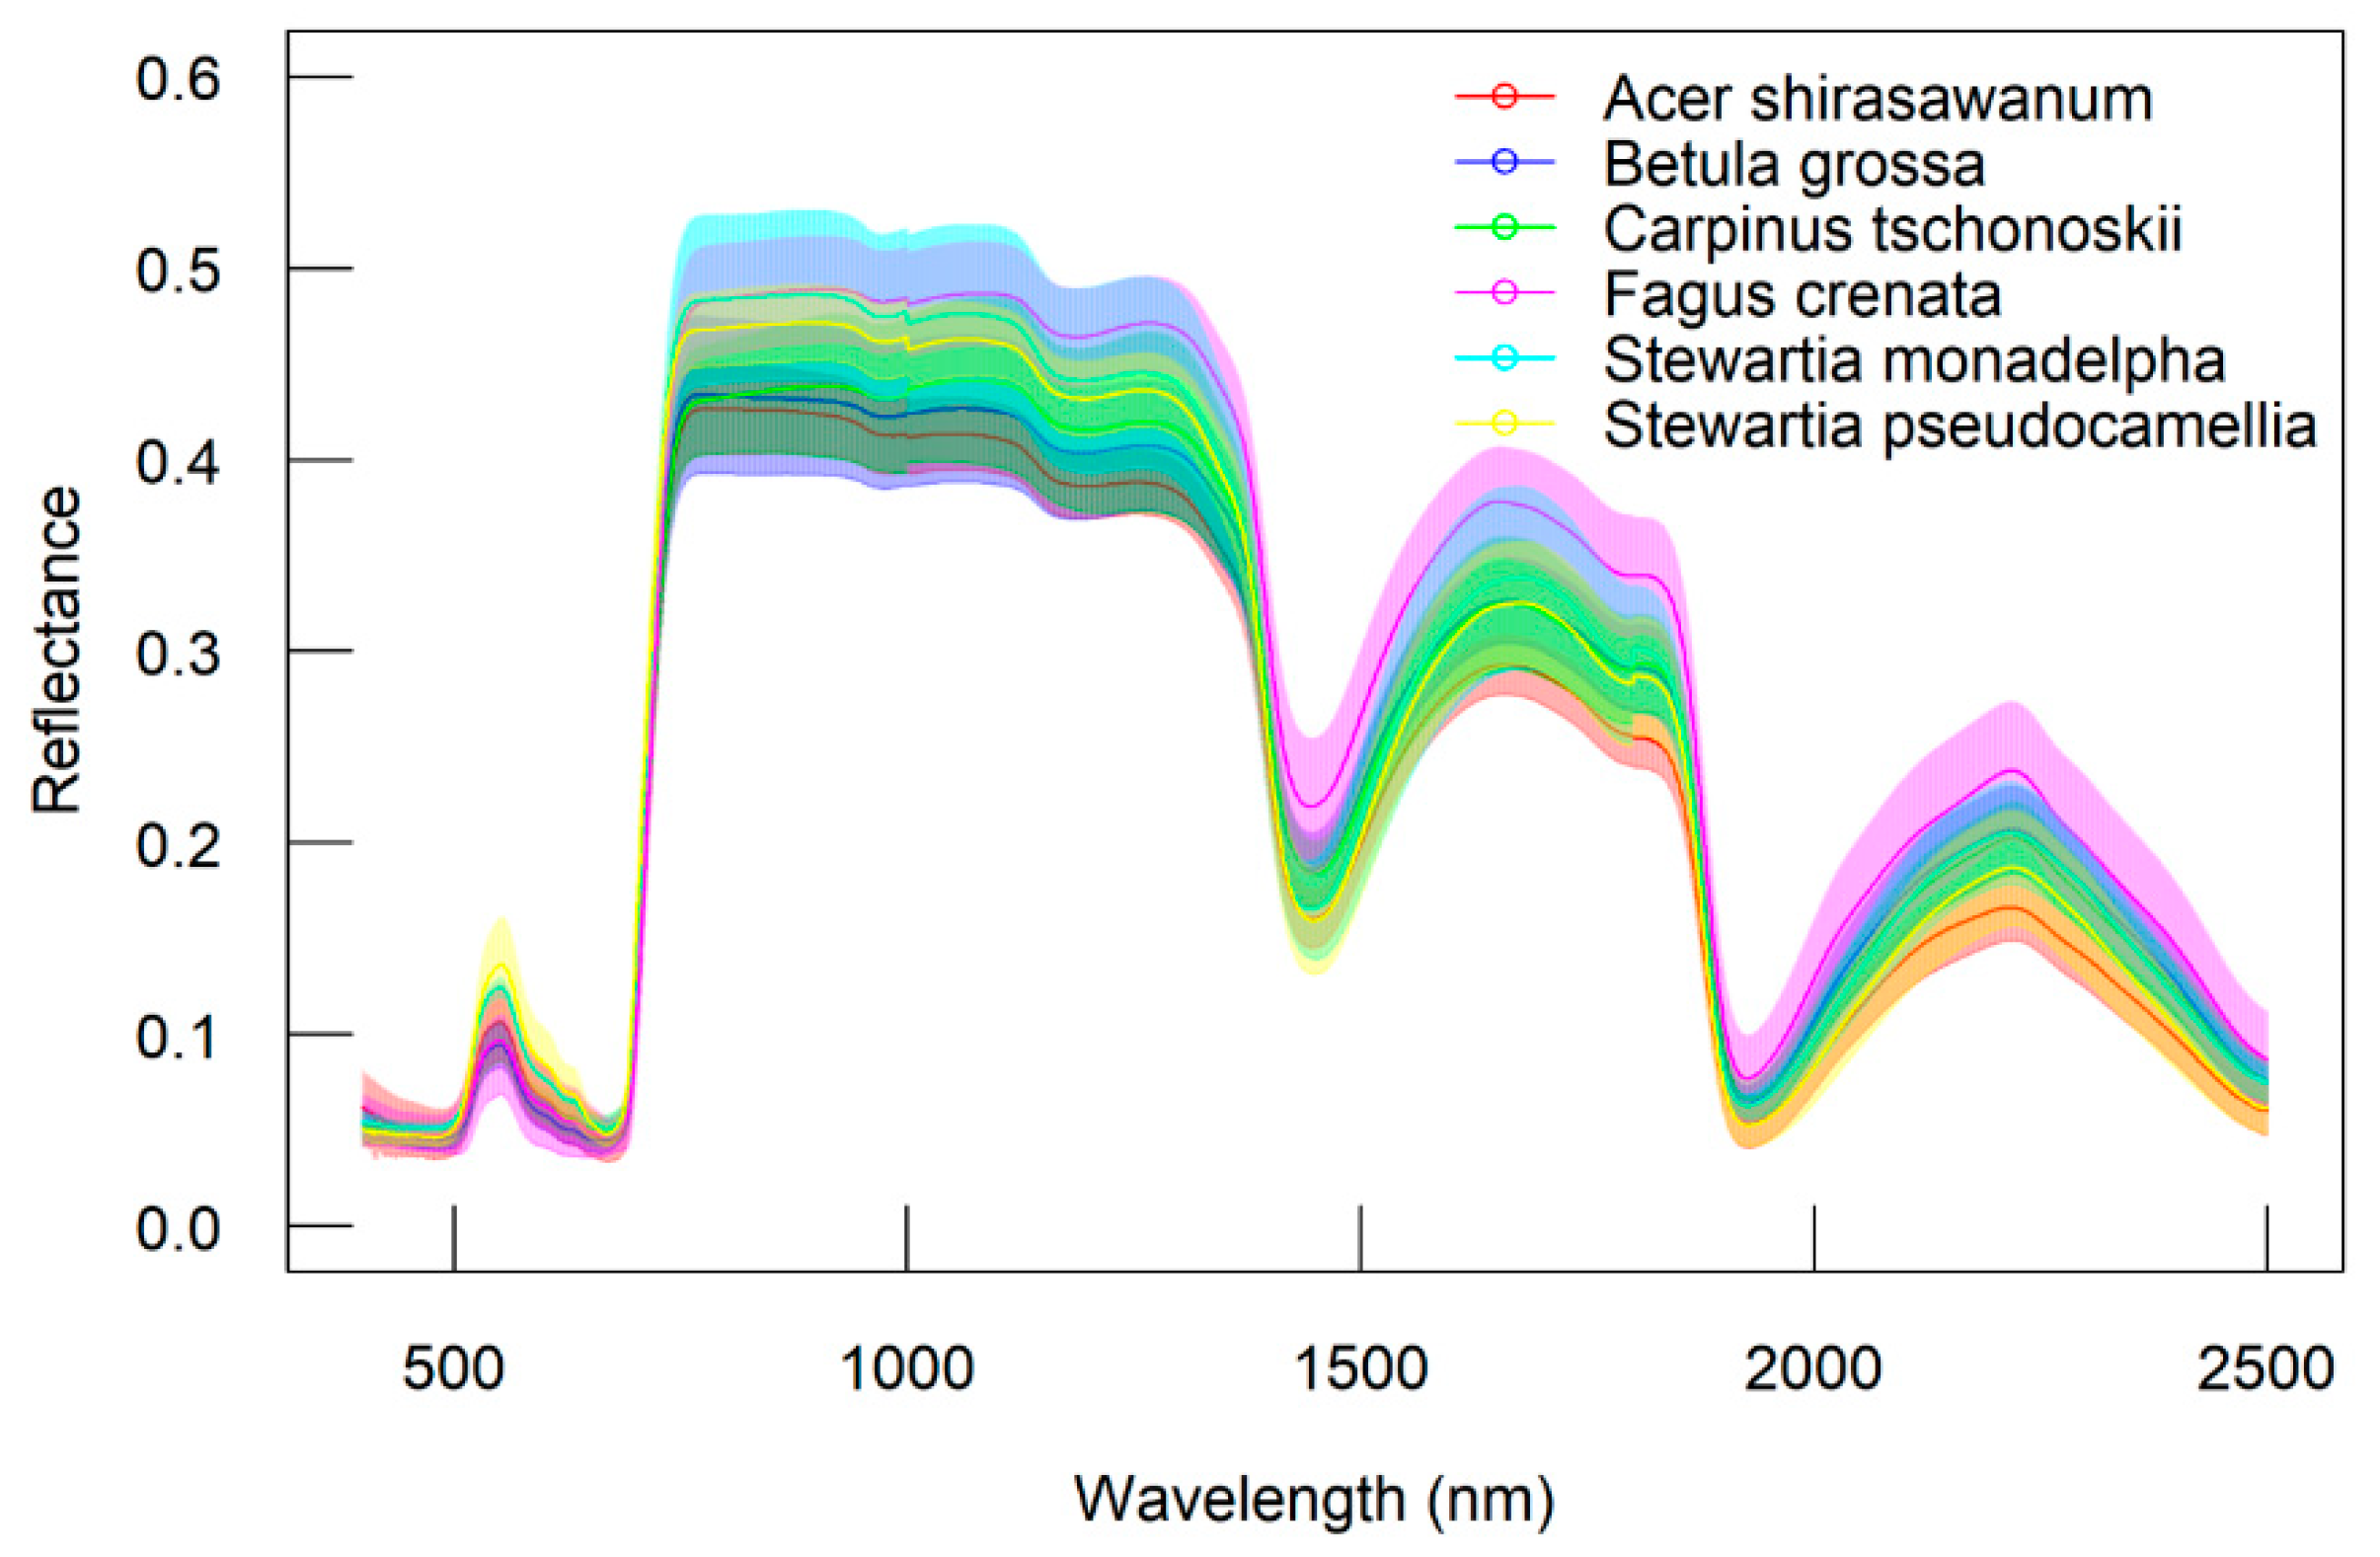
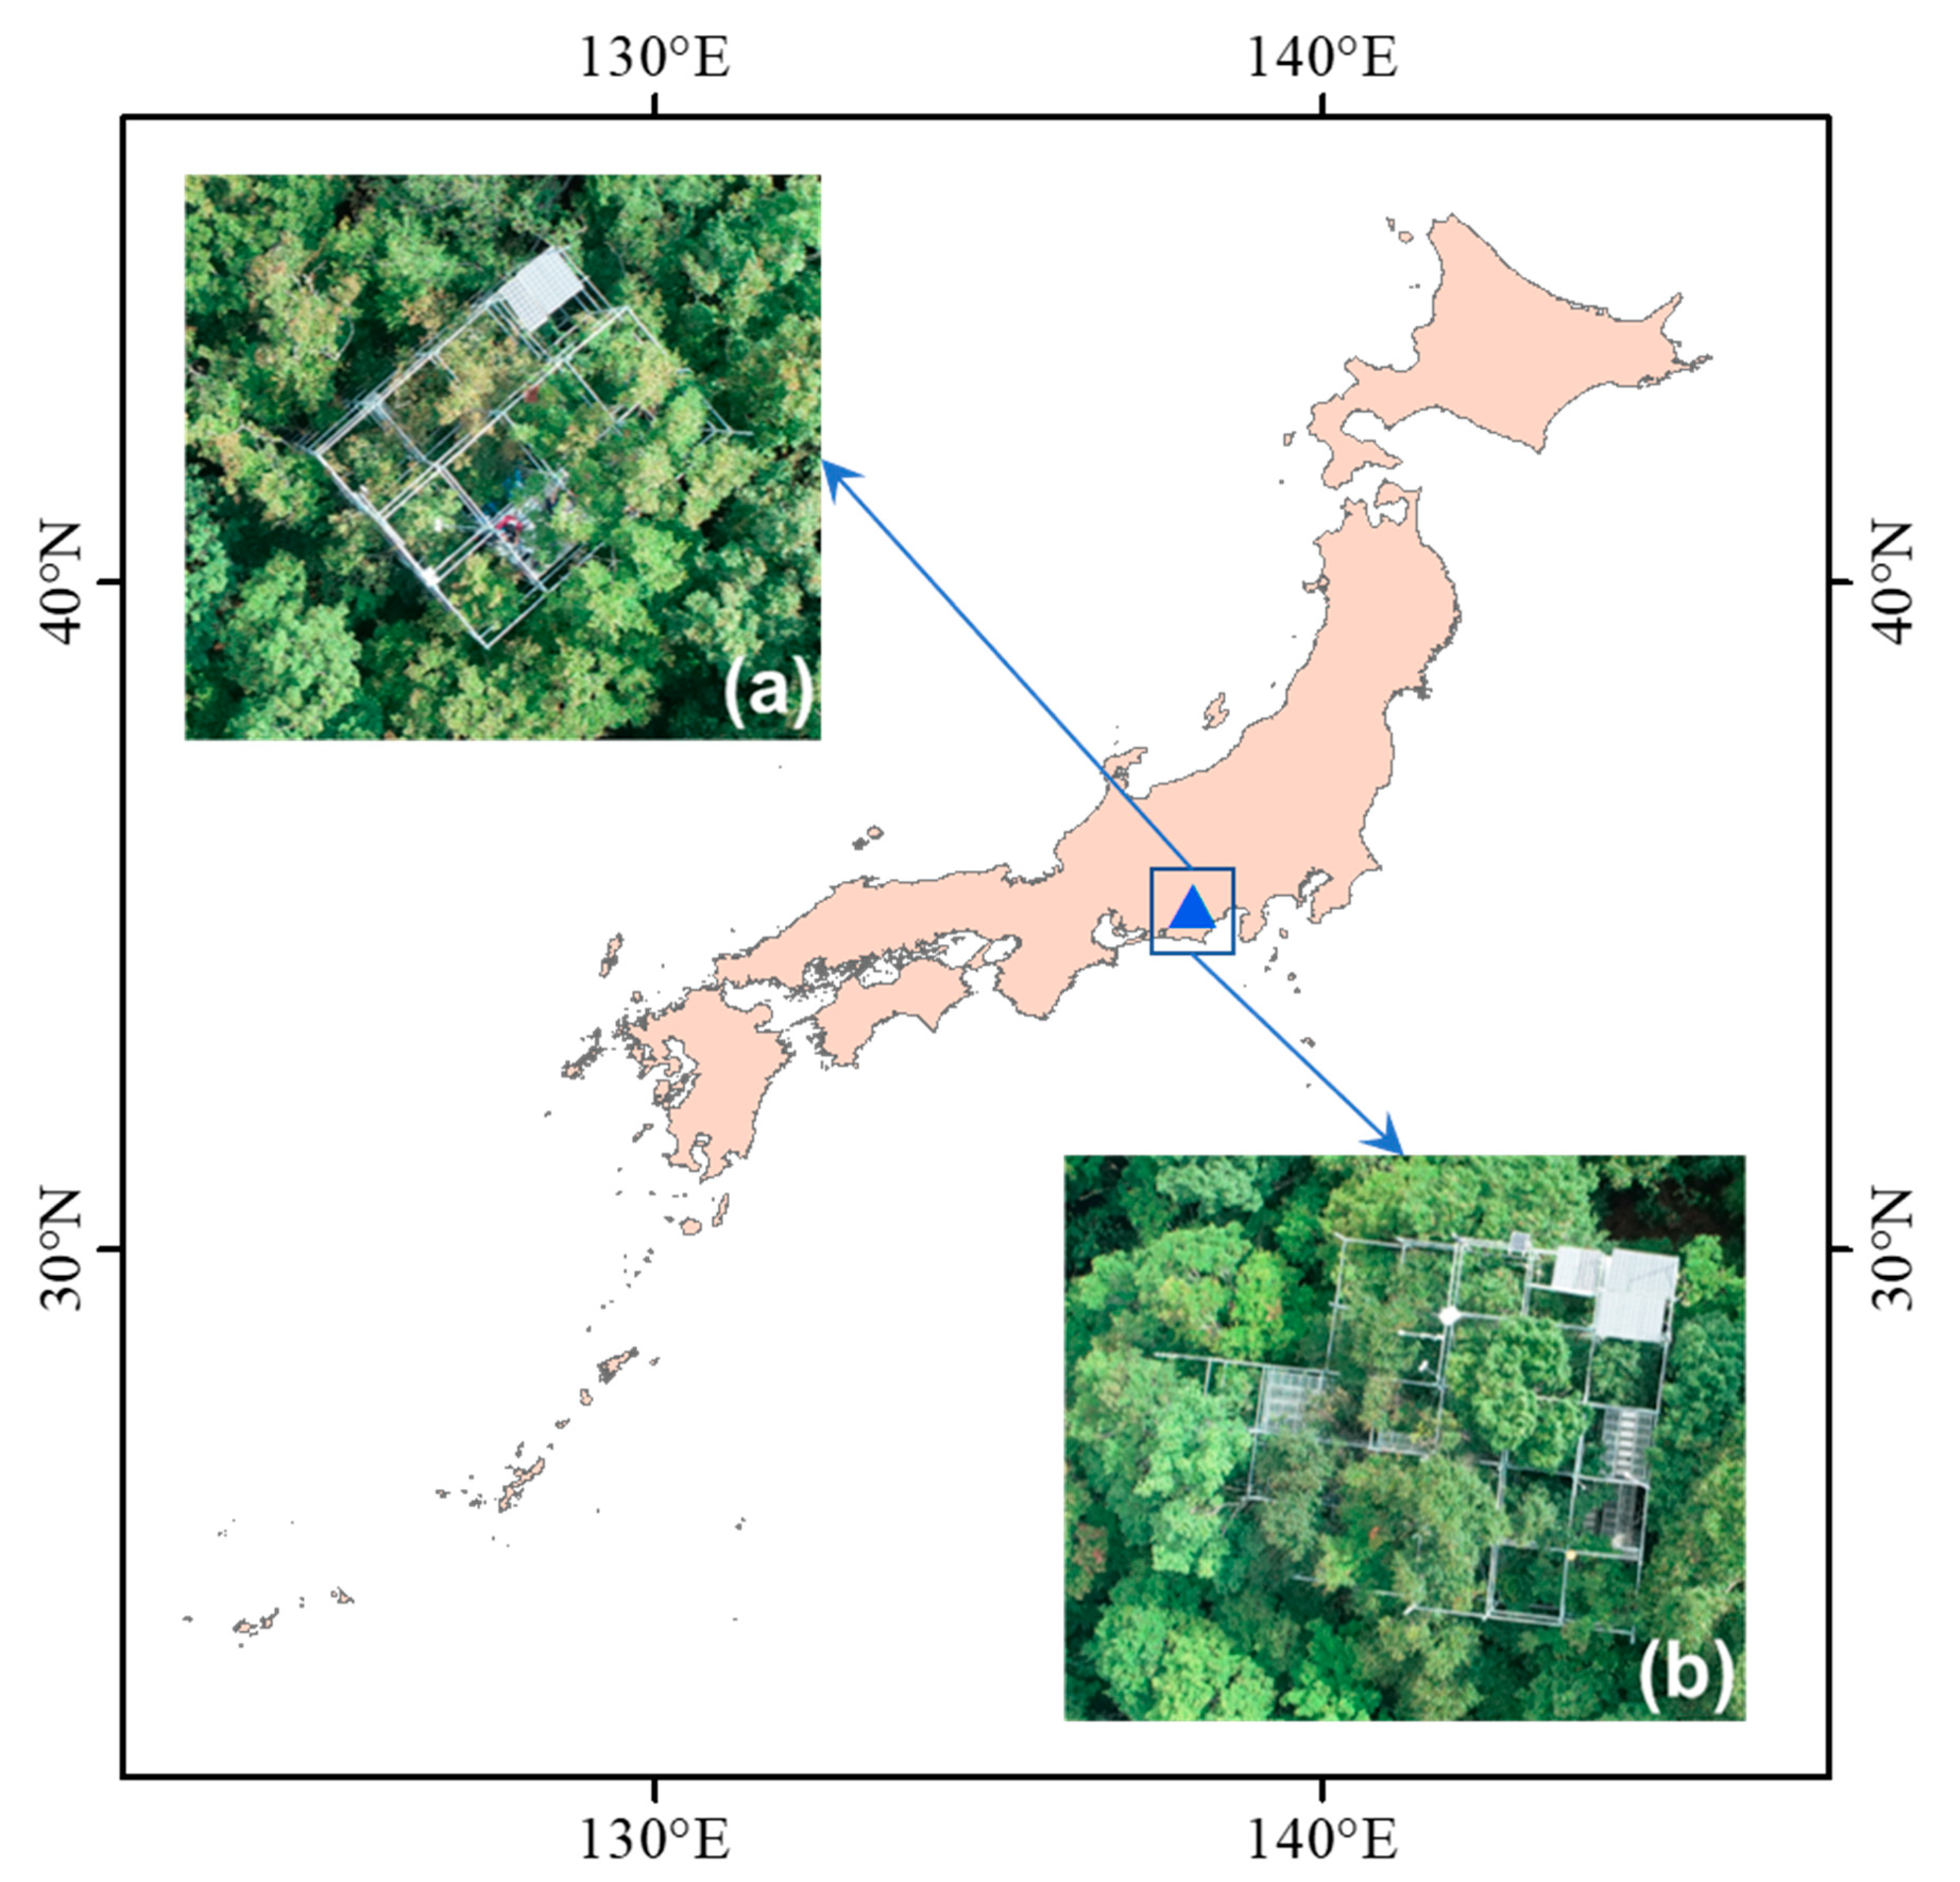
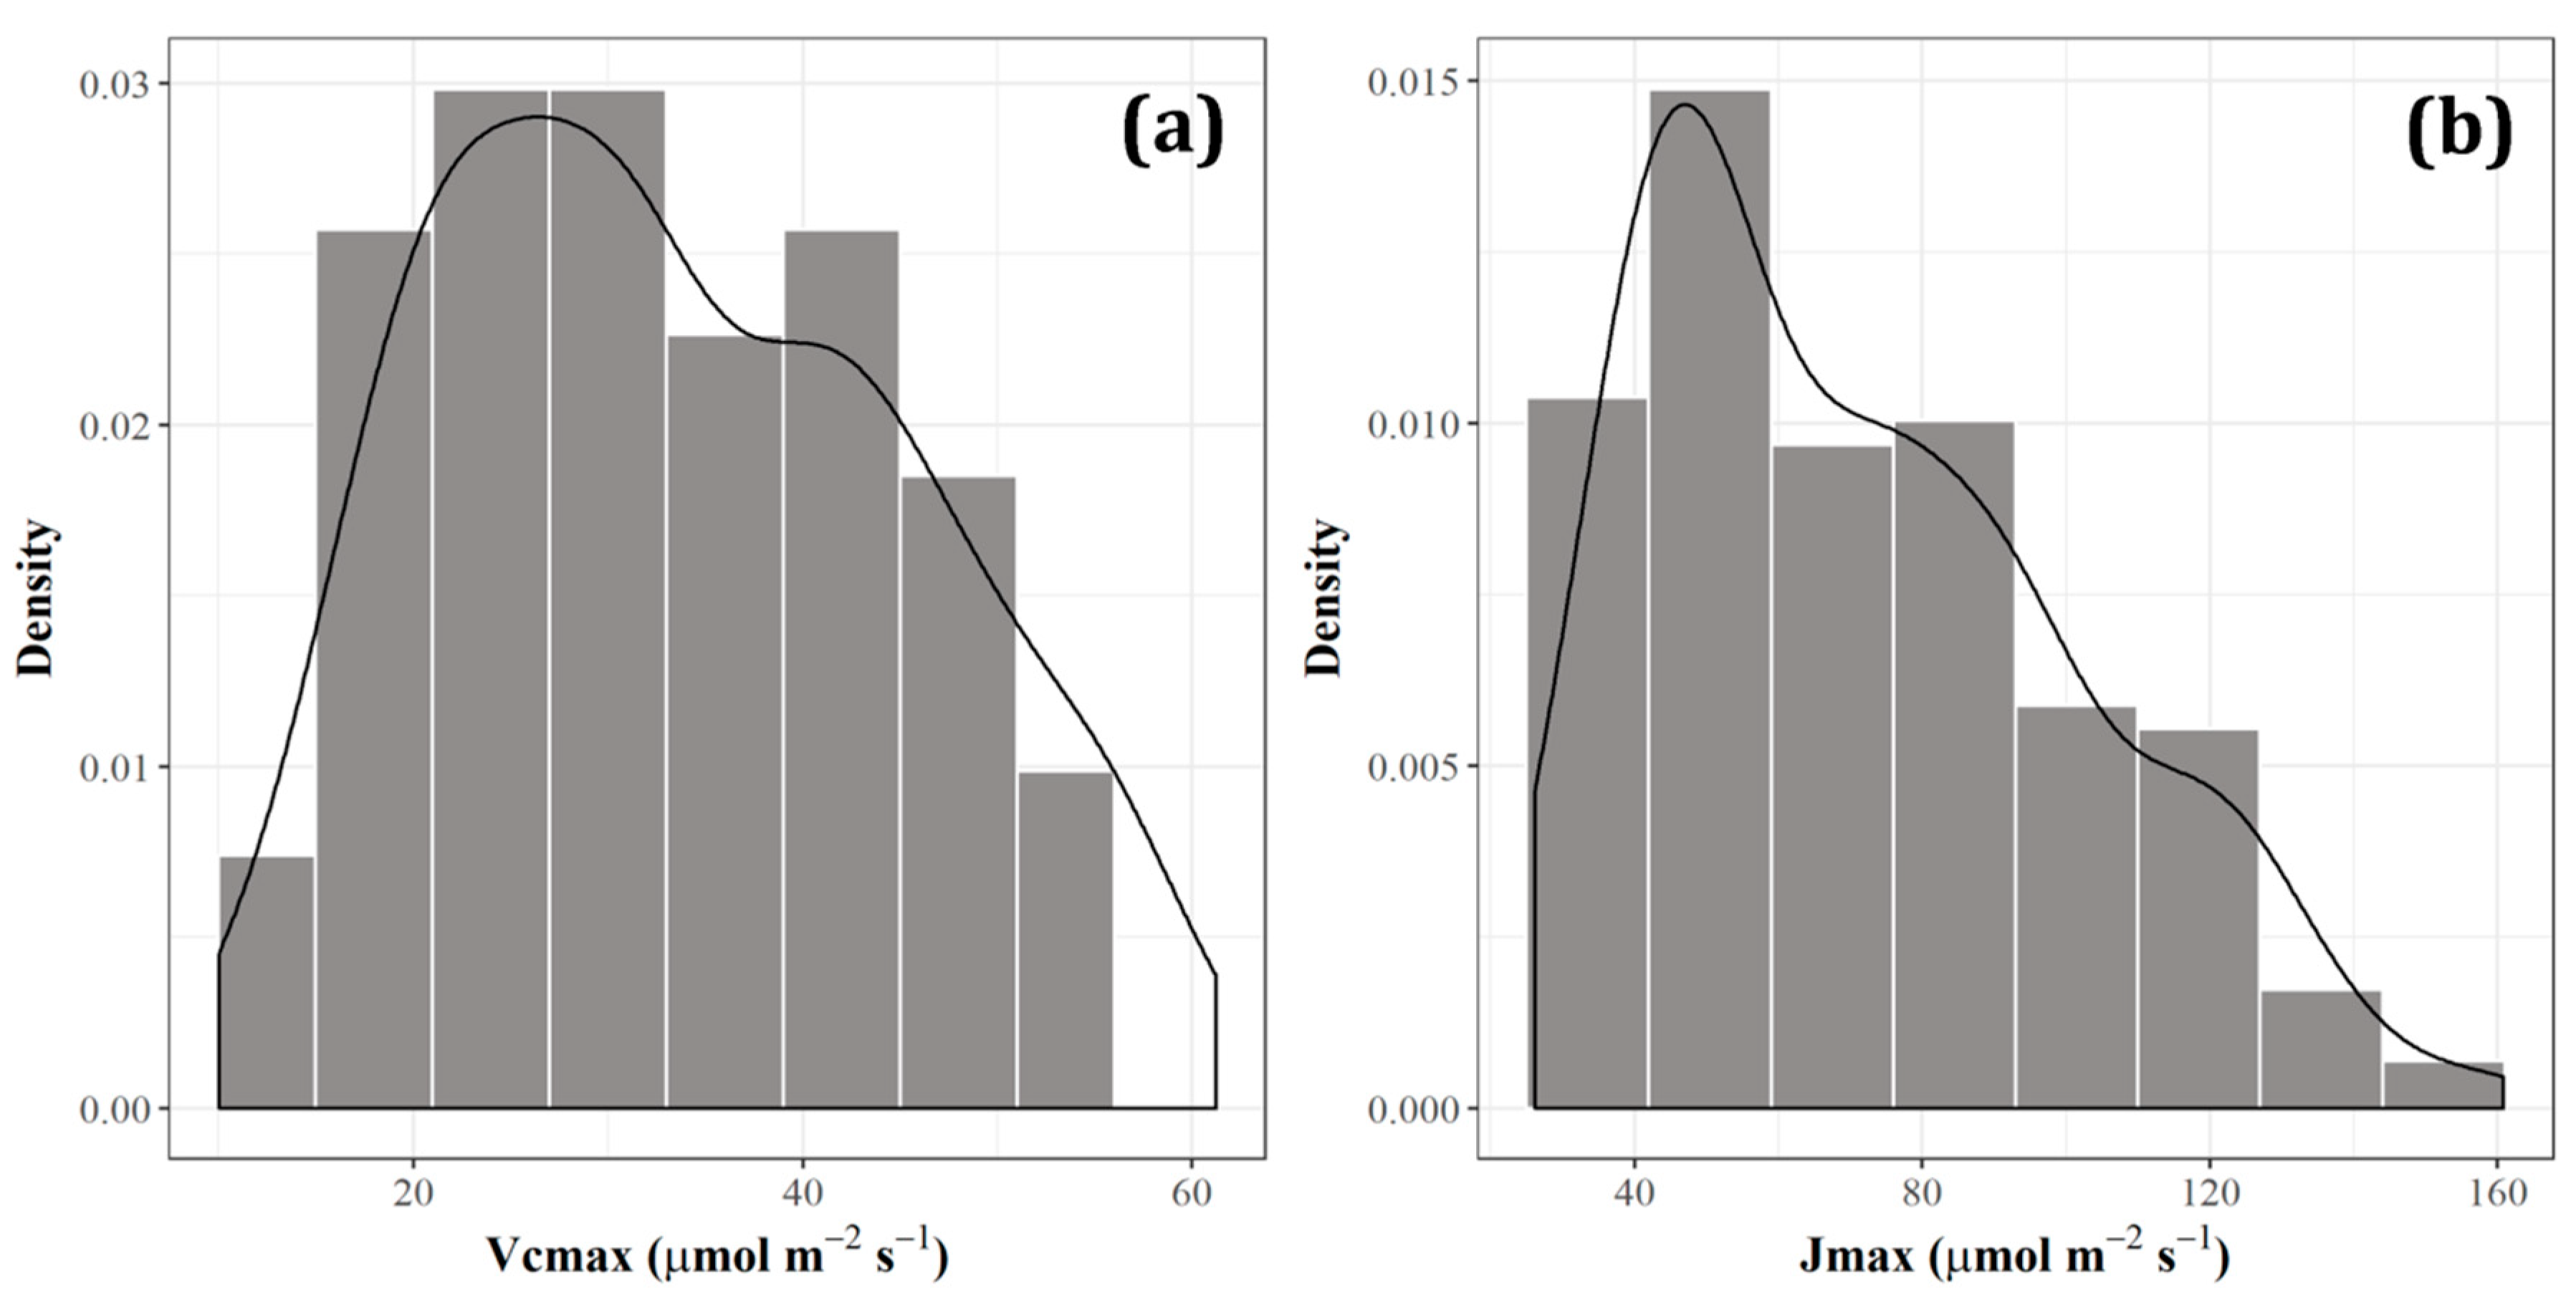
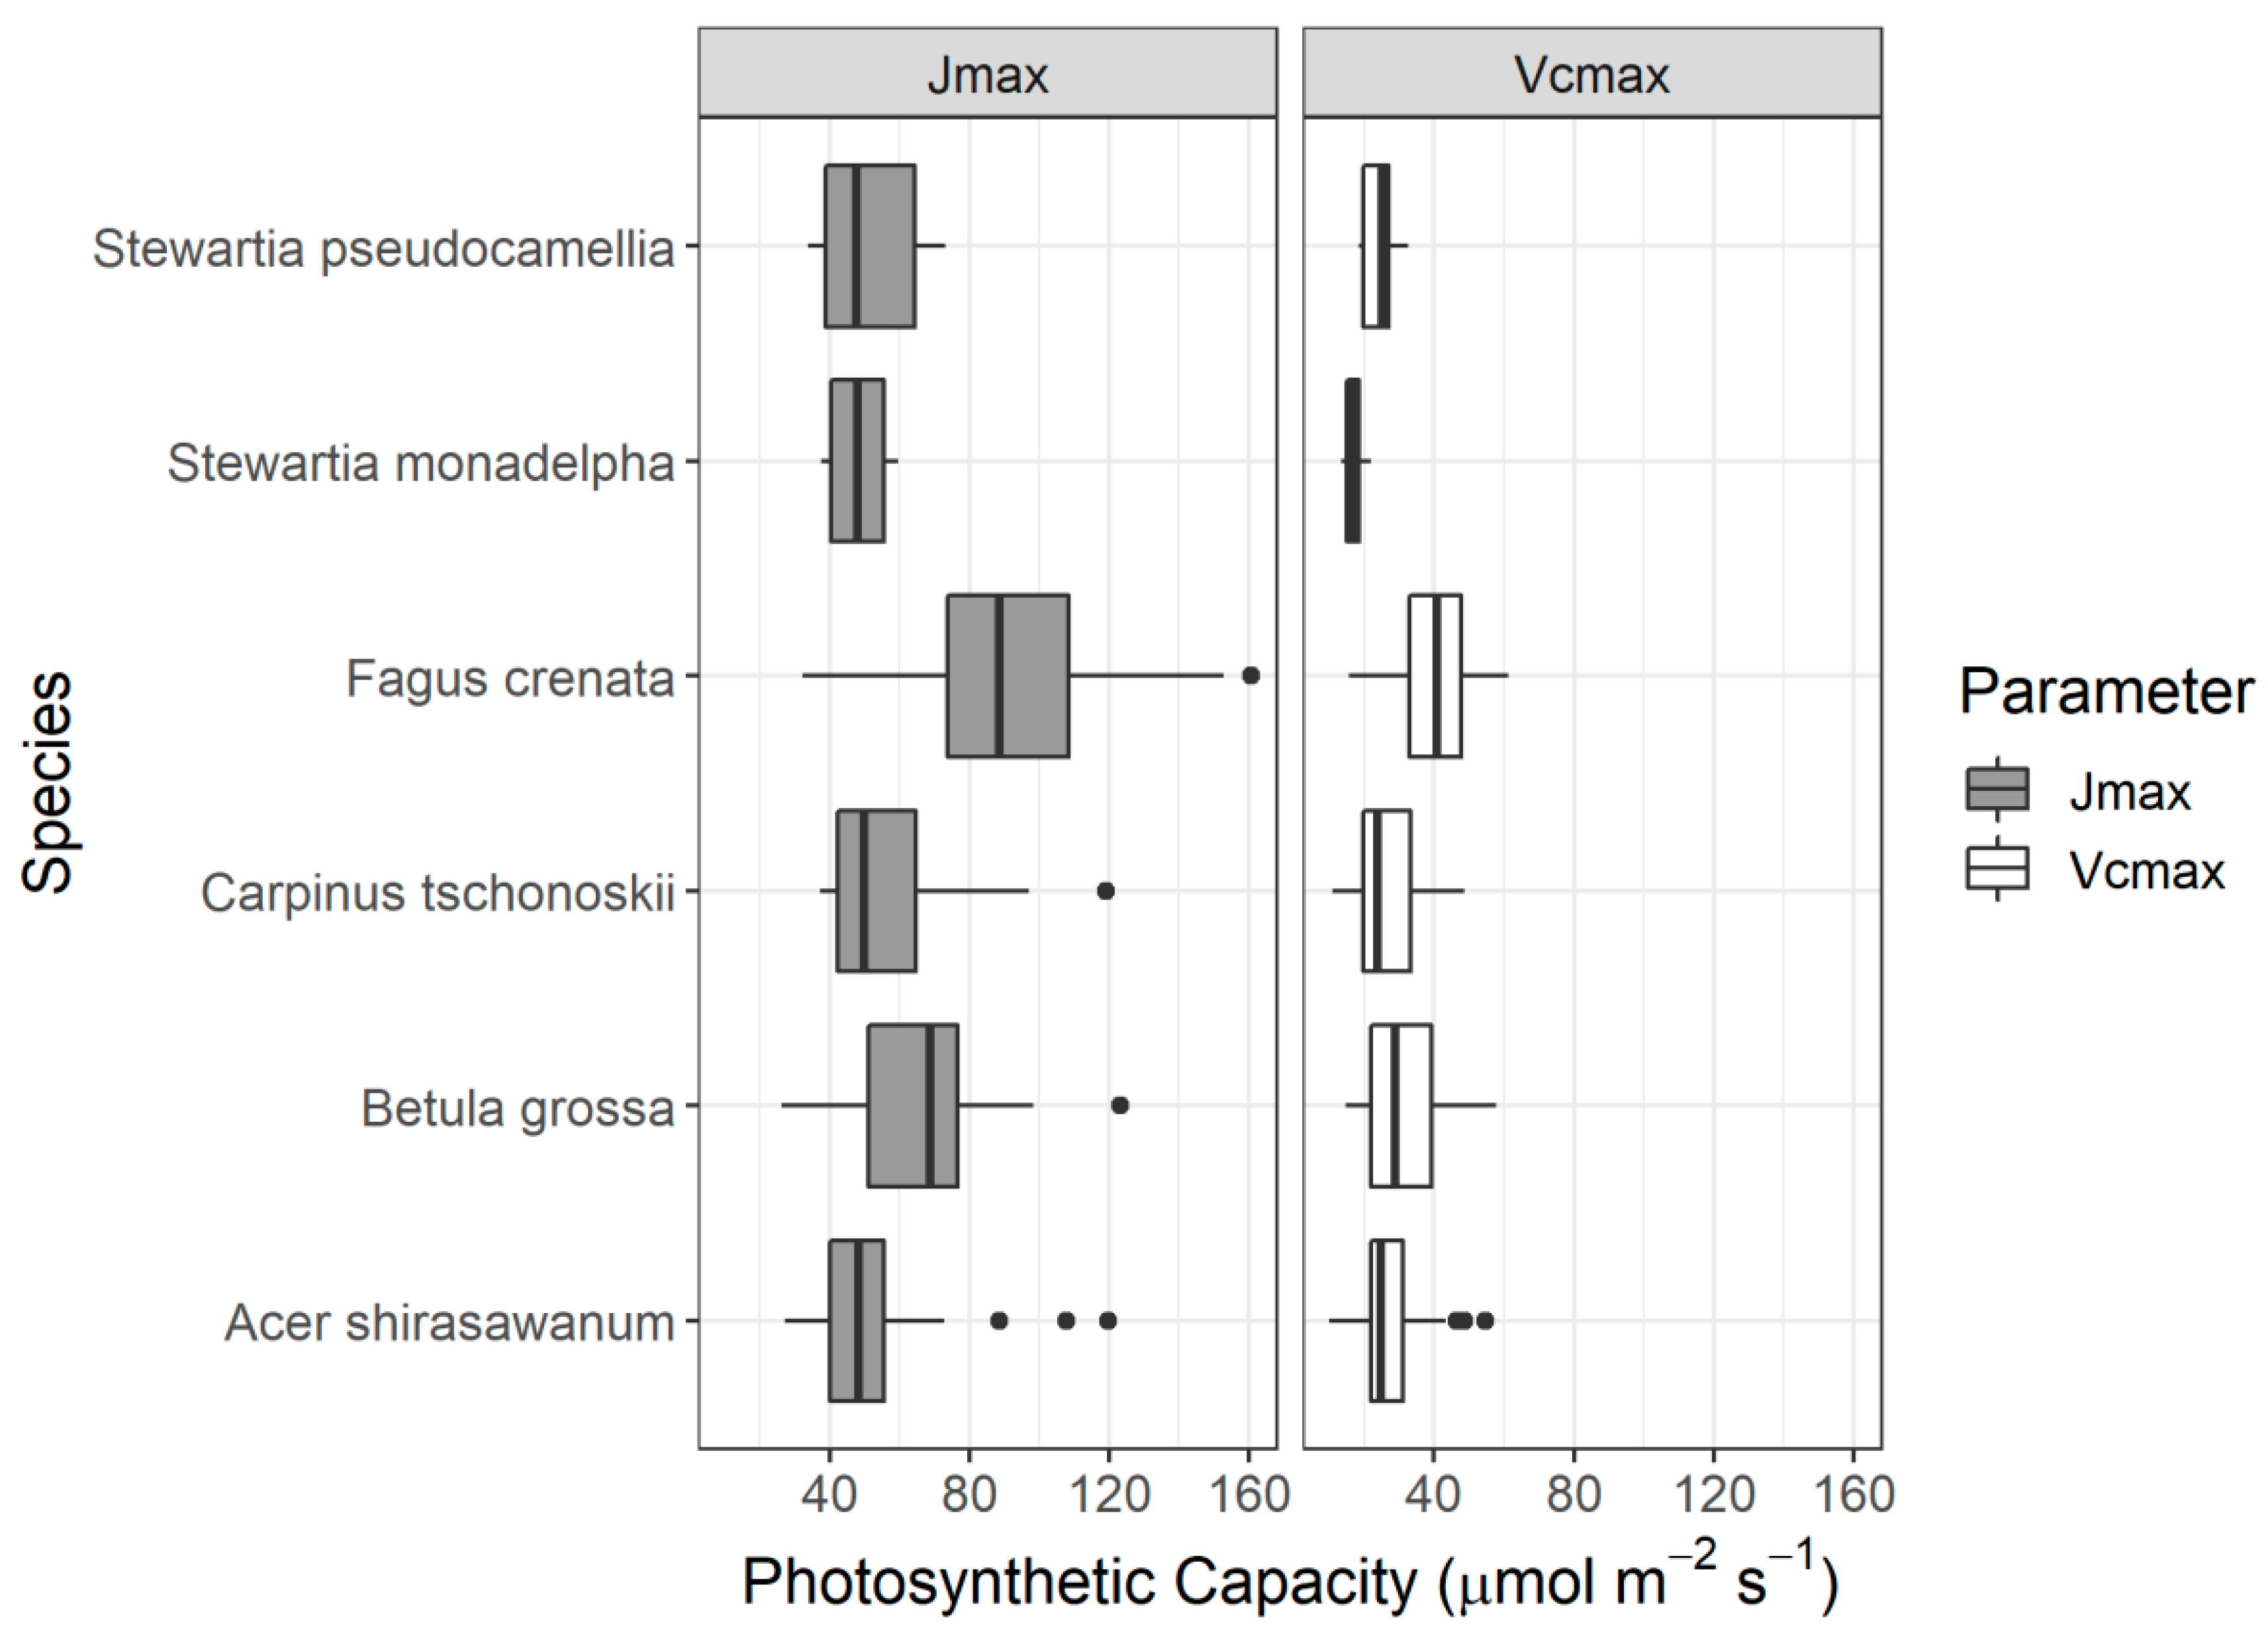
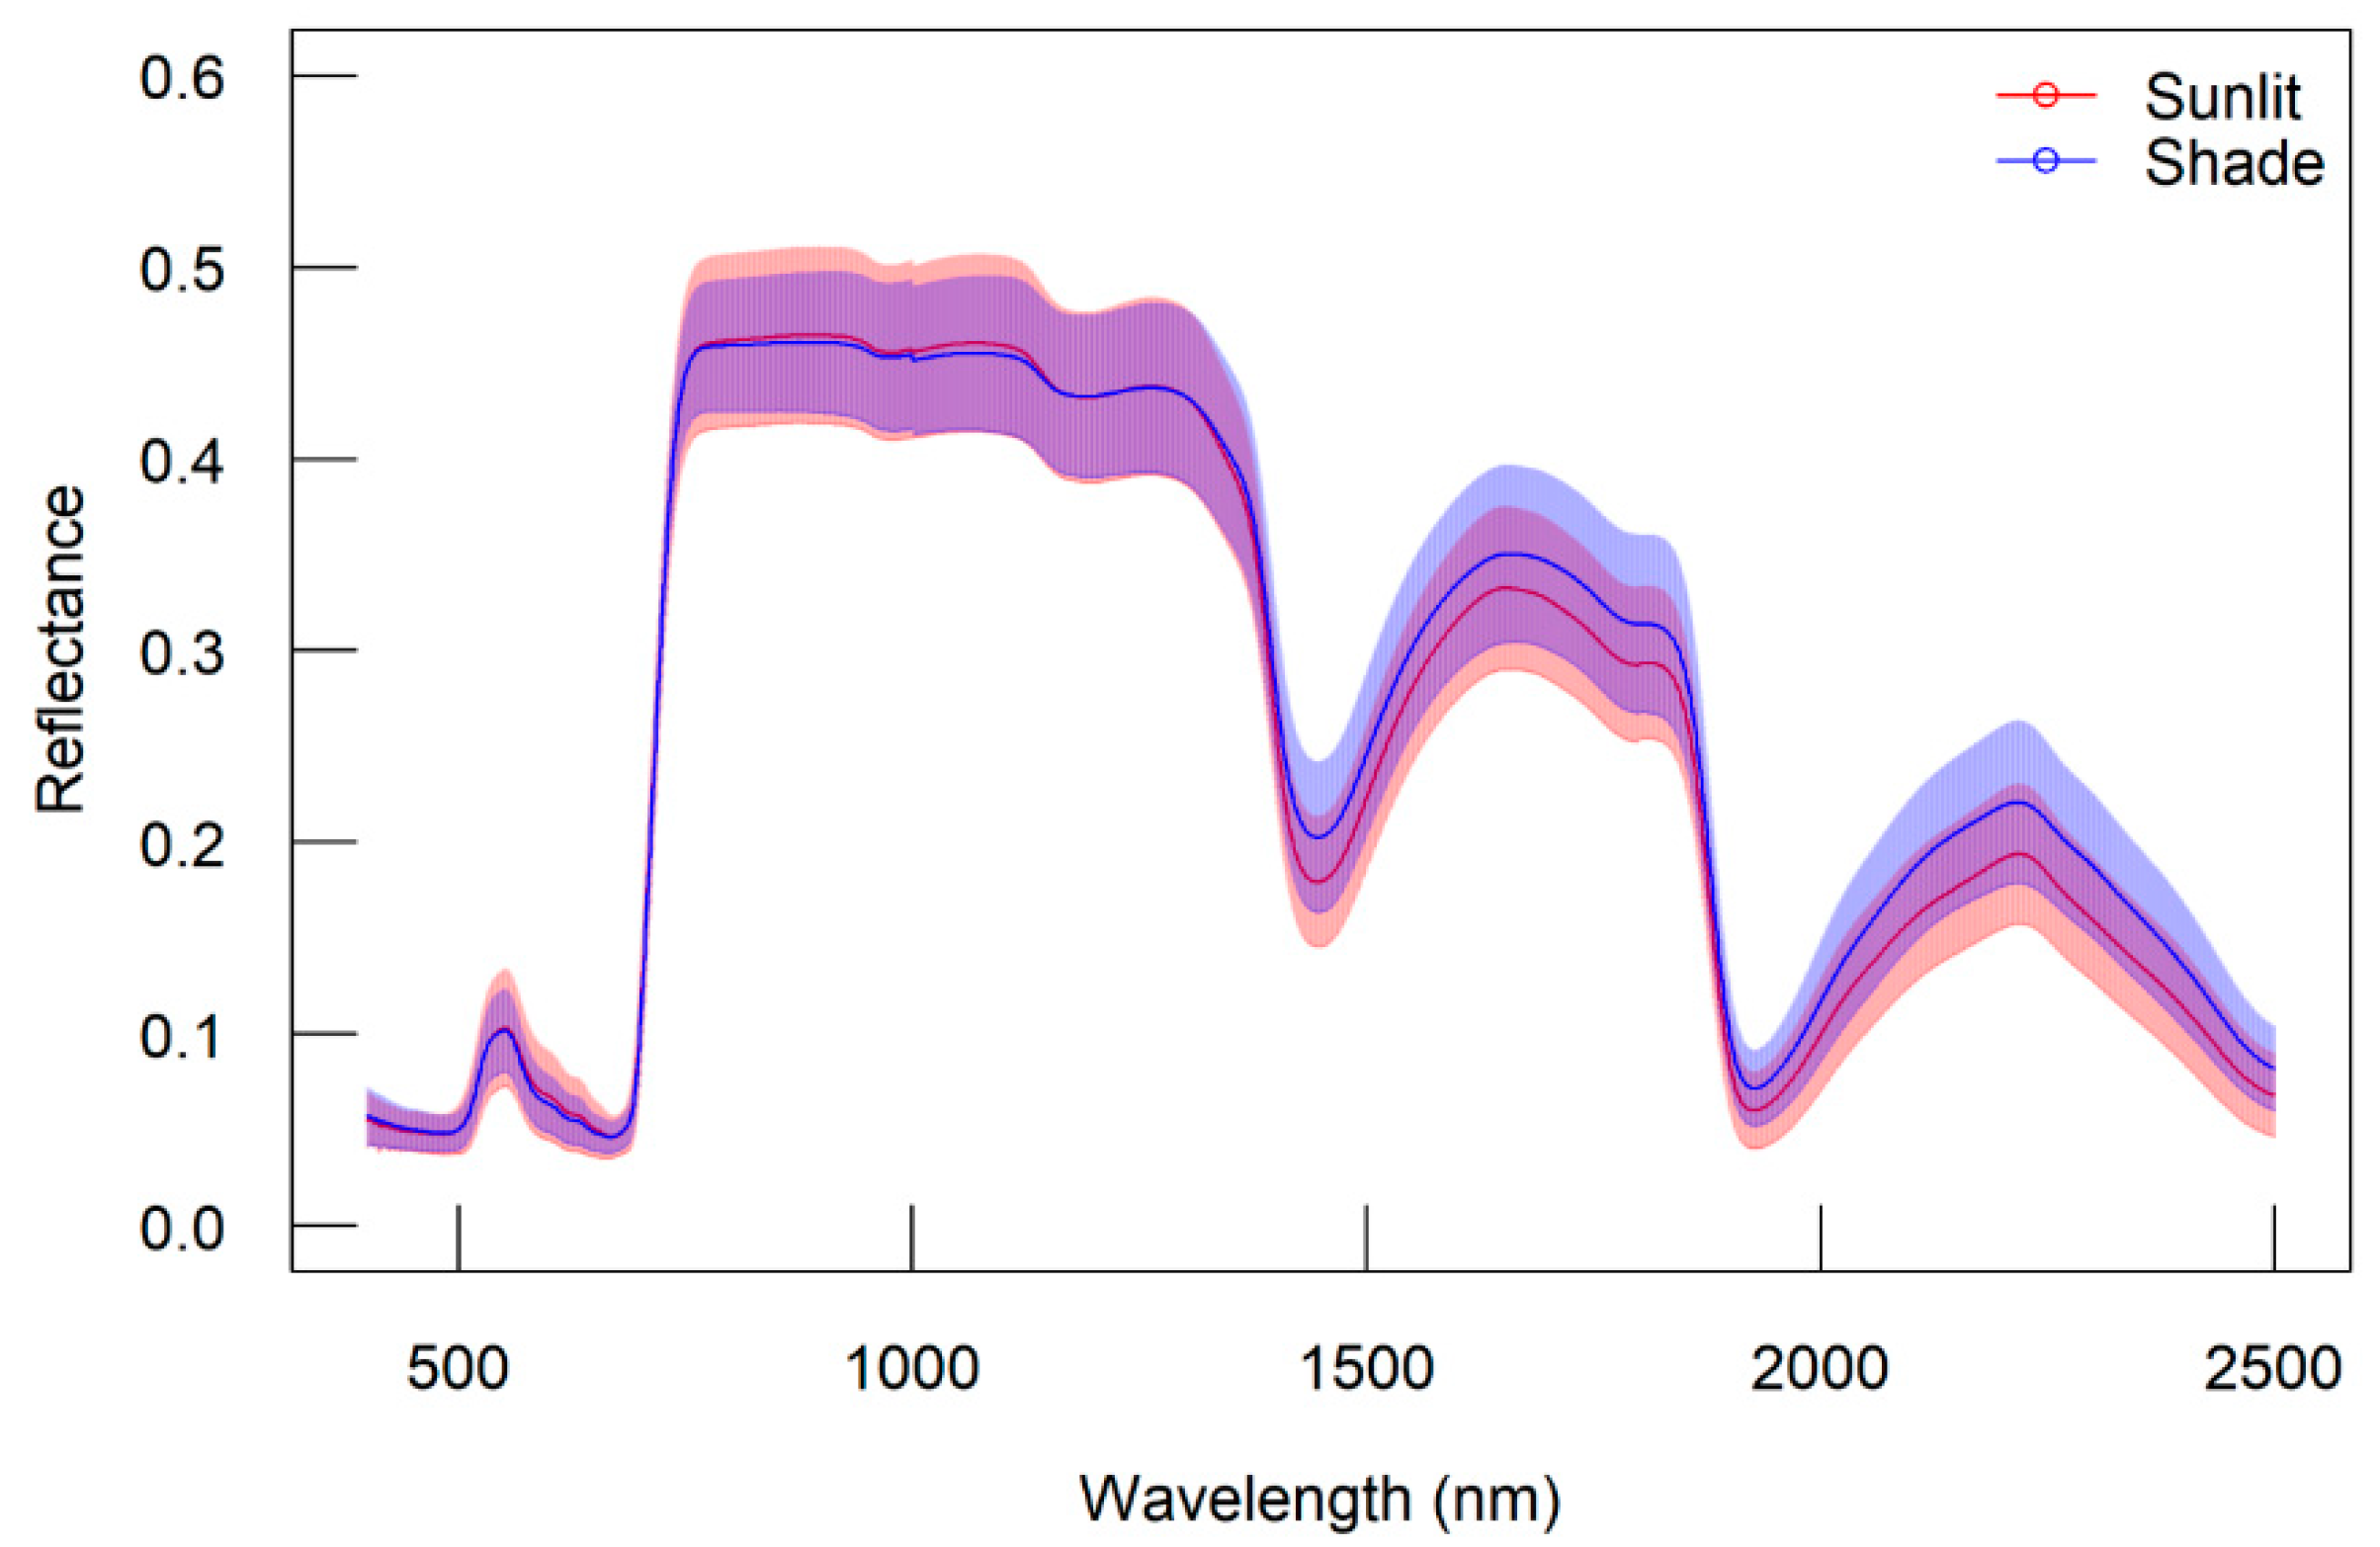
The aim of this study, therefore, is to develop a robust index for tracing photosynthetic parameters using hyperspectral information for alpine deciduous forests. We used a dataset composed of six species that dominate in the habitat of the alpine temperate forest in Japan. The dataset includes synchronous measurements of photosynthetic parameters (Vcmax and Jmax) and reflectance from two distinctive leaf groups, sunlit leaves, and shaded leaves of each species. A downscaled dataset is also attempted to investigate the possibilities of using satellite-borne hyperspectral data for future assessment.
4. Discussion
Hyperspectral remote sensing, as a promising technique, has already been widely used for retrieving structural and biochemical parameters [
11,
48,
49,
50] Unfortunately, few studies have ever succeeded with physiological parameters [
29,
31,
51,
52]. Sensitivity analysis results of the newly developed model of soil-canopy spectral radiances, photosynthesis, fluorescence, temperature, and energy balance (SCOPE) [
13] indicated that recognizable contributions of the physiological parameters (such as Ball–Berry stomatal conductance parameter, roughness length for the momentum of the canopy) were identified to reflectance [
16]. What’s more, V
cmax showed a great contribution to the full broadband sun-induced chlorophyll fluorescence (SIF) flux and calculating total fluorescence yield [
53]. These results laid the possibility of using hyperspectral remote sensing to trace photosynthetic capacity parameters.
In this study, we tried to reveal the possibility of using hyperspectral information to detect and to quantify photosynthetic capacity parameters, namely, the maximum rate of rubisco carboxylation (Vcmax) and maximum rate of photosynthesis electron transport (Jmax). We investigated the possibilities of using hyperspectral vegetation indices, the most popular applied empirical approach in current remote sensing activities. We first investigated the feasibility of using the reported indices based on our specific dataset containing synchronous data of gas exchange and reflectance. In total, ten well-known indices were validated, including the PRI and RVSI that are usually used for physiological trait assessment, and some for predicting biochemicals such as pigments (SIPI, CARI, mCARI) and nitrogen content (NDNI), as well as several (e.g., NDVI and EVI2 for structural assessment, such as LAI (leaf area index) and green biomass). These ten reported indices are in widespread use and are related, more or less, to photosynthetic capacity [
54,
55,
56].
None of the reported indices could be recommended, as clearly indicated by their RPD values (all below 1.4). Although NDVI and EVI2 performed slightly better using the range of the central wavelength of Sentinel 2A, their RPD values were still below 1.4. Similar results were also found for other indices, such as PRI and RVSI. Surprisingly, although both the PRI and RVSI indices have frequently been used to quantify physiological parameters, they performed poorly with both photosynthetic parameters. Furthermore, several indices that are usually used to quantify pigments also gave poor results.
Possibly, the main reason for the poor performance of the reported indices may be the range of wavelengths used for calculations. All of the reported indices were developed using specific wavelengths to fit their specific purposes. For example, PRI was developed using green wavelengths at 531 nm and 570 nm, both of which are useful to detect chlorophyll fluorescence [
57,
58]. As such, a number of previous researches have already proved the feasibility of PRI for tracing other plant physiological activities related to chlorophyll pigment [
24,
59,
60], but apparently not for photosynthetic parameters. The other reported indices are largely based on the red and NIR wavelengths that are sensitive to trace the change of vegetation, except for NDNI using the SWIR range. However, the wavelengths used were not feasible to trace other physiological changes, especially photosynthetic capacity.
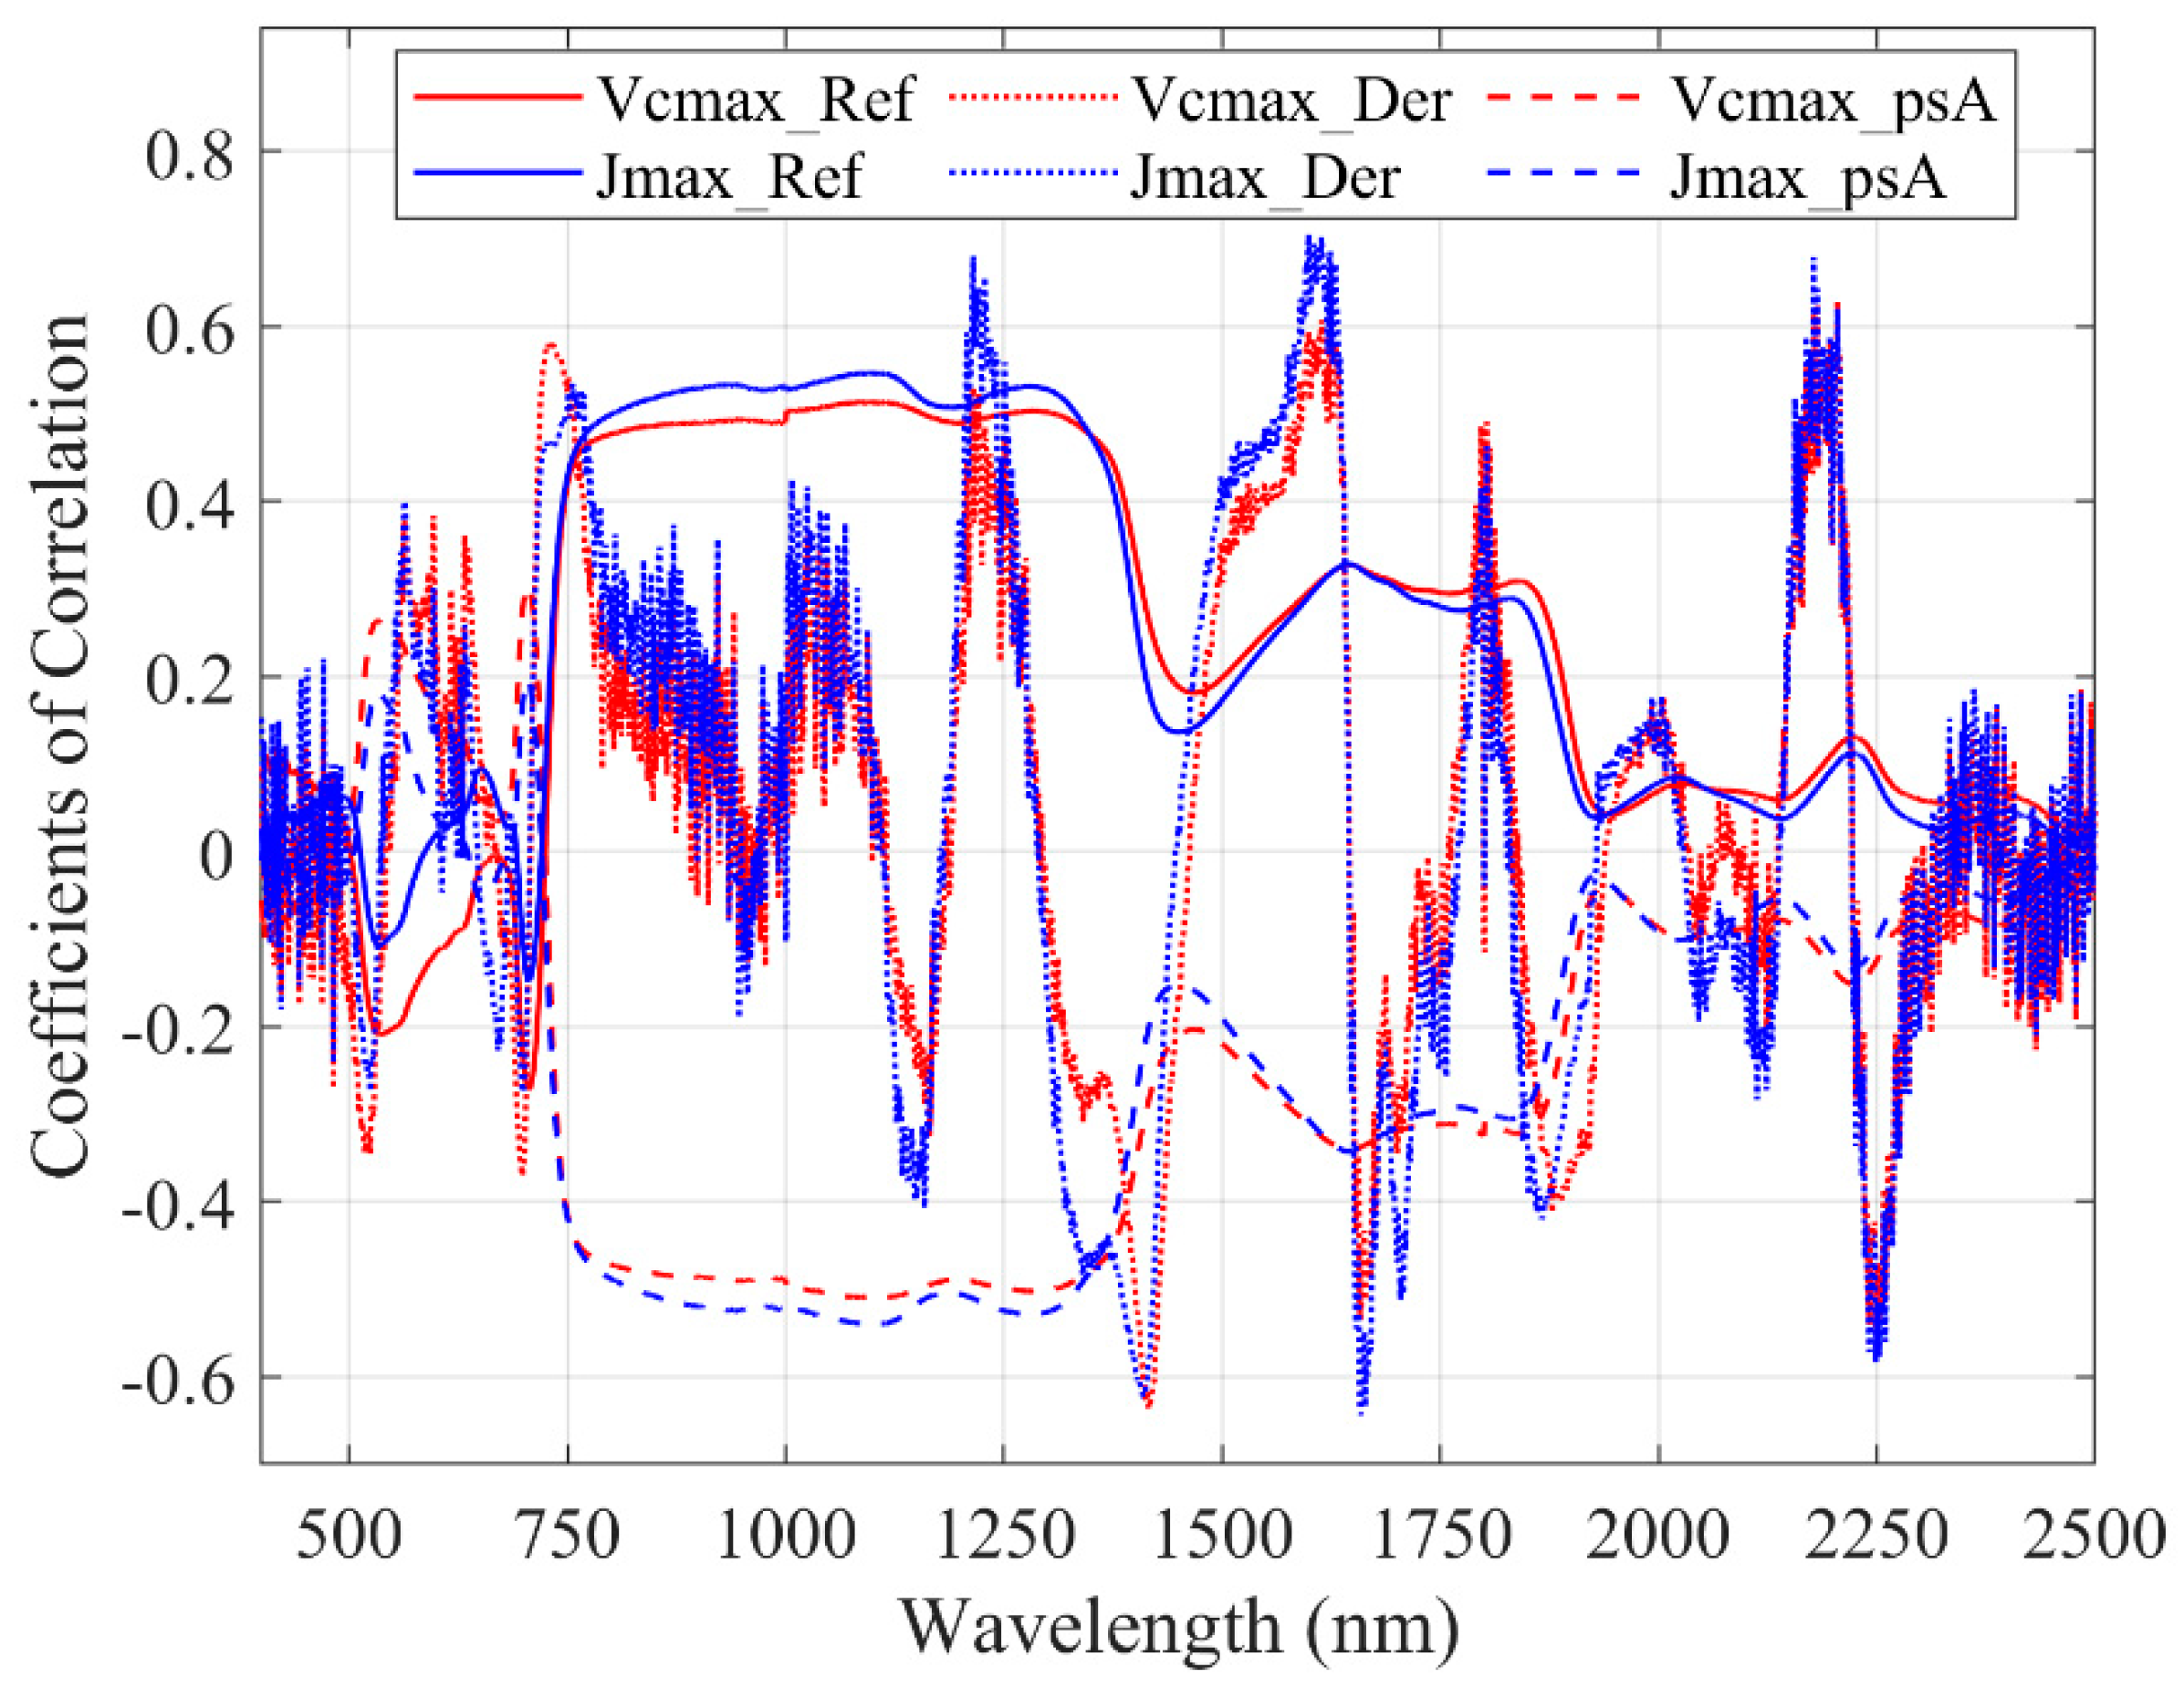
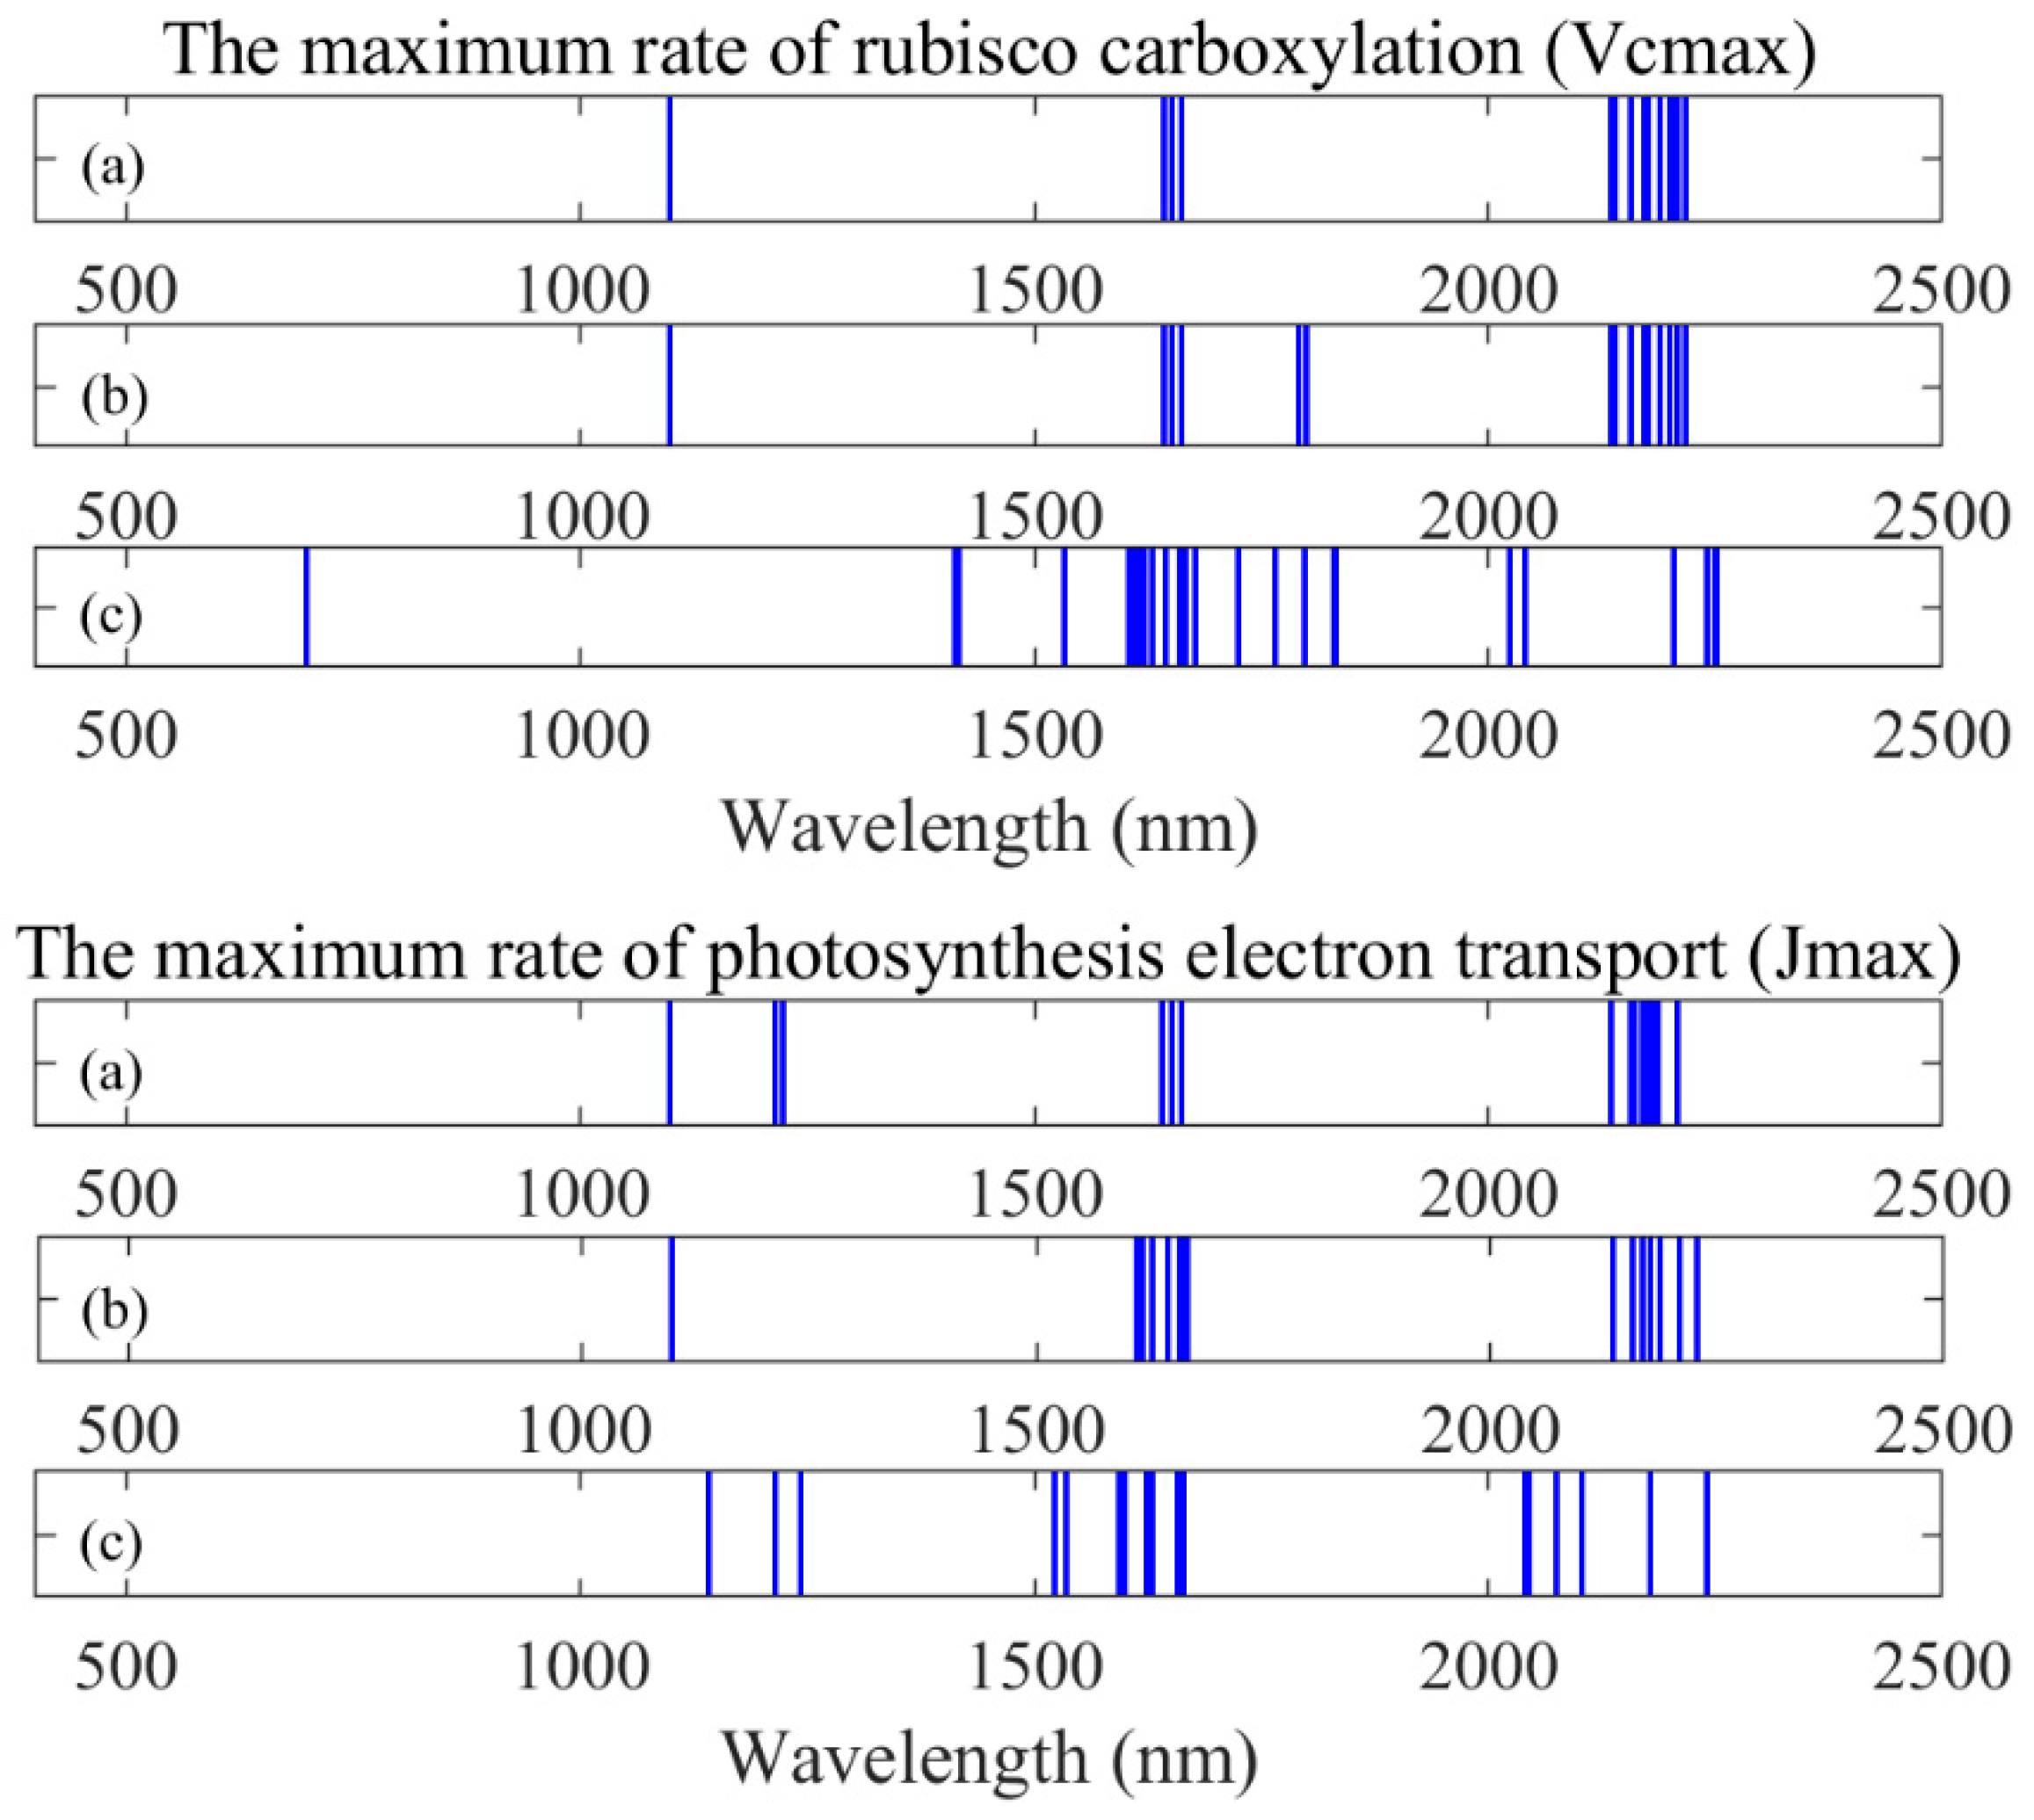
Clearly, new indices for quantifying photosynthetic capacity need to be developed. When using first-order derivatives spectra, we found DDn(1831,419) and D(1629,1658) to be the best indices for tracing V
cmax and J
max based on our dataset. The RPD values of both indices are 1.43 and 1.78 for V
cmax and J
max, respectively. Although this type of index is not the best on J
max, the performance of DDn(1600,65) is still acceptable (RPD = 1.68, R
2 = 0.64). We suggest that the DDn type of indices could be used as a general form for tracing photosynthetic parameters. We looked through the wavelengths and identified several negative coefficients of correlation (troughs) between the reflectance spectra and photosynthetic parameters. We found that our identified DDn index used a wavelength from the second trough and other troughs of first-order derivatives spectra, as shown in
Figure 6. Meanwhile, the useful wavelengths for all of the indices based on original reflectance, first-order derivatives, and apparent spectra are presented in
Figure 7. Most of the useful wavelengths for both parameters are from the peak regions or troughs region.
The indices based on the first-order derivatives spectra were found to perform better than those based on the original or apparent absorption spectra. The first-order derivatives spectra are known to be able to reduce noise between spectral data [
45,
46] and this is the probable reason. Another possible reason is that these identified indices all used wavelengths in the SWIR region (1300 nm to 2500 nm). The SWIR domain is known to be very informative for detecting physiological or chemical activity due to the wavelengths being absorbed or reflected by the object [
61,
62]. These SWIR wavelengths have properties that are more similar to visible light compared with the other infrared range. Based on
Figure 7, we extracted six different wavelengths used by the DDn type of indices based on the first-order derivatives spectra. Wavelengths 1412 nm, 1831 nm, and 2250 nm were selected for V
cmax and wavelengths 1535 nm, 1600 nm, and 1665 nm were selected for J
max. The wavelength 1412 nm used in the DDn index for V
cmax estimation was within the most sensitive domain of V
cmax. The first-order derivative spectra at 1412 nm were significantly related to V
cmax (the coefficient of correlation
r = -0.62). Similarly, the wavelength 1600 nm used in the DDn index for J
max estimation was also within the most sensitive domain of J
max. The first-order derivative spectra at 1600 nm were significantly and positively related to J
max (the coefficient of correlation
r = 0.68). According to
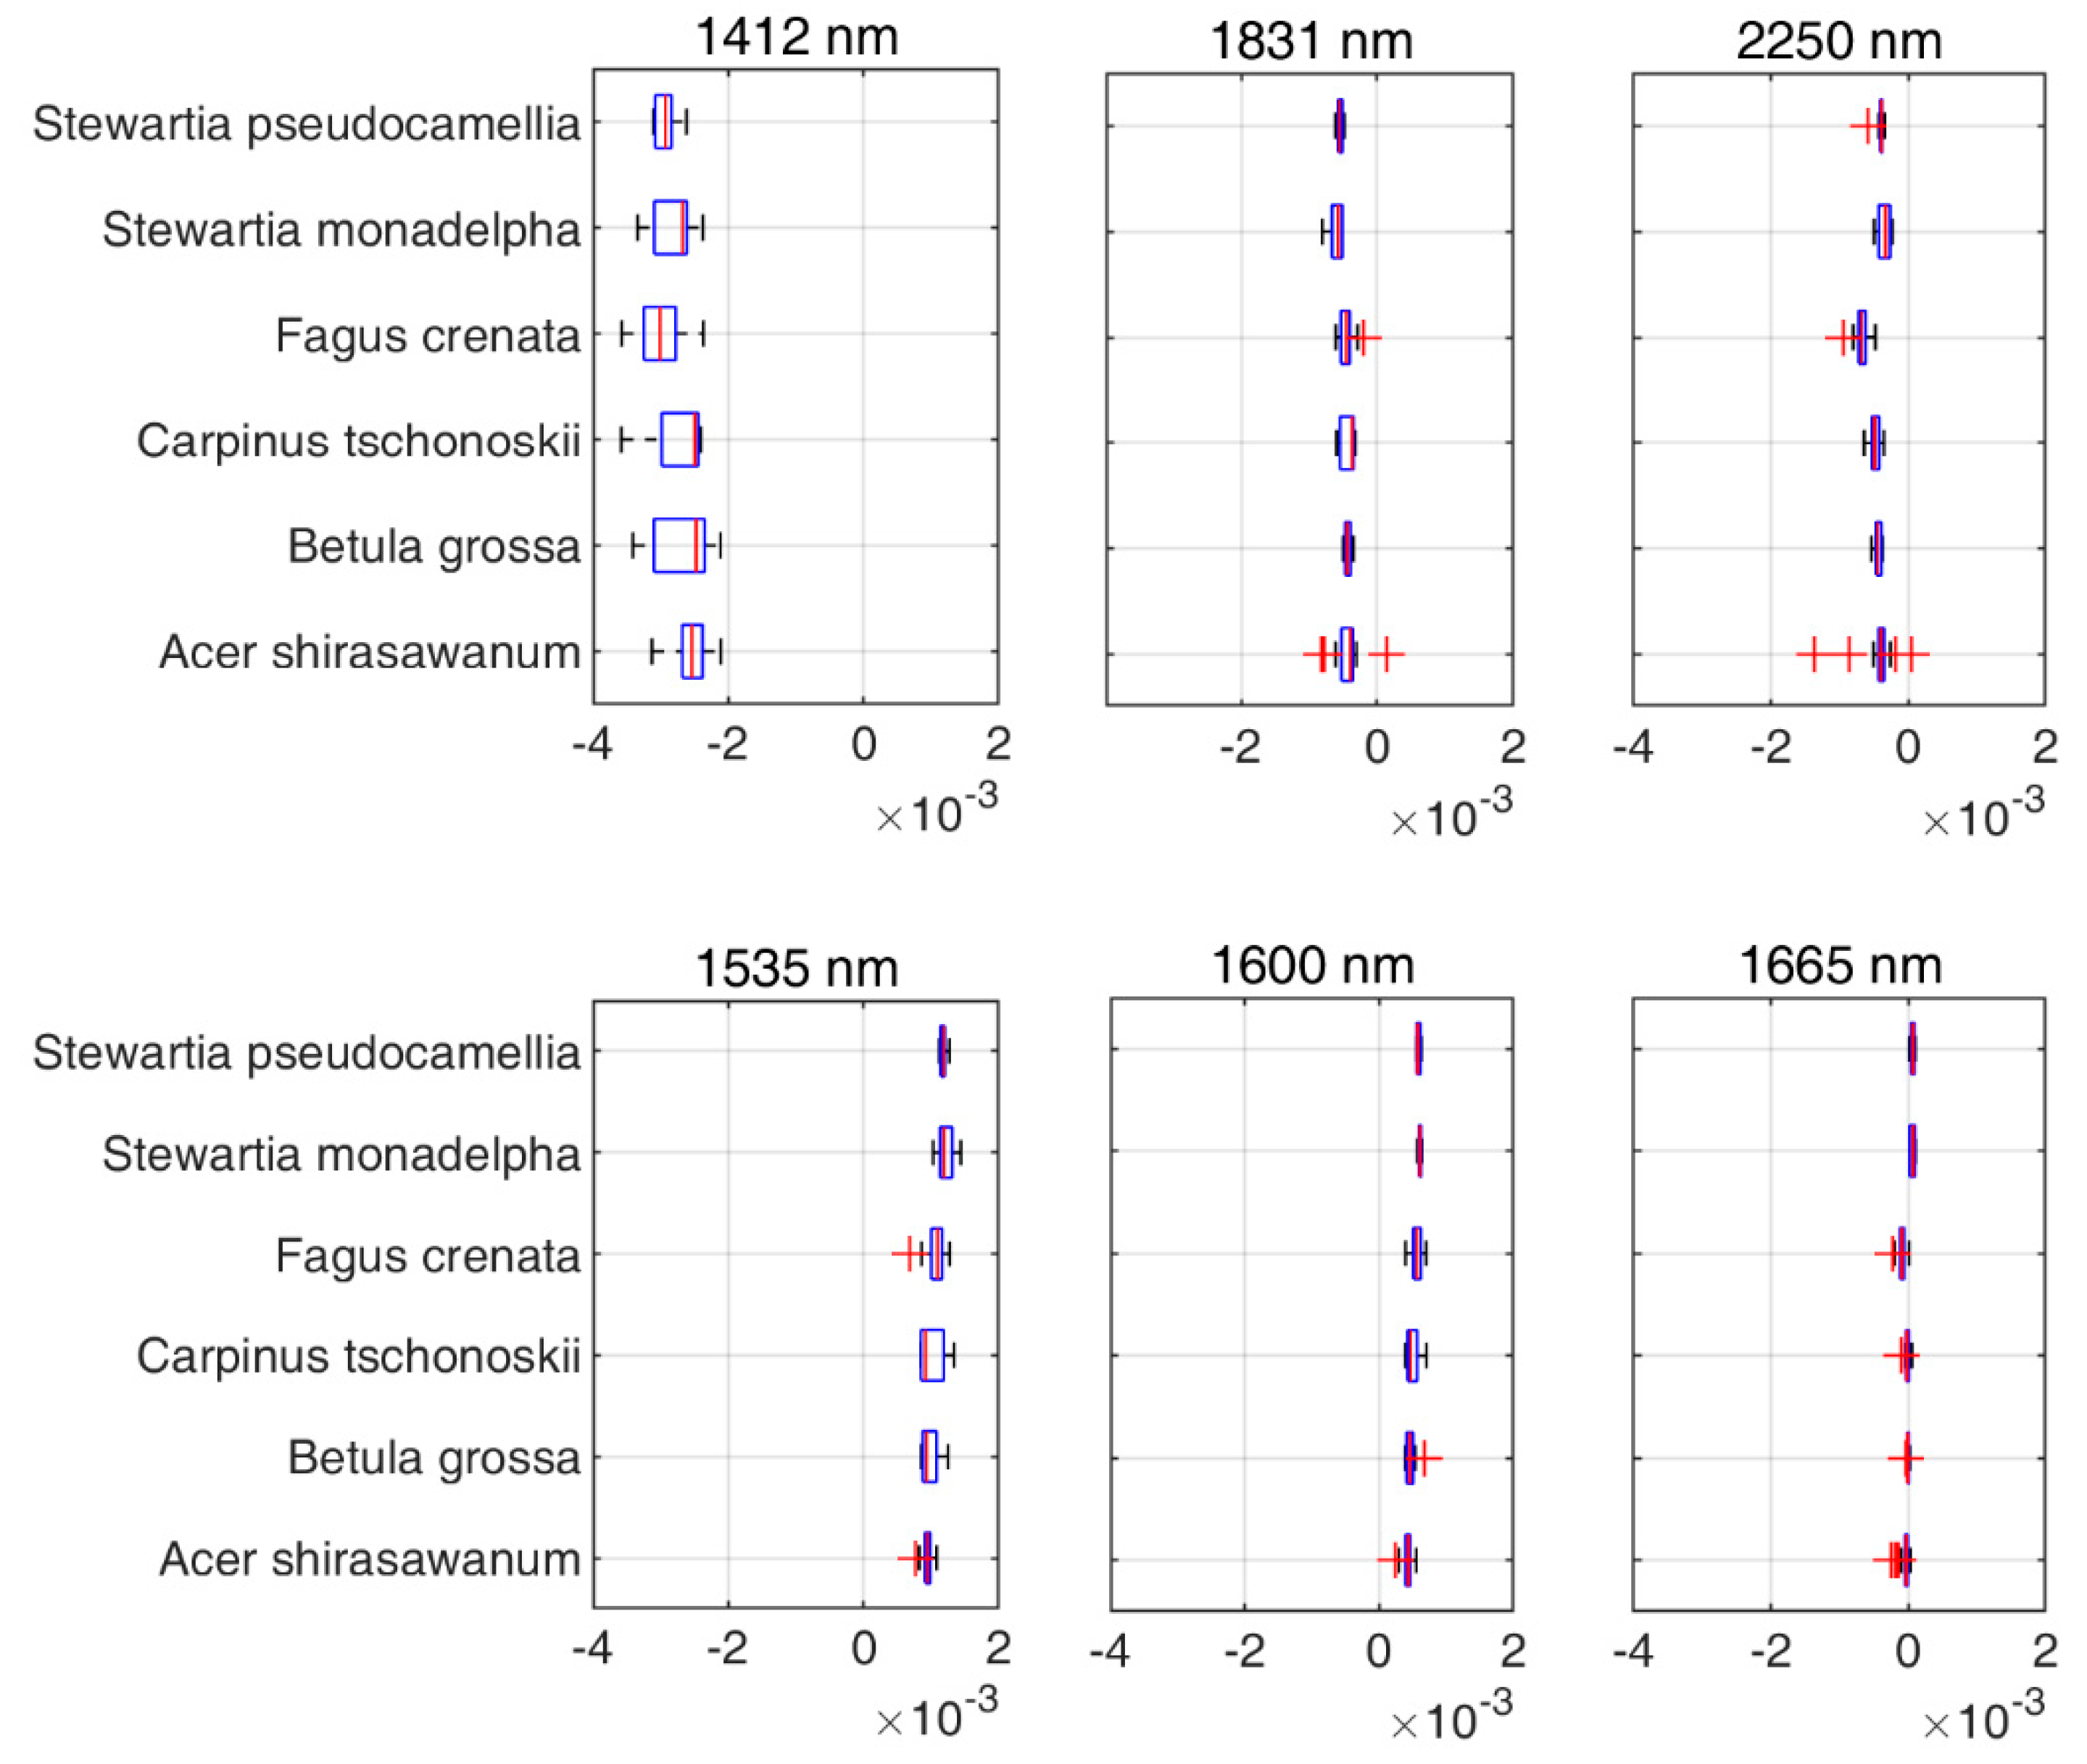
Figure 8, there were no significant differences between species in this range of wavelengths. However, the value range of the wavelengths differed in each case. The value of each wavelength is presented in
Figure 8.
Furthermore, we investigated the robustness of the developed indices with different leaf groups. The difference in leaf groups (sunlit and shaded) used in this study is due to differences in their response to the photosynthesis process [
63]. This leaf stratification also contributed to model accuracy when upscaling the leaf photosynthesis model to the canopy scale [
64]. While in several vegetation indices that have already been developed, the sunlit leaves usually contain a higher ratio of chlorophyll A and are thicker than shaded leaves, the shaded leaves have more chlorophyll per dried leaf weight and emit the maximum chlorophyll fluorescence, higher than sunlit leaves [
65].
We found that the DDn type of indices consistently traced J
max well, even when the wavelengths used were slightly different. For the shaded leaf group, the best DDn index used the 1664 nm for λ1with a Δλ of 54 nm, while for the sunlit leaf group the 1609 nm was used for λ1 with the Δλ of 45 nm. Meanwhile, the RPD values of the DDn type indices for tracing V
cmax decreased, especially in the sunlit leaves group. The sunlit leaves and shaded leaves have different physical and pigment conditions, where the shaded leaves usually emit higher chlorophyll fluorescence compared with sunlit leaves [
65]. Furthermore, the sunlit leaves mostly represent the lowest quantum yield of electron transport and lowest pigment content [
66] while the shaded leaves generally obtain only one-third of the canopy carbon gain [
67].
In addition to leaf groups, the screening results for different species also confirmed that the DDn type of indices performed best for B. grossa and F. crenata. However, the RPD value of the DDn index for A. shirasawanum was also respectable. As mentioned before, A. Shirasawanum and F. crenata have a large number of samples, being the dominant and targeted species in our study, while for other species, the DDn performed respectably in comparison with the other types of index and when using different forms of spectra also performed better than the original reflectance spectra.
Further, we tested the indices with downscaled datasets to check the possibility of using airborne or satellite-borne data that generally have coarse spectral resolutions. The DDn type of indices kept their good performance for tracing Jmax and even Vcmax, although the Vcmax results were slightly inferior to those of Jmax. We also tried to use different types of spectral forms to test the consistency of the DDn index, and the performance for the DDn type of indices was found to be acceptable even for different spectral resolutions.
We concluded that the best type of index for quantifying photosynthetic parameters is the DDn type, which proved to be robust even for different species. The index also performed stably for downscaled resolution spectra, suggesting that it could also be used for airborne or satellite-borne coarse spectral data.
However, we realize that the indices have several shortcomings that must be resolved before they can be applied widely, such as that the number of species needs to be increased, as the sensitivity of hyperspectral indices is often considered to be species-dependent [
68,
69]. Furthermore, the sample sizes for several specific species were too small and could possibly therefore be overfitted, since it has been claimed that the sample size could influence the value of statistical indicators [
70]. The first-order derivatives spectra are the best type of spectra for quantifying photosynthetic parameters, as hyperspectral indices based on the spectra show a certain balance between accuracy and robustness on retrieving plant properties [
71]. Even though we are confident that this type of index could work for the alpine deciduous forest, much more study is still needed in order to provide generally applicable indices for tracing photosynthetic parameters. However, we foresee that such indices could be developed and we have taken an important step towards this objective.


