Article

Spatially Quantifying Forest Loss at Landscape-scale Following a Major Storm Event

1
Florida Agricultural & Mechanical University, Tallahassee, FL 32307, USA
2
Florida Natural Areas Inventory, Tallahassee, FL 32303, USA
3
U.S. Forest Service, Tallahassee, FL 32303, USA
*
Author to whom correspondence should be addressed.
Remote Sens. 2020, 12(7), 1138; https://doi.org/10.3390/rs12071138
Submission received: 20 March 2020 / Revised: 31 March 2020 / Accepted: 1 April 2020 / Published: 2 April 2020
(This article belongs to the Section Forest Remote Sensing)

Abstract

:
Large scale forest disturbances are becoming more frequent across the world, and remote sensing must play a role in informing and prioritizing immediate, short-term and long-term disaster response and recovery. However, such evaluations from remote sensing are currently limited (e.g., burned area severity and change NDVI) and do not always explicitly relate to change in resources of interest. Herein we demonstrate a novel method to predict basal area loss, validated by independent field evaluations. Hurricane Michael made landfall on Mexico Beach in the Florida panhandle as a Category 5 storm on October 10th, 2018. The storm affected roughly 2 million hectares of largely forested land in the area. In this study, we use Sentinel-2 imagery and 248 forest plots collected prior to landfall in 2018 in the forests impacted by Hurricane Michael to build a general linear model of tree basal area across the landscape. The basal area model was constrained to areas where trees were present using a tree presence model as a hurdle. We informed the model with post-hurricane Sentinel-2 imagery and compared the pre- and post- hurricane basal area maps to assess the loss of basal area following the hurricane. The basal area model had an r-squared value of 0.508. Plots were revisited to ground truth the modelled results; this showed that the model performed well at categorizing forest hurricane damage. Our results validate a novel method to create a landscape scale spatial dataset showing the location and intensity of basal area loss at 10-m spatial resolution which can be used for quantifying forest disturbances worldwide.

Graphical Abstract

1. Introduction

Hurricane Michael was a category 5 hurricane that made landfall on the Florida panhandle on October 10th, 2018. It was the second strongest hurricane to make landfall on the continental United States, with estimated maximum sustained winds of 259 km/h, and was the first category 5 hurricane on record to make landfall in this area [1]. An early study found that the hurricane caused 88.7% tree mortality at some longleaf pine sites [2].
While hurricanes, and tropical cyclones in general, are a natural source of forest disturbance, the frequency of powerful hurricanes such as Hurricane Michael is increasing due to climate change [3]. Other forest disturbances, such as fire, drought and insect activity, are also projected to increase under climate change scenarios [4]. The increase of forest disturbances has led to an increased need to quantify the impact, spatial extent and location of these disturbances to inform recovery and ongoing adaptive management and monitoring efforts [5]. This information need is especially important shortly after a disturbance when there is greater uncertainty regarding the extent of the impact to resources. For this reason, improved, rapid, and detailed spatial methods to access impacts are needed.
Remotely-sensed data from satellites have the large spatial extent, and several have the high spatial resolution, which is required to observe large forest disturbances such as hurricanes across the landscape at the forest stand level. Due to this, satellite remote sensing analyses are increasingly used in assessments of hurricane forest damage [6]. Many of these remote sensing damage assessments are based on changes in vegetative indices such as the normalized difference vegetative index (NDVI) [7,8,9,10], enhanced vegetation index (EVI) [11] or even the normalized difference infrared index (NDII) [6]. Vegetation indices have the advantages of being normalized, well tested, readily available and they do not require outside data, such as field plots, to perform analyses. However, the use of vegetative indices introduces noise in the form of soil reflectance, index saturation and atmospheric effects that must be mitigated [6]. Additional challenges to using vegetative indices to quantify abrupt vegetation changes include co-registration errors and addressing vegetation phenology [6,12].
Other approaches, including those of Chambers et al. [13] and Negrón-Juárez et al. [14], quantify the change in nonphotosynthetic vegetation as an estimate of the change in dead vegetation following hurricanes using remotely-sensed imagery and post-hurricane forest plots. However, no studies have yet used remotely-sensed data with spatial resolutions finer than 30-m to quantify the entire extent of forest damage from hurricanes. Hu and Smith [7] used two 10-m Sentinel-2 images in their analysis of Hurricane Maria damage in Puerto Rico, but aggregated those images to 30-m. Aosier et al. [15] used 15-m ASTER (Advanced Spaceborne Thermal Emission and Reflection Radiometer) bands in their analysis of fallen tree reflectance, though these bands were combined with 30-m and 90-m bands. Additionally, analyses that require post-hurricane ground sampling would be a challenge to implement within the first few days of natural disasters when remote sensing analysis is most necessary [16]. Models that estimate forest damage informed by ground data collected before an event can be rapidly implemented and have the advantage of being focused on forest metrics of importance to managers. This study builds on previous work that used field plots and remotely-sensed imagery to estimate forest structure across large landscapes [17,18] to demonstrate a method for spatially quantifying a forest disturbance impact. These studies demonstrated methods for estimating forest metrics at fine spatial resolution (<30m) and at the landscape spatial extents (>1 million hectares) that are necessary to capture the impact of a major storm event [17,18]. These studies relate ground plot data to remotely-sensed imagery using both machine learning, for classification models, and linear modeling, for estimating continuous forest metrics. The hurdle model approach presented in [17] allows for more accurate modeling of forest metrics by targeting the linear models on only forested pixels.
This study presents a practical remote sensing method for locating forest damage at high spatial resolution across a large landscape. We use a plot design that is well suited to relate to remotely-sensed imagery by increasing the area of observation within a forest plot [19]. Sentinel-2 10-m spatial resolution multispectral imagery is used as our remotely-sensed predictive variables. The forest structure metric modelled is basal area (BA), which is the total cross-sectional area occupied by tree stems in a location. BA was chosen for this study as it is a commonly used forestry metric that has previously been used to quantify hurricane damage to forests [20], and provides an unambiguous metric for quantifying storm damage. In this analysis, we model tree basal area across the area impacted by Hurricane Michael in Florida and apply it to pre- and post- hurricane imagery. The resulting map of forest damage in Florida at 10-m spatial resolution can be used to inform forest management, recovery and restoration decisions. This methodology can also be adapted to quantify forest disturbances across the globe wherever remotely-sensed imagery and field plots are available.

2. Methods

2.1. Study Area

The project study area consists of 11 counties in the panhandle of Florida which contain areas heavily impacted by Hurricane Michael (Figure 1). The area impacted by hurricane strength winds (i.e., wind speeds greater than 119 km/h) is heavily forested and includes large public lands including the 254,200-hectare Apalachicola National Forest, the 81,900-hectare Tate’s Hell state park forest, and seven Florida state parks among other conservation areas. This area is one of North America’s biodiversity hotspots for species rarity and richness [21]. It is home to the endangered longleaf pine (Pinus palustris) habitat [22,23] and endangered animal species such as the red-cockaded woodpecker (Picoides borealis), gopher tortoise (Gopherus polyphemus) and frosted flatwood salamander (Ambystoma cingulatum). At least 127 of the rarest species of plants and vertebrates statewide, and 45 out of 62 of Florida’s terrestrial communities, are present in the region [24]. The counties include: Washington, Jackson, Bay, Calhoun, Gulf, Franklin, Liberty, Gadsden, Leon, Wakulla and Jefferson.

2.2. Datasets

2.2.1. Restore Plots

Prior to Hurricane Michael, forestry plots were established by the Florida Natural Areas Inventory (FNAI) as a baseline for a Restore Act funded project within this landscape. A total of 248 “Restore” plots were visited between December 2017 and March 2018 (Figure 2). These temporary plots were laid out in 36-m squares containing four 9-m diameter nonoverlapping subplots following the recommendation of [19]. Enumeration of tree species and assessments of vegetative cover tree condition and diameter at breast height were conducted at the subplots.
Seventy plots were revisited post-hurricane Michael in February 2019 by navigating by GPS to the locations of the original plots. The seventy revisit plots were chosen as plots that were most likely to have suffered hurricane damage based on a rapid visual assessment of available post-hurricane imagery. Post-hurricane plot measurements were only a subset of the original measurements taken at Restore plots to provide a rapid damage assessment (Figure 2). The measurements taken at post-hurricane plots consisted of the species, condition and diameter at breast height (DBH) of damaged trees within the plots, a qualitative assessment of hurricane damage across the entire plot and an estimate of canopy cover for functional plant types.

2.2.2. Imagery

The Sentinel-2 MultiSpectral Instrument acquires 13 spectral bands with a temporal return interval of 5 days for the two-satellite mission. The four 10-m spatial resolution bands consisting of blue, green, red and near infrared were used in this study, and have a temporal registration error of 12 m (1.2 pixels) [25,26]. Sentinel-2 Level 1C imagery was obtained from the U.S. Geological Survey’s Earth Explorer website [27]. Hurricane Michael track and wind field areas were obtained from the National Hurricane Center [28].

2.3. Imagery Preprocessing

Seven Sentinel-2 scenes cover our study area (Figure 1). Two phenological time frames were selected to account for spectral variation of overstory during winter and spring. Pre- and post- hurricane images were manually selected within the two phenological periods, resulting in four total imagery mosaics. The full list of images is available in Appendix A.
Sentinel-2 Imagery was spectrally normalized using aggregate no-change regression (ANR) [29]. ANR is a relative normalization routine that uses overlap between target and reference images to build a linear relationship between spectral values of each band while mitigating imagery geo-rectification errors by aggregating to 50 times pixel size. The routine accounts for land cover changes between images by dropping a user defined percent of the top and bottom related pixels. Normalized images were mosaiced into four rasters consisting of pre- and post- hurricane winter and spring seasons (Figure 3).

Principal Component Analysis

To reduce the dimensionality of imagery data, spectral values of the normalized pre-hurricane phenology mosaics, standard deviation and horizontal grey level co-occurrence matrix (GLCM) values within the pixel’s immediate neighborhood were used as inputs for a singular vector decomposition principal component analysis (PCA). For our models, we selected the first ten principal components of the PCA, accounting for 96.3% of the variation contained in the Sentinel-2 imagery. Mean spectral value, standard deviation and GLCM of the first ten principal components of the PCA were used for initial predictive variables. Variables were calculated within a 4x4 pixel moving window to emulate the spatial extent of our plots. We then used an iterative variable selection script and methods from [17] to select a variable subset for each model.

2.4. Model Development

General linear models were developed using the R software [30] while the PCA model, image preprocessing, predictive surface creation and spatial analyses were done using the RMRS raster utility toolbar, an ArcGIS desktop add-in [31]. To estimate basal area across the forested landscape, we used a two-level hurdle model approach (Figure 4). Our approach first creates a tree presence model and a predictive surface to restrict the training of the BA estimation model to plots where trees are present. Then, the trained BA model is used to estimate BA constrained by the tree presence model to areas where trees are present. Areas where the presence model estimates that no trees are present are set to zero BA. For our tree presence hurdle model, we used a softmax neural network and selected predictive variables from the first ten principal components, following the iterative variable selection R script and methods from [17]. The softmax neural network model output is the probability of each pixel having any tree BA present. Values at or above 50% were classified as having trees present.
Our final model used six imagery predictor variables, the focal mean values from principal components 2, 5, 6, 8 and 10 and the standard deviation from principal component 8, coincident with all tree species BA as the response variable to train our generalized linear model (GLM). The BA model estimated square root basal areas which were applied to predictive variable surfaces and squared to create a raster of the estimated BA of our study area before hurricane Michael. The PCA and BA models were then informed using post-hurricane imagery mosaics to create a post-hurricane raster of estimated BA. The post-hurricane BA estimate raster was subtracted from the pre-hurricane BA, with negative values set to zero to produce a raster of post-hurricane BA loss. A percent tree BA loss raster was also developed by dividing the post-hurricane BA loss raster by the pre-hurricane BA raster.
Several masking steps were then taken to remove non-forested areas and sources of landscape change unrelated to Hurricane Michael. The landcover classification product described in [32] was used to mask out pixels of water, buildings and pavement. This 1-m spatial resolution land cover classification is derived from 2013 NAIP imagery and has both probabilistic and most likely classification datasets. Pixels with values above the upper limit of modeled basal area values when the model was limited to areas that fell within the prediction variables domain, as described in [17], were also masked. These pixels mostly occurred in urban areas and around roads that were not masked using the land cover classification product. Additionally, basal area values of post-hurricane BA loss rasters were set to zero where prescribed fires occurred on the ANF between our imagery observation dates.

3. Results

3.1. PCA Results

Retaining the top ten principal components reduced the number of predictor variables while accounting for 96.3% of the overall proportion of information contained in the normalized imagery. Almost all the principal components negatively associated the winter green band. We interpreted this as the winter green band not providing much information to differentiate between pixels due to most pixels in the imagery being green. The first principal component accounted for 46.2% of the overall variation and was interpreted as areas that are homogenous except for their greenness that changes due to the seasons, or mixed and deciduous forests. The second principal component, accounting for 15.8% of the overall imagery variation, can be interpreted as areas that are also homogenous except for their greenness that doesn’t change due to the season, or evergreen forests.
As mentioned, the general linear model of basal area selected principal components 2, 5, 6, 8 and 10 as significant variables. We interpreted the fifth and sixth principal components as variations of a vegetation index, as they seemed to be ratios of red to near infrared bands across the two phenological periods. The eighth and tenth principal components were both associated with growing season bands. The eighth principal component positively associated the growing season visible bands (red, green and blue), while the tenth principal component consisted of positive association of the growing season blue band’s standard deviation and negative association with the growing season near-infrared band GLCM and the green band.

3.2. Basal Area Model Results

The softmax neural network tree presence model had an overall accuracy of 0.992. Of the 248 Restore plots, only two were misclassified by the tree presence model. The BA general linear model results were R2 = 0.508, adjR2= 0.495, RMSE = 2.81 from a sample size of 231. The equation for our GLM predicting the square root of basal area is:
√BA = 6.081 + 2.997(P2) − 4.636(P5) + 3.915(P6) − 9.663(P8) − 10.297(P10) + 11.863(P18),
where P2, P5, P6, P8 and P10 refer to the focal mean of their respective principal components, and P18 refers to the standard deviation of the eighth principal component.
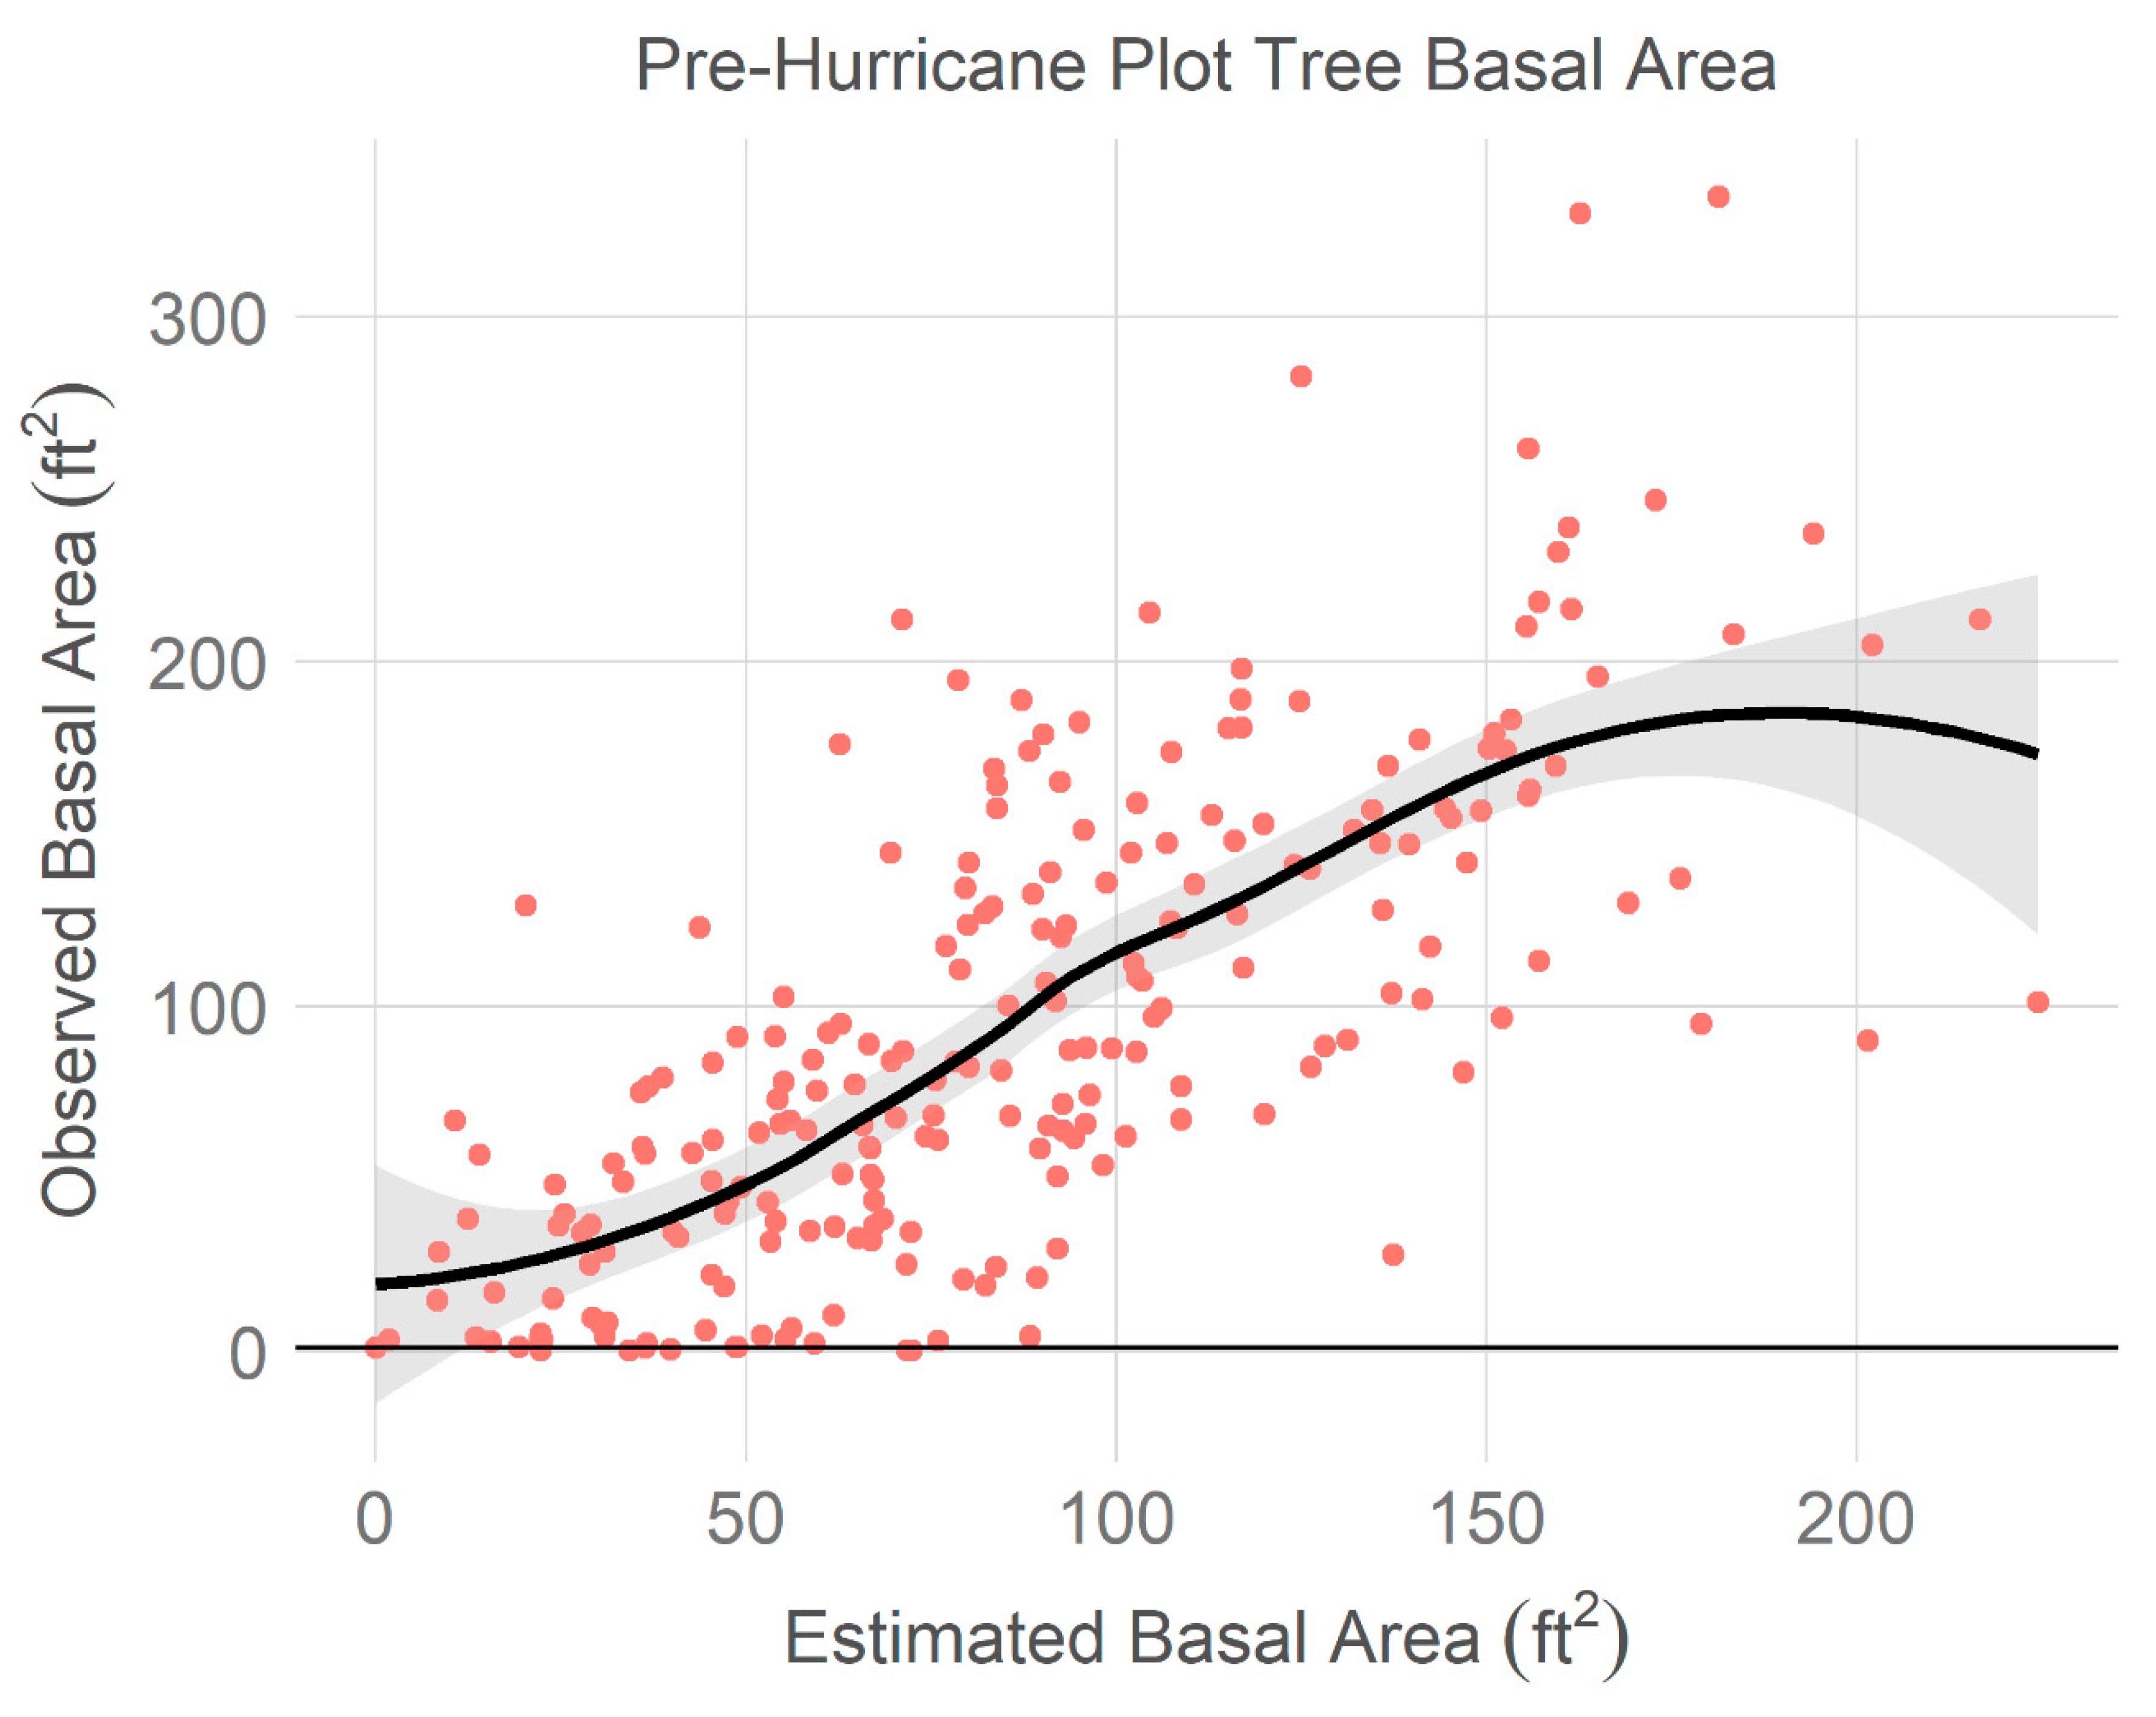
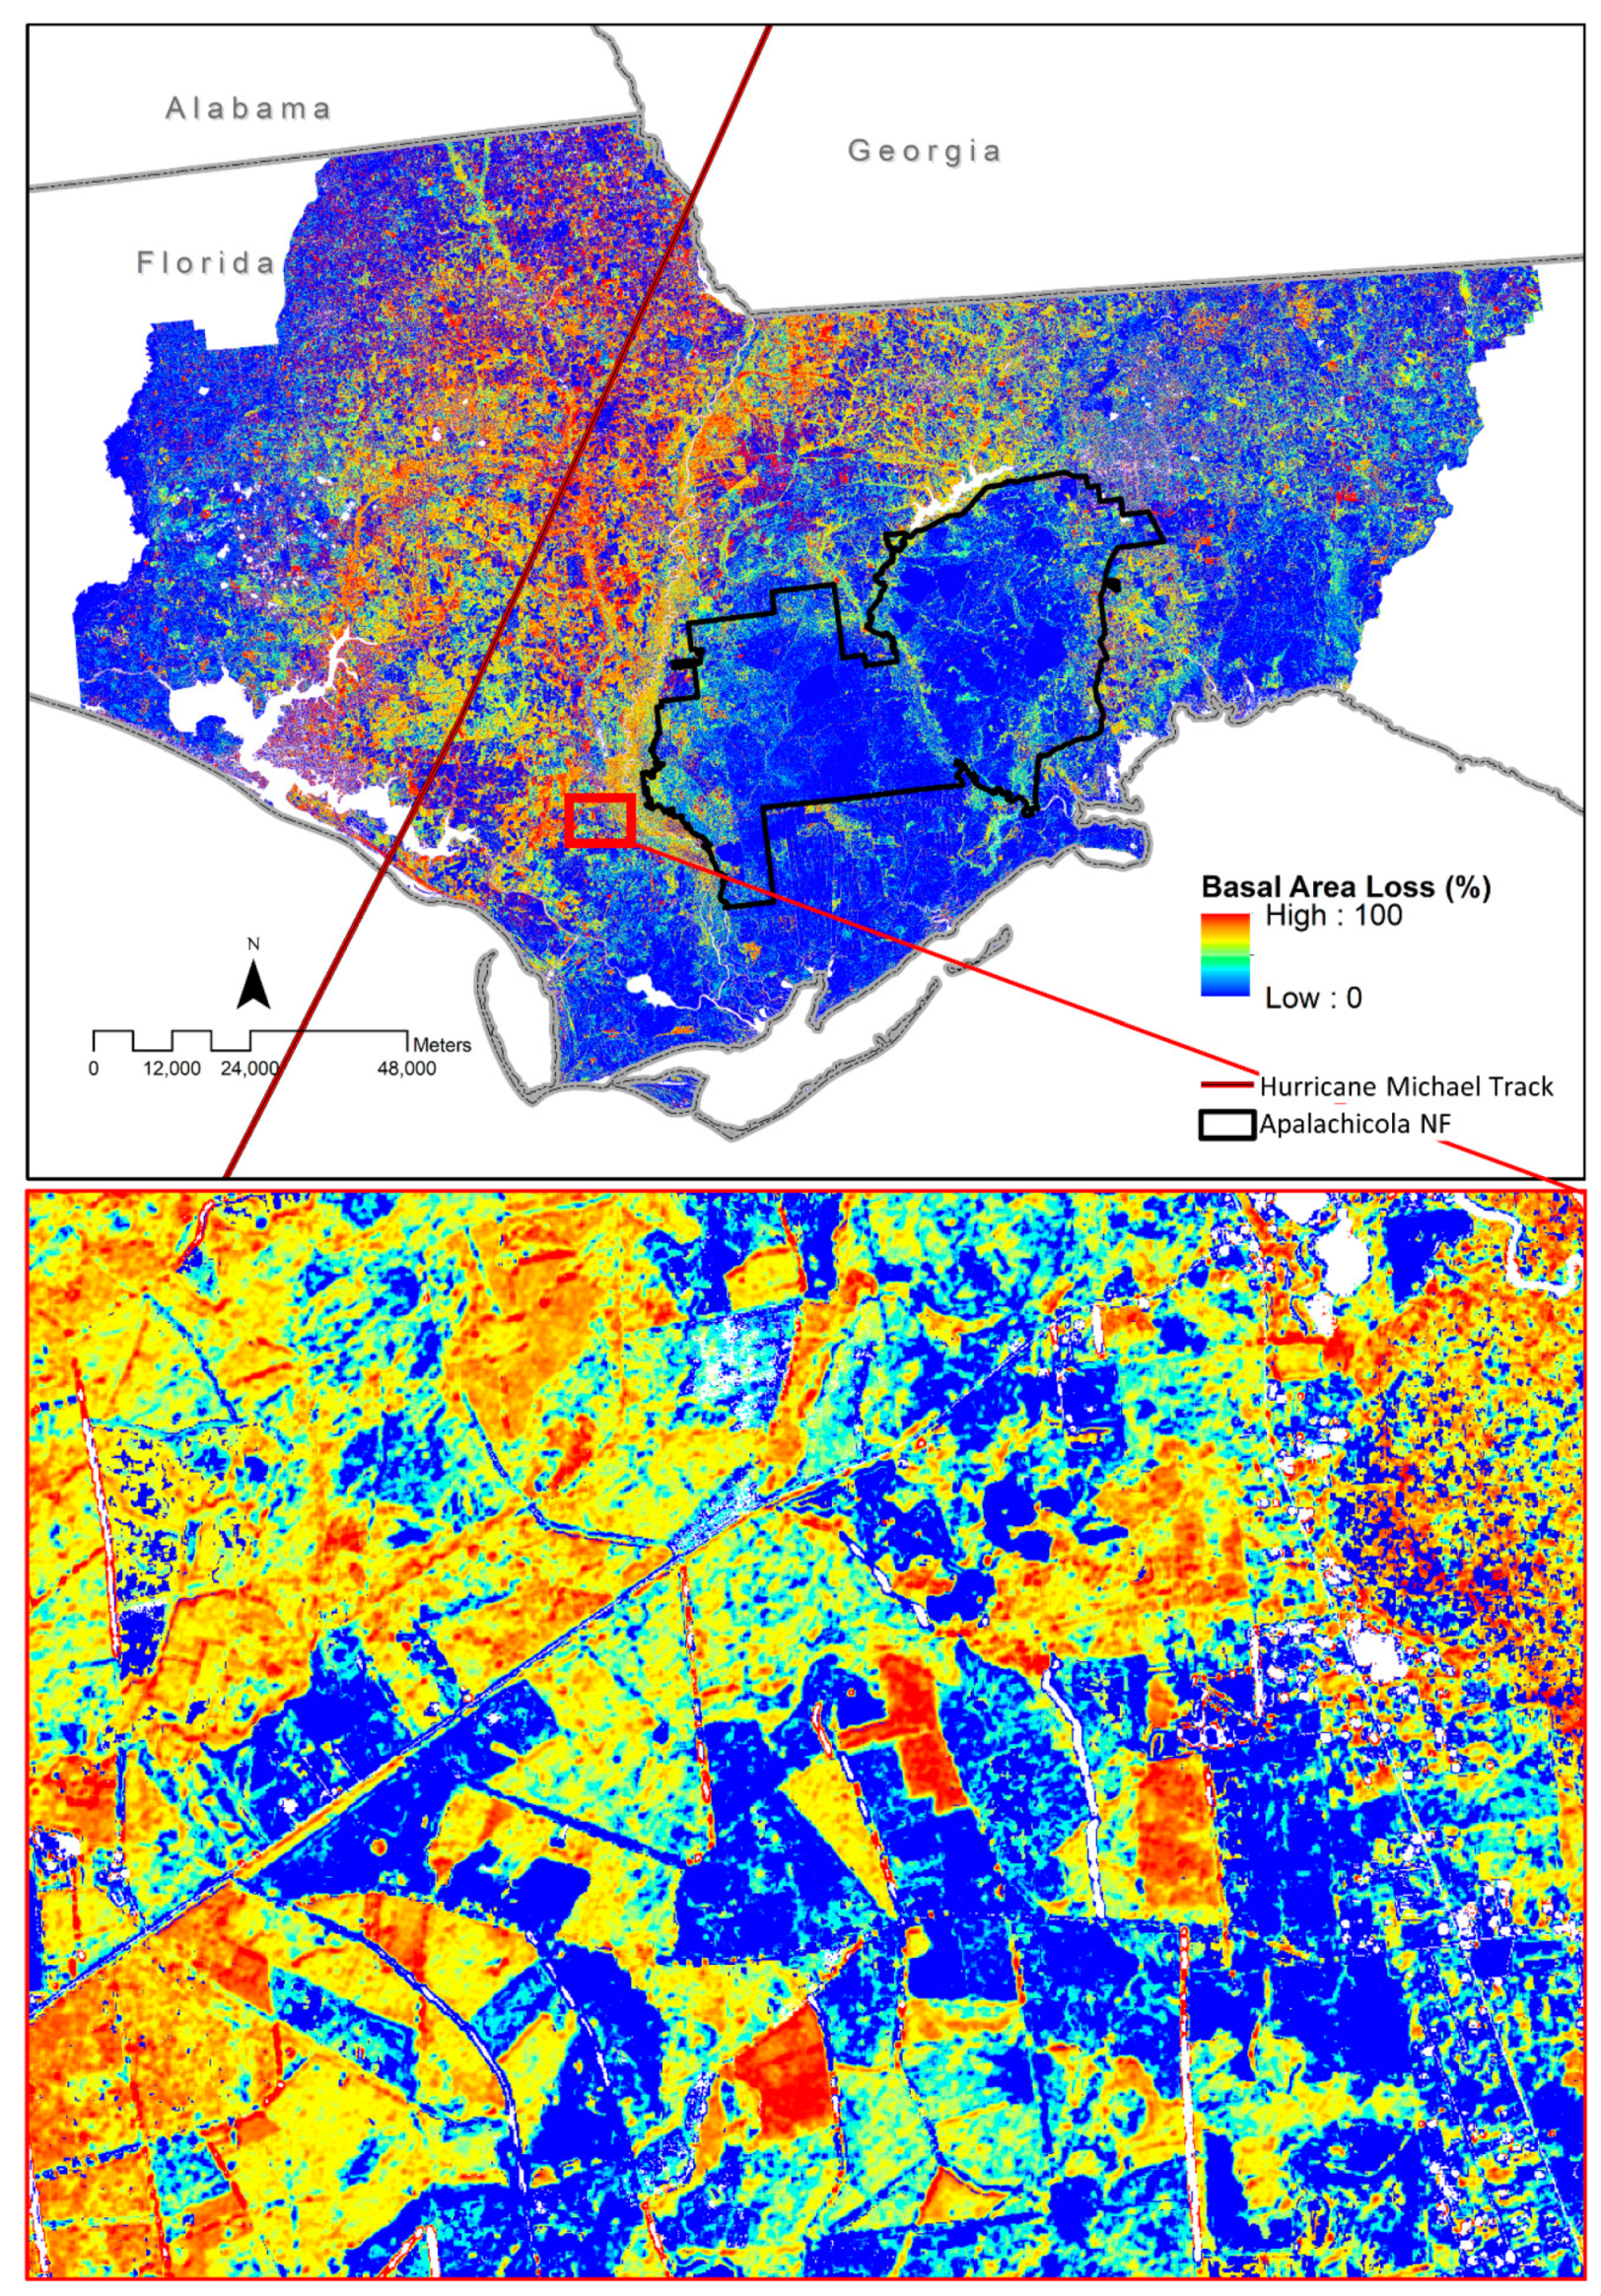
The model trended toward the global mean (Figure 5). Raster surfaces of post-hurricane BA loss (Figure 6) show heavy damage near the path of Hurricane Michael. The corridors of the Apalachicola and Chipola rivers are more heavily forested areas with more basal area, and they also show significant loss in the percent BA raster (Figure 6). Areas around Tallahassee in the north-eastern portion of the study area, and areas just north of the ANF, also showed moderate to heavy BA loss.

3.3. Spatial Basal Area Raster Results

Summaries of the post-hurricane BA loss raster for the total project area, the Apalachicola National Forest, as well as the areas that received hurricane force (119 km/h and above) and tropical storm force winds (93 to 119 km/h) are shown in Table 1. The largest percent loss of BA was found within the zone of hurricane force winds, followed by the entire project area and then the tropical storm force wind zone. Of the seventy revisited Restore plots, 55 showed light to no hurricane damage, 11 had medium damage and 4 were heavily damaged. One of the revisited plots with light damage was burned shortly before measurements were taken and was not included in our analysis. The damaged and dead tree basal area measurements from the revisited Restore plots were summarized to the plot level and subtracted from their pre-hurricane total tree basal area. From these comparisons, it was clear that of the 15 plots that showed more than light hurricane damage, the model consistently overestimated basal area loss from hurricane damage.
To compare our results with the post-hurricane plot data, we categorized modeled plot hurricane damage as Heavy (>3.72 m2 BA loss), Medium (1.4 to 3.72 m2 BA loss) or Light (<1.4 m2 BA loss). Each Restore revisit plot was categorized into one of these three categories upon inspection, while state park plots had five damage categories that included severe and no damage, which were recategorized into heavy and light, respectively. The value of the underlying pixel at the plot location was sampled from the post-hurricane BA loss raster. Table 2 is the error matrix resulting from this categorized comparison for our Restore revisit plots.
We also attempted to use the proportion of downed trees, and the basal area of downed and damaged trees to compare to our modeled results. However, as there were few damaged trees in the revisited Restore plots, we decided to use the plot categories for comparison.

4. Discussion

This study demonstrates that remotely-sensed analyses of forest disturbance impacts using forest plots can provide useful information for land managers, and illustrates potential improvements to the process. The raster outputs of forest damage after Hurricane Michael accomplish two of the three requirements of managers from remote sensing analysis following natural disasters. It covers the extent of the hurricane-affected areas, and it provides information at the spatial resolution of forest stands (10-m). Our attempts to address third requirement, i.e., that the analysis is completed within days of the natural disaster, are ongoing; however, our use of pre-hurricane plots to model structural forest changes allows for rapid analyses to take place within the framework of these methods.
As Table 2 illustrates, categorized basal area estimations and categorized post-hurricane plot damage estimates show good agreement, with medium damage being the worst performing. While we did not have enough revisited Restore plots with hurricane damage to measure the significance of basal area estimations from the few plots we had, it was apparent that the model overestimated basal area loss due to hurricane Michael. The overestimation of BA was likely caused by canopy cover loss such as tree limbs and leaves. The model built from pre-hurricane Sentinel-2 imagery would treat the spectral change from large amounts of canopy cover loss as a loss of tree BA, even if tree boles were still standing. This exaggerates the BA loss estimation in damaged areas. Additional sources of overestimation could have come from Sentinel-2 imagery registration errors between our pre- and post- hurricane scenes [33,34]. Conversely, many trees standing after the hurricane have died from mechanical damage over time, which is consistent with previous work quantifying tree mortality following hurricane disturbances. This temporal variability in tree mortality can be quantified by time incremented plot revisit surveys [35,36]. What appears as an overestimation of post-hurricane BA loss could be a prediction of BA loss over time. To quantify the mortality lag, future damage surveys should include tree-damage categories such as snapped trunks, uprooted or upright trees with quantified defoliation, and/or branches [37].
Registration errors would have the most impact in heterogenous locations such as those around urban areas or roads, since small pixel shifts in these areas would look like large changes in BA. This seems to be part of the reason for pockets of high basal area loss around Tallahassee in the northeast section of the project area. This can be mitigated by using spatial data with smaller absolute registration errors and spatial aggregation. While change in BA is a useful forest damage metric, future damage assessments could include change in canopy closure or cover which has the potential to quantify the loss of limbs and leaves due to hurricanes.
There are several mitigating factors limiting the agreement between ground truth revisited plots and BA loss estimates. Restore plots are 36-m square plots, meaning they overlap with almost 16 Sentinel-2 pixels. The current 95.5% confidence level temporal co-registration error for Sentinel-2 is 12 m, and the absolute geolocation error at a 95.5% confidence level over the time period of our images was between 10 to 16-m [25]. In addition, the GPS units used to navigate to the plot points had an error rate of around 6-m. The restore plots were not permanent installations and had to be located a second time after the hurricane, potentially adding additional horizontal error. This means that the plots and imagery may not necessarily observe the precise location. However, these co-registration errors can be mitigated with larger plot sizes or higher spatial resolution imagery [19]. The medium damage category was the least accurate across both datasets, which could have been a result of comparing subjective measures of damage with quantifiable estimates. For future studies, ground truthing models could use plot protocols that follow pre-hurricane plot measurements and are tailored for rapid assessment of a quantifiable forest metric such as canopy closure or density. Additionally, improvements could come from the reduction in imagery co-registration errors, which is anticipated for Sentinel-2 [25], or the use of higher spatial resolution remotely-sensed imagery to increase within plot observations and reduce absolute registration error rates.

5. Conclusions

Post-disturbance damage assessments from remote sensing is an important tool for informing land management decisions. The approach presented in this paper uses preexisting forest plots and freely available remotely-sensed imagery to model basal area before and after hurricane landfall. This approach can be modified so newly-acquired imagery can inform prebuilt models, allowing for the rapid assessment of forest damage following disturbances. This type of analysis should accommodate multiple imagery and data inputs at multiple spatial scales to maximize the amount of functional imagery available within days of a natural disaster [38]. We also foresee the potential to integrate other remotely-sensed imagery sources from aerial and drone-based platforms. A major consideration when integrating imagery data from multiple platforms or multiple observations will be normalization. The spectral normalization processes used in this study [29] could be used to address this concern, as it accounts for co-registrations errors that can have significant impacts upon change detection analyses, as we discussed. Future work could test the effectiveness of the process presented in [39] at minimizing the co-registration errors between images. While this study focuses on basal area as a target forest metric to quantify forest damage, we suggest including a complimentary canopy metric in future analyses. Other metrics of interest such as tree condition, tree stem and tree species loss following hurricane damage could also be estimated from ground plots and remotely-sensed imagery. This study shows that spatially quantifying forest disturbances across large areas at high resolution is not only possible, but is an efficient use of publicly available data resources and strategically placed plots. If staged properly and maintained over time, this remotely-sensed forest disturbance analysis can be implemented quickly, and can inform response and recovery operations as well as post-disturbance monitoring. The data used in this study, including field plot and the final basal area and hurricane damage rasters, are available at [40].

Author Contributions

Conceptualization, J.S.P., J.D. and P.M.; methodology, J.S.P.; software, J.S.P.; formal analysis, J.S.P., C.A.; investigation, J.S.P.; writing—original draft preparation, J.S.P.; writing—review and editing, C.A., J.D. and P.M.; supervision, J.D. and P.M.; funding acquisition, J.D. and P.M. All authors have read and agreed to the published version of the manuscript.

Funding

This project was funded by the Gulf Coast Ecosystem Restoration Council (RESTORE Council) through an interagency agreement with the USDA Forest Service (17-IA-11083150-001) for the Apalachicola Tate’s Hell Strategy 1 project.

Conflicts of Interest

The authors declare no conflict of interest.

Appendix A

Table A1. Sentinel-2 scene tile and date of image used for the two phenological mosaics pre- and post- Hurricane Michael. Normalized to column indicates which image within the mosaic was used as the reference image for spectral normalization. Mosaic order indicates which image’s values have priority in overlapping areas of the mosaic.
Pre-Hurricane Senescence
TileDateNormalized toMosaic Order
T16RFU1/30/2018 1
T16REU1/30/2018T16RFU2
T16RFV1/30/2018T16RFU3
T16RGU12/13/2017T16RFU4
T17RKP12/13/2017T16RGU5
T16RGT12/13/2017T16RFU6
T16RFT1/30/2018T16RFU7
Pre-Hurricane Growing
TileDateNormalized toMosaic Order
T16RFU4/30/2108 1
T16REU3/31/2018T16RFU2
T16RFV4/20/2018T16RFU3
T16RGU4/17/2018T16RFU4
T17RKP4/17/2018T16RGU5
T16RFT4/17/2018T16RFU6
T16RGT4/12/2018T16RFU7
Post-Hurricane Senescence
TileDateNormalized toMosaic Order
T16RFU1/25/2019 1
T16REU1/10/2019T16RFU2
T16RFV1/10/2019T16RFU3
T17RKP12/23/2018T16RGU4
T16RGU1/7/2019T16RFU5
T16RGT1/17/2019T16RFU6
T16RFT1/10/2019T16RFU7
Post-Hurricane Growing
TileDateNormalized toMosaic Order
T16RFU4/15/2019 1
T16REU4/15/2019T16RFU2
T16RFV4/15/2019T16RFU3
T16RGU3/23/2019T16RFU4
T17RKP3/23/2019T16RGU5
T16RFT4/15/2019T16RFU6
T16RGT3/23/2019T16RFU7

References

  1. Beven, J.L., II; Berg, R.; Hagen, A. Hurricane Michael. National Hurricane Center Tropical Cyclone Report. 2019. Available online: https://www.nhc.noaa.gov/data/tcr/AL142018_Michael.pdf (accessed on 2 September 2019).
  2. Zampieri, N.E.; Pau, S.; Okamoto, D.K. The impact of Hurricane Michael on longleaf pine habitats in Florida. bioRxiv Preprints 2019, 1–21. [Google Scholar] [CrossRef] [Green Version]
  3. Bender, M.A.; Knutson, T.R.; Tuleya, R.E.; Sirutis, J.J.; Vecchi, G.A.; Garner, S.T.; Held, I.M. Modeled Impact of Anthropogenic Warming on the Frequency of Intense Atlantic Hurricanes. Science 2010, 327, 454–458. [Google Scholar] [CrossRef] [PubMed] [Green Version]
  4. Seidl, R.; Thom, D.; Kautz, M.; Martin-Benito, D.; Peltoniemi, M.; Vacchiano, G.; Wild, J.; Ascoli, D.; Petr, M.; Honkaniemi, J.; et al. Forest disturbance under climate change. Nat. Clim. Chang. 2017, 7, 395–402. [Google Scholar] [CrossRef] [PubMed] [Green Version]
  5. Dale, V.H.; Joyce, L.A.; McNulty, S.; Neilson, R.P.; Ayres, M.P.; Flannigan, M.D.; Wotton, B.M. Climate Change and Forest Disturbances: Climate change can affect forests by altering the frequency, intensity, duration, and timing of fire, drought, introduced species, insect and pathogen outbreaks, hurricanes, windstorms, ice storms, or landslides. BioScience 2001, 51, 723–734. [Google Scholar] [CrossRef] [Green Version]
  6. Wang, W.; Qu, J.J.; Hao, X.; Liu, Y.; Stanturf, J.A. Post-hurricane forest damage assessment using satellite remote sensing. Agric. For. Meteorol. 2010, 150, 122–132. [Google Scholar] [CrossRef]
  7. Hu, T.; Smith, R.B. The Impact of Hurricane Maria on the Vegetation of Dominica and Puerto Rico Using Multispectral Remote Sensing. Remote Sens. 2018, 10, 827. [Google Scholar] [CrossRef] [Green Version]
  8. Lee, M.-F.; Lin, T.-C.; Vadeboncoeur, M.A.; Hwong, J.-L. Remote sensing assessment of foret damage in relation to the 1996 strong typhoon Herb at Lienhuachi Experimental Forest, Taiwan. For. Ecol. Manag. 2008, 255, 3297–3306. [Google Scholar] [CrossRef]
  9. Parker, G.; Martínez-Yrízar, A.; Álvarez-Yépiz, J.C.; Maass, M.; Araiza, S. Effects of hurricane distrubance on a tropical dry forest canopy in western Mexico. For. Ecol. Manag. 2018, 426, 39–52. [Google Scholar] [CrossRef]
  10. Ramsey, E.W., III; Hodgson, M.E.; Sapkota, S.K.; Nelson, G.A. Forest impact estimated with NOAA AVHRR and Landsat TM data related to an empirical hurricane wind-field distribution. Remote Sens. Environ. 2001, 77, 279–292. [Google Scholar] [CrossRef] [Green Version]
  11. Rossi, E.; Rogan, J.; Schneider, L. Mapping forest damage in northern Nicaragua after Hurricane Felix (2007) using MODIS enhanced vegetation index data. GISci. Remote Sens. 2013, 50, 385–399. [Google Scholar] [CrossRef]
  12. Zhang, X.; Friedl, M.A.; Schaaf, C.B.; Strahler, A.H.; Hodges, J.C.; Gao, F.; Huete, A. Monitoring vegetation phenology using MODIS. Remote Sens. Environ. 2003, 84, 471–475. [Google Scholar] [CrossRef]
  13. Chambers, J.Q.; Fisher, J.I.; Zeng, H.; Chapman, E.L.; Baker, D.B.; Hurtt, G.C. Hurricane Katrina’s Carbon Footprint on U.S. Gulf Coast Forests. Science 2007, 318, 1107. [Google Scholar] [CrossRef] [PubMed] [Green Version]
  14. Negrón-Juárez, R.; Baker, D.B.; Chambers, J.Q.; Hurtt, G.C.; Goosem, S. Multi-scale sensitivity of Landsat and MODIS to forest distrubance associated with tropical cyclones. Remote Sens. Environ. 2014, 140, 679–689. [Google Scholar] [CrossRef]
  15. Aosier, B.; Kaneko, M.; Takada, M. Evaluation of The Forest Damage by Typhoon Using Remote Sensing Technique. In Proceedings of the 2007 IEEE International Geoscience and Remote Sensing Symposium, Barcelona, Spain, 23–28 July 2007; IEEE: Piscataway, NJ, USA, 2007; pp. 3022–3026. [Google Scholar] [CrossRef]
  16. Hodgson, M.E.; Davis, B.A.; Cheng, Y.; Miller, J. Modeling Remote Sensing Satellite Collection Opportunity Likelihood for Hurricane Disaster Response. Cartogr. Geogr. Inf. Sci. 2010, 37, 7–15. [Google Scholar] [CrossRef]
  17. Hogland, J.; Anderson, N.; Affleck, D.L.; St. Peter, J. Using Forest Inventory Data with Landsat 8 Imagery to Map Longleaf Pine Forest Characteristics in Georgia, USA. Remote Sens. 2019, 11, 1803. [Google Scholar] [CrossRef] [Green Version]
  18. Hogland, J.; Anderson, N.; St. Peter, J.; Drake, J.; Medley, P. Mapping Forest Characteristics at Fine Resolution across Large Landscapes of the Southeastern United States Using NAIP Imagery and FIA Field Plot Data. Int. J. Geo-Inf. 2018, 7, 140. [Google Scholar] [CrossRef] [Green Version]
  19. Hogland, J.; Affleck, D.L. Mitigating the Impact of Field and Image Registration Errors through Spatial Aggregation. Remote Sens. 2019, 11, 222. [Google Scholar] [CrossRef] [Green Version]
  20. Flynn, D.F.; Uriarte, M.; Crk, T.; Pascarella, J.B.; Zimmerman, J.K.; Aide, T.M.; Caraballo Ortiz, M.A. Hurricane Disturbance Alters Secondary Forest Recovery in Puerto Rico. Biotropica 2010, 42, 149–157. [Google Scholar] [CrossRef]
  21. Stein, B.A.; Kutner, L.S.; Adams, J.S. Precious Heritage: The Status of Biodiversity in the United States; Oxford University Press: New York, NY, USA, 2000. [Google Scholar]
  22. Noss, R.F. The longleaf pine landscape of the Southeast: Almost gone and almost forgotten. Endanger. Species Update 1988, 5, 55. [Google Scholar]
  23. Noss, R.F. Longleaf pine and wiregrass: Keystone components of an endangered Ecosystem. Nat. Areas J. 1989, 9, 211–213. [Google Scholar]
  24. Florida Natural Areas Inventory 2004. Natural Communities and Habitats. Forested Wetlands. ARROW. Available online: https://www.fnai.org/ARROW/Almanac/biology/biology_wetlands.cfm (accessed on 16 September 2019).
  25. Clerc, S.; Team, M. Sentinel-2 Data Quality Report, Technical Report 44, S2-PDGS-MPC-DQR. France: ESA-CS. 2019. Available online: https://sentinel.esa.int/documents/247904/685211/Sentinel-2_L1C_Data_Quality_Report (accessed on 20 November 2019).
  26. Gascon, F.; Bouzinac, C.; Thépaut, O.; Jung, M.; Francesconi, B.; Louis, J.; Fernandez, V. Copernicus Sentinel-2A Calibration and Products Validation Status. Remote Sens. 2017, 9, 584. [Google Scholar] [CrossRef] [Green Version]
  27. U.S. Geological Survey. Earth Explorer. Available online: https://earthexplorer.usgs.gov (accessed on 16 February 2019).
  28. National Hurricane Center. NHC Data Archive. Available online: https://www.nhc.noaa.gov/data/ (accessed on 4 March 2019).
  29. Hogland, J. Creating Spatial Probability Distributions for Longleaf Pine Ecosystems Across East Mississippi, Alabama, The Panhandle of Florida and West Georgia. Master’s Thesis, Auburn University, Auburn, AL, USA, 2005. [Google Scholar]
  30. R Core Team. R: A Language and Environment for Statistical Computing; R Foundation for Statistical Computing: Vienna, Austria, 2019; Available online: www.R-project.org (accessed on 21 January 2019).
  31. U.S. Forest Service, Rocky Mountain Research Station. RMRS Raster Utility. Available online: http://www.fs.fed.us/rm/raster-utility (accessed on 16 February 2019).
  32. St. Peter, J.; Hogland, J.; Anderson, N.; Drake, J.; Medley, P. Fine resolution probabilistic land cover classification of landscapes in the southeastern United States. ISPRS Int. J. Geo-Inf. 2018, 7, 107. [Google Scholar] [CrossRef] [Green Version]
  33. Coulter, L.L.; Stow, D.A. Assessment of the Spatial Co-registration of Multitemporal Imagery from Large Format Digital Cameras in the Context of Detailed Change Detection. Sensors 2008, 8, 2161–2173. [Google Scholar] [CrossRef] [PubMed] [Green Version]
  34. Eastman, R.D.; Le Moigne, J.; Netanyahu, N.S. Research issues in image registration for remote sensing. In Proceedings of the 2007 IEEE Conference on Computer Vision and Pattern Recognition, Minneapolis, MN, USA, 17–22 June 2007; IEEE: Piscataway, NJ, USA, 2007. [Google Scholar] [CrossRef] [Green Version]
  35. Walker, L.R. Timing of post-hurricane tree mortality in Puerto Rico. J. Trop. Ecol. 1995, 11, 315–320. [Google Scholar] [CrossRef]
  36. Everham, E.M.; Brokaw, N.V.L. Forest damage and recovery from catastrophic wind. Bot. Rev. 1996, 62, 113–185. [Google Scholar] [CrossRef]
  37. Henkel, T.K.; Chambers, J.Q.; Baker, D.A. Delayed tree mortality and Chinese tallow (Triadica sebifera) population expolosion in a Louisiana bottomland hardwood forest following Hurricane Katrina. For. Ecol. Manag. 2016, 15, 222–232. [Google Scholar] [CrossRef] [Green Version]
  38. Liu, S.; Hodgson, M.E. Optimizing large area coverage from multiple satellite-sensors. GISci. Remote Sens. 2013, 50, 652–666. [Google Scholar] [CrossRef]
  39. Scheffler, D.; Hollstein, A.; Diedrich, H.; Segl, K.; Hostert, P. AROSICS: An Automated and Robust Open-Source Image Co-Registration Software for Multi-Sensor Satellite Data. Remote Sens. 2017, 9, 676. [Google Scholar] [CrossRef] [Green Version]
  40. St. Peter, J.; Anderson, C.; Drake, J.; Medley, P. Spatially Quantifying Forest Damage from a Category 5 Hurricane, v2, Dryad, Dataset. 2019. Available online: https://doi.org/10.5061/dryad.905qfttgc (accessed on 17 December 2019).
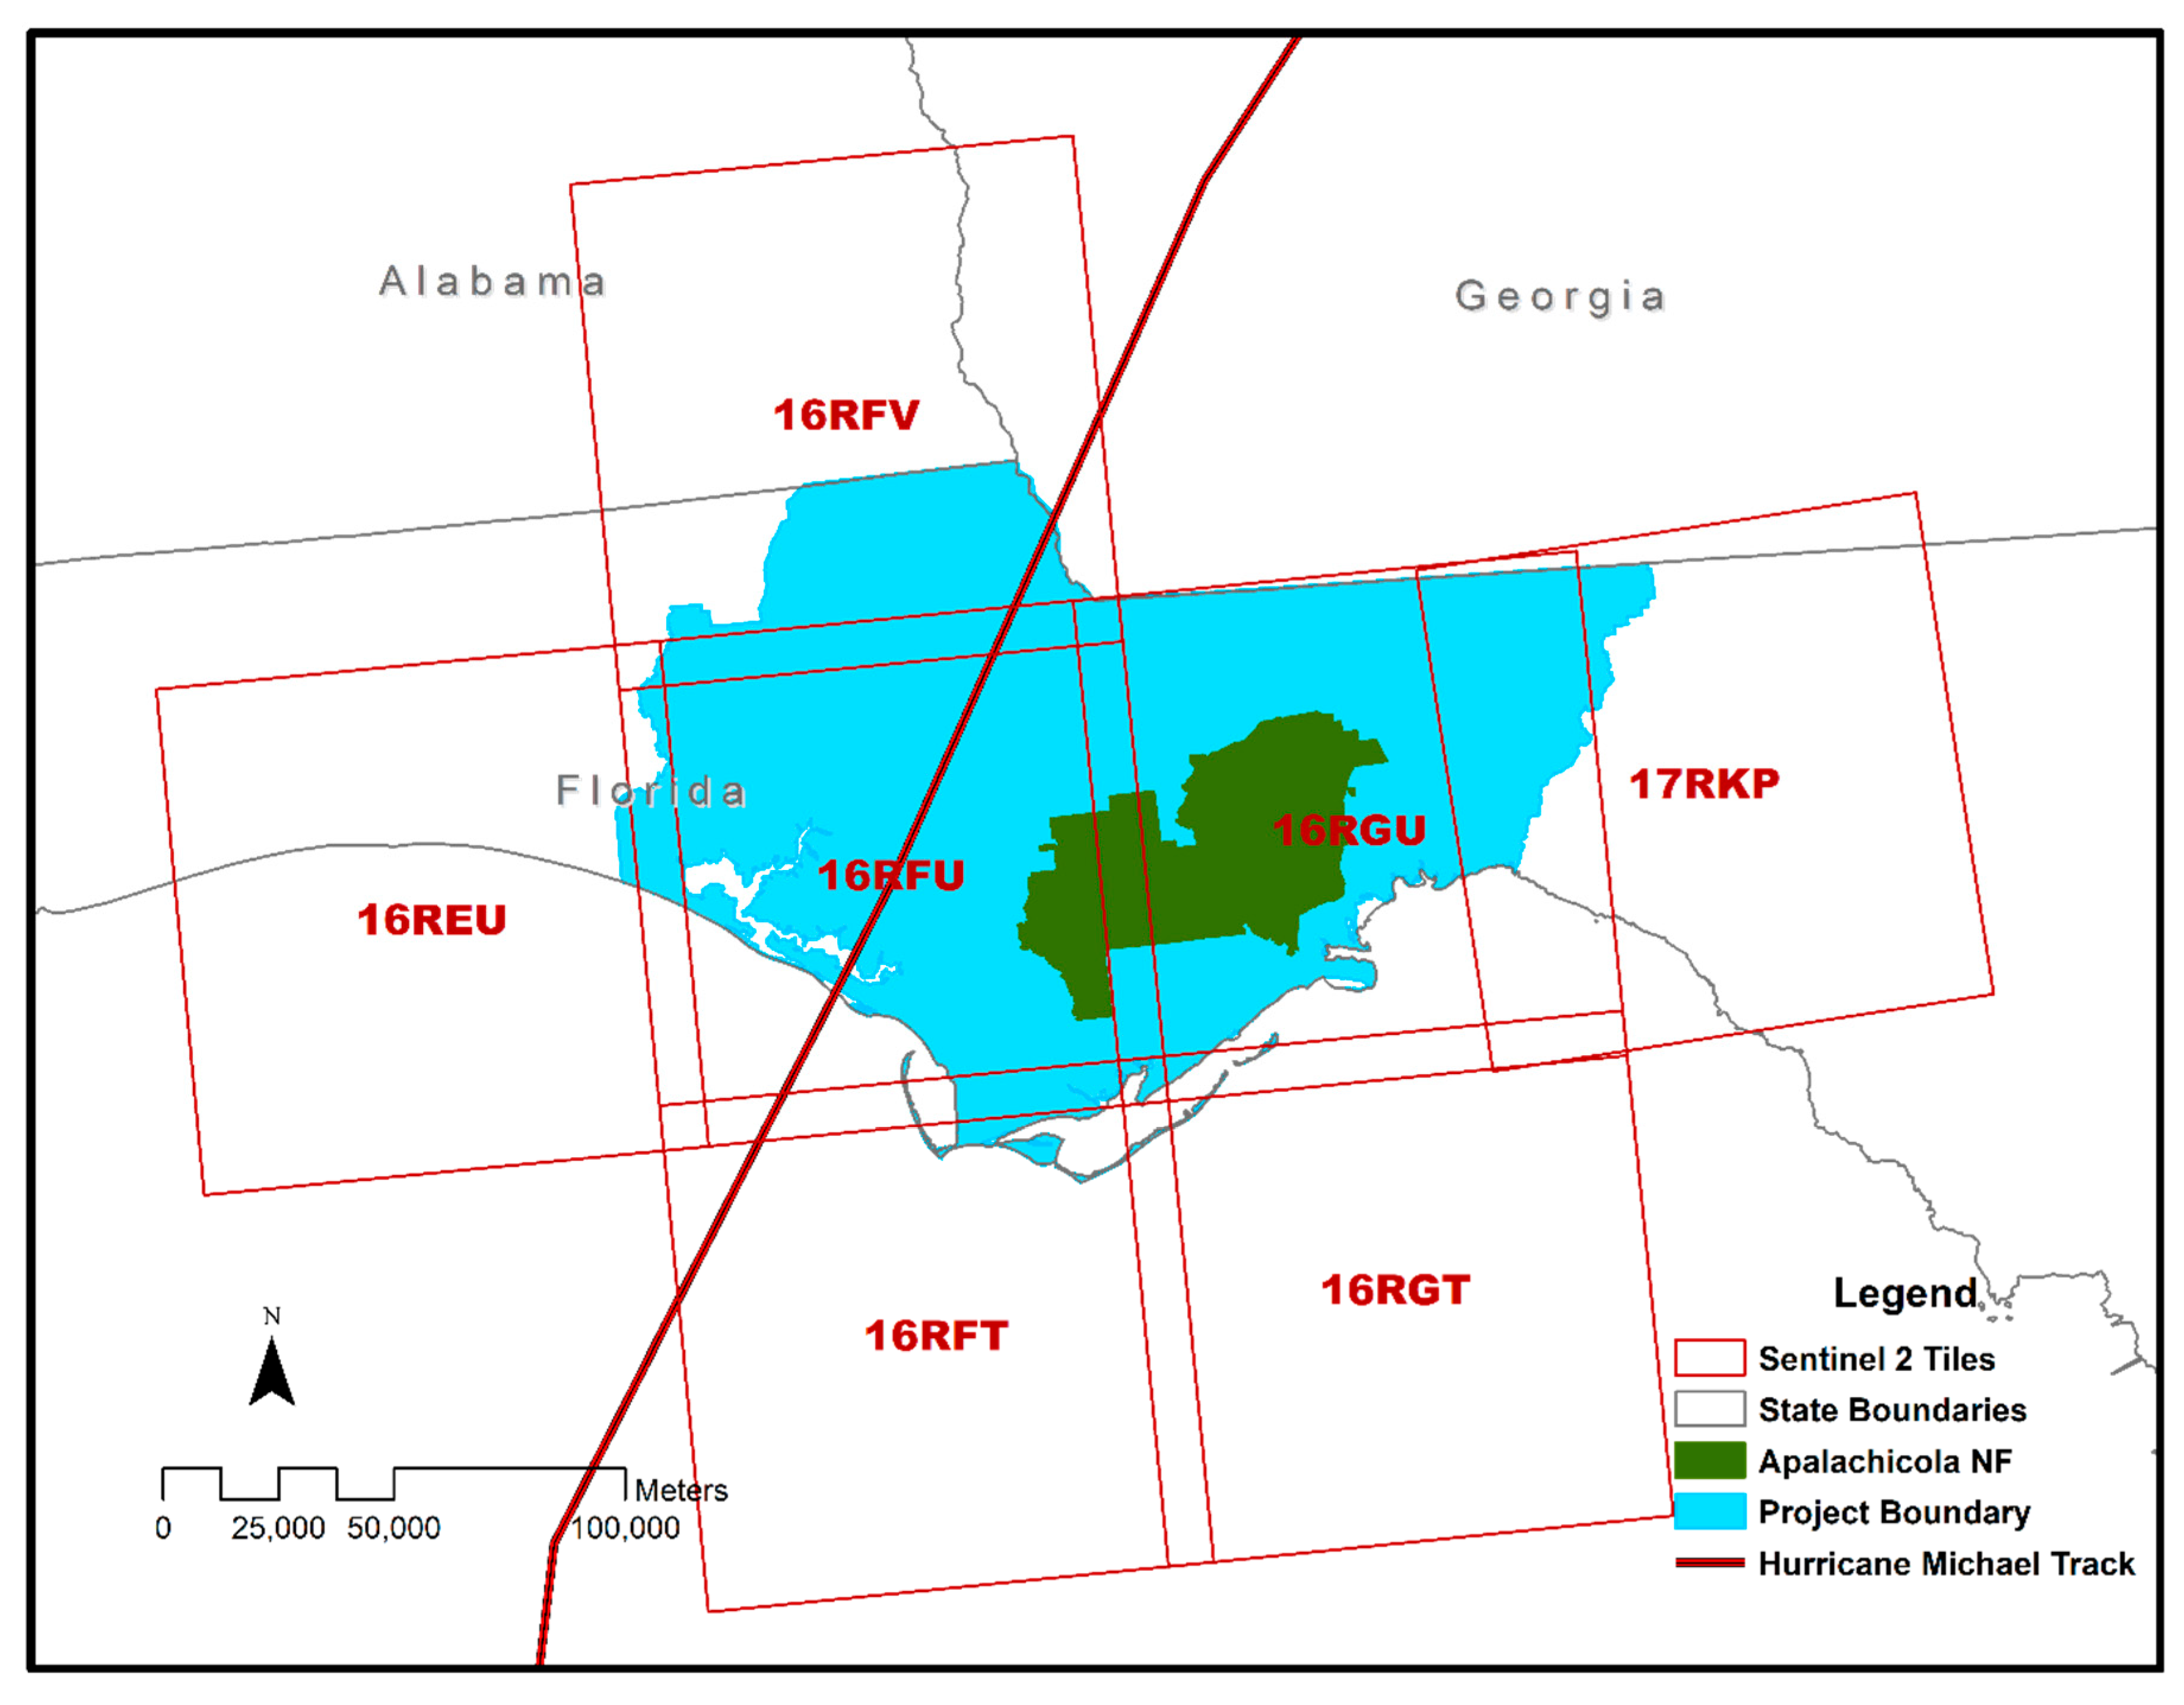
Figure 1. Project study area and Apalachicola National Forest are in solid colors while the extent of Sentinel-2 scenes used in the project are outlined in red and labeled.
Remotesensing 12 01138 g001
Figure 2. Restore plots and revisited plot locations within the study area. Hurricane Michael storm track and wind swath with categorized wind speeds are shown for reference.
Remotesensing 12 01138 g002
Figure 3. Comparison of mosaiced and spectrally normalized Sentinel-2 true-color images from the senescence time period before (A) and after (B) hurricane Michael. The seven Sentinel-2 images used in the pre-Hurricane time period (A) were observed on Dec. 13, 2017 and January 30, 2018. The post-Hurricane images were observed December 23, 2018 and January 7th, 10th, 17th and 25th, 2019. The full list of image dates, mosaic order and normalized results are listed in Appendix A.
Remotesensing 12 01138 g003
Figure 4. Flowchart of our imagery preprocessing and modeling steps including the principal component analysis (PCA) to reduce predictive variable dimensionality, softmax neural network of tree presence model and the general linear model estimating basal area.
Remotesensing 12 01138 g004
Figure 5. Estimated versus observed basal area at pre-hurricane plots. Generalized additive model trend line with 95% confidence interval shown for clarity.
Remotesensing 12 01138 g005
Figure 6. Spatial estimates of relative basal area loss after Hurricane Michael in the project area, with inset map. Blue pixels represent no estimated basal area loss. These pixels in the inset map and near the path of the hurricane were non-forested areas that were masked out using our tree presence model.
Remotesensing 12 01138 g006
Table 1. Basal area loss estimates for the project area, the Apalachicola National Forest (ANF) as well as the areas that experienced hurricane force and tropical storm force winds.
Area Size (Hectares)Avg. BA Loss (m2/hectare)95% CI (m2/hectare)Total BA Loss (m2)95% CI (m2)Percent BA Loss
Project Area1,900,77373.263.7-82.67,328,6406,383,549 - 8,273,73119.18%
ANF254,19929.325.5-33.1392,204341,626 - 442,7827.67%
Hurricane1,146,40590.078.4-101.65,435,2444,734,323 - 6,136,16528.01%
Tropical Storm674,43446.640.6-52.71,657,6591,443,890 - 1,871,42813.16%
Table 2. Error matrix of categorized hurricane damage at revisited Restore plot locations. Ground observations are the reference, while basal area model estimates are predicted.
Reference
PredictedHeavyMediumLight
Heavy352
Medium127
Light0445
Accuracy0.72