Article

Assessment and Comparison of Broadcast Ionospheric Models: NTCM-BC, BDGIM, and Klobuchar

GNSS Research Center, Wuhan University, No. 129 Luoyu Road, Wuhan 430079, China
*
Author to whom correspondence should be addressed.
Remote Sens. 2020, 12(7), 1215; https://doi.org/10.3390/rs12071215
Submission received: 17 March 2020 / Revised: 29 March 2020 / Accepted: 30 March 2020 / Published: 9 April 2020

Abstract

:
For single-frequency Global Navigation Satellite Systems (GNSSs) users, ionospheric delay is the main error source affecting the accuracy of positioning. Applying a broadcast ionospheric correction model to mitigate the ionospheric delay is essential for meter-to-decimeter-level accuracy positioning. To provide support for real-time single-frequency operations, particularly in the China area, we assessed the performance of three broadcast ionospheric correction models, namely, the Neustrelitz total electron content (TEC) broadcast model (NTCM-BC), the BeiDou global broadcast ionospheric delay correction model (BDGIM), and the Klobuchar model. In this study, the broadcast coefficients of Klobuchar and BDGIM are obtained from the navigation data files directly. Two sets of coefficients of NTCM-BC for China and global areas are estimated. The slant total electron contents (STEC) data from more than 80 validation stations and the final vertical TEC (VTEC) data of the Center for Orbit Determination in Europe (CODE) are used as independent benchmarks for comparison. Compared to GPS STEC during the period of Day of Year (DOY) 101~199, 2019, the ionospheric correction ratio of NTCM-BC, BDGIM, and Klobuchar are 79.4%, 64.9%, and 57.7% in China, respectively. For the global area, the root-mean-square (RMS) errors of these three models are 3.67 TECU (1 TECU = 1016 electrons/m2), 5.48 TECU, and 8.92 TECU, respectively. Compared to CODE VTEC in the same period, NTCM-BC, BDGIM, and Klobuchar can correct 72.6%, 69.8%, and 61.7% of ionospheric delay, respectively. Hence, NTCM-BC is recommended for use as the broadcast ionospheric model for the new-generation BeiDou satellite navigation system (BDS) and its satellite-based augmentation system.

Graphical Abstract

1. Introduction

Global Navigation Satellite Systems (GNSSs) mainly utilize radio waves to realize navigation, positioning, timing, and other functions. Due to the physical nature of radio waves, satellite signals are affected by ionizing substances in the process of propagation, resulting in ionospheric delay. The maximum impact of this delay can reach 100 m in the range domain, and it substantially limits the applications of GNSSs [1]. Therefore, it is necessary to mitigate or remove this error. Since ionospheric refraction is related to frequency, the propagation delay can be largely eliminated by a linear combination of the dual-frequency carrier or pseudorange measurements. However, there are a large number of single-frequency receivers, such as smartphones, tablets, and other low-cost equipments, which require suitable ionospheric models to mitigate the propagation error.
At present, different broadcast ionospheric models are used in GNSSs. The GPS adopts an eight-parameter ionospheric algorithm named Klobuchar [2], the correction parameters of which are calculated by the GPS control segment and are uploaded to the GPS satellite vehicles (SVs) for broadcasting in the navigation message. The Klobuchar model is a third-order polynomial function depending on local time (LT) and geomagnetic latitude. It is generally assumed that the Klobuchar model can reduce the ionospheric range error by 50% [1]. Because of its simplicity, it is widely used in the GNSSs single-frequency mass market. Meanwhile, the European Galileo system uses a three-dimension model known as NeQuick, which is developed by the International Center for Theoretical Physics (ICTP) at the Trieste and the University of Graz [3,4,5]. The Galileo single-frequency operations can use three correction coefficients, which are transmitted as a part of the Galileo navigation message to compute the ionospheric electron density along the ground-to-satellite propagation path. As for the BeiDou satellite navigation system (BDS), the regional BeiDou (BDS-2) broadcasts eight parameters and uses a slightly modified Klobuchar model (BDSKlobuchar) to calculate ionospheric delay. It is almost the same as the Klobuchar model except for the reference frame and the update frequency of parameters. BDS has launched the new generation of satellites (BDS-3) since 2017. The new satellites apply new navigation signals and technologies to provide global service. Moreover, a global broadcast ionospheric TEC model is applied. This model originated from the Institute of Geodesy and Geophysics Spherical Harmonic model (IGGSH), and it was eventually named the BeiDou global broadcast ionospheric delay correction model (BDGIM) in the space interface control document (ICD) of BDS [6]. The parameters of BDGIM include two parts, i.e., the nine broadcast parameters transmitted by BDS SVs, and the 17 non-broadcast constant parameters explained in Section 2.2.
In the past 20 years, Jakowski et al., at the Institute of Communications and Navigation, German Aerospace Center in Neustrelitz, have developed various Neustrelitz TEC models, named NTCM [7], which takes into account factors such as time variations, geomagnetic coordinates, ionization crest, and solar activity. In 2011, Hoque and Jakowski [7] proposed a 12-parameter empirical global TEC model (NTCM-GL) driven only by a quantitative index of solar activity (F10.7 index). Recently, they simplified the 12-parameter NTCM-GL and proposed a nine-parameter model, named NTCM-BC. Compared with NTCM-GL, the NTCM-BC coefficients need to be updated every day. Hoque et al. believe that this will be an alternative solution correcting the ionospheric error for the next-generation GNSSs [7,8,9].
Many scholars have evaluated the performance of ionospheric delay correction models. Bidaine et al. investigated the accuracy of NeQuick G and Klobuchar; the statistics exhibited that NeQuick G could reduce the ionospheric range error by 60%~70% and performed better than the Klobuchar model [10]. Zhang et al. evaluated the performance of NTCM-BC and proposed a new NTCM-BC (MNTCM-BC) by revising the equation describing ionospheric low latitude anomalies. The MNTCM-BC could improve positioning accuracy by 30% compared with the Klobuchar model [11]. Wu et al. found that BDSKlobuchar could improve the positioning accuracy by 7.8%~35.5% than Klobuchar in Northern Hemisphere regions [12].
The above studies mainly assess the performances of the broadcast ionospheric models of Galileo, GPS, and BDS-2, and slight attention has been conducted for BDS-3′s BDGIM, evenly compared with NTCM-BC. Yuan et al. presented a preliminary evaluation of BDGIM based on their own fitted model parameters instead of those true-world parameters broadcasted via BDS-3 SVs [13]. Although Hoque et al. argue that NTCM-BC is an alternative solution for the next-generation GNSSs, its superiority with respect to BDGIM for the global BDS-3 satellites as well as its augmentation service around China have not been validated. Thus, it is of interest to perform an assessment of BDGIM, Klobuchar, and NTCM-BC in one study for analyzing regional and global performance.
In this paper, we take two independent reference values to evaluate the performance of the ionospheric models, the real slant total electron contents (STEC) calculated by the observation data from the International GNSSs Service (IGS) and the Crust Movement Observation Network of China (CMONOC) (GPS STEC), and the vertical TEC (VTEC) from the Center for Orbit Determination in Europe (CODE) grid products (CODE VTEC). At the same time, we build two NTCM-BC models with the regional and global station data and make a comprehensive comparison and evaluation with Klobuchar and BDGIM, aiming to seek a better model for BDS and its augmentation system.
The structure of this study is as follows. After a brief introduction about the algorithms of Klobuchar, BDGIM, and NTCM-BC, the data processing strategy and the validation metrics are presented. Following that, the performance of those models is listed and analyzed. Finally, the conclusions and discussion are presented.

2. Ionospheric Models

2.1. Klobuchar Model

The daily vertical time delay in Klobuchar is represented by the cosine function with changing period and amplitude plus a constant value, which is set to 5 ns at night. According to the analysis of numerous data, the initial phase of the cosine term is set to 14:00 LT. The period and amplitude of the cosine term are third-order polynomials of geomagnetic latitude. The Klobuchar model reflects the characteristics of ionospheric diurnal variation and essentially ensures the accuracy of ionospheric prediction. The vertical ionospheric error of GPS L1 frequency Δ τ is expressed as follows:
Δ τ = { D + A cos ( 2 π ( t T P ) P ) , | t T p | < P 4 D , o t h e r s
where D = 5 × 10 9 s . P and A represent the period and amplitude, respectively. Their expressions are as follows:
A = { i = 1 4 α i ( φ m ) i , A > 0 0 , A 0 P = { i = 1 4 β i ( φ m ) i , P > 72,000 72,000 , P 72,000
where α i and β i are the eight parameters broadcast by satellites. φ m represents the geomagnetic latitude of the Ionospheric Pierce Point (IPP) calculated with the thin layer height of 350 km. To compute the slant time delay, Klobuchar uses a mapping function as follows:
M F = 1.0 + 16.0 × ( 0.53 e l ) 3
where e l is the elevation angle of the satellite divided by π or 180° (in semicircles).

2.2. BDGIM

As a function describing the physical quantities of global changes, spherical harmonic (SH) function has excellent mathematical structure and is one of the main functional models describing the ionospheric TEC on the global scale. Based on an improved spherical harmonic function, BDGIM is proposed, including broadcast and non-broadcast parts. Limited by the communication capacity of satellites, nine SH coefficients describing the majority of ionospheric VTEC are selected and broadcasted to receivers via BDS SVs. Moreover, a total of seventeen non-broadcast coefficients are selected from the remaining SH coefficients to improve the modeling accuracy further. The specific expression of BDGIM is given by:
V T E C = i = 1 9 α i A i + j = 1 17 β j B j
where V T E C is the vertical TEC, α i are the nine parameters broadcasted by BDS-3 satellites. β j is the seventeen non-broadcast parameters obtained from empirical analysis. The expression of A i is as follows:
A i = { N | n i | , | m i | P | n i | , | m i | ( sin φ ) · cos ( m i · λ ) m i 0 N | n i | , | m i | P | n i | , | m i | ( sin φ ) · sin ( m i · λ ) m i < 0
where P | n i | , | m i | is the standard Legendre function of degree n and order m ( n = 0 to 2, m = −2 to 1), φ and λ denote the geomagnetic latitude and longitude of the IPP based on the solar fixed coordinate system, respectively. N n i , m i is the normalization function, as follows:
{ N n , m = ( n m ) ! ( 2 n + 1 ) · ( 2 δ 0 , m ) ( n + m ) ! δ 0 , m = { 1 , m = 0 0 , m > 0 }
One thing to note here is that B j and A i have the same calculation equation. B j ( j = 1~17) is the predicted SH coefficients, which are expressed as follows:
{ β j = a 0 , j + k = 1 12 ( a k , j · cos ( ω k · t p ) + b k , j · sin ( ω k · t p ) ) ω k = 2 π T k
where a 0 , j a k , j and b k , j are the non-broadcast parameters of BDGIM, the values of which can be seen in BDS ICD [6], T k is the period for each non-broadcast coefficient, and T p denotes the odd hour of the one day (01:00:00, 03:00:00, 05:00:00,…, 23:00:00 in Modified Julian Date (MJD)) [6]. For calculation, the users should select the t p that is closest to the time of the current epoch.

2.3. NTCM-BC

The NTCM global or regional models are widely used in receiver’s and satellite’s hardware bias computation, TEC calibration, as well as background model for grid vertical delay estimation. NTCM-BC is one of the simplest versions of the NTCM models. The equation of the NTCM-BC is as follows:
TEC model vert = F 1 · F 2 · F 3 ( TECU )
where F 1 is the equation of variation with local time, F 2 is the geomagnetic latitude equation, and F 3 is the equation describing the ionization peaks of low-latitude anomaly areas. F 1 includes three harmonic components: diurnal ( V D ), semidiurnal( V S D ) and ter-diurnal( V T D ), which are given by:
F 1 = cos χ * * * + cos χ * * ( c 1 cos V D + c 2 cos V S D + c 3 sin V S D + c 4 cos V T D + c 5 sin V T D )
V D = 2 π ( L T 14 ) 24 V S D = 2 π · L T 12 V T D = 2 π · L T 8
cos χ * * = cos ( φ δ ) 2 π · φ · sin δ cos χ * * * = cos ( φ δ ) + 0.4
where cos χ * * and cos χ * * * denote the TEC dependency on the solar zenith angle χ ; φ and δ are the geographic latitude and the declination of the sun (all angles in radians), respectively. L T denotes the local time.
F 2 = 1 + c 6 cos φ m
where φ m denotes the geomagnetic latitude.
F 3 = c 7 + c 8 exp ( E C 1 ) + c 9 exp ( E C 2 )
E C 1 = ( φ m φ c 1 ) 2 2 σ c 1 2 E C 2 = ( φ m φ c 2 ) 2 2 σ c 2 2
where φ c 1 = 16 N and φ c 2 = 10 S are the position of the northward and southward peaks, respectively. σ c 1 = 12 and σ c 2 = 13 represent the corresponding Gaussian half-widths, respectively.
Both BDGIM and NTCM-BC utilize the mapping function M F for converting VTEC to STEC. The expression of M F is given by:
M F = 1 1 ( Re Re + H i o n · cos ( E ) ) 2
where Re denotes the earth’s mean radius. H i o n represents the height of the thin shell of the ionosphere, and it is set to 400 km. E denotes the elevation angle of the IPP (in radians).

3. Processing Strategies

3.1. Data Selection

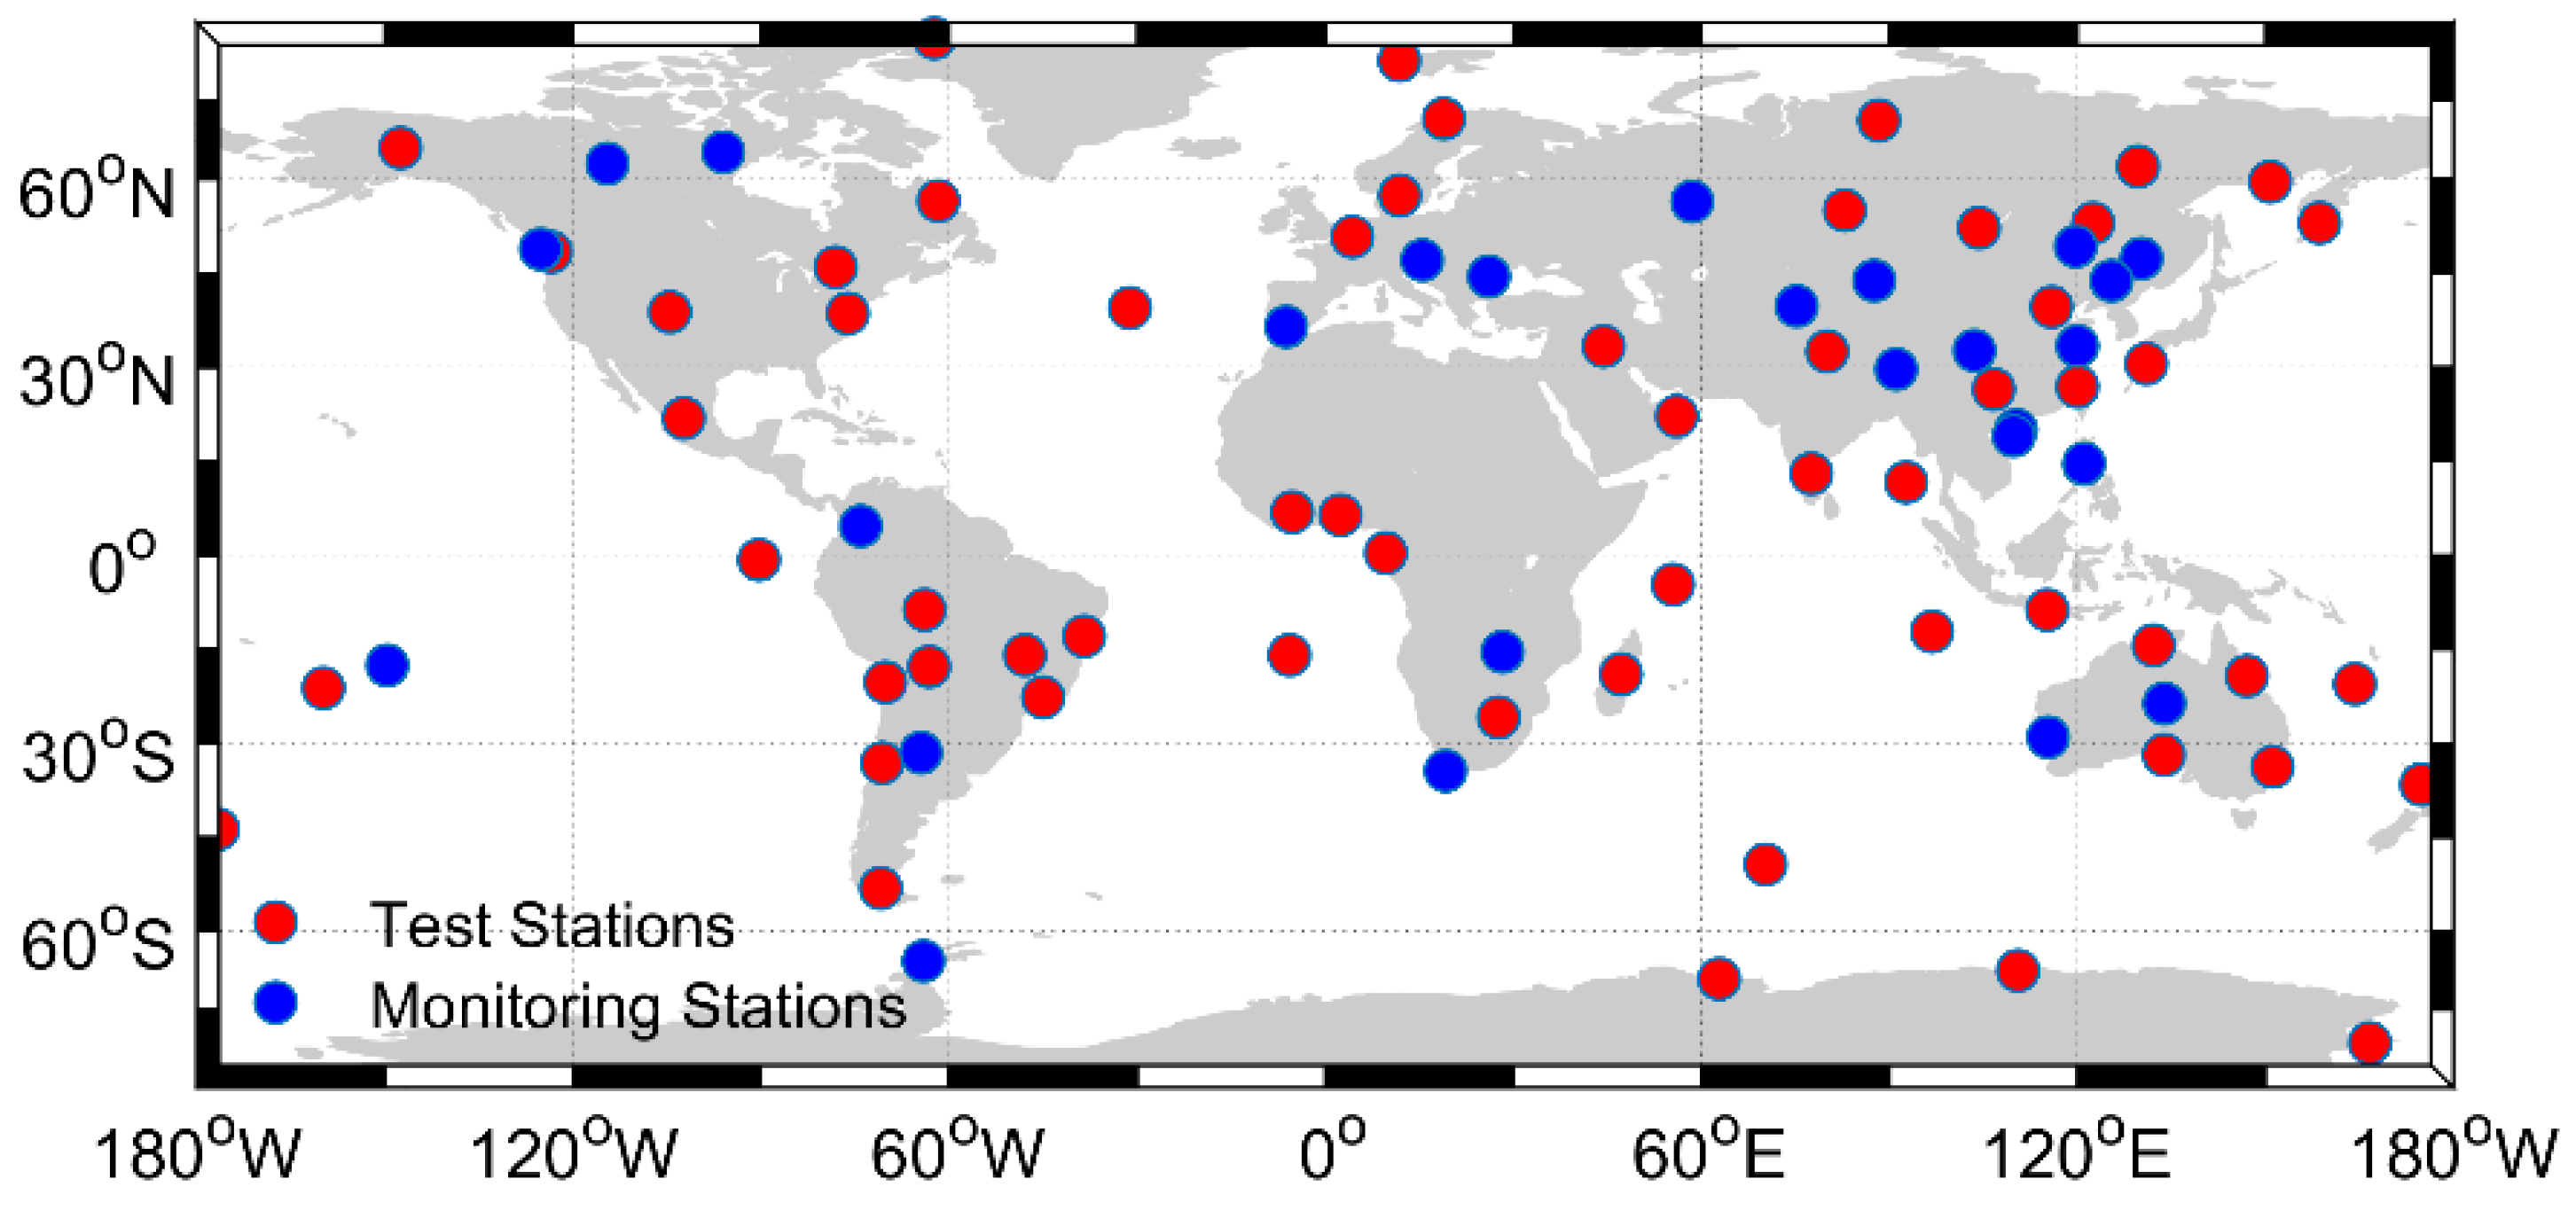
We selected 100-day GPS dual-frequency observations from the IGS and the Crustal Movement Observation Network of China (CMONOC) from 10 April to 18 July 2019 (DOY 100–199, 2019) for parameter fitting and model evaluation. For regional investigation around China, we selected 30 stations as the regional monitoring stations for estimating the coefficients of NTCM-BC. Besides, 42 independent stations are used for the performance analysis of the three ionospheric models. The location of these stations is shown in Figure 1. For the global validation, we selected 26 stations to fit the coefficients of NTCM-BC, whereas additional 62 independent stations, located at the low-, mid-, and high- latitudes are used for evaluation for the model accuracy. Figure 2 shows their distribution.
In addition, the post-processed ionospheric results of each hour provided by CODE are also taken as reference values in our investigation, as CODE is a well-known global ionospheric analysis center, and the VTEC maps produced by CODE are considered to be one of the most accurate ionospheric products in the world based on the spherical harmonic coefficient.

3.2. STEC Calibration

The GPS STEC is generated by combining the two GPS dual-frequency observations. As we know, the theoretical precision of pseudorange observations is only one percent of the symbol width. The precision of carrier phase observation is much higher than that of pseudorange, but the carrier phase observation contains integer ambiguity. Therefore, we use a levelling carrier-to-code process to remove the carrier phase ambiguity and reduce the effects of code measurements’ noise [14,15], as shown in Equation (16):
L ~ r , 4 j ( i ) = k = 1 n [ ( P r , 4 j ( k ) + L r , 4 j ( k ) ) ] n L r , 4 j ( i )
L ~ r , 4 j ( i ) = A · S T E C + B r + B j
A = 40.3 · ( 1 / f 1 2 1 / f 2 2 )
where L ~ r , 4 j ( i ) represents the levelling carrier-to-code measurements at the i th epoch; j denote the satellite, and r is the receiver; P r , 4 j ( k ) is given by P 1 minus P 2 at the k th epoch; L r , 4 j ( k ) and L r , 4 j ( i ) are given by L 1 minus L 2 at the k th and i th epoch, respectively; n is the total length of epochs for a continuous data arc without cycle slips; f 1 and f 2 are the frequencies of L 1 and L 2 , respectively; STEC is the same as the previous definition; B r is the receiver differential code biases (DCBs), and B j stand for satellite DCBs (in meters).
The STEC calculated based on Equation (16) still contains satellite and receiver hardware delay. In our study, the satellite and receiver DCBs are estimated together with the ionospheric activities at various GPS stations. Normally, the DCBs of satellites and receivers are difficult to separate without external constraints, so we introduce a zero-mean condition for all satellites to achieve this separation. After subtracting the DCBs, clean STEC can be obtained.

3.3. Coefficients Computation and Selection

The 9 coefficients of NTCM-BC can be estimated by the following equation:
1 A · 1 M F ( L ~ r , 4 j ( i ) B r B j ) = F 1 · F 2 · F 3
After converting the STEC to VTEC, the reliable model coefficients are estimated by the Gauss Newton iterative method [16]. In this article, the Klobuchar model, BDGIM, and NTCM-BCs are evaluated by comparing the prediction errors. Here, prediction means that the coefficients of NTCM-BCs derived from measurements obtained on the previous day, and the coefficients of Klobuchar as well as BDGIM extracted directly from current navigation messages are used for the current ionospheric delay calculations. The daily GNSSs navigation ephemeris data files containing parameters of Klobuchar can be downloaded at the IGS website, whereas the daily coefficients of BDGIM can be obtained from the International GNSS Monitoring and Assessment System (IGMAS) website.

3.4. Evaluation Metrics

In this paper, the bias, standard deviation (STD), root-mean-square (RMS) error, and correction ratio are utilized to evaluate the accuracy of ionospheric correction models as follows:
b i a s = i = 1 n ( M o d e l i T E C i ) n
S T D = i = 1 n ( M o d e l i T E C i b i a s ) 2 n
R M S = i = 1 n ( M o d e l i T E C i ) 2 n
C o r r e c t = i = 1 n ( 1 | M o d e l i T E C i | T E C i ) n
where M o d e l i represent the i -th estimates of ionospheric models; T E C i denotes the i -th reference value; and n represents the total number of all measurements.

4. Results

In this section, we evaluated the regional and global performance of NTCM-BC, BDGIM, and Klobuchar by comparing the accuracy of different models relative to GPS STEC and CODE VTEC. respectively.

4.1. Comparison with GPS STEC

4.1.1. Regional Comparison

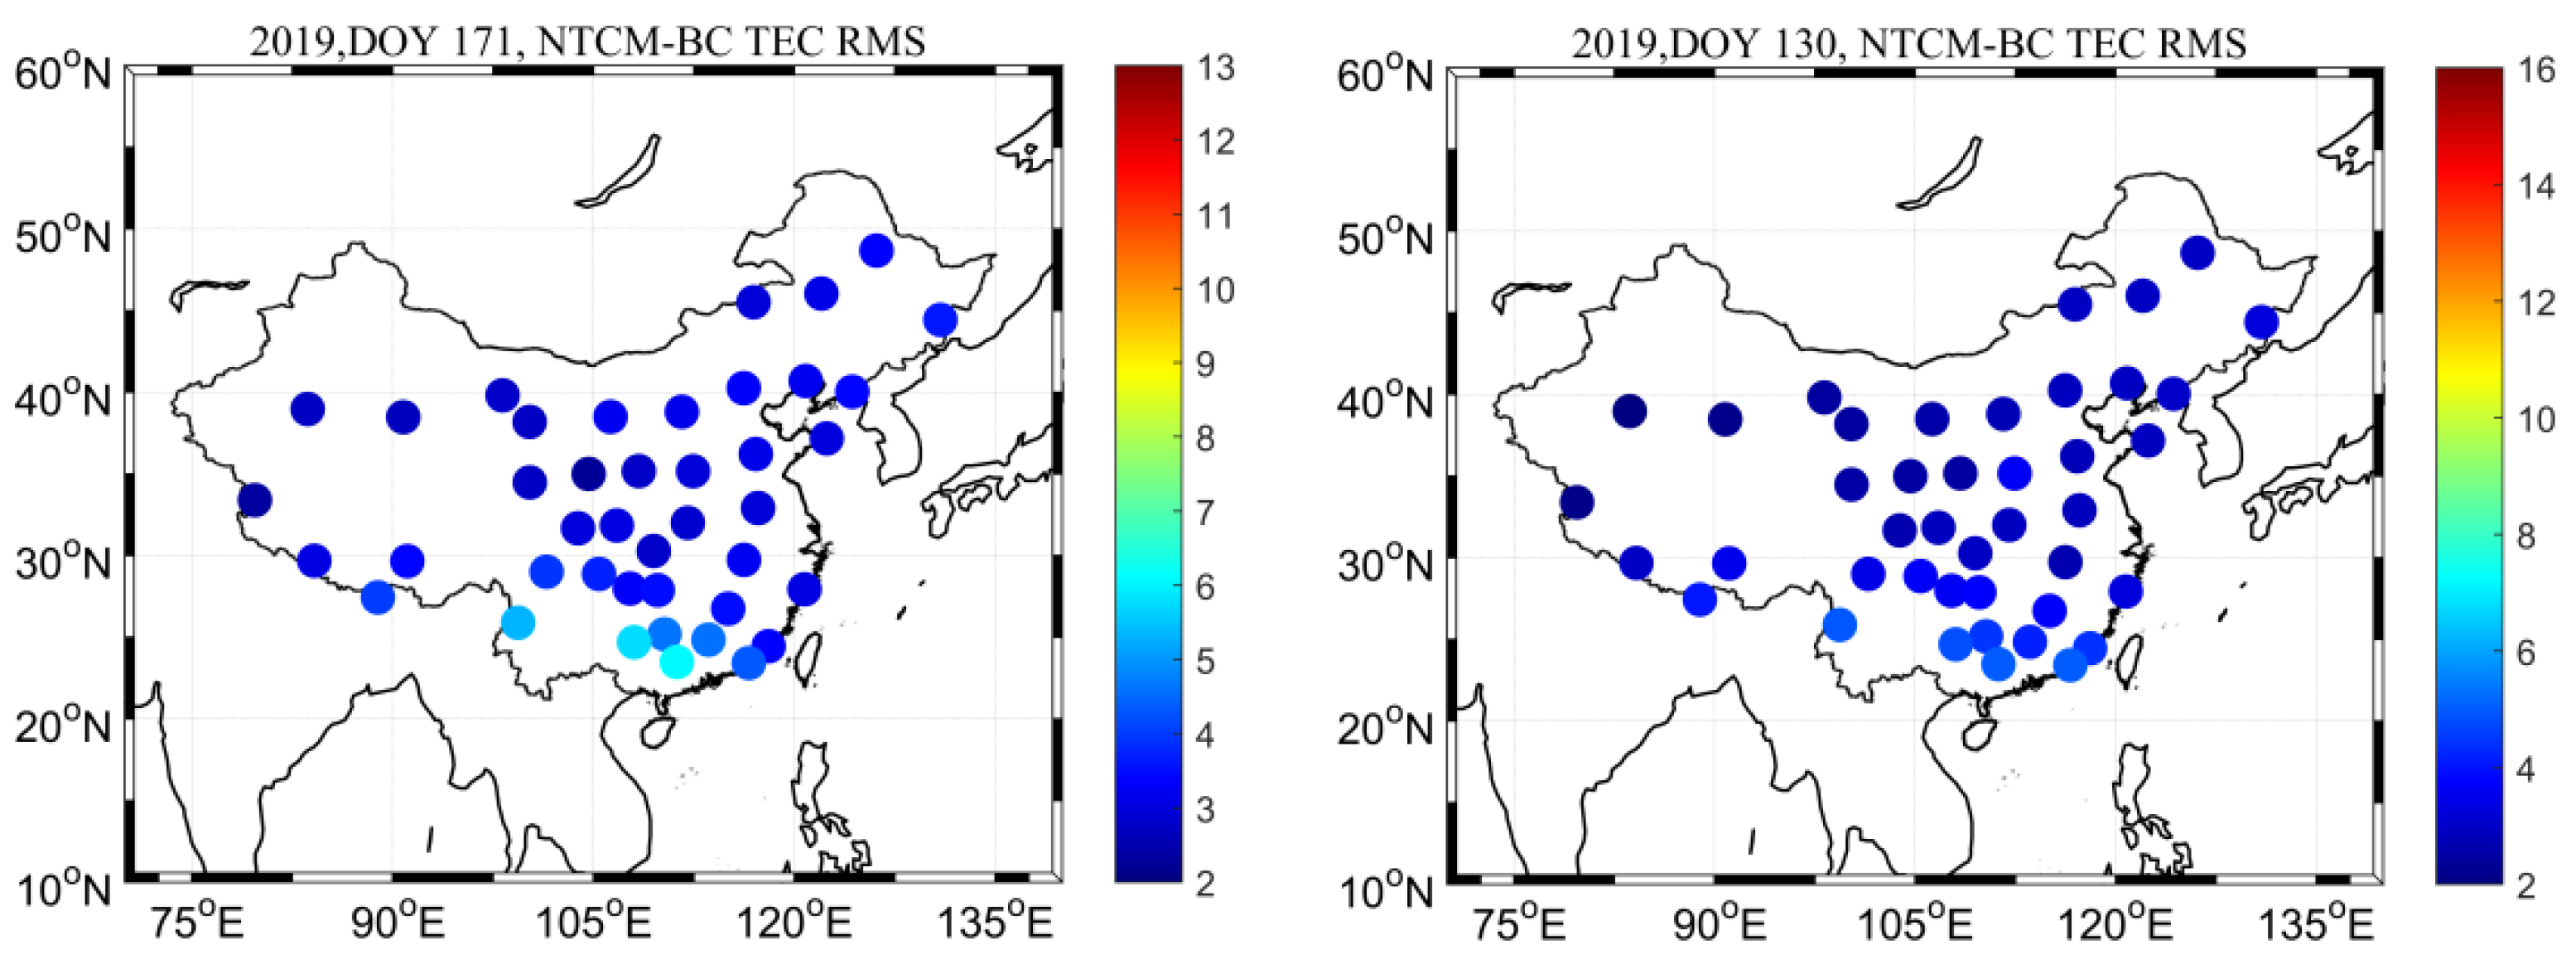
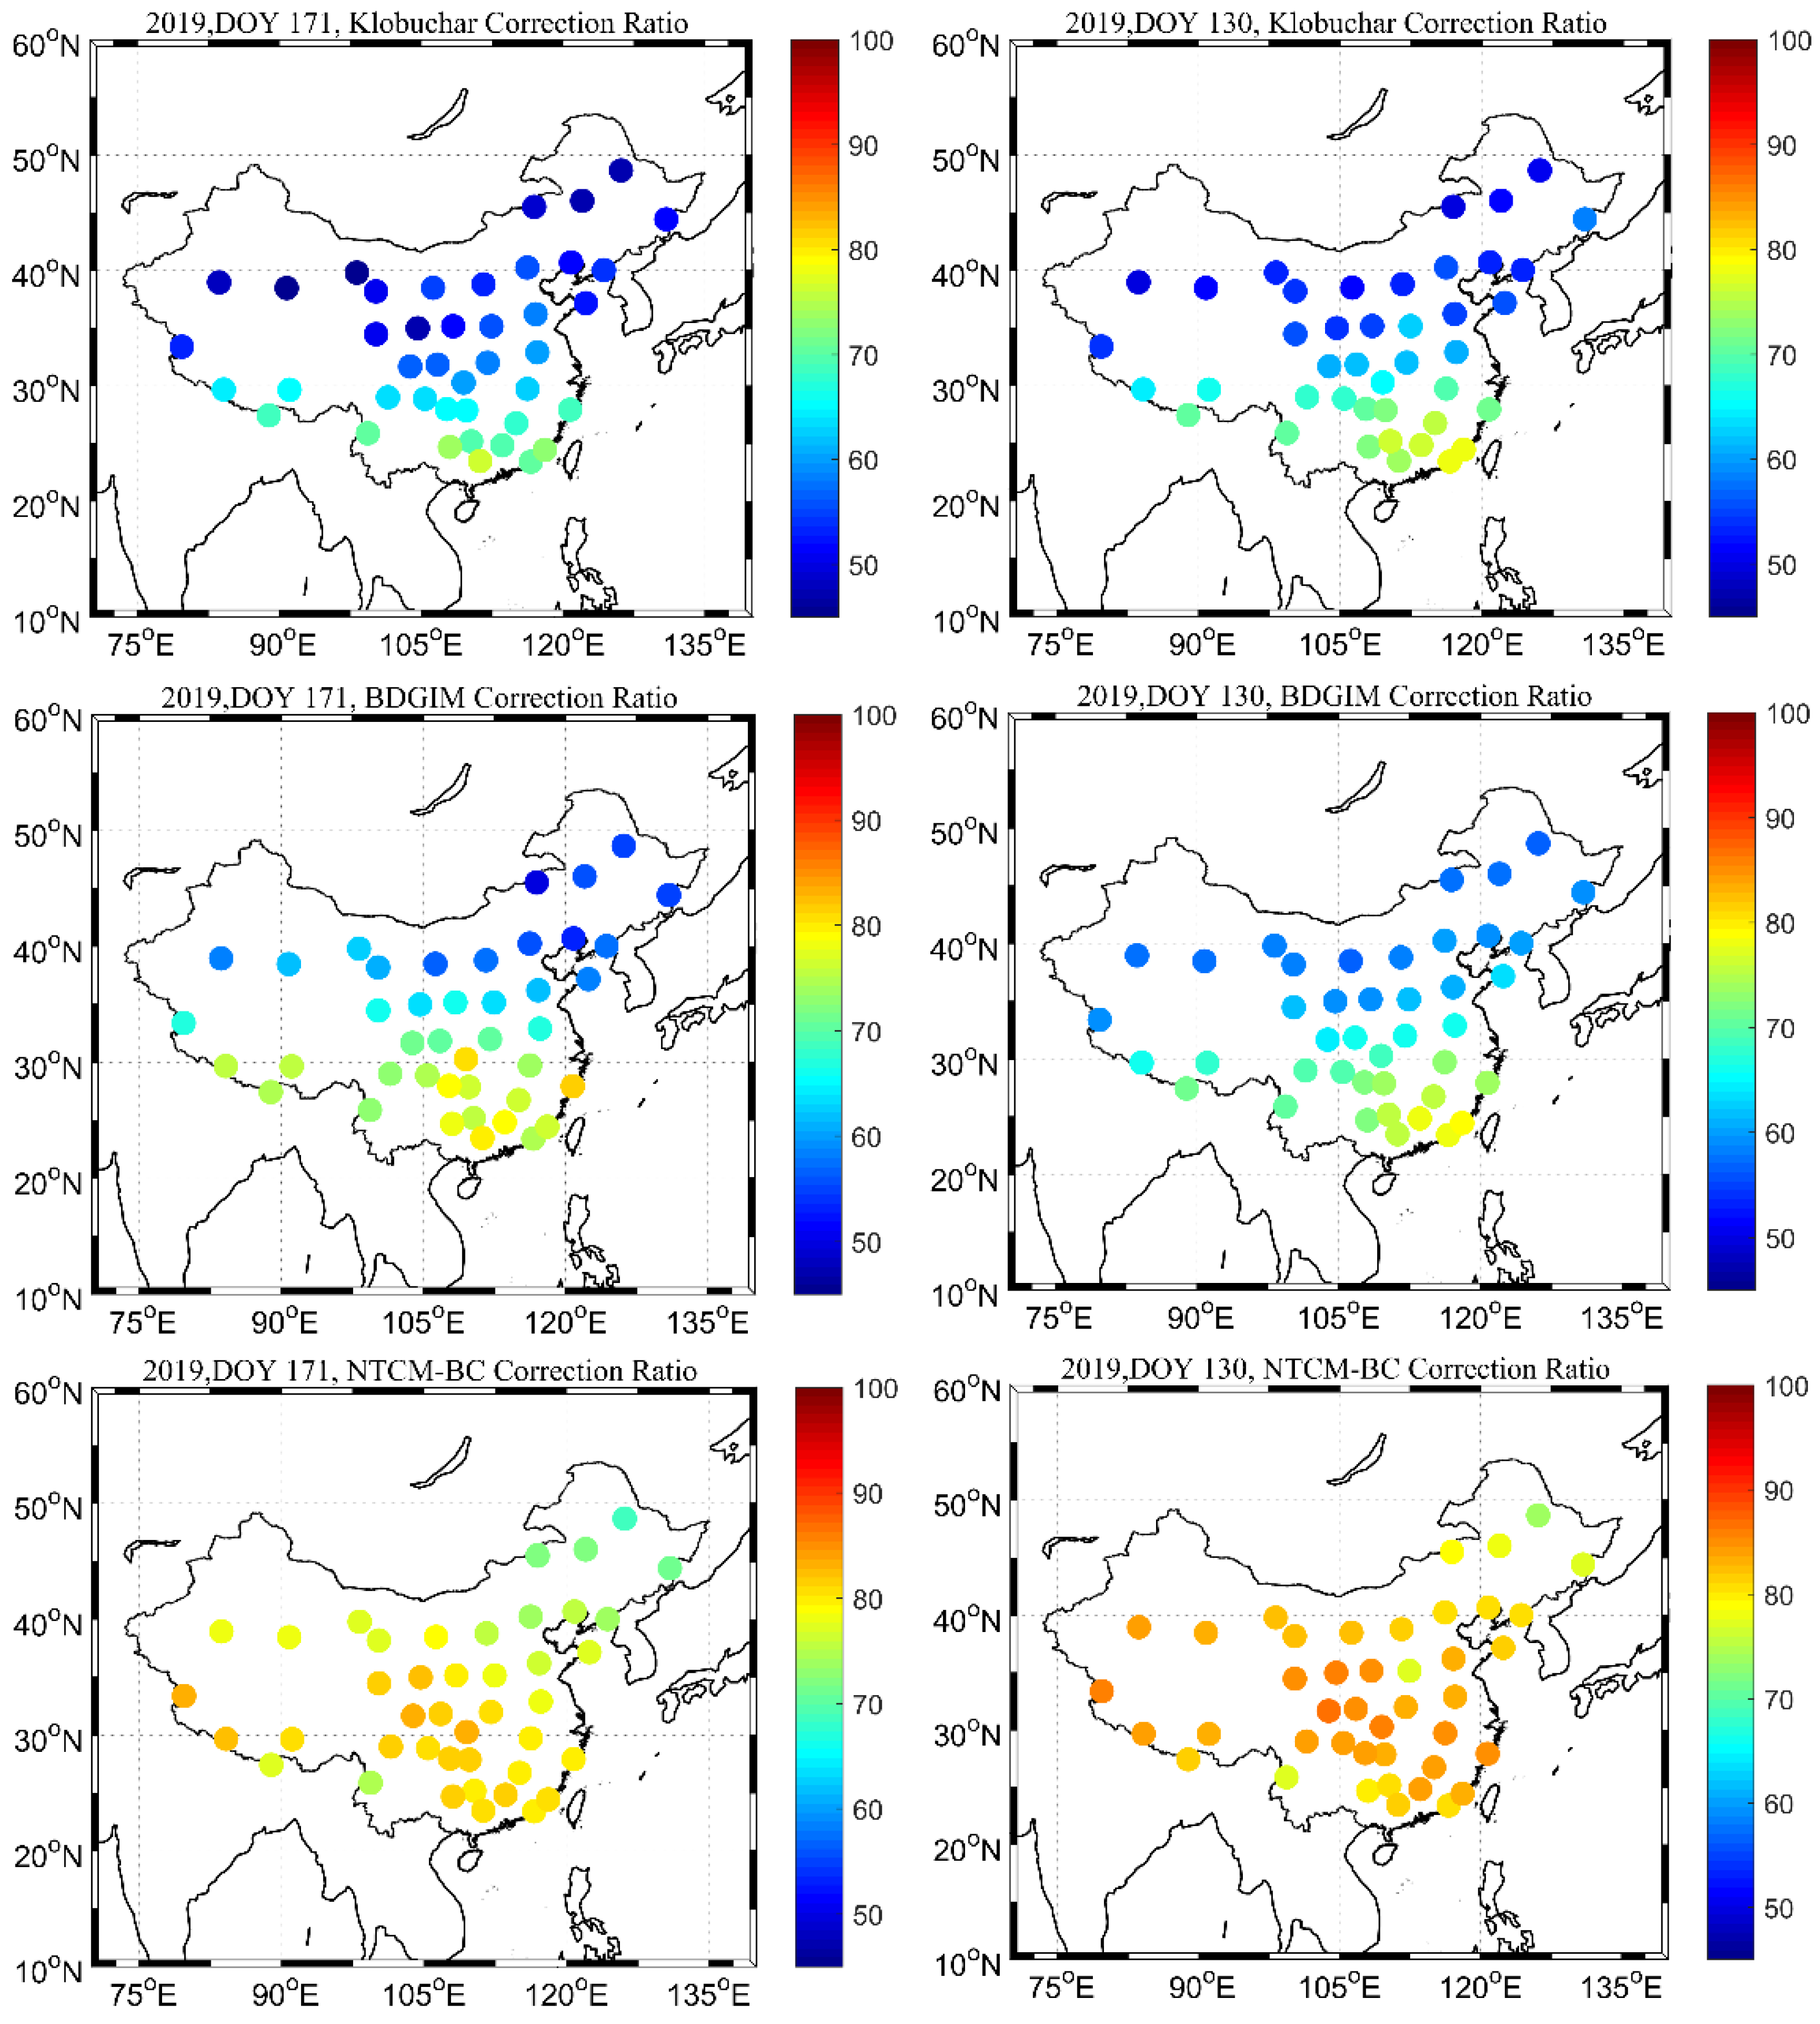
We first compare the accuracy of the Klobuchar model, BDGIM, and NTCM-BC on June 20 (DOY 171) and May 10 (DOY 130), 2019, with relatively low and high ionosphere activity. Figure 3 shows the RMS of 42 validation stations which utilized three ionospheric correction models. From Figure 3, we found that the Klobuchar model shows large RMS at mid-latitude stations, but small RMS at low-latitude stations. The model errors of BDGIM and NTCM-BC are obviously lower than those of the Klobuchar model at both low-latitude and mid-latitude stations. NTCM-BC performs the best in China as it exhibits the smallest RMS values for all validation stations. Besides, we compute the correction ratio of these different ionospheric algorithms at all validation stations for the selected days, and the results are shown in Figure 4. The ionospheric correction ratio can directly reflect the correction effect of a model in a single validation station. From Figure 4, we can obtain similar results to those in Figure 3. NTCM-BC, which can correct 70% to 90% of the ionospheric error, has the best performance. Klobuchar addresses ionospheric delays by 45% to 60% at mid-latitudes, while the ionospheric delays at low-latitude stations are corrected up to 70%. BDGIM can mitigate the ionospheric delay by 60% to 80% at most validation stations and outperforms Klobuchar.
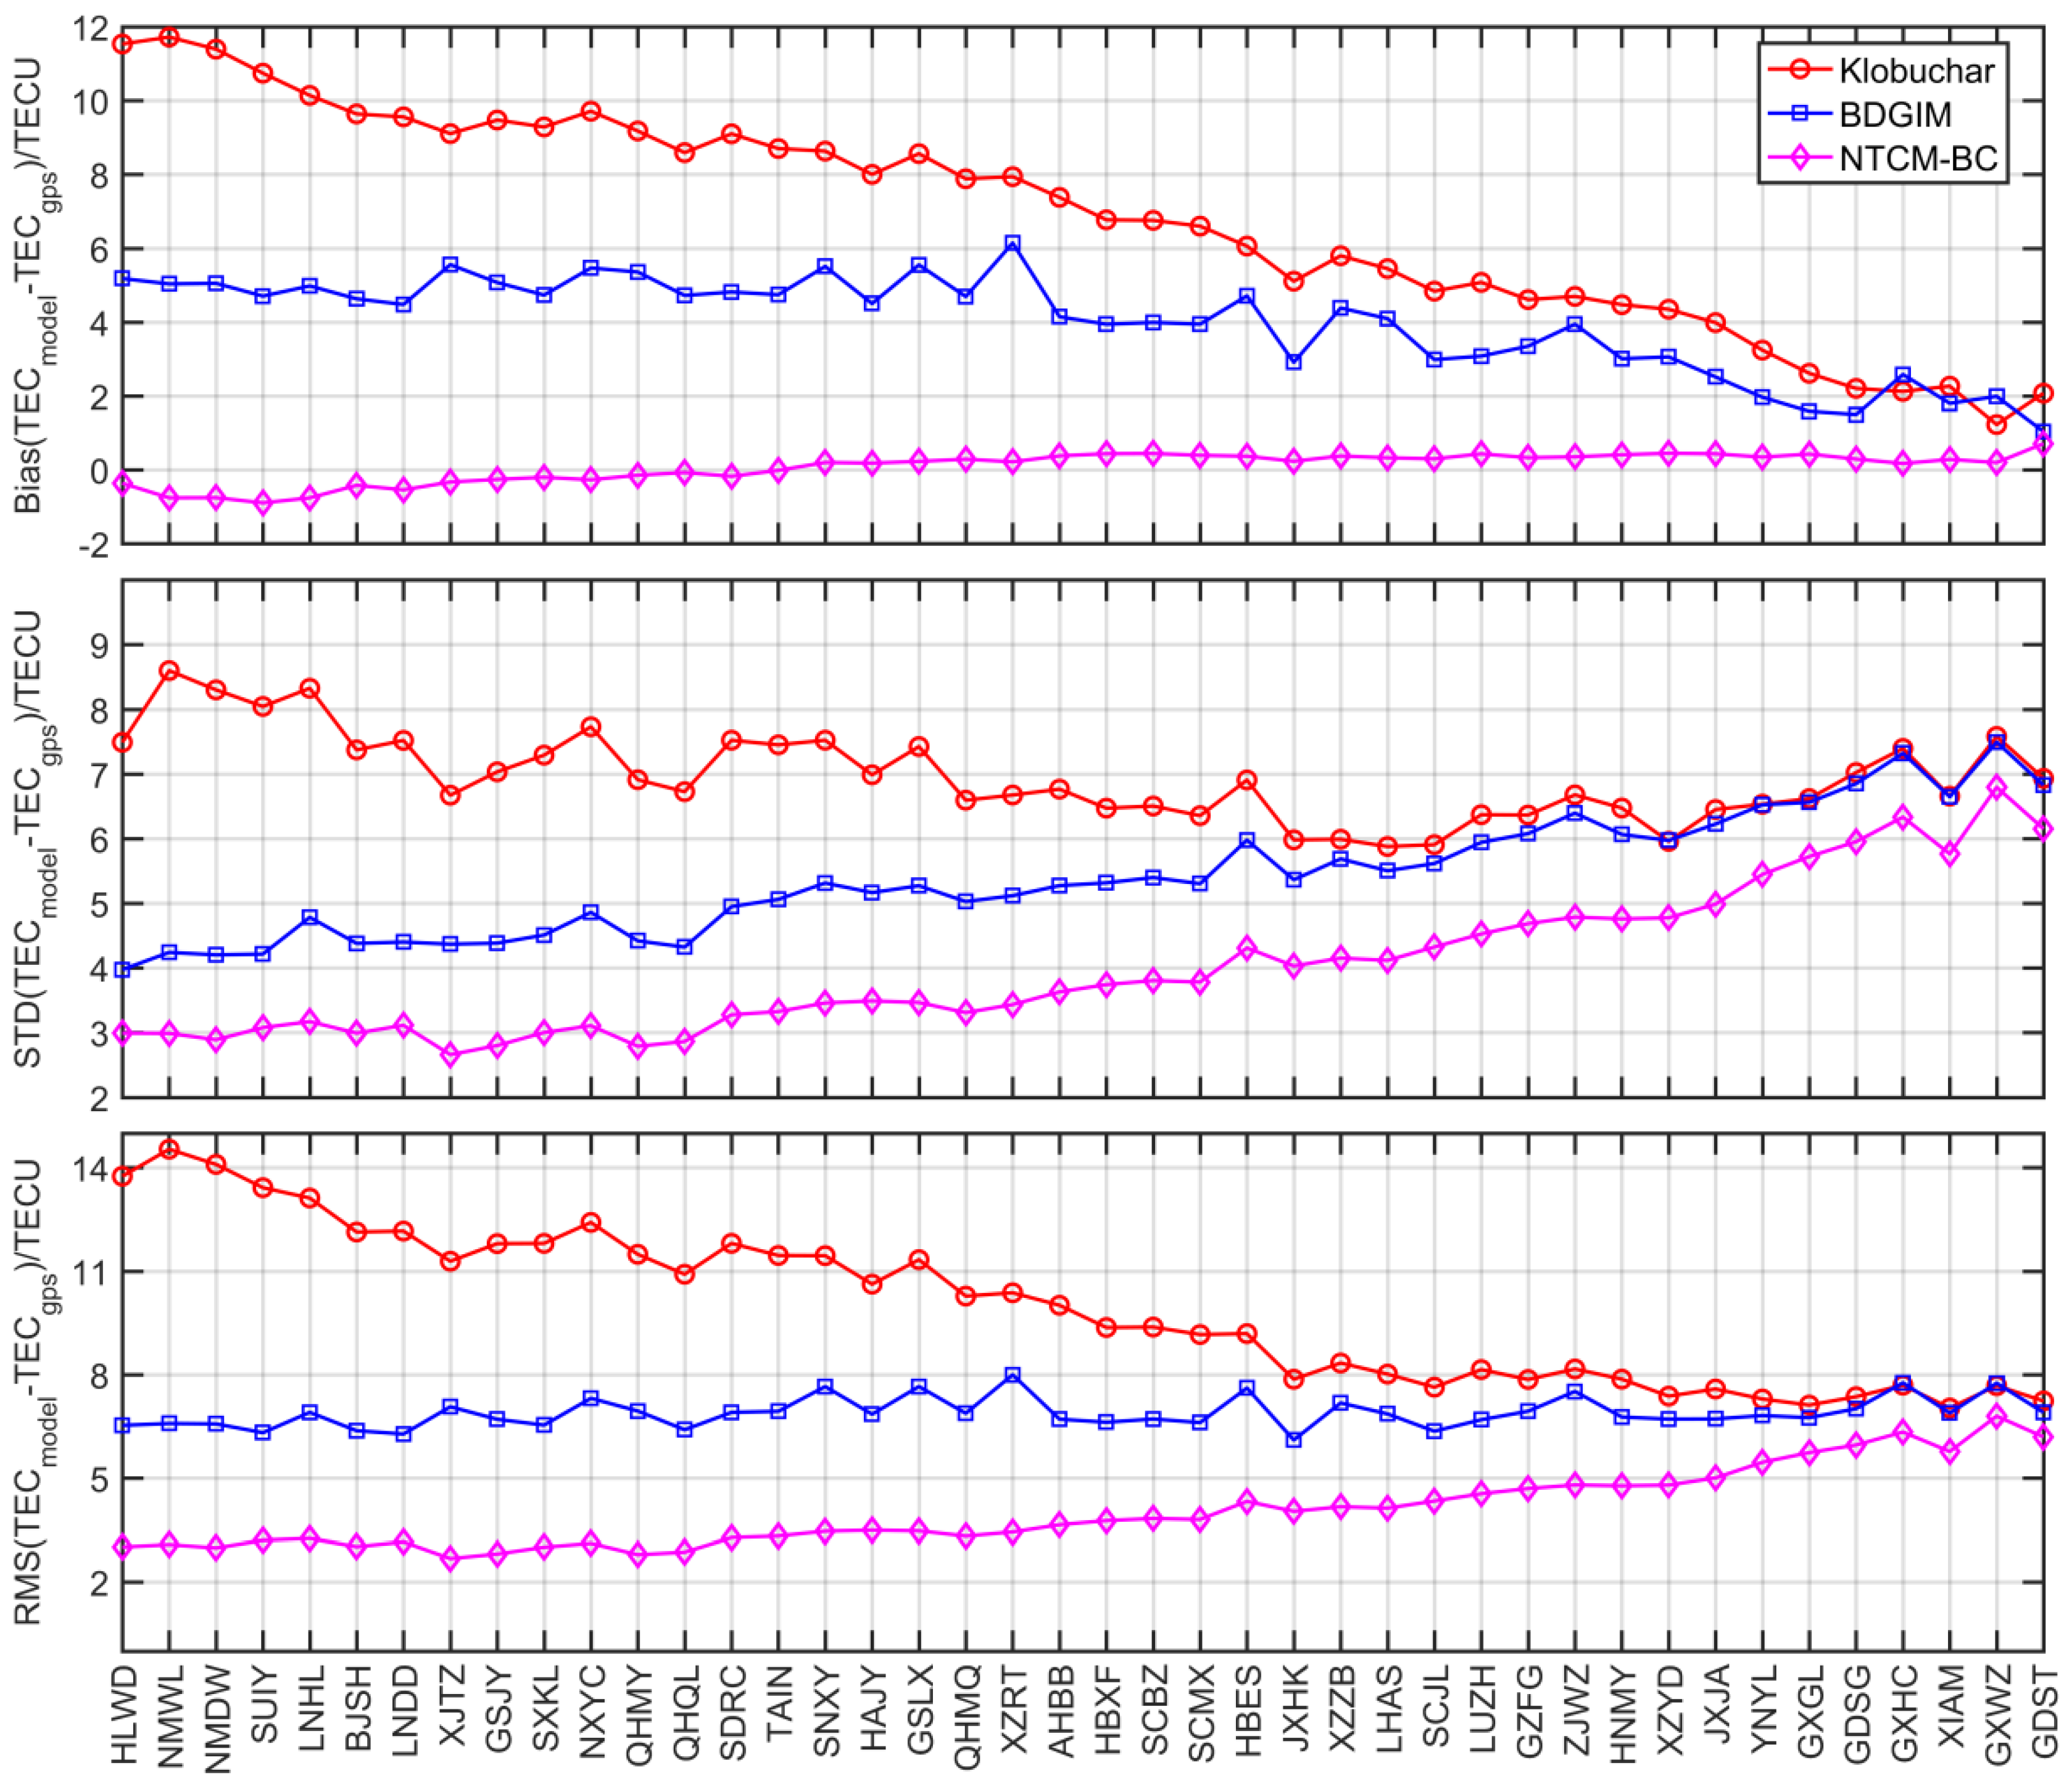
For investigating the variation in the ionospheric error with geographical latitude, we have computed the mean bias and the STD and RMS values of the differences between the STEC calculated by the above models and GPS-derived STEC at different validation stations for the selected days (DOY 101~199, 2019). The results are shown in Figure 5, where the horizontal axis is arranged according to the geographic latitude from high to low. The upper, middle, and lower plots in Figure 5 represent the bias curve, STD curve, and RMS curve, respectively. We can see that the biases of Klobuchar decrease with the latitude from 48.7° to 23.4°. A similar trend has been found for BDGIM with decreasing from 5.18 TECU to 1.03 TECU. Klobuchar and BDGIM exhibit significant positive biases compared to real STEC, while the biases of NTCM-BC are mainly around 0 TECU for all latitude regions. As for the STD values, the model errors of Klobuchar mainly vary between 5 TECU and 9 TECU, and NTCM-BC shows the smallest STD values at all the validation stations. The STD errors of BDGIM are substantially lower than those of Klobuchar at mid-latitude validation stations, but they have nearly equal values at low latitude validation stations. From the RMS, as was expected, we found that the RMS errors of NTCM-BC are slightly smaller at mid-latitude validation stations than those at low-latitude validation stations. However, the maximum value of the RMS errors appears at the mid-latitude test station for Klobuchar. This was possibly caused by the fact that 2019 was a quiet period for solar activity, and Klobuchar overestimates the ionospheric delay.
Figure 6 presents the variations in these three models’ errors with the local time. The bias of NTCM-BC varies smoothly within 24 hours. The largest biases of BDGIM and Klobuchar are approximately 6 TECU and 14 TECU, respectively. For RMS, the maximum values of these three models’ errors appear at 12:00~18:00 LT, when the RMS errors of Klobuchar are more than twice as large as those of NTCM-BC. BDGIM also obviously outperform Klobuchar.
Table 1 lists the monthly error statistics of each model in China with GPS STEC as reference values. The bias values vary from 5.63 to 7.66 TECU, 1.63 to 6.14 TECU, and 0.04 to 0.07 TECU for Klobuchar, BDGIM, and NTCM-BC, respectively. Klobuchar shows the largest STD errors, which change from 4.76 to 7.81 TECU, and corresponding STD errors range from 3.61 to 5.98 TECU as well as 3.30 to 4.61 TECU for BDGIM and NTCM-BC, respectively. Moreover, The RMS values vary among 7.58~11.15 TECU for Klobuchar, 4.34~8.32 TECU for BDGIM, and 3.31~4.63 TECU for NTCM-BC. Klobuchar can reduce the ionospheric errors by 55.6%~59.4% during the test period, whereas BDGIM and NTCM-BC are able to correct ionospheric errors up to 71.6% and 80.5%, respectively.

4.1.2. Global Comparison

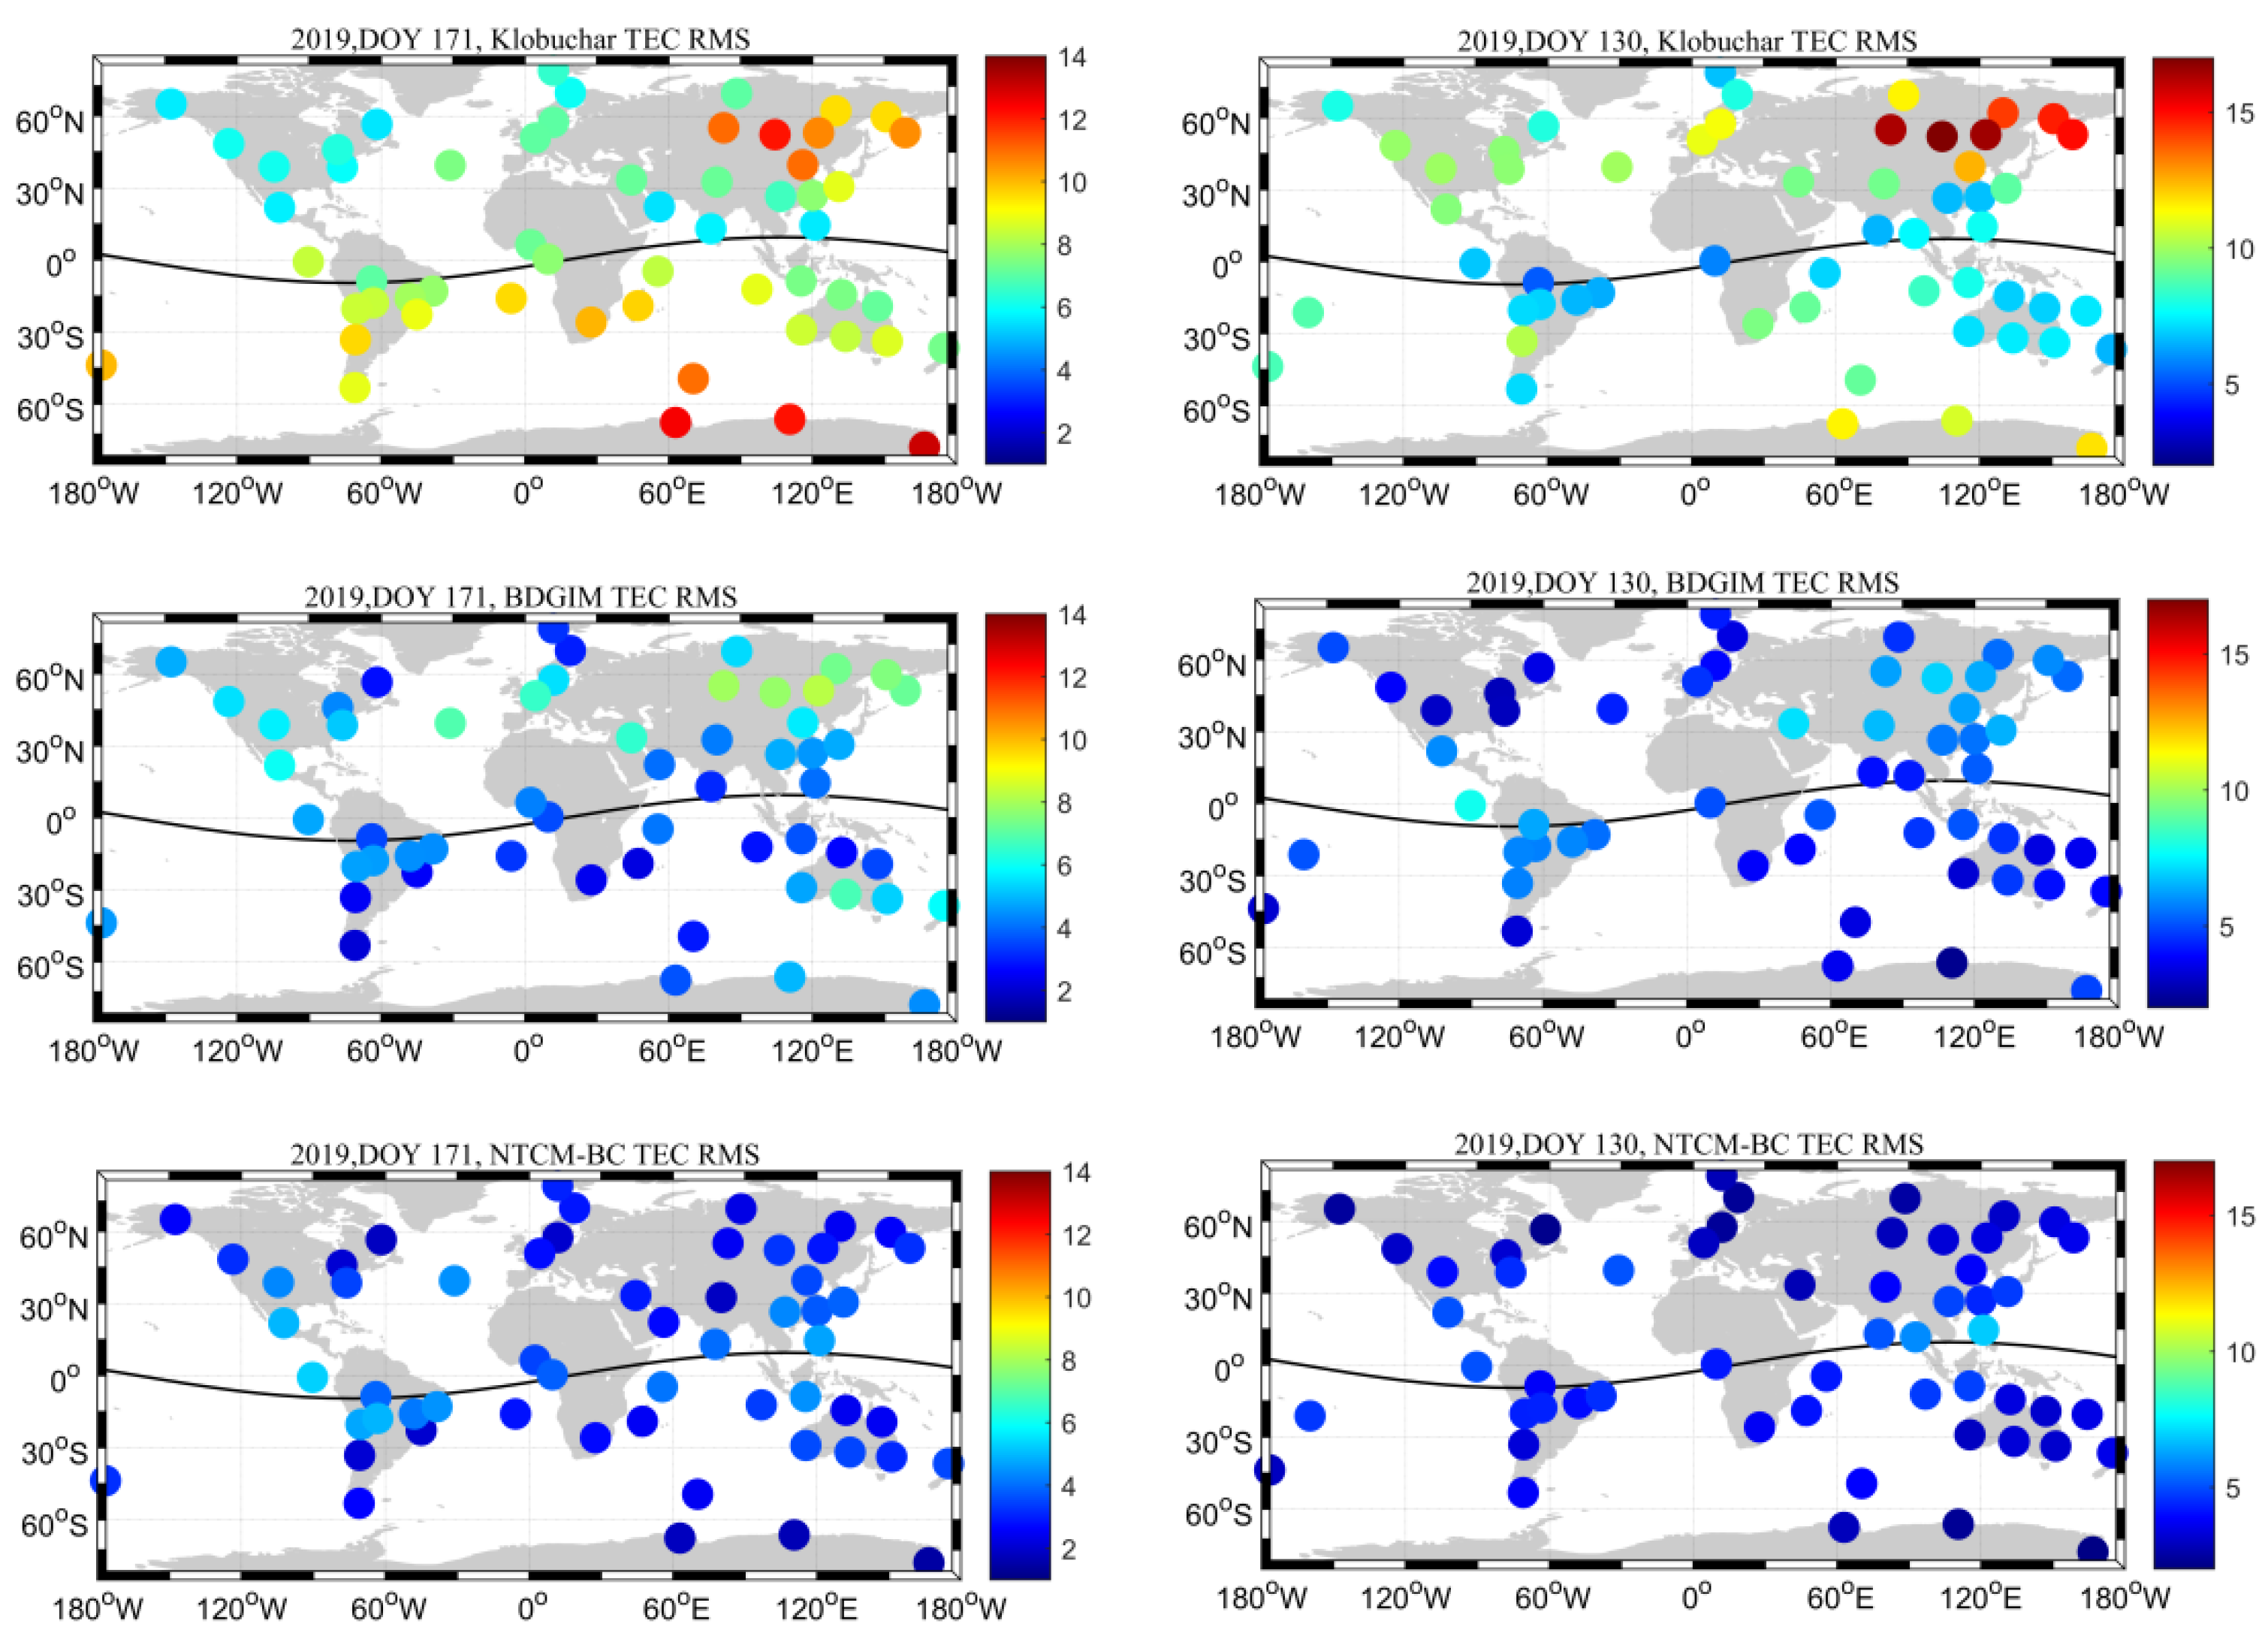
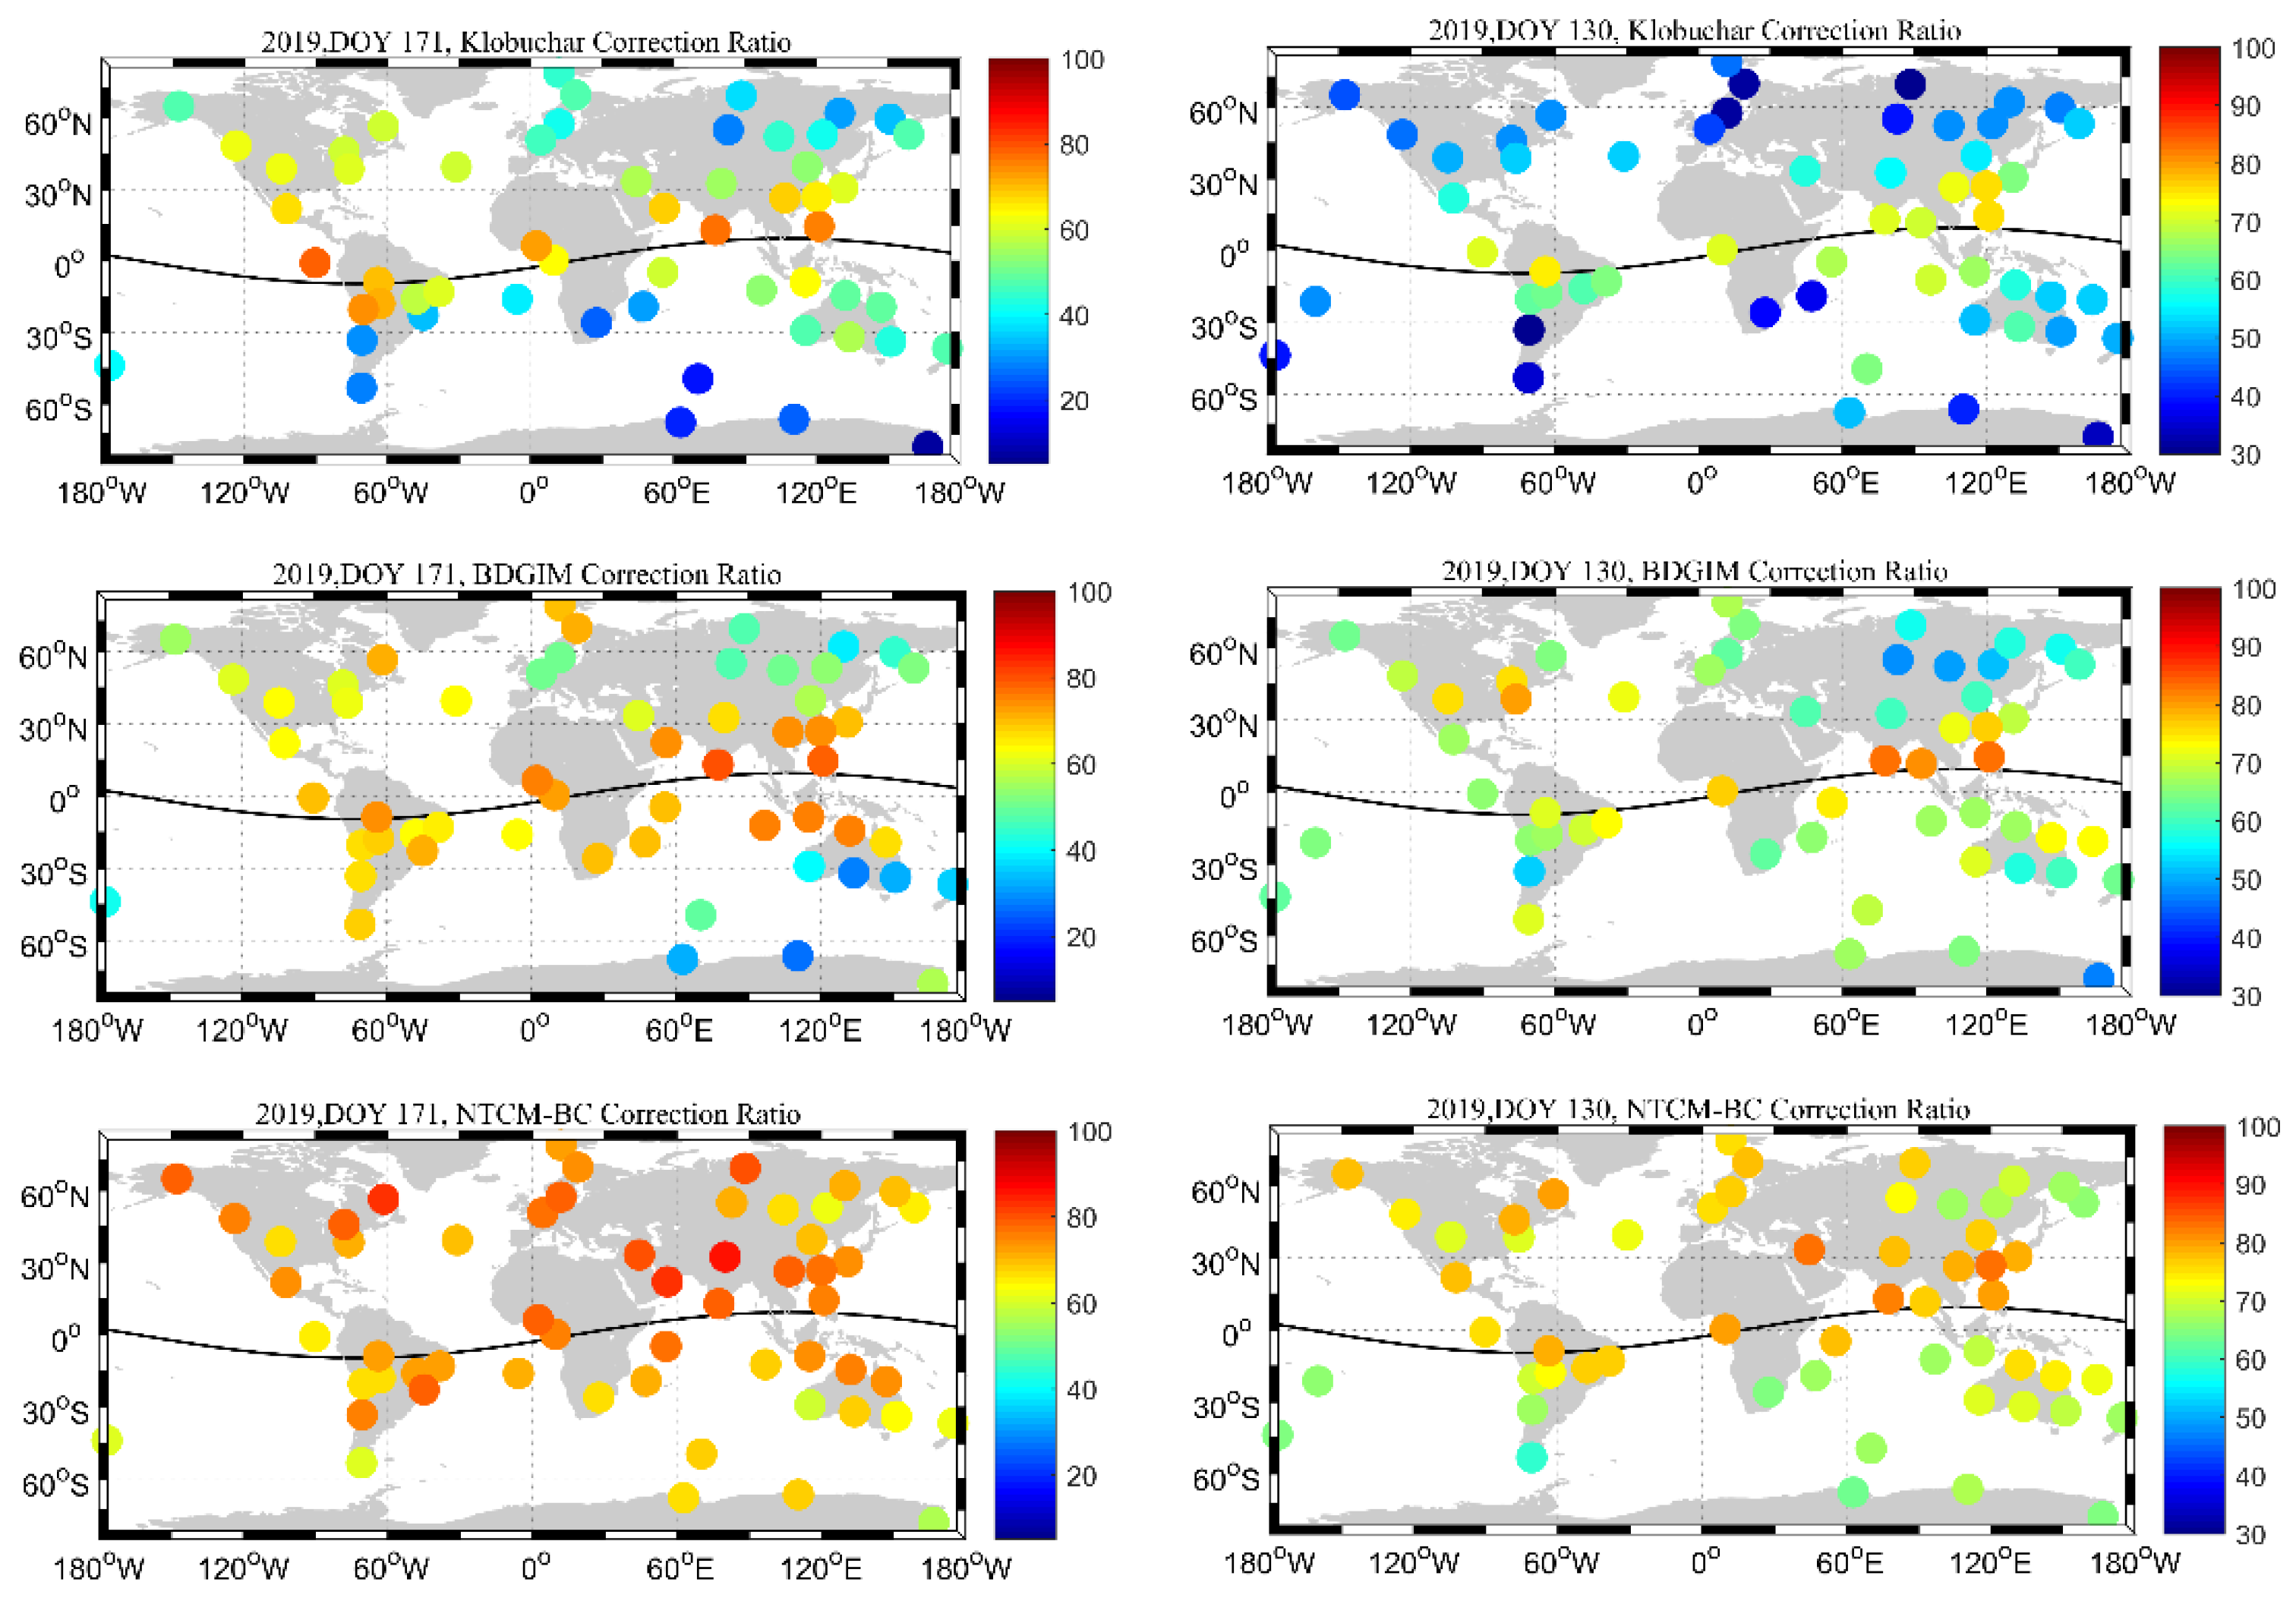
Considering that Klobuchar and BDGIM are the broadcast ionospheric models for global real-time users. We extracted ionospheric TEC from 26 globally distributed stations for fitting coefficients of NTCM-BC, and the error of this model is evaluated by GPS STEC obtained from 62 globally average distributed validation stations. Similar to the previous regional comparison, we selected the same days (DOY 130, 2019 and DOY 171, 2019) to assess the global performance of Klobuchar, BDGIM, and NTCM-BC. Figure 7 shows the RMS for these two days. It can be seen that Klobuchar exhibits larger ionospheric errors than BDGIM and NTCM-BC at most validation stations. NTCM-BC shows significantly smaller RMS values at almost all validation stations. The ionospheric correction ratio of different models also plotted in Figure 8. We can see that NTCM-BC shows the best correction effects and the correction ratio can reach up to 70% to 90% on a global scale.
Figure 9 illustrates the variation in the ionospheric errors of different models with respect to geographic latitude. The top plot shows the bias of the STEC differences between the STEC predictions of these models and GPS-derived STEC, whereas the bottom plot shows the RMS of the above differences. Klobuchar exhibits small biases at low-latitude validation stations, but large biases at high- and mid-latitude validation stations. The mean deviations of BDGIM fluctuates between -5 and 5 TECU at most validation stations, which are smaller than those of Klobuchar and slightly larger than those of NTCM-BC. The RMS values of Klobuchar range from 5 TECU to 16 TECU, and the peak values appear in the mid- and high-latitude areas. The RMS errors of BDGIM fluctuate within 5 TECU. Compared with Klobuchar and BDGIM, NTCM-BC presents the lowest RMS errors at almost all validation stations, especially in the mid- and high-latitude regions. On the whole, the results show that NTCM-BC has the best performance at the globally distributed validation stations, followed by BDGIM, and Klobuchar has the worst performance.
The monthly bias, STD, RMS, and the correction ratio of these three models for global analysis are shown in Table 2. Compared to GPS STEC, the bias values range among 6.79~7.57 TECU for Klobuchar, 0.17~3.93 TECU for BDGIM, and 0.02~0.33 TECU for NTCM-BC. The STD errors of Klobuchar vary from 3.87 to 5.62 TECU, and the corresponding values range from 3.49 to 4.68 TECU, as well as 2.86 to 3.70 TECU for BDGIM and NTCM-BC, respectively. The RMS of BDGIM is a factor of 1.58~1.75 less than that of Klobuchar and 1.5 higher than that of NTCM-BC. In addition, the ionospheric correction ratios are arranged in descending order: NTCM-BC, BDGIM, and Klobuchar, which can correct the ionospheric delay by 71.8%~73.1%, 61.1%~64.8% and 50.4%~51.2%, respectively.
Table 3 lists the averaged bias, STD, RMS, and the correction ratio of these three models during the selected 99 days. Compared with GPS STEC, the RMS errors are 8.92 TECU, 5.48 TECU, and 3.67 TECU for Klobuchar, BDGIM, and NTCM-BC, respectively. NTCM-BC presents the best performance with a correction ratio of 72.7%, which outperforms BDGIM by 8.6% and Klobuchar by 19.8%.

4.2. Comparison with CODE VTEC

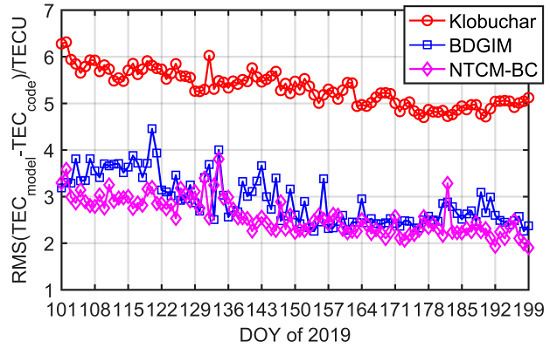
CODE provides the post-processed global ionospheric grid products with high-precision, and 1 h and a spatial resolution of 5 × 2.5° in longitude and latitude. To comprehensively compare the global performance of the ionospheric correction models, we considered CODE VTEC as the independent reference values and computed the daily prediction errors of different models from DOY 101 to 199 in 2019. The bias, STD and RMS of the VTEC differences between CODE and the predictions from the models are shown with the correction ratio of various models in Figure 10. The biases of Klobuchar fluctuate at 4 TECU for the test days. BDGIM and NTCM-BC present the smaller biases, which range from −2 TECU to 3 TECU and −2 TECU to 1 TECU, respectively. As can be seen from the STD and RMS, the errors of Klobuchar and NTCM-BC in DOY 101~150 are greater than those in DOY 151~199. The reason for this is that solar activity is more active in the former period than in the latter. Furthermore, we can find that the RMS values of BDGIM change from 2 TECU to 5 TECU, which fluctuate greatly for DOY 101~164. One possible reason for this is that the BDS-3 is still under construction, meaning that the coefficients of the BDGIM broadcast by BDS-3 satellites are not stable during this period. The system gradually stabilizes from DOY 164, and this fluctuation becomes smaller, but the RMS values of BDGIM are still slightly larger than those of NTCM-BC, which is related to the accuracy of the models. With the gradual improvement of BDS, we believe that the stability of BDGIM will continue to increase.
From the correction ratio variations of different models, the correction capability of Klobuchar is substantially lower than that of BDGIM and NTCM-BC. It can be also found that NTCM-BC shows the best performance during the test period, which can reduce the ionospheric errors by about 68%~77%.
As we can see from Table 3, the error of each ionospheric model with GPS STEC as reference values is larger than that with CODE VTEC as reference values. The reason is the difference between the two background values. In general, the accuracy of GPS-derived STEC is higher than that of CODE VTEC.
Figure 11 shows the averaged bias and RMS of these three models at different latitudes during the test time. We took a statistical value every 2.5 degrees. As the figure shows, Klobuchar presents a U-shaped change curve and shows the positive biases, which is consistent with the above results with GPS STEC as reference values. BDGIM and NTCM-BC have the smaller biases, which mainly range from −2 TECU to 2 TECU. In terms of RMS errors, Klobuchar presents the largest RMS value, which decreases first, then increases and then decreases with the increment of latitudes. This is partly because the selected time is in the solar activity quiet period. Ionospheric conditions in low-latitude areas are not as complicated as during solar activity disturbed period, so this effect occurs. The RMS errors of BDGIM and NTCM-BC are slightly larger at low-latitude regions than that at mid- and high-latitude regions. Using CODE VTEC as the benchmark, NTCM-BC shows the best performance for almost all latitudes, followed by BDGIM, and Klobuchar performs worst.

5. Conclusions and Discussion

This study compares the performance of the NTCM-BC, BDGIM, and Klobuchar model over both China and a global area, aiming to seek a better broadcast ionospheric model for the next BDS and its augmentation system. To show a comprehensive assessment, the STEC data of more than 80 validation stations and the final VTEC data of CODE are used as independent reference values. Based on the analysis results, we found that the RMS errors of Klobuchar are larger at mid-latitude areas than those at low-latitude test areas. This is partly because the selected time is in a period of quiet solar activity. Compared with GPS STEC, the RMS value of NTCM-BC is 2.49 TECU smaller than that of BDGIM and 5.64 TECU smaller than that of Klobuchar in the China region. In general, NTCM-BC, BDGIM, and Klobuchar can correct 79.4%, 64.9%, and 57.7% of ionospheric delay, respectively. For the global area, we have found that the RMS value of Klobuchar is 2.43 and 1.49 times higher than that of NTCM-BC and BDGIM, respectively. Compared with CODE VTEC, NTCM-BC, BDGIM, and Klobuchar can correct 72.6%, 69.8%, and 61.7% of ionospheric delay, respectively.
Whether GPS STEC or CODE VTEC are selected as references, it is certain that NTCM-BC shows the best performance in both China and the global region and corrects the ionospheric delay 5.9% and 15.4% more than that of BDGIM and Klobuchar, respectively. The reason is that the functional model of NTCM-BC considers various information affecting the TEC behavior, such as LT dependency (diurnal, semidiurnal, and ter-diurnal), geomagnetic latitude, and low latitude anomalies. The BDGIM and Klobuchar models do not take into account so many factors.
Our study is valuable for the next-generation Beidou broadcast ionospheric model and the selection of ionospheric correction models for global and wide-area augmentation systems. Further research will center on the long-term comparison covering the whole solar activity cycle and the influence of various ionospheric correction models on positioning accuracy.

Author Contributions

Formal analysis, K.J., X.X. and Y.L.; Supervision, Q.Z.; Writing—original draft, C.Y.; Writing—review & editing, J.G. and T.G. All authors have read and agreed to the published version of the manuscript.

Funding

This research was funded by the National Natural Science Foundation of China (grant number 41974035, 41674004, 41974036), Young Elite Scientists Sponsorship Program by CAST (grant number 2018QNRC001), and Natural Science Foundation of Hubei Province (grant number 2019CFA051).

Acknowledgments

The authors would like to give thanks to Changjiang Geng, Fujian Ma, Jun Chen, Ningbo Wang for their help. We would like to thank to IGS and CMONOC for providing available high quality GNSS data. And we would like to thank to CODE and IGMAS for making daily ionospheric correction model coefficients and high quality modelling products.

Conflicts of Interest

The authors declare no conflict of interest.

References

  1. Hoque, M.M.; Jakowski, N. An alternative ionospheric correction model for global navigation satellite systems. J. Geod. 2015, 89, 391–406. [Google Scholar] [CrossRef]
  2. Klobuchar, J.A. Ionospheric time-delay algorithm for single-frequency GPS users. IEEE Trans. Aerosp. Electron. Syst. 1987, AES-23, 325–331. [Google Scholar]
  3. Hochegger, G.; Nava, B.; Radicella, S.; Leitinger, R. A family of ionospheric models for different uses. Phys. Chem. Earth Part C Sol. Terr. Planet. Sci. 2000, 25, 307–310. [Google Scholar]
  4. Nava, B.; Coisson, P.; Radicella, S.M. A new version of the NeQuick ionosphere electron density model. J. Atmos. Sol.-Terr. Phys. 2008, 70, 1856–1862. [Google Scholar] [CrossRef]
  5. Radicella, S.M.; Leitinger, R. The evolution of the DGR approach to model electron density profiles. Adv. Space Res. 2001, 27, 35–40. [Google Scholar] [CrossRef]
  6. China Satellite Navigation Office. BeiDou Navigation Satellite System Signal in Space Interface Control Document Open Service Signal B1C (Version1.0). Available online: http://www.beidou.gov.cn/xt/gfxz/201712/P020171226741342013031.pdf (accessed on 27 December 2017).
  7. Jakowski, N.; Hoque, M.M.; Mayer, C. A new global TEC model for estimating transionospheric radio wave propagation errors. J. Geod. 2011, 85, 965–974. [Google Scholar] [CrossRef]
  8. Jakowski, N. TEC monitoring by using satellite positioning systems; Modern Ionospheric Science: Berlin, Germany, 1996; pp. 371–390. [Google Scholar]
  9. Hoque, M.M.; Jakowski, N.; Berdermann, J. An ionosphere broadcast model for next generation GNSS. In Proceedings of the 28th International Technical Meeting of the Satellite Division of the Institute of Navigation (ION GNSS+ 2015), Tampa, FL, USA, 14–18 September 2015; pp. 3755–3765. [Google Scholar]
  10. Bidaine, B. Ionosphere modelling for Galileo single frequency Users Doctoral dissertation. Ph.D. Thesis, Université de Liège, Liège, Belgique, 2012. [Google Scholar]
  11. Zhang, X.H.; Ma, F.J.; Ren, X.D.; Xie, W.L.; Zhu, F.; Li, X. Evaluation of NTCM-BC and a proposed modification for single-frequency positioning. GPS Solut. 2017, 21, 1535–1548. [Google Scholar]
  12. Wu, X.L.; Hu, X.G.; Wang, G.; Zhong, H.J.; Tang, C.P. Evaluation of COMPASS ionospheric model in GNSS positioning. Adv. Space Res. 2013, 51, 959–968. [Google Scholar] [CrossRef]
  13. Yuan, Y.; Wang, N.; Li, Z.; Huo, X. The beidou global broadcast ionospheric delay correction model (bdgim) and its preliminary performance evaluation results. J. Znstitute Navig. 2019, 66, 55–69. [Google Scholar]
  14. Schaer, S. Mapping and predicting the Earth’s ionosphere using the Global Positioning System. Ph.D. Thesis, AIUB, University of Berne, Bern, Switzerland, 1999. [Google Scholar]
  15. Ren, X.; Zhang, X.; Xie, W.; Zhang, K.; Yuan, Y.; Li, X. Global ionospheric modelling using multi-GNSS: BeiDou, Galileo, GLONASS and GPS. Sci. Rep. 2016, 6, 33499. [Google Scholar] [CrossRef] [PubMed] [Green Version]
  16. Seber, G.A.F.; Wild, C.J. Unconstrained optimization. In Nonlinear Regression; Wiley: Hoboken, NJ, USA, 1989. [Google Scholar]
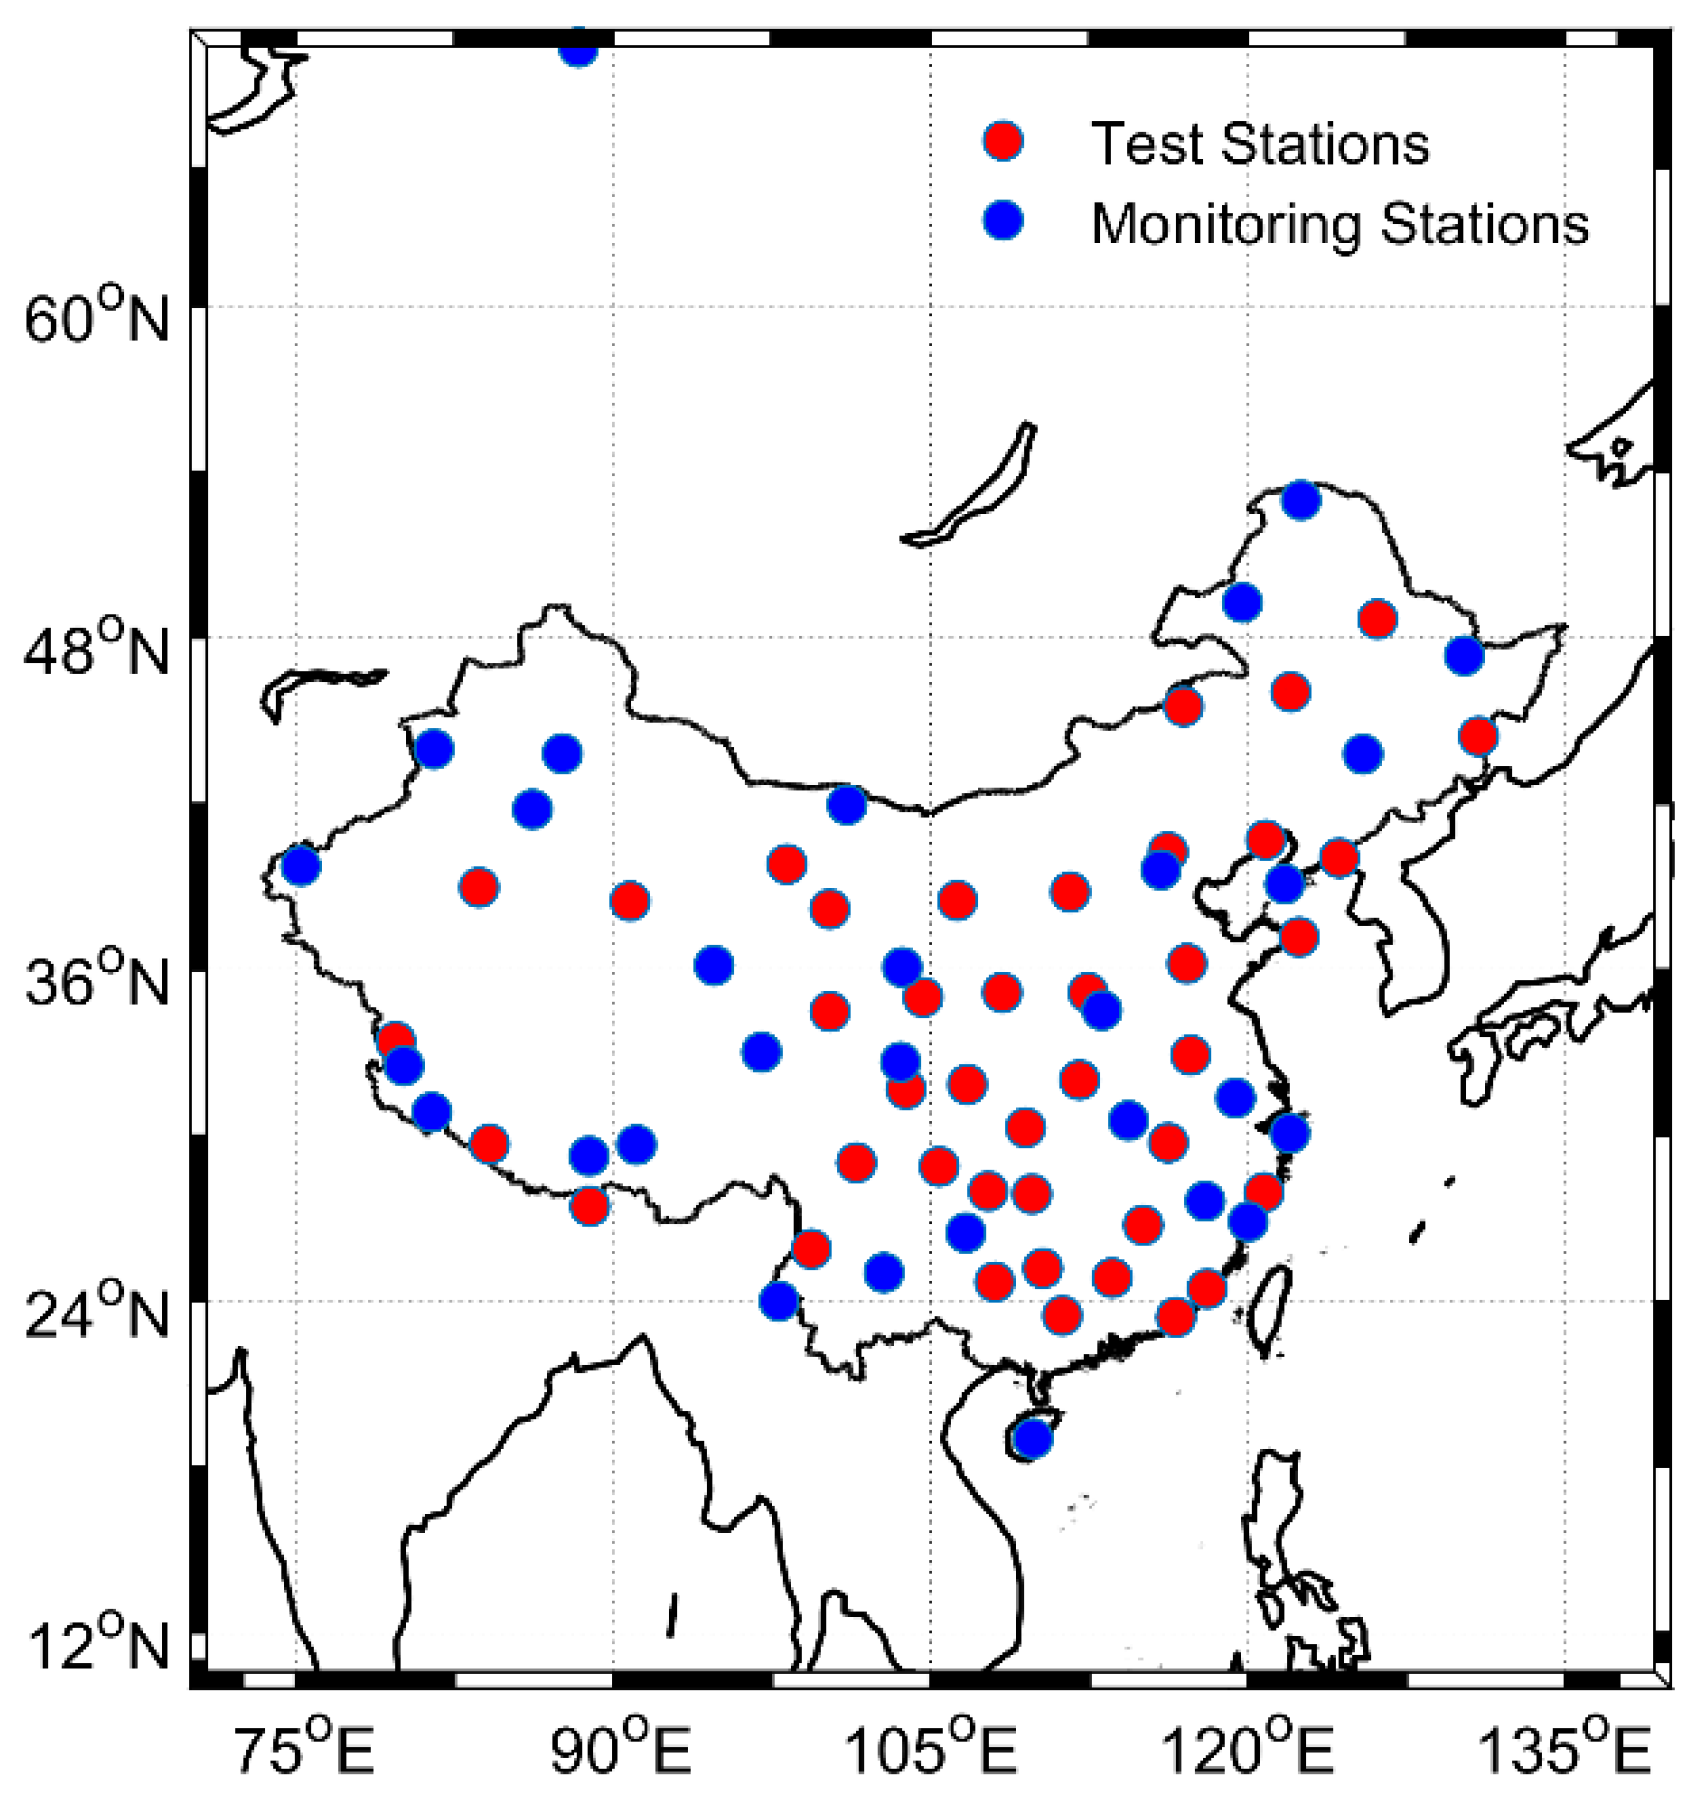
Figure 1. Locations of regional 30 monitoring stations and 42 validation stations around China.
Remotesensing 12 01215 g001
Figure 2. Locations of global 26 monitoring stations and 62 validation stations around the world.
Remotesensing 12 01215 g002
Figure 3. Root-mean-square (RMS) errors of three ionospheric models relative to the GPS slant total electron contents (STEC) of regional validation stations during DOY 171–130, 2019.
Remotesensing 12 01215 g003aRemotesensing 12 01215 g003b
Figure 4. Correction ratio of three ionospheric models relative to GPS STEC of regional validation stations during Day of Year (DOY) 171–130, 2019.
Remotesensing 12 01215 g004
Figure 5. Statistical errors of three ionospheric models relative to GPS STEC of regional validation stations during DOY 101~199, 2019.
Remotesensing 12 01215 g005
Figure 6. Variation in different ionospheric models’ errors with the local time for DOY 101~199, 2019.
Remotesensing 12 01215 g006
Figure 7. RMS errors of three ionospheric models relative to the GPS STEC of global validation stations during DOY 171–130, 2019.
Remotesensing 12 01215 g007
Figure 8. Correction ratio of three ionospheric models relative to the GPS STEC of global validation stations during DOY 171–130, 2019.
Remotesensing 12 01215 g008
Figure 9. The statistical errors of three ionospheric models relative to the GPS STEC of global validation stations during DOY 101~199, 2019.
Remotesensing 12 01215 g009
Figure 10. Daily bias, STD, RMS, and the correction ratio of three models from DOY 101–199, 2019.
Remotesensing 12 01215 g010
Figure 11. Statistical errors of different ionospheric models relative to CODE VTEC for DOY 101–199, 2019.
Remotesensing 12 01215 g011
Table 1. Monthly averaged errors and correction ratio of three ionospheric models relative to the GPS STEC from April to July 2019.
PeriodKlobucharBDGIMNTCM-BC
BiasSTDRMSCorBiasSTDRMSCorBiasSTDRMSCor
April7.667.8111.1558.56.145.528.3258.10.074.044.0880.5
May6.977.5610.5559.44.425.987.5961.60.054.614.6377.4
June6.315.778.7057.42.494.085.1368.10.113.373.3979.8
July5.634.767.5855.61.633.614.3471.60.043.303.3179.7
Notes: Cor, the correction ratio. In this paper, the unit of bias, STD, and RMS is TECU, and the unit of correction ratio is %.
Table 2. Monthly averaged errors and correction ratio of three ionospheric models relative to GPS STEC from April to July 2019.
PeriodKlobucharBDGIMNTCM-BC
BiasSTDRMSCorBiasSTDRMSCorBiasSTDRMSCor
April7.575.6210.0051.23.934.686.3363.30.023.704.1671.9
May7.185.259.3652.12.205.035.9464.80.133.623.9671.8
June6.984.178.3150.70.823.694.7662.50.252.953.2473.1
July6.793.878.0450.40.173.494.6461.10.332.863.0673.1
Notes: Cor, the correction ratio. In this paper, the unit of bias, STD and RMS is TECU, and the unit of correction ratio is %.
Table 3. Averaged statistical values of different models relative to GPS STEC and the Center for Orbit Determination in Europe (CODE) vertical TEC (VTEC) in the global region during DOY 101~199, 2019.
ModelsGPS STECCODE VTEC
BiasSTDRMSCorBiasSTDRMSCor
Klobuchar6.984.938.9252.93.913.555.3361.7
BDGIM1.694.645.4864.10.572.682.9269.8
NTCM-BC0.203.373.6772.7-0.872.402.5872.6
Notes: Cor, the correction ratio. In this paper, the unit of bias, STD and RMS is TECU, and the unit of correction ratio is %.