Article

Evaluation of Global Solar Irradiance Estimates from GL1.2 Satellite-Based Model over Brazil Using an Extended Radiometric Network

by
Anthony C. S. Porfirio
*,
Juan C. Ceballos
,
José M. S. Britto
and
Simone M. S. Costa
Satellite and Environmental System Division, Center for Weather Forecast and Climate Studies, National Institute for Space Research, Cachoeira Paulista, SP 12630-000, Brazil
*
Author to whom correspondence should be addressed.
Remote Sens. 2020, 12(8), 1331; https://doi.org/10.3390/rs12081331
Submission received: 4 February 2020 / Revised: 6 March 2020 / Accepted: 11 March 2020 / Published: 23 April 2020
(This article belongs to the Special Issue Satellite Images for Assessing Solar Radiation at Surface)

Abstract

:
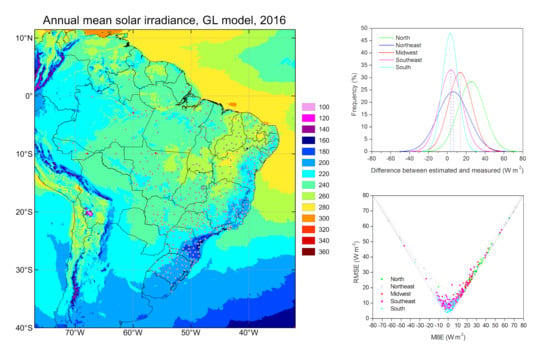
The GL (GLobal radiation) physical model was developed to compute global solar irradiance at ground level from (VIS) visible channel imagery of geostationary satellites. Currently, its version 1.2 (GL1.2) runs at Brazilian Center for Weather Forecast and Climate Studies/National Institute for Space Research (CPTEC/INPE) based on GOES-East VIS imagery. This study presents an extensive validation of GL1.2 global solar irradiance estimates using ground-based measurements from 409 stations belonging to the Brazilian National Institute of Meteorology (INMET) over Brazil for the year 2016. The INMET reasonably dense network allows characterizing the spatial distribution of GL1.2 data uncertainties. It is found that the GL1.2 estimates have a tendency to overestimate the ground data, but the magnitude varies according to region. On a daily basis, the best performances are observed for the Northeast, Southeast, and South regions, with a mean bias error (MBE) between 2.5 and 4.9 W m−2 (1.2% and 2.1%) and a root mean square error (RMSE) between 21.1 and 26.7 W m−2 (10.8% and 11.8%). However, larger differences occur in the North and Midwest regions, with MBE between 12.7 and 23.5 W m−2 (5.9% and 11.7%) and RMSE between 27 and 33.4 W m−2 (12.7% and 16.7%). These errors are most likely due to the simplified assumptions adopted by the GL1.2 algorithm for clear sky reflectance (Rmin) and aerosols as well as the uncertainty of the water vapor data. Further improvements in determining these parameters are needed. Additionally, the results also indicate that the GL1.2 operational product can help to improve the quality control of radiometric data from a large network, such as INMET's. Overall, the GL1.2 data are suitable for use in various regional applications.

Graphical Abstract

1. Introduction

Accurate estimates of global solar irradiance at the ground level are essential for a variety of applications in meteorology, hydrology, agriculture, and renewable energy. Some examples are climate and global energy budget monitoring [1,2], evapotranspiration and crop yield modeling [3,4,5], and the need for expanding renewable energy sources, promoting investments in solar energy technologies [6,7].
The traditional way of solar radiation monitoring requires pyranometers installed at a meteorological/radiometric network. However, data accuracy depends on instrument type as well as on maintenance and calibration routines [8,9]. During the last decades, a considerable effort has been engaged towards increasing the number of automatic weather stations throughout the extended Brazilian territory. The main examples are the network of the Brazilian National Institute of Meteorology (INMET, see http://www.inmet.gov.br) and the network of Data Collection Platforms managed by National Institute for Space Research (INPE, see http://sinda.crn.inpe.br/PCD/SITE/novo/site/index.php). Stations operated by these governmental institutions have sensors for standard meteorological variables (atmospheric pressure, air temperature and humidity, precipitation, wind speed, and direction) as well as solar irradiance. It is worthwhile to note two additional radiometric networks: SONDA (Brazilian Environmental Data Organization System, see www.sonda.ccst.inpe.br/) and Solar Radiation Network (SolRad-Net, see https://solrad-net.gsfc.nasa.gov), with about 20 stations performing high quality measurements. Nevertheless, long and continuous time series of solar irradiance measurements are still scarce. A main reason for these shortcomings is the high cost of maintenance for long time periods, especially in developing countries with large territorial dimensions, such as Brazil.
Nowadays, solar irradiance estimation based on geostationary satellite data is one of the more effective and low cost options for monitoring extended regions, attaining long, continuous, and geographically detailed spatial–temporal coverage. Since the 1970s, several models have been developed (e.g., [10,11,12,13,14,15]). Models are currently classified into two main types: empirical and physical. The first ones are simpler to implement, being based on statistical fitting between satellite information (for instance reflectance and brightness temperature) and solar irradiance measured at the ground level (e.g., [10,12]). The second ones describe relationships between these variables by applying physical laws of radiative transfer in the atmosphere (e.g., [13,14]). These models require input information about atmospheric structure, which can be provided by climatology or numerical model outputs. Therefore, physical models ought to be able to tune proper parameterizations independently of ground truth data. Besides, semi-empirical models include features of both previous approaches (e.g., [16,17,18]). Reviews of satellite-based models can be found in Pinker et al. [19], Polo et al. [20], and Huang et al. [21]. Advances in algorithms and availability of long-term satellite data allowed the development of several satellite-derived solar radiation databases with regional and global coverage. A detailed list of available databases is presented by Vernay et al. [22] and Polo et al. [23].
There has been a continued effort of Brazilian researchers in providing accurate regional satellite-based information about solar radiation. Two different physical models are currently used: Brasil-SR [24] and GL [25]. The Brasil-SR model is an adaptation of the IGMK model [13]; it uses a two-stream approximation to the radiative transfer equation, static auxiliary database and GOES VIS radiances. Brasil-SR has been used to generate a Brazilian Atlas of Solar Energy, being useful as a reference for renewable energy studies [26,27]. Since 1998, the GL (GLobal radiation) model has been run at the Center for Weather Forecast and Climate Studies (CPTEC/INPE) generating solar irradiance fields at daily and monthly time scales with about 4 km resolution. It uses GOES-East VIS imagery covering South America and neighboring oceanic areas (see http://satelite.cptec.inpe.br/radiacao/).
GL model version 1.0 (GL1.0) used Meteosat VIS imagery and was applied to Northeast Brazil [28]. Comparison using ground data from two stations over a three-month period showed MBE varying between −6 and 7 W m−2 and a standard deviation of about 30 W m−2, for daily values. Successive improvements lead to GL1.2 version and continuous use of GOES imagery. Ceballos et al. [25] performed a validation against four-month ground data over 80 Brazilian stations equipped with Lycor pyranometers. The authors reported daily mean errors generally within ±10 W m−2 with standard deviations lower than 20 W m−2. The GL1.2 database has contributed to the validation of numerical weather prediction models and data assimilation systems [29,30], to climatological and environmental studies [31,32,33], to hydrological modeling [34], to potential evapotranspiration estimation [35] and, last but not least, to solar resource assessment [36].
Although numerous, the INMET spatial density is inhomogeneous across the country (being even lower in the Amazon region); nevertheless, the high data amount is a valuable source for validating satellite-based estimates. This article presents a comprehensive evaluation of GL1.2 model performance based on comparison with ground data from 409 INMET stations throughout Brazil for a complete year (2016). It differs from previous efforts (e.g., [25,28]; for others go to the publication tab at http://satelite.cptec.inpe.br/radiacao/) in several aspects, as the number of stations and the analysis of spatial characteristics of model performance. The results contribute to a better understanding of GL1.2 accuracy, to assess its confidence and to identify physical aspects that should be improved. A short overview of the model is presented in Section 2. Section 3 describes data and methods, while Section 4 shows validation results. A brief discussion of the model error sources is provided in Section 5. Conclusions and directions for future work are presented in Section 6.

2. GL Model Overview

The GL1.2 physical model (hereafter abbreviated to GL) can be applied to any geostationary satellite providing images in the visible interval (VIS). The algorithm using GOES-East VIS imagery is fully described in Ceballos et al. [25]; but a short overview is presented here in order to help further analysis of results. The GL model runs operationally at CPTEC/INPE; the time series covers more than 20 years of daily mean solar irradiance fields with 0.04° resolution. Some results are illustrated at the website http://satelite.cptec.inpe.br/radiacao/. The model was designed with a simplified but physically consistent structure describing shortwave solar radiation transfer in the Earth–atmosphere system. It splits solar spectrum in three intervals: ultraviolet (UV: 0.2−0.4 µm), visible (VIS: 0.4−0.7 µm), and near-infrared (NIR: 0.7−3.0 µm) and considers the relevant radiative transfer processes in each interval. Atmosphere is divided in two layers: troposphere (below 17 km) and stratosphere (above 17 km). The basic model hypotheses are (i) within the UV interval, stratospheric ozone O3 has strong absorption and attenuates direct solar beam; Rayleigh scattering in the stratosphere and O3 absorption in the troposphere are neglected; (ii) within the VIS interval, the somewhat weak absorption of O3 Chappuis band is accounted for in the stratosphere, but main tropospheric processes are considered conservative (not absorptive) and limited to scattering; (iii) within the NIR interval, Rayleigh (air) and Mie (aerosol) scattering are negligible, so that solar radiation is constrained to direct solar beam passing between clouds, partially attenuated by water vapor (H2O) and carbon dioxide (CO2) absorption. Typical cloud is highly absorbent and reflective, so that cloud transmittance is neglected. SBDART radiative transfer code [37] was used to test and justify these statements.
Each pixel in GOES VIS images provides spectral radiance Lλ, allowing to define a reflectance factor F and assess local planetary reflectance RpVIS as follows:
R p V I S = π L λ μ o S λ = F μ o
where Sλ is the spectral solar constant within satellite VIS band and µo is the cosine of the solar zenith angle. This is the basic information used by GL to assess global irradiance at ground level. Given the abovementioned hypotheses, UV−VIS irradiance at ground level (GUVVIS) is estimated as a simple tropospheric radiation balance, which is expressed as
μ o S o U V V I S T 3 ( μ o ) = μ o S o U V V I S R p V I S T 3 ( μ s ) + A U V V I S + ( 1 R g V I S ) G U V V I S
where SoUVVIS is the solar constant within the UV−VIS interval, T3 refers to stratospheric O3 transmittance, AUVVIS is the absorbed UV−VIS irradiance in the troposphere, RgVIS is the typical ground reflectance in the VIS interval, and µs is the satellite zenith angle. RpVIS is estimated following Equation (1) but applies to the whole UV−VIS interval. Ozone transmittance follows parameterization of Lacis and Hansen [38]. Note that Equation(2) assumes that cloud and ground reflectances have constant values throughout the UV−VIS interval, as well as proposes a non-absorption troposphere. Reflectances RpVIS and RgVIS appear as main parameters in Equation (2).
Near-infrared irradiance GNIR is defined as
G N I R = μ o ( S o N I R Δ S ) ( 1 C ) ( 1 C R c N I R R g N I R )
where SoNIR is the solar constant within the NIR interval, ΔS accounts for the absorption due to H2O and CO2 so that the direct solar beam is partially attenuated, C is cloud cover and RgNIR and RcNIR are ground and cloud base reflectances in the NIR interval, respectively. Here, essential parameters are precipitable water (w2) and C cloud cover parameter.
Cloud cover estimation adopts an algorithm used by classical models as Heliosat 1 and 2 [12,15] and IGMK [13], but with different interpretation, applied to reflectance as seen by satellite VIS channel, as follows
C = ( R p V I S R min ) ( R max R min )
where Rmin stands for a typical cloudless reflectance and Rmax is a convenient upper threshold. Traditionally, other models use radiance (or reflectance) as the variable in Equation (4) to determine a cloud index. Concerning the GL model, Equation (4) just estimates cloud cover itself, making sense for only cumuliform fields, being bounded by values of zero for cloudless conditions and one for overcast conditions. Using a cloud classification method, Ceballos et al. [25] found a threshold Rmax = 0.46 for transition of brightness between cumuliform and stratiform cloud fields. As a matter of fact, only cumulus-type sizes are compatible with partial cloudiness in a pixel scale [39], although low brightness of cirrus cloud could induce an apparent partial cloud cover. Atmospheric situations showing reflectance higher than Rmax are interpreted as maximum cloudiness (C = 1).
The GL model estimates the global irradiance at ground level associated to a VIS image as a simple sum of UV−VIS and NIR irradiances,
G L = G U V V I S + G N I R
and daily mean solar irradiance (in W m−2) arising from a sequence of images is given by
G L d a y = d a y G L ( t ) d t 86400
The GL algorithm exhibits three potential shortcomings: (i) it does not consider absorption by atmospheric aerosol; (ii) cloud transmittance is assumed null in the NIR interval; (iii) it assumes water vapor content as well as Rmin = RgVIS = 0.09 being constant throughout Brazil. Assumptions would be physically sound when (i) aerosol exhibits low optical depth and single scattering albedo close to unity; (ii) cloud field is predominantly composed by cumulus clouds; (iii) cloud conditions are predominant. Anyway, note that assumed Rmin and w2 values are reasonably representative over large areas of Brazil. The present work is useful for identifying and quantifying the shortcomings and the overall performance of the GL model.

3. Data and Methods

3.1. GL Satellite Product

GOES-East imagery acquired and stored at the Satellite and Environmental System Division (DSA/CPTEC) are routinely processed by the GL model for producing spatial fields of global solar irradiance at ground level. The geographical coverage of the GL product is shown in Figure 1. GL data for the entire year of 2016 was generated using GOES-13 satellite VIS imagery (spectral range 0.53–0.71 µm), positioned at 75°W over the Equator. The specific scan adopted by GOES-13 for South American region is described by Costa et al. [32]. The VIS imagery has a temporal sampling interval of 30 min and a spatial resolution of 1 km at nadir, which is resampled to a grid size of 0.04°. The GL output product is distributed in a regular grid of 1800 × 1800 pixels with 0.04° resolution, between 50°S and 21.96°N latitudes and 100° and 28.04°W longitudes, in binary format. For a specific pixel, the GL irradiance value is the average within the 3 × 3 grid box. The GL data are generated for different time intervals: instantaneous (for each image), daily (daytime integration), and monthly (average of daily values). In this article, GL daily data were used.
To illustrate the applicability of the GL data, seasonal maps of solar irradiance patterns for the year 2016 are shown in Figure 2 (summer, DJF; autumn, MAM; winter, JJA; spring, SON). These maps were constructed from GL daily irradiance estimates. As expected, Figure 2 reveals a remarkable spatial–temporal variation of radiation levels, which in turn are modulated by cloudiness associated with the various weather systems occurring throughout the year. For example, in summer the highest values (280−300 W m−2, or 6.7−7.2 kWh m−2) were observed in the southwestern sector of the Northeast region and in the extreme south of the country; which are areas with low cloud cover during this season [40]. In contrast, the lowest values (200−260 W m−2 or 4.8−6.2 kWh m−2) occur in the northern part of the Northeast and in a large part of the North region. This behavior is mainly caused by the strong local convection as well as the cloudiness associated with the Intertropical Convergence Zone (ITCZ). In winter, the spatial distribution exhibits a strong north–south gradient, with minimum values occurring in the south region (120−140 W m−2 or 2.8−3.3 kWh m−2), while the maximums (260−280 W m−2 or 6.2−6.7 kWh m−2) are found in the northeast of the Amazon region and northwest part of the Northeast.

3.2. Ground Data

To understand the quality of the GL estimates over Brazil, a reasonably large number of ground stations is needed. The network of automatic weather stations operated by the INMET consists of around 470 stations where the global solar irradiance at ground level (G) has been regularly recorded. For this study, measurements of G for the year 2016 reported by the INMET surface stations are the main source of ground data. The location of the INMET ground stations is presented in Figure 1. It can be seen, on the one hand, that the ground stations are situated in areas with different land cover types and climatic zones (from semi-arid to subtropical and tropical regimes). On the other hand, its spatial distribution is not uniform and there is a low density of stations in important areas, such as over the Amazon region.
Two types of pyranometers are used by the INMET network for measuring G. Most stations are equipped with CM6B pyranometers and few stations have CMP6 pyranometers (both Kipp and Zonen instruments and compliant with ISO 9060 first class specification). Data are sampled every minute and the hourly values (irradiations in kJ m−2) are accessible at the website www.inmet.gov.br. INMET regional centers are responsible for maintaining the stations and the solar radiation sensors are calibrated approximately every 24 months (Edmundo W. M. Lucas, INMET, personal communication).
As mentioned in Section 1, Brazil possesses two networks with high quality measurements of G but with low density of stations: SolRad-Net and SONDA. These networks, recognized internationally as reference, have some stations relatively close to INMET stations, making it possible to perform a comparison between GL estimates and ground records obtained from the different networks. This analysis helps to test the applicability of INMET data. For this purpose, we used level 1.5 data (level 2.0 data were unavailable) from three SolRad-Net stations (distributed in the Amazon region) and five SONDA stations (distributed throughout Brazil). The SolRad-Net stations are Alta Floresta, Manaus_Embrapa, and Rio Branco and SONDA stations are Brasília, Natal, Palmas, Florianopólis, and Petrolina. The last two stations are included in the Baseline Surface Radiation Network (BSRN). Global solar irradiance at SolRad-Net and SONDA stations are measured using Kipp and Zonen CM 21 pyranometers (secondary standard). Pyranometric measurements have a sampling interval of 1-min and 2-min for SONDA and SolRad-Net stations, respectively. Overall uncertainties of G measurements should not exceed 5% [8,41]. Figure 1 shows the spatial distribution of all stations used in this study and Table 1 shows basic information of the monitoring networks.

3.3. Data Quality Control

According to Gueymard and Ruiz-Arias [42] there is no optimal or widely accepted quality control algorithm for ground radiation measurements, leading each institution/research to implement its own method, which effectively implies that some tests may be more stringent than others. Quality control procedures were performed to promote better conditions for the validation, as follows.
Initially, the negative G measurements or those above the upper limit of solar irradiance adopted by BSRN criterion for extremely rare values were removed [43]. Then, the daily average of the G measurements was calculated only for days with at least 70% valid data during the diurnal cycle. Daily datasets (both GL and ground) also were subjected to further quality tests. The daily values of GL and G should lie between 30 and 400 W m−2. Otherwise, it is flagged as questionable data and removed from the analysis. This approach allowed us to eliminate excessively high or low daily values. In addition, another procedure was conducted to remove outliers in order to generate more robust statistical results. Using the raw daily GL and G data, we found that the standard deviation of the difference was of the order of 25 W m−2 (not shown here). Thus, days with largest differences (outside ± 3 SDD, 75 W m−2) were removed. In the last procedure, visual inspections of annual evolution of the G daily values were performed, excluding stations with atypical data. Finally, the monthly averages were computed only when at least 21 valid daily values during a month were available. After quality checking, a total of 409 stations out of 473 were selected for the validation.

3.4. Performance Metrics and Analysis

The GL product was validated on a daily and monthly time scales through comparisons with ground-based data. In order to quantify the performance of GL satellite estimates, different statistical metrics were considered, like the mean bias error (MBE), the root mean square error (RMSE), and the standard deviation of the difference (SDD), which are calculated as follows:
M B E = 1 N i = 1 N ( G L i G i ) = 1 N i = 1 N ( E i )
R M S E = 1 N i = 1 N ( G L i G i ) 2
S D D = 1 N i = 1 N ( E i M B E ) 2 = R M S E 2 M B E 2
where GLi and Gi are, respectively, the satellite-derived and ground-based solar irradiance values and N is the total number of data samples. Additionally, the percentage of MBE and RMSE metrics were obtained by dividing them by the average of ground data. The MBE is a measure of systematic errors. A positive (negative) MBE value indicates the model tendency to overestimate (underestimate) the ground data; the RMSE is a measure of the overall variation between estimated and measured data, with lower values indicating better model performance; and the SDD indicates the level of spread of the differences around their mean value. The validation results are presented in terms of scatter plots, histograms, maps, linear regression parameters (slope and intercept), and the coefficient of determination (R2).
Initially, the GL estimates were compared with measurements taken at locations where there are both INMET and SONDA (or SolRad-Net) ground stations. This analysis allows verification of whether the model performance changes when compared to ground observations from different monitoring networks. Then, considering the INMET network as the source of reference data, an extensive comparison of GL data with ground observations from 409 stations was performed. Results were exhibited for each Brazilian region (North, Northeast, Midwest, Southeast, and South). These regional groups allow one to investigate the spatial variability of the accuracy of the GL product. Although it is recognized that not all stations within a specific region exhibit similar solar radiation patterns, this grouping was considered useful for the analysis. In addition, it is worthwhile to mention that similar regional quality in G data could be expected since INMET’s regional districts are responsible for station maintenance. It was also evaluated whether the GL data could help to identify stations with suspicious records. GL satellite data were compared with ground measurements from those and nearby stations (within a radius of 200 km). Comparisons between both datasets (satellite and ground) were performed by selecting the satellite pixel closest to each station location.

4. Results

4.1. Comparing GL with Two Ground-Based Reference Networks

The SONDA and SolRad-Net networks are internationally well known and provide high quality measurements for a limited number of stations over Brazil. These networks have records of solar irradiance from sensors with higher accuracy than those of the INMET network. Thus, it is convenient to compare the GL data with the three available ground-based datasets. The analysis aims to investigate if the accuracy of the model changes as a function of the ground reference network. In order to perform a proper comparison, locations that have stations of different networks and that are relatively close to each other were selected. The overall statistics are presented in Table 2. The distance between stations is given in the last column. Results show a predominance of positive MBE values, with higher MBE values for stations located in the North region. The exceptions, that are negative MBE values, occur at coastal stations (Florianópolis and Natal). Comparisons between GL/INMET and GL/SONDA (or SolRad-Net) do not seem to change the overall model performance. The results suggest that, at least in principle, INMET solar irradiance data have sufficient accuracy, thus, they will be used as ground reference in this study. However, it is probable that some INMET stations may have lower quality data due to the well-known problems related to maintenance and calibration of the sensors, especially because of the large number of stations.

4.2. Monthly Evaluation

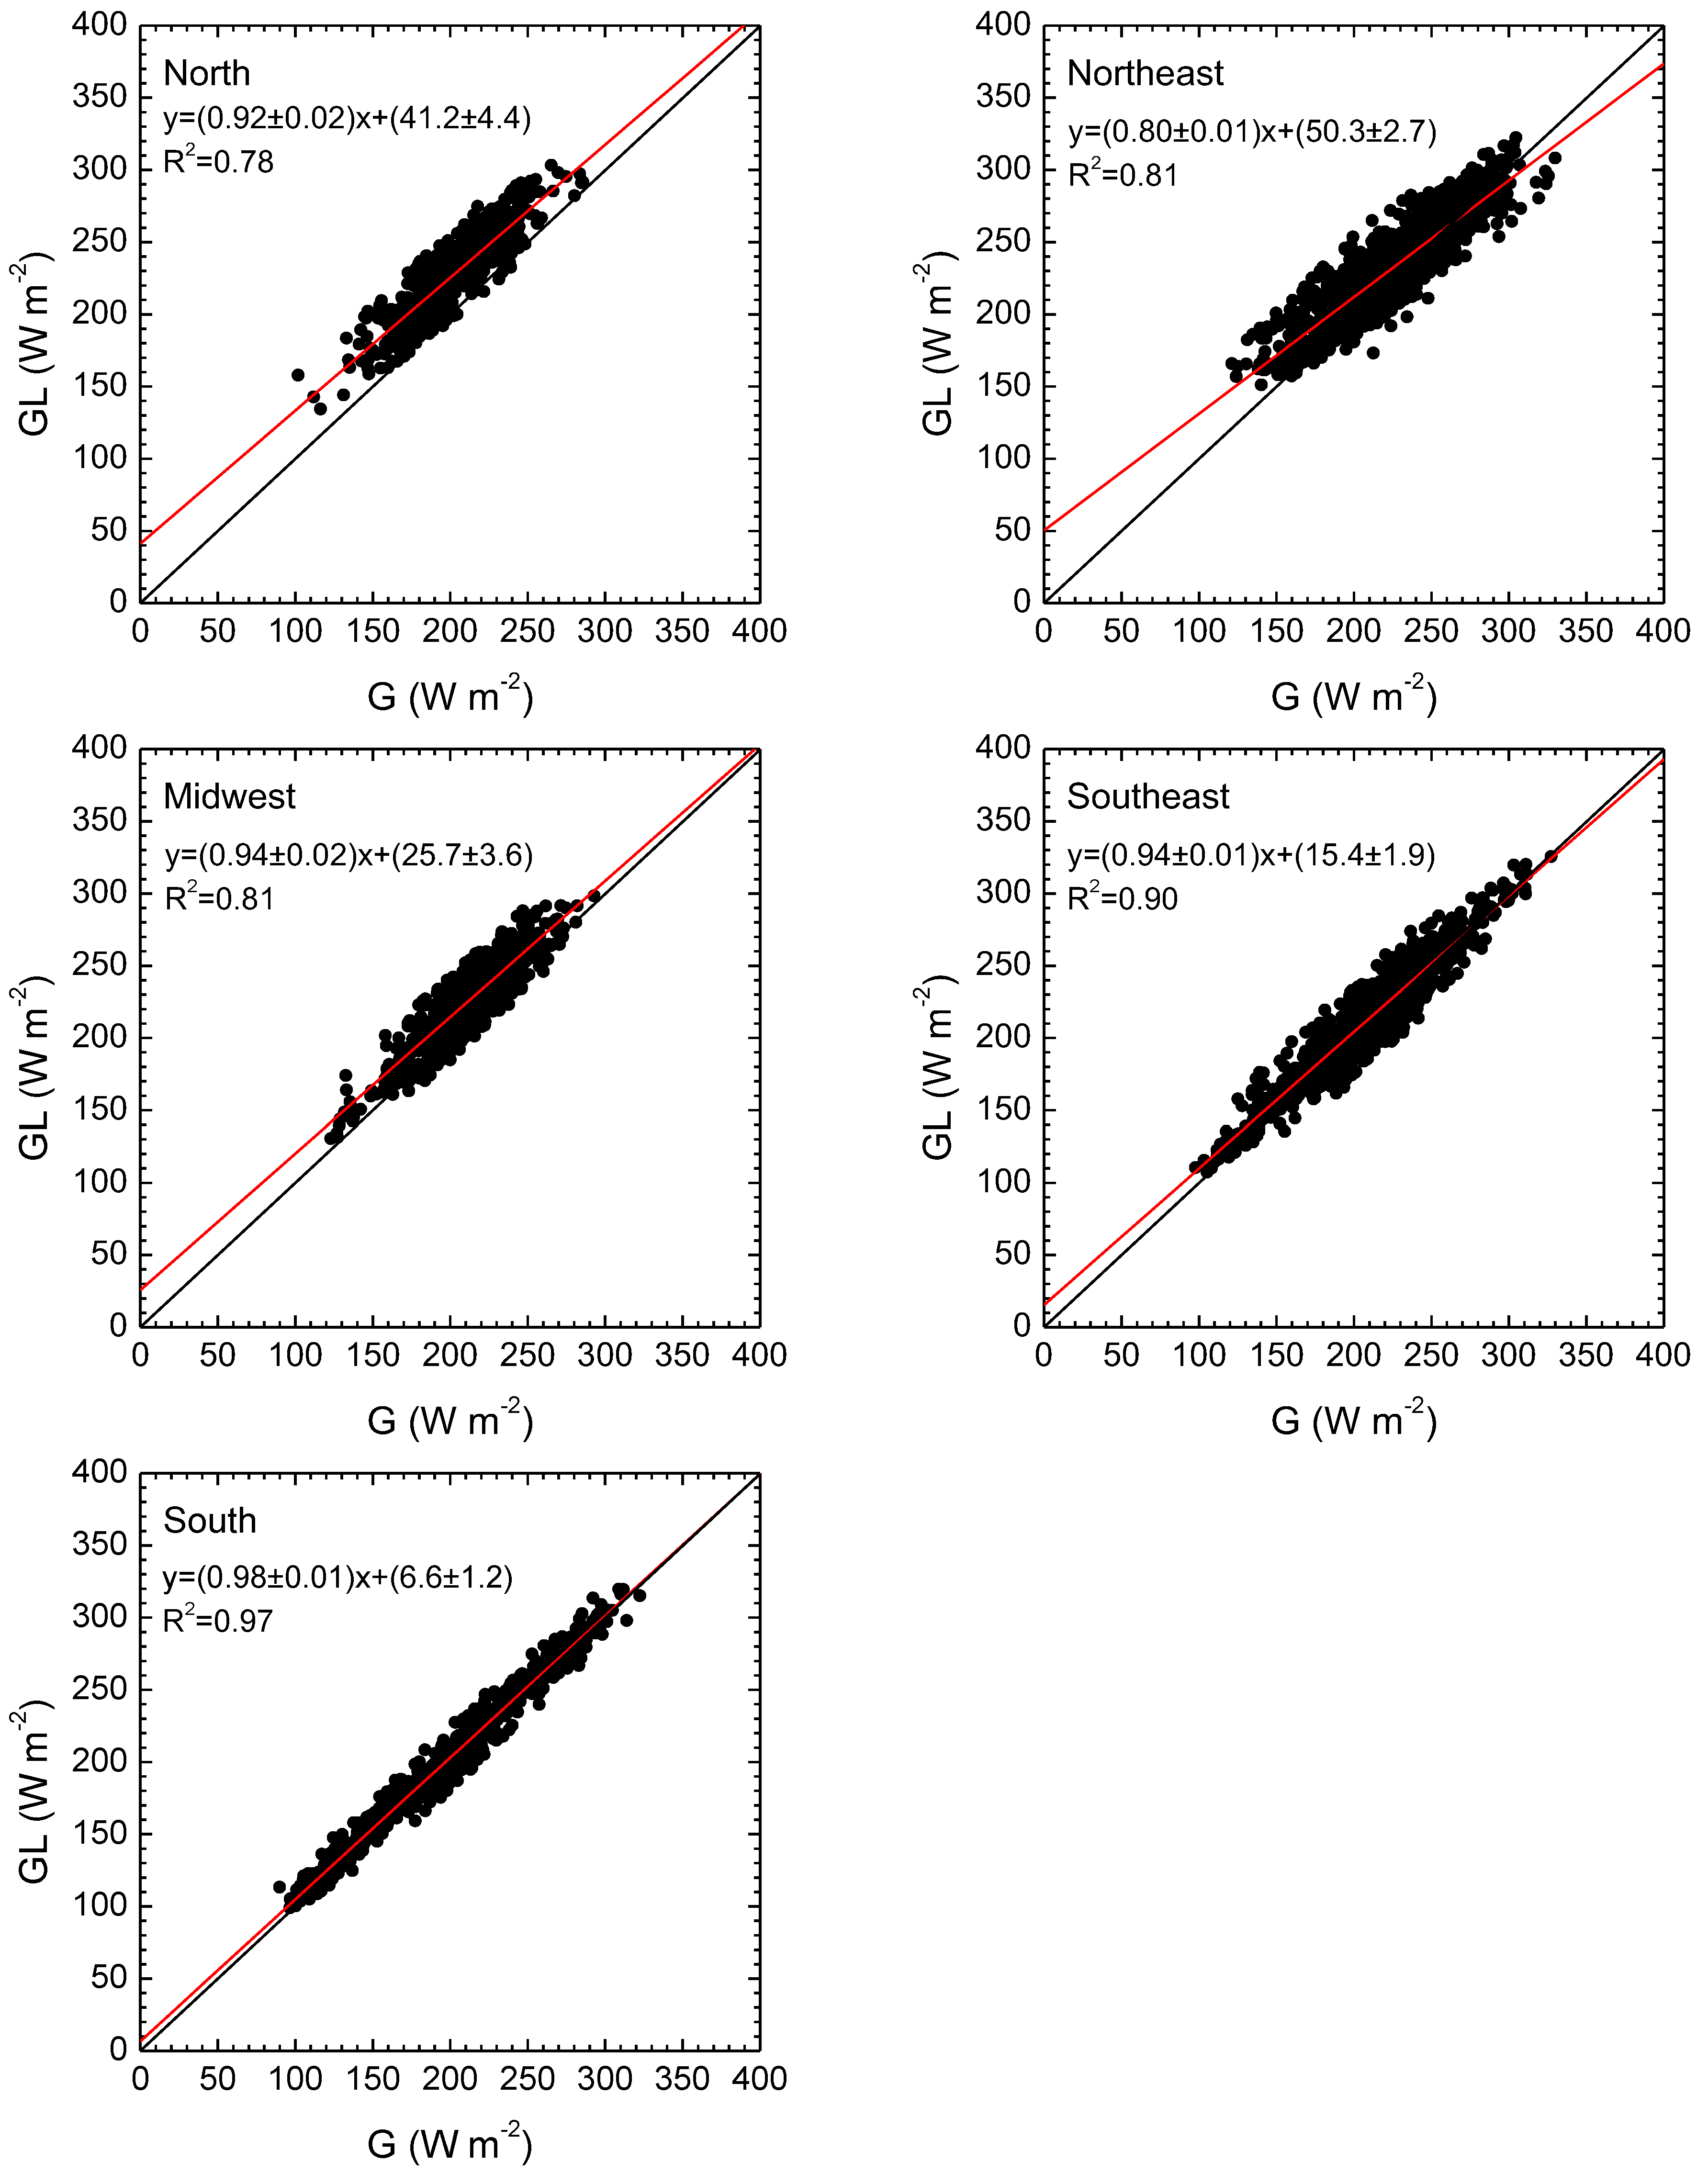
The number of stations used in this study allows assessment of the overall accuracy of the GL product for each region of Brazil. Results for the monthly values of measured and estimated global solar irradiance as well as the linear regression parameters between them are presented in Figure 3. It is evident that the GL data are symmetrically distributed around the 1:1 line (black line), especially for the Southeast and South regions, where the coefficient of determination is substantially high (ranging from 0.90 to 0.97). Most points are located above the diagonal line for the North and Midwest, indicating that the satellite-based estimates tend to overestimate the ground observations. For the Northeast region, there is a slightly higher dispersion of the datasets than that found in the other regions. However, the coefficients of determination for these three regions exhibited similar and reasonably high values (varying from 0.78 to 0.81), indicating a good agreement between the estimates and the observations.
Table 3 reports the statistical summary for the GL product evaluation at a monthly time scale. Results clearly show that the GL model overestimates the G measurements, but the magnitude of bias varies between regions. The best model performance was observed for south region, with average MBE of only 3.1 W m−2 (corresponding to 1.6%), RMSE of 8.8 W m−2, and SDD of 8.2 W m−2. In the Southeast region, the model shows a very similar MBE of 3.6 W m−2 (1.7%) and a slightly higher RMSE of 12.5 W m−2 (6%). GL data agree relatively well with measurements for Northeast region, showing a moderate MBE of 5.8 W m−2 (2.5%), RMSE of 16.6 W m−2 (7.2%), and the largest SDD (15.6 W m−2). By contrast, satellite data clearly overestimate the measured data in the Midwest and North regions, with the largest MBE values of 13.6 and 25.3 W m−2 and RMSE of 18.3 and 28.9 W m−2, respectively. The main error sources of the GL model will be discussed in Section 5.
A detailed comparison between different validation studies is a delicate task, especially due to the diversity of the datasets (satellite and ground measurements) and atmospheric conditions. However, a quantitative comparison (in terms of statistical metrics) allows a view of the performances obtained by various models. The results presented here reveal that the GL offers similar or better performance than the other models. Marie-Joseph et al. [44] validated the Heliosat-2 method using ground data from four stations in French Guiana and found MBE (RMSE) values between 18 and 23 W m−2 (31 and 35 W m−2). Ma and Pinker [45] compared UMD-SRB model data (version DX v3.3.3) with ground observations from 26 BSRN stations. The authors reported a MBE of -0.7 W m−2 and a SDD of 12.9 W m−2. Comparing the CMSAF SARAH dataset to ground measurements at 15 BSRN stations, Müller et al. [46] reported a mean MBE of 1.3 W m−2 and SDD of 7.3 W m−2.
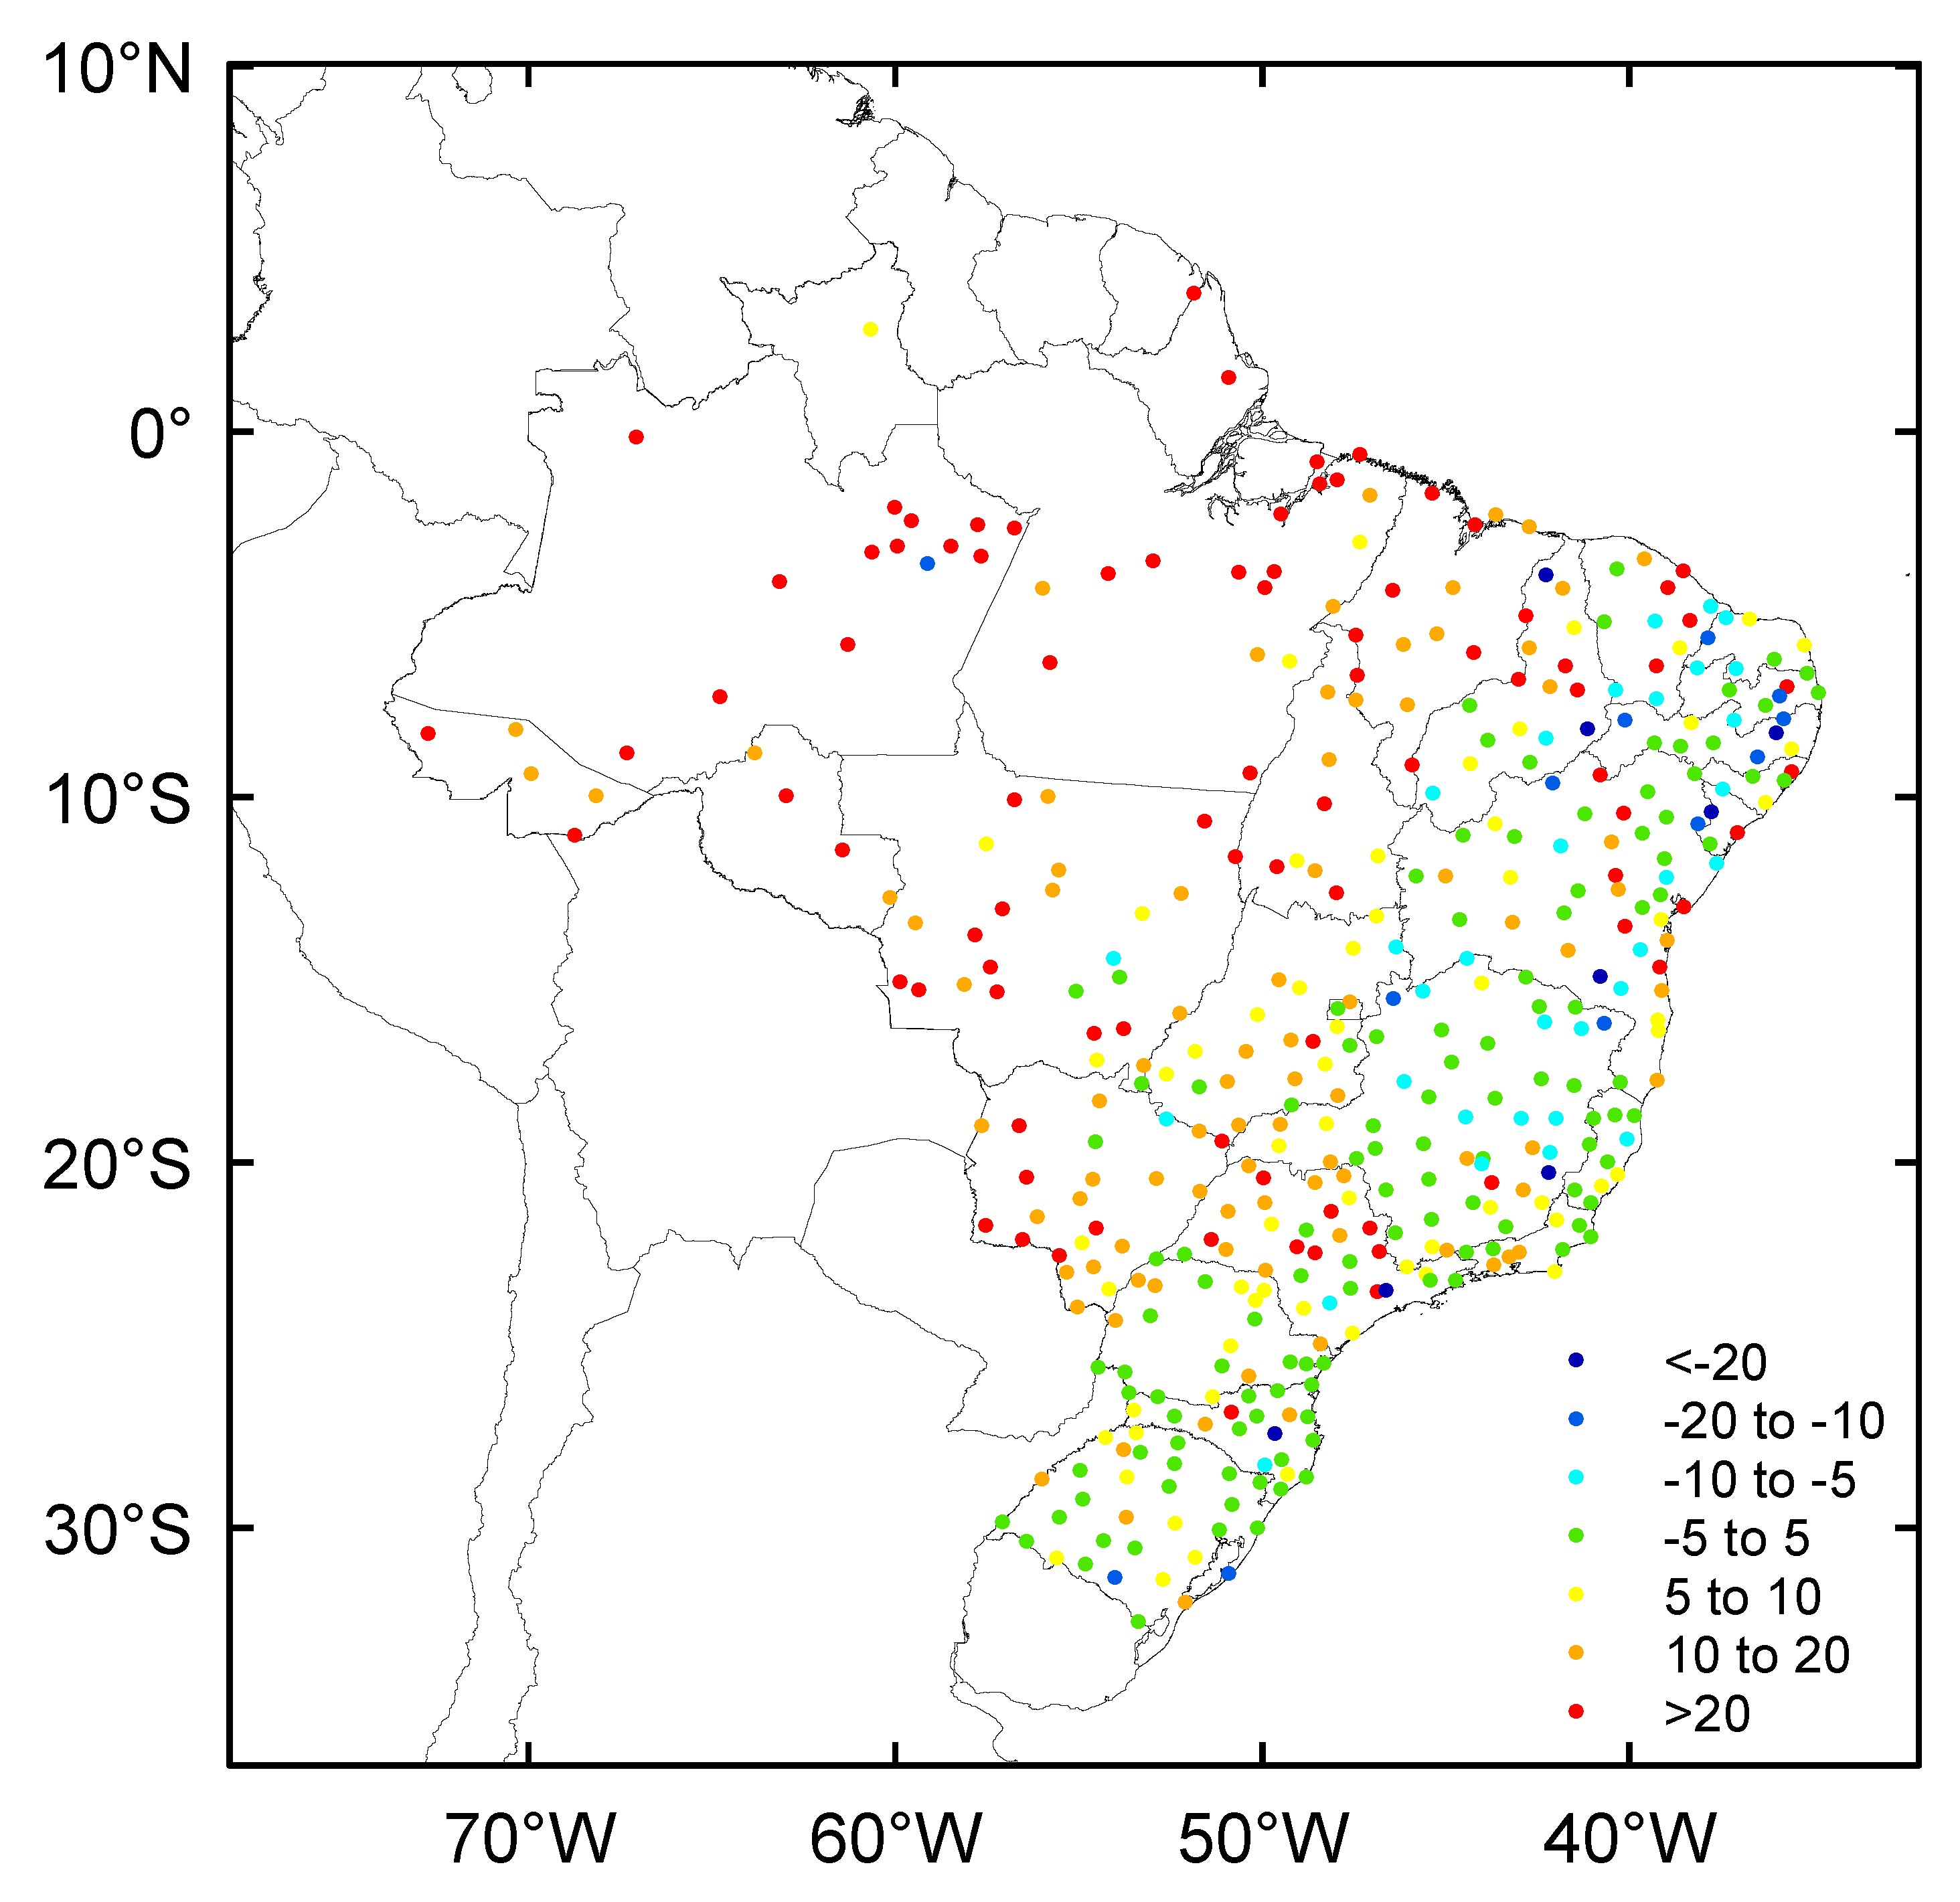
The spatial distribution of MBE for monthly mean solar irradiance estimates at each station is shown in Figure 4. It is noticed that there is a clear east–west gradient of MBE values. Most stations with MBE values above 10 W m−2 are located in the North, Midwest, and north part of the Northeast. On the other hand, stations with MBE values less than 10 W m−2 are mainly observed in the South, Southeast, and east part of the Northeast. Figure 5 allows a better evaluation of the model accuracy on the monthly scale. This figure compares two statistical measures (MBE and RMSE), station by station, and includes lines that represent the relationship between the MBE and RMSE measures assuming the SDD to be null (solid black line) and 10, 15, and 20 (dashed black lines). Results show that a large number of stations (52.6%) have MBE values between ±10 W m−2. Within this range, typical RMSE and SDD values were only 9.4 and 7.8 W m−2, respectively. An asymmetric distribution is observed, with a large fraction of stations showing positive MBE values. However, relatively larger errors (absolute MBE values above 30 W m−2) are seen in a small number of stations, less than 10%. Regarding the SDD, there is clearly a predominance for values below 15 W m−2 (95.4%), indicating that the uncertainties associated with the model seem to produce more systematic than random errors.
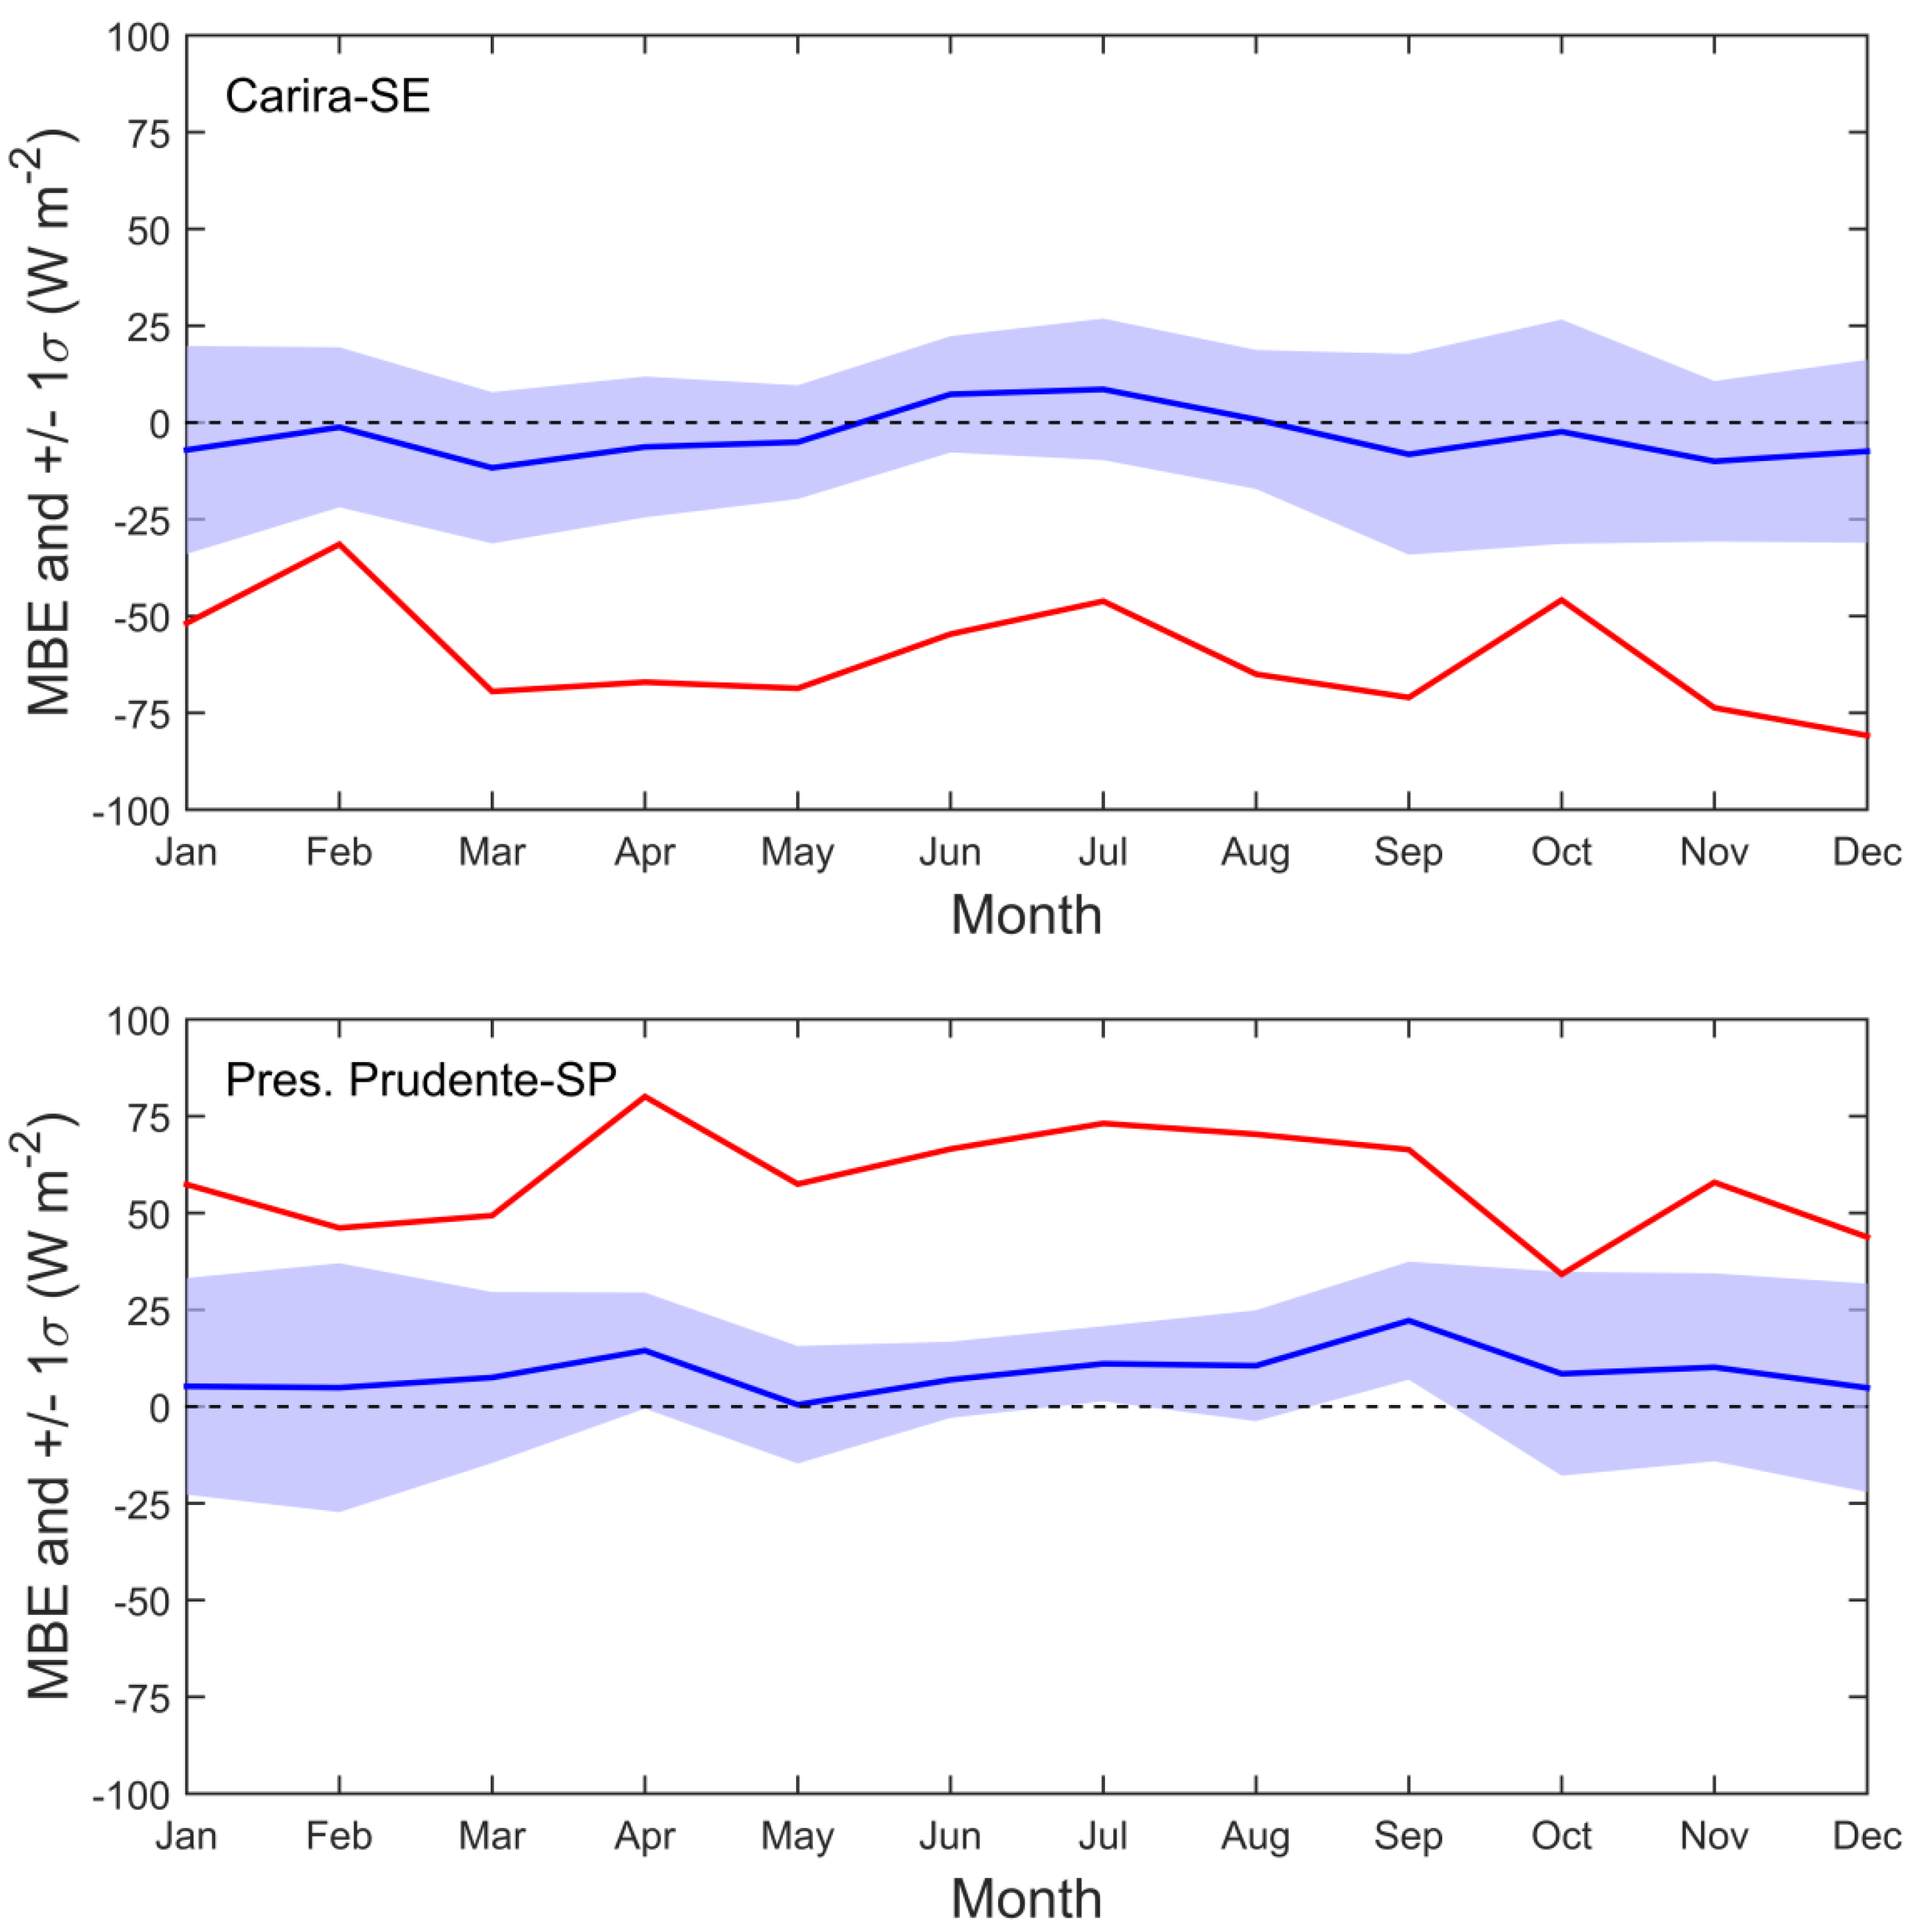
From Figure 5, some outliers in the datasets (around 3% of the stations) can be seen. Although outliers are not statistically representative, it is convenient to understand whether the reasons for these discrepancies are associated with the model or ground-based measurements. Figure 6 shows the monthly variation of MBE for two stations with anomalous behavior (red lines): Carira (10°24′ S, 37°44′ W, located in the Northeast) and Presidente Prudente (22°6′ S, 51°24′ W, located in the Southeast). Additionally, the figure includes the mean MBE value calculated using ground data from available stations within a radius of 200 km around the station (blue lines), surrounded by ±1 standard deviation (shaded region). There are remarkable differences between measured and estimated values throughout the year. For Carira station, a large underestimation is evidenced (MBE of −63 W m−2), while the opposite, large overestimation, is found for the Presidente Prudente station (MBE of 56.6 W m−2). However, the neighboring stations exhibit a good agreement between GL and ground data, with MBE of −3.5 and 8.8 W m−2, respectively. These results would suggest that:
(1) the systematic errors observed at both stations are mainly caused by measurement problems (e.g., improper maintenance or calibration);
(2) the quality control procedures used did not exclude all erroneous and/or suspicious data. Thus, it is convenient to evaluate the use of more rigorous procedures;
(3) on a monthly basis, GL estimates exhibit satisfactory accuracy, as can be seen in most stations;
(4) the GL database can be useful in identifying the stations with questionable data; critical information to those responsible for the management of the stations. Similar studies conducted by other researchers [47,48] have also demonstrated the applicability of satellite-based databases to detect stations with potential measurement problems.

4.3. Daily Evaluation

Focusing on evaluation of the GL performances on a daily basis, 107,712 samples of daily mean values during 2016 were considered. Density scatter plots comparing GL satellite-derived and measured data for each region of Brazil are shown in Figure 7. Colors represent the number of data pairs within a given range of solar irradiance values, while the black and red lines represent 1:1 relationship and linear fit, respectively. Summary statistics are presented in Table 4. It can be seen that the larger densities are distributed around the diagonal, especially for the South, Southeast, and Northeast regions (Figure 7), and the linear regression lines are close to 1:1 relationship (within 5%). For these regions, the GL model exhibits very good performance, with MBE values range from 2.5 to 4.9 W m−2, RMSE from 21.1 to 26.7 W m−2, and R2 from 0.81 to 0.95. For the other two regions, on the other hand, an evident overestimation of the ground data is found, with the MBE values ranging from 12.7 to 23.5 W m−2, RMSE 27−33.4 W m−2, and slightly lower R2 (0.86−0.87).
In general terms, these results are consistent with previous studies. Ma and Pinker [45] validated the UMD-SRB model, finding a MBE of 1.6 W m−2 and SDD of 33.2 W m−2. Xia et al. [49] compared the GSIP product estimates against daily ground measurements from two stations in San Antonio (Texas), and reported a mean MBE of 2.7 W m−2 and a large RMSE of 74 W m−2. Riihelä et al. [50] validated the SARAH data using ground observations performed at 17 stations in India. They pointed out that the SARAH overestimates the ground truth, with a MBE of 21.9 W m−2 and RMSE of 33.6 W m−2. In the validation study of CMSAF satellite-based radiation products on Europe conducted by Urraca et al. [51], a MBE (RMSE) of 0.7 W m−2 (17.6 W m−2) and of 4.5 W m−2 (18.1 W m−2) was found for the SARAH-JRC and CMSAF operational products, respectively. Finally, Porfirio et al. [52] performed a preliminary validation study of three satellite operational products over Brazil (GL, GSIP, and CMSAF) using ground data from 209 stations. They showed that the GL agrees better with the ground measurements, with a mean MBE of 2.6 Wm−2 and RMSE of 23.3 Wm−2, while the GSIP (MBE = −11.8 Wm−2 and RMSE = 35.3 W m−2) and CMSAF (MBE = 13.6 W m−2 and RMSE = 25.2 W m−2) products reveal larger deviations.
Additional analyses to provide further information on the reliability of the GL daily mean data are presented. Figure 8 shows histograms for four statistical parameters. MBE and RMSE values are grouped in 5 W m−2 size bins and for R2 in 0.05 size bins. The MBE distribution indicates that differences between the model and observations are within ±10 W m−2 in the vast majority of stations (approximately 70%), only accounting for less than 5% when assuming a typical daily mean irradiance of 210 W m−2. Figure 8 reveals that GL estimates produce a SDD (RMSE) of less than 25 W m−2 in 99% (78%) of the stations. The mean values were 21 and 25.9 W m−2 for the SDD and RMSE parameters, respectively. Still, the R2 values are high and with an average value of 0.90. These results confirm that the GL satellite product yields good performance over a large part of the Brazilian territory, for both daily and monthly time scales.

5. Discussion

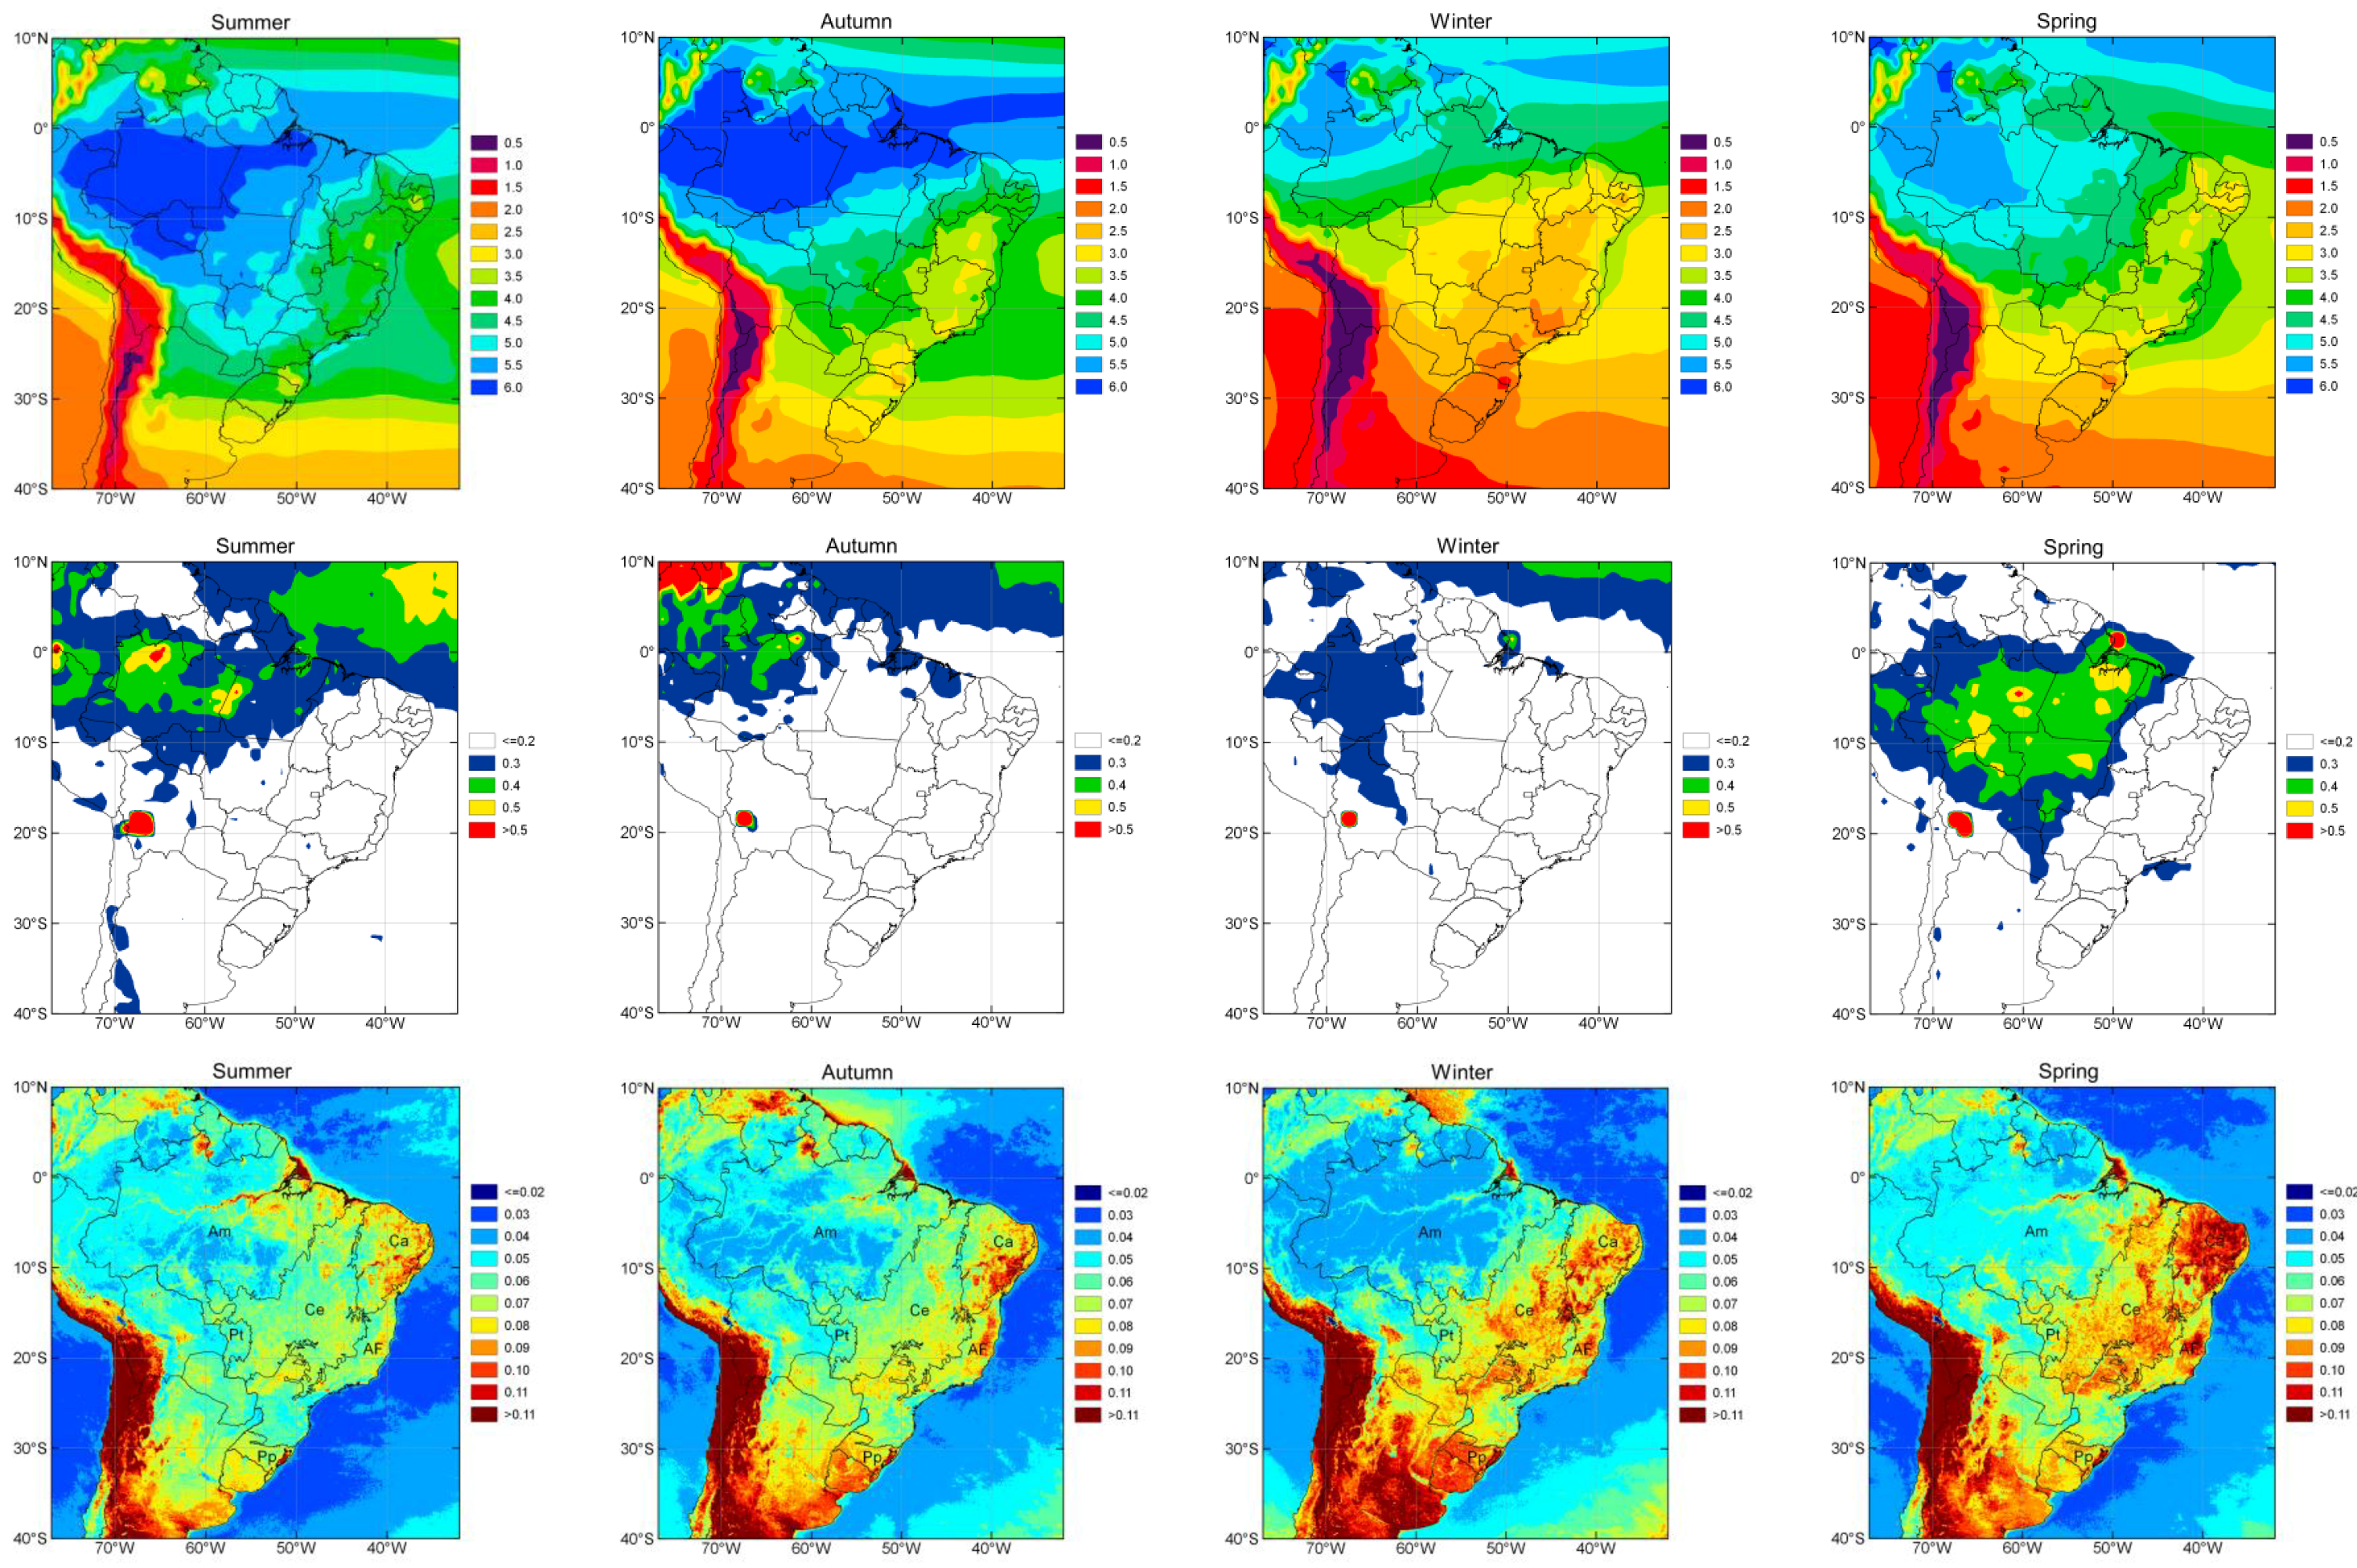
As shown in Section 4.2 and Section 4.3, the GL model exhibits good agreement overall with ground truth, but there is a spatial variation of the errors. In this context, some of the limitations and error sources in the model are discussed. It was mentioned in Section 2 that the GL makes use of simplifications for three relevant parameters for solar radiation modelling: water vapor and clear sky reflectance, with no spatial–temporal variations, as well as not properly modeling the aerosols; which leads to uncertainties. To better understand the potential impacts of the abovementioned simplifications, the seasonal cycle of w2, AOD, and Rmin (year 2016) are illustrated (Figure 9) and briefly discussed here.
The NCEP FNL Operational GLobal Analysis (ds083.2) data, available at 1° × 1° horizontal resolution, were used to construct the w2 fields. It can be observed that there is a notable seasonal variation over Brazil (Figure 9, upper panel); lower values occur in the extreme south during winter−spring (2−2.5 g cm−2) and semi-arid Northeast (2.5−3 g cm−2), while the largest values are seen in the Amazon region during summer−autumn (5−6 g cm−2). It is easy to note that the inaccurate determination of w2 can cause overestimation (underestimation) of G measurements when the adopted value of w2 is smaller (larger) than the real value. Differences in w2 of ±2 g cm−2 may lead to deviation of up to ±10 W m−2 in the daily mean irradiance for clear sky days.
With respect to aerosol, Figure 9 (middle panel) highlights areas where the AOD values are greater than the background aerosol loading (AOD < 0.2 at 0.55 µm). The seasonal AOD fields were generated from the monthly Aqua MODIS AOD product at 0.55 µm (MYD08_M3), available on the NASA website http://giovanni.gsfc.nasa.gov/giovanni/, with a 1° × 1° resolution. Note that there is a high correspondence between the areas with AOD > 0.2 and the areas where GL product exhibits the largest errors (see Figure 4). The results suggest that (1) at least part of the overestimation of the GL model in these areas could be explained by the aerosol influence, and major impacts on solar irradiance modeling should occur during the biomass burning season (August−October). Recent work by Porfirio [53] showed that high AOD conditions (=1.0) may result in errors up to 50 W m−2 in the daily mean irradiance; (2) on the other hand, the simple approach adopted by the GL algorithm for aerosols does not seem to introduce significant errors over a large part of Brazil.
Last but not least, the proper assessment of Rmin is a difficult task because it is strongly dependent on local surface characteristics. To generate the Rmin fields, GOES-13 satellite VIS imagery at 15:00 UTC were employed, assuming Rmin as the minimum reflectance value observed for a given pixel and time period. Figure 9 (lower panel) shows the Rmin seasonal variations, including the spatial limits of the main Brazilian biomes (Am, Amazon; Ca, Caatinga; Ce, Cerrado; Pt, Pantanal; AF, Atlantic forest; Pp, Pampas). As expected, the seasonal variation of Rmin is high as well as between biomes; for example; Rmin values range from 0.06 to 0.09 in the autumn and increase to 0.07−0.11 in the spring for the Cerrado biome. It is worth noting that an overestimation of Rmin leads to an underestimation of cloud cover C (Equation (4)), implying an overestimation of ground solar irradiance by the GL model, and vice versa. It seems likely that some of the model errors on the Amazon region and surrounding areas are due to the inaccurate Rmin values. Note that the Rmin values for these areas are typically less than 0.06, which may lead to deviations of up to 10 W m−2. Ortega et al. [36] validated the GL data against ground observations in Chile and reported that the model agrees fairly well with the ground truth, but larger differences can be observed during the winter months. These authors pointed out that the inaccurate Rmin value over areas with high reflectance (snow covered) may partially explain those errors.
In summary, the results suggest that more accurate approaches for w2, aerosols, and Rmin are needed to improve model performance, especially in the Amazon region and neighboring areas. Ongoing studies are expected to address these issues. Nevertheless, overall the GL product yields accurate solar irradiance estimates at the regional scale.

6. Conclusions

The GL1.2 physical model runs operationally at the CPTEC/INPE for estimating global solar irradiance at the surface (with 4 km spatial resolution) over South America and adjacent oceans based on GOES-East visible channel imagery. Although adopting some simplified assumptions, the model has a solid physical basis and does not rely on empirical relationships. In this study, we validated the GL1.2 estimates using a year (2016) of ground-based radiometric measurements from INMET’s extensive network of automatic weather stations over Brazil (409 stations) as reference. The large dataset allows us to better understand the spatial model performance.
Validation results show generally good agreement between satellite estimates and ground observations, but the accuracy levels clearly changed for each region. The best performances are seen for South, Southeast, and Northeast regions, with MBE 2.5−4.9 W m−2 (1.2%−2.1%) and RMSE 21.1−26.7 W m−2 (10.8%−11.8%), for daily data; and with MBE 3.1−5.8 W m−2 (1.6%−2.5%) and RMSE 8.8−16.6 W m−2 (4.5%−7.2%), for monthly data. These MBE values are lower than the typical uncertainty of 5% expected for radiometric measurements, which demonstrates the quality of the GL data. The largest errors occur in the Central-West and North regions, where the MBE and RMSE values increase to 12.7−23.5 W m−2 (5.9%−11.7%) and 27−33.4 W m−2 (12.7%−16.7%) (daily); and to 13.6−25.3 W m−2 (6.3%−12.6%) and 18.3−28.9 W m−2 (8.5%−14.3%) (monthly), respectively. The standard deviations of the difference are between 20.9−24.9 W m−2 (daily) and 8.2−15.6 W m−2 (monthly), for all regions. The possible reasons for the shortcomings (discussed in Section 5) are the simplified approach for the clear sky reflectance (Rmin) and aerosols as well as the uncertainty of the w2 input data. Improvements of the original GL algorithm for these issues should be addressed in future versions. In addition, the use of GOES-16 ABI multi-spectral data in improved GL versions will be highly relevant.
An additional analysis was carried out. High quality measurements from SONDA and SolRad-Net stations located close to INMET stations were employed to investigate whether there is variation in the model quality due to comparisons with ground records from different monitoring networks. These two networks have a limited number of stations in Brazil. The intercomparison revealed similar statistical errors of GL estimates for the different monitoring networks, highlighting the usefulness of the INMET dataset for the regional satellite product validation. On the other hand, the findings show that GL data can help to identify stations with suspicious records, which is especially valuable for network management purposes with a high number of stations as well as for qualifying ground datasets.
In summary, this study demonstrates the accuracy and reliability of the GL satellite-derived solar irradiance data (daily and monthly means) and shows that they can be useful for regional applications, from climate to solar energy studies. Lastly, the GL dataset has the advantage of a long time series (1998–2019) with high spatial resolution and temporal continuity.

Author Contributions

Conceptualization, A.C.S.P., J.C.C. and S.M.S.C.; Data acquisition and analysis, A.C.S.P. and J.M.S.B.; Writing—Original Draft Preparation, A.C.S.P.; all authors contributed to the discussion, review, and editing. All authors have read and agreed to the published version of the manuscript.

Funding

The first author acknowledges the financial support of the National Council for Scientific and Technological Development (CNPq) and Coordination for the Improvement of Higher Education Personnel (PNPD/CAPES, process number 317517/2019-01). The APC was funded by the Graduate Program in Meteorology of INPE.

Acknowledgments

The authors would like to thank the INMET, SONDA and SolRad-Net networks for generously providing solar radiation data. They also thank the DSA/CPTEC for providing GOES satellite data and infrastructure for the development of this research. We also appreciate the anonymous reviewers for their valuable comments that helped to improve the article.

Conflicts of Interest

The authors declare no conflict of interest.

Abbreviations

ABIAdvanced Baseline Imager
AODAerosol optical depth
BSRNBaseline Surface Radiation Network
CMSAFSatellite Application Facility on Climate Monitoring
CPTECCenter for Weather Forecast and Climate Studies
DJFDecember–February
DSASatellite and Environmental System Division
GMeasured global solar irradiance
GLGLobal radiation model
GOESGeostationary Operational Environmental Satellite
GSIPGOES Surface and Insolation Product
INMETBrazilian National Institute of Meteorology
INPENational Institute for Space Research
ITCZIntertropical Convergence Zone
JJAJune–August
MAMMarch–May
MBEMean bias error
MODISModerate Resolution Imaging SpectroRadiometer
NASANational Aeronautics and Space Administration
NCEPNational Centers for Environmental Prediction
NIRNear-infrared
R2Coefficient of determination
RMSERoot mean square error
SARAHSolar surfAce RAdiation Heliosat
SBDARTSanta Barbara DISORT Atmospheric Radiative Transfer model
SDDStandard deviation of the differences
SolRad-NetSolar Radiation Network
SONSeptember–November
SONDAEnvironmental Data Organization System
SRBSurface Radiation Budget
UMDUniversity of Maryland
UVUltraviolet
VISVisible

References

  1. Schulz, J.; Albert, P.; Behr, H.-D.; Caprion, D.; Deneke, H.; Dewitte, S.; Dürr, B.; Fuchs, P.; Gratzki, A.; Hechler, P.; et al. Operational climate monitoring from space: The EUMETSAT Satellite Application Facility on Climate Monitoring (CM-SAF). Atmos. Chem. Phys. 2009, 9, 1687–1709. [Google Scholar] [CrossRef] [Green Version]
  2. Trenberth, K.E.; Fasullo, J.T.; Kiehl, J. Earth’s Global Energy Budget. Bull. Am. Meteor. Soc. 2009, 90, 311–323. [Google Scholar] [CrossRef]
  3. Wang, K.; Wang, P.; Li, Z.; Cribb, M.; Sparrow, M. A simple method to estimate actual evapotranspiration from a combination of net radiation, vegetation index, and temperature. J. Geophys. Res. 2007, 112, D15107. [Google Scholar] [CrossRef]
  4. Bois, B.; Pieri, P.; Van Leeuwen, C.; Wald, L.; Huard, F.; Gaudillere, J.P.; Saur, E. Using remotely sensed solar radiation data for reference evapotranspiration estimation at a daily time step. Agric. For. Meteorol. 2008, 148, 619–630. [Google Scholar] [CrossRef] [Green Version]
  5. Abraha, M.G.; Savage, M.J. Comparison of estimates of daily solar radiation from air temperature range for application in crop simulations. Agric. For. Meteorol. 2008, 148, 401–416. [Google Scholar] [CrossRef]
  6. Martins, F.R.; Abreu, S.L.; Pereira, E.B. Scenarios for solar thermal energy applications in Brazil. Energy Policy 2012, 48, 640–649. [Google Scholar] [CrossRef]
  7. Polo, J.; Bernardos, A.; Navarro, A.A.; Fernandez-Peruchena, C.M.; Ramírez, L.; Guisado, M.V.; Martínez, S. Solar resources and power potential mapping in Vietnam using satellite-derived and GIS-based information. Energy Convers. Manag. 2015, 98, 348–358. [Google Scholar] [CrossRef]
  8. WMO. WMO-No. 8. In Guide to Meteorological Instruments and Methods of Observation, 7th ed.; WMO: Geneva, Switzerland, 2008. [Google Scholar]
  9. Sengupta, M.; Habte, A.; Kurtz, S.; Dobos, A.; Wilbert, S.; Lorenz, E.; Stoffel, T.; Renne, D.; Gueymard, C.; Myers, D.; et al. Best Practices Handbook for the Collection and Use of Solar Resource Data for Solar Energy Applications; NREL/TP-5D00-63112; National Renewable Energy Laboratory: Golden, Colorado, 2015. Available online: http://www.nrel.gov/docs/fy15osti/63112.pdf (accessed on 1 July 2019).
  10. Tarpley, J.D. Estimating incident solar radiation at the Earth’s surface from geostationary satellite data. J. Appl. Meteorol. 1979, 18, 1172–1181. [Google Scholar] [CrossRef] [Green Version]
  11. Gautier, C.; Diak, G.; Masse, S. A simple physical model to estimate incident solar radiation at the surface from GOES satellite data. J. Appl. Meteorol. 1980, 19, 1005–1012. [Google Scholar] [CrossRef] [Green Version]
  12. Cano, D.; Monget, J.M.; Aubuisson, M.; Guillard, H.; Regas, N.; Wald, L. A method for the determination of global solar radiation from meteorological satellite data. Sol. Energy 1986, 37, 31–39. [Google Scholar] [CrossRef] [Green Version]
  13. Stuhlmann, R.; Rieland, M.; Raschke, E. An improvement of the IGMK model to derive total and diffuse solar radiation at the surface from satellite data. J. Appl. Meteorol. 1990, 29, 586–603. [Google Scholar] [CrossRef] [Green Version]
  14. Pinker, R.T.; Laszlo, I. Modeling surface solar irradiance for satellite applications on a global scale. J. Appl. Meteorol. 1992, 31, 194–211. [Google Scholar] [CrossRef] [Green Version]
  15. Rigollier, C.; Lefevre, M.; Wald, L. The method Heliosat-2 for deriving shortwave solar radiation from satellite images. Sol. Energy 2004, 77, 159–169. [Google Scholar] [CrossRef] [Green Version]
  16. Perez, R.; Ineichen, P.; Moore, K.; Kmiecik, M.; Chain, C.; George, R.; Vignola, F. A new operational model for satellite-derived irradiances: Description and validation. Sol. Energy 2002, 73, 307–317. [Google Scholar] [CrossRef] [Green Version]
  17. Hammer, A.; Heinemann, D.; Hoyer, C.; Kuhlemann, R.; Lorenz, E.; Mueller, R.; Beyer, H.G. Solar Energy Assessment Using Remote Sensing Technologies. Remote Sens. Environ. 2003, 86, 423–432. [Google Scholar] [CrossRef]
  18. Janjai, S.; Laksanaboonsong, J.; Nunez, M.; Thongsathitya, A. Development of a method for generating operational solar radiation maps from satellite data for a tropical environment. Sol. Energy 2005, 78, 739–751. [Google Scholar] [CrossRef]
  19. Pinker, R.T.; Frouin, R.; Li, Z. A review of satellite methods to derive surface shortwave irradiance. Remote Sens. Environ. 1995, 51, 108–124. [Google Scholar] [CrossRef]
  20. Polo, J.; Zarzalejo, L.F.; Ramírez, L. Solar radiation derived from satellite images. In Modeling Solar Radiation at the Earth’s Surface, 1st ed.; Badescu, V., Ed.; Springer: Berlin/Heidelberg, Germany, 2008; pp. 449–461. [Google Scholar]
  21. Huang, G.; Ma, M.; Liang, S.; Liu, S.; Li, X. A LUT- based approach to estimate surface solar irradiance by combining MODIS and MTSAT data. J. Geophys. Res. 2011, 116, D22201. [Google Scholar] [CrossRef] [Green Version]
  22. Vernay, C.; Pitaval, S.; Blanc, P. Review of satellite-based surface solar irradiation databases for the engineering, the financing and the operating of photovoltaic systems. Energy Procedia 2014, 57, 1383–1391. [Google Scholar] [CrossRef]
  23. Polo, J.; Wilbert, S.; Ruiz-Arias, J.A.; Meyer, R.; Gueymard, C.; Súri, M.; Martín, L.; Mieslinger, T.; Blanc, P.; Grant, I.; et al. Preliminary survey on site-adaptation techniques for satellite-derived and reanalysis solar radiation datasets. Sol. Energy 2016, 132, 25–37. [Google Scholar] [CrossRef]
  24. Pereira, E.B.; Martins, F.R.; Abreu, S.L.; Couto, P.; Stuhlmann, R.; Colle, S. Effects of burning of Biomass on satellite estimations of solar irradiation in Brazil. Sol. Energy 2000, 68, 91–107. [Google Scholar] [CrossRef]
  25. Ceballos, J.C.; Bottino, M.J.; Souza, J.M. A simplified physical model for assessing solar radiation over Brazil using GOES 8 visible imagery. J. Geophys. Res. 2004, 109, D02211. [Google Scholar] [CrossRef]
  26. Pereira, E.B.; Martins, F.R.; Ruther, R.; Abreu, S.L. Atlas Brasileiro de Energia Solar, 1nd ed.; INPE: São José dos Campos, Brazil, 2006. [Google Scholar]
  27. Pereira, E.B.; Martins, F.R.; Gonçalves, A.R.; Costa, R.S.; Lima, F.J.L.; Ruther, R.; Abreu, S.L.; Tiepolo, G.M.; Pereira, S.V.; Souza, J.G. Atlas Brasileiro de Energia Solar, 2nd ed.; INPE: São José dos Campos, Brazil, 2017. [Google Scholar]
  28. Ceballos, J.C.; Moura, G.B.A. Solar Radiation Assessment Using Meteosat 4-VIS Imagery. Sol. Energy 1997, 60, 209–219. [Google Scholar] [CrossRef]
  29. Tarasova, T.A.; Fernandez, J.P.R.; Pisnichenko, I.A.; Marengo, J.A.; Ceballos, J.C.; Bottino, M.J. Impact of New Solar Radiation Parameterization in the Eta Model on the Simulation of Summer Climate over South America. J. Appl. Meteorol. Clim. 2006, 45, 318–333. [Google Scholar] [CrossRef] [Green Version]
  30. Gonçalves, L.G.G.; Shuttleworth, W.J.; Vila, D.; Larroza, E.; Bottino, M.J.; Herdies, D.L.; Aravequia, J.A.; Mattos, J.G.Z.; Toll, D.L.; Rodell, M.; et al. The South American Land Data Assimilation System (SALDAS) 5-Yr Retrospective Atmospheric Forcing Datasets. J. Hydrometeorol. 2009, 10, 999–1010. [Google Scholar] [CrossRef]
  31. Ceballos, J.C. Algunas características del régimen de radiación solar en Argentina, período 1996–2006. In Proceedings of the X Congreso Argentino de Meteorología (X Congremet), Buenos Aires, Argentina, 5–9 October 2009; pp. 1–8. [Google Scholar]
  32. Costa, S.M.S.; Negri, R.; Jezus, N.F.; Schmit, T.J.; Arai, N.; Lima, W.F.A.; Ceballos, J.C.; Rodrigues, J.V.; Machado, L.A.T.; Pereira, S.; et al. A Successful Practical Experience on Dedicated Geostationary Operational Environmental Satellites- GOES -10/12 Supporting Brazil. BAMS 2018, 99, 33–47. [Google Scholar] [CrossRef]
  33. Bradley, A.V.; Gerard, F.F.; Barbier, N.; Weedon, G.P.; Anderson, L.O.; Huntingford, C.; Aragão, L.E.O.C.; Zelazowski, P.; Arai, E. Relationships between phenology, radiation and precipitation in the Amazon region. Glob. Chang. Biol. 2011, 17, 2245–2260. [Google Scholar] [CrossRef]
  34. Pinto, L.I.C.; Costa, M.H.; Diniz, L.M.F.; Sediyama, G.C.; Pruski, F.F. Comparação de produtos de radiação solar incidente à superfície para a América do sul. Rev. Bras. Meteorol. 2010, 25, 469–478. [Google Scholar] [CrossRef]
  35. Bastos, E.J.B.; Souza, J.M.; Rao, T.V.R. Potential evapotranspiration estimates for Northeast Brazil using GOES-8 data. Rev. Bras. Eng. Agrícola Ambient. 2000, 4, 348–354. [Google Scholar] [CrossRef]
  36. Ortega, A.; Escobar, R.; Colle, S.; Abreu, S.L. The state of solar energy resource assessment in Chile. Renew. Energy 2010, 35, 2514–2524. [Google Scholar] [CrossRef]
  37. Ricchiazzi, P.; Yang, S.; Gautier, C.; Sowle, D. SBDART: A research and teaching software tool for plane-parallel radiative transfer in the Earth's atmosphere. Bull. Am. Meteor. Soc. 1998, 79, 2101–2114. [Google Scholar] [CrossRef] [Green Version]
  38. Lacis, A.A.; Hansen, J.E. A parameterization for the absorption of solar radiation in the Earth’s atmosphere. J. Atmos. Sci. 1974, 31, 118–133. [Google Scholar] [CrossRef]
  39. Porfirio, A.C.S.; Ceballos, J.C. A method for estimating direct normal irradiation from GOES geostationary satellite imagery: Validation and application over Northeast Brazil. Sol. Energy 2017, 155, 178–190. [Google Scholar] [CrossRef]
  40. INMET. Brazilian Climatological Normals 1981–2010. Brasília, Brazil; 2018. Available online: http://www.inmet.gov.br/portal/index.php?r= clima/normaisClimatologicas (accessed on 1 July 2019).
  41. Gueymard, C.A.; Myers, D.R. Solar radiation measurement: Progress in radiometry for improved modeling solar radiation at the earth’s surface. In Modeling Solar Radiation at the Earth's Surface, 1st ed.; Badescu, V., Ed.; Springer: Berlin/Heidelberg, Germany, 2008; pp. 1–27. [Google Scholar]
  42. Gueymard, C.A.; Ruiz-Arias, J.A.R. Extensive worldwide validation and climate sensitivity analysis of direct irradiance predictions from 1-min global irradiance. Sol. Energy 2016, 128, 1–30. [Google Scholar] [CrossRef]
  43. Long, C.N.; Dutton, E.G. BSRN Global Network Recommended QC Tests, V2.0. BSRN Technical Report (2002). Available online: http://ezksun3.ethz.ch/bsrn/admin/dokus/qualitycheck.pdf (accessed on 1 July 2019).
  44. Marie-Joseph, I.; Linguet, L.; Gobinddass, M.L.; Wald, L. On the applicability of the Heliosat-2 method to assess surface solar irradiance in the Intertropical Convergence Zone, French Guiana. Int. J. Remote Sens. 2013, 34, 3012–3027. [Google Scholar] [CrossRef] [Green Version]
  45. Ma, Y.; Pinker, R.T. Modeling shortwave radiative fluxes from satellites. J. Geophys. Res. 2012, 117, D23202. [Google Scholar] [CrossRef]
  46. Müller, R.; Pfeifroth, U.; Träger-Chatterjee, C.; Trentmann, J.; Cremer, R. Digging the METEOSAT Treasure—3 Decades of Solar Surface Radiation. Remote Sens. 2015, 7, 8067–8101. [Google Scholar] [CrossRef] [Green Version]
  47. Lefèvre, M.; Blanc, P.; Espinar, B.; Gschwind, B.; Ménard, L. The HelioClim-1 Database of Daily Solar Radiation at Earth Surface: An Example of the Benefits of GEOSS Data-CORE. IEEE J.-STARS 2014, 7, 1745–1753. [Google Scholar] [CrossRef] [Green Version]
  48. Urraca, R.; Gracia-Amillo, A.M.; Huld, T.; Martinez-de-Pison, F.J.; Trentmann, J.; Lindfors, A.V.; Riihelä, A.; Sanz-Garcia, A. Quality control of global solar radiation data with satellite-based products. Sol. Energy 2017, 158, 49–62. [Google Scholar] [CrossRef]
  49. Xia, S.; Mestas-Nuñez, A.M.; Xie, H.; Vega, R. An Evaluation of Satellite Estimates of Solar Surface Irradiance Using Ground Observations in San Antonio, Texas, USA. Remote Sens. 2017, 9, 1268. [Google Scholar] [CrossRef] [Green Version]
  50. Riihelä, A.; Kallio, V.; Devraj, S.; Sharma, A.; Lindfors, A.V. Validation of the SARAH-E Satellite-Based Surface Solar Radiation Estimates over India. Remote Sens. 2018, 10, 392. [Google Scholar] [CrossRef] [Green Version]
  51. Urraca, R.; Gracia-Amillo, A.M.; Koubli, E.; Huld, T.; Trentmann, J.; Riihelä, A.; Lindfors, A.V.; Palmer, D.; Gottschalg, R.; Antonanzas-Torres, F. Extensive validation of CM SAF surface radiation products over Europe. Remote Sens. Environ. 2017, 199, 171–186. [Google Scholar] [CrossRef] [PubMed] [Green Version]
  52. Porfirio, A.C.S.; Ceballos, J.C.; Enoré, D.P.; Costa, S.M.S. Validation of three satellite-based solar radiation products: Preliminary analysis over Northeast and South of Brazil. In Proceedings of the XX Congresso Brasileiro de Meteorologia (XX CBMET), Maceió, Brazil, 27–30 November 2018; pp. 1–6. Available online: https://www.researchgate.net/publication/339001756_VALIDATION_OF_THREE_SATELLITE-BASED_SOLAR_RADIATION_PRODUCTS_PRELIMINARY_ANALYSIS_OVER_NORTHEAST_AND_SOUTH_OF_BRAZIL (accessed on 3 February 2020). (In Portuguese).
  53. Porfirio, A.C.S. Uma Contribuição à Modelagem de Aerossol e Componentes da Radiação Solar No Modelo GL. Ph.D. Thesis, Brazilian National Institute of Space Research, São José dos Campos, Brazil, 2017; p. 99. [Google Scholar]
Figure 1. GL product domain and locations of all stations considered in this study: INMET stations are plotted in gray, SolRad-Net stations in red, and SONDA stations in blue. Bold numbers indicate the Brazilian regions (1=North; 2=Northeast; 3=Midwest; 4=Southeast; 5=South).
Remotesensing 12 01331 g001
Figure 2. Seasonal maps of daily mean global solar irradiance from the GL model for 2016.
Remotesensing 12 01331 g002
Figure 3. Scatter plots between GL model estimated and measured monthly mean solar irradiance for the five Brazilian regions, during 2016. The black line represents the 1:1 ratio and the red line represents the linear regression. The slope and intercept uncertainties are given.
Remotesensing 12 01331 g003
Figure 4. Spatial distribution of MBE for monthly mean irradiance between the GL model and ground data at INMET stations during 2016.
Remotesensing 12 01331 g004
Figure 5. Scatter plot of monthly RMSE versus MBE values. The lines represent the relationship between RMSE and MBE, computed assuming different SDD values (solid, SDD = 0; dashed, SDD = 10, 15, and 20).
Remotesensing 12 01331 g005
Figure 6. Temporal evolution of monthly MBE for two selected INMET stations during 2016 (red lines). The blue line is the monthly mean MBE value calculated considering ground data from surrounding stations (within 200 km radius), and the shaded region shows ± 1 standard deviation.
Remotesensing 12 01331 g006
Figure 7. Scatter density plots between GL model estimated and measured daily mean solar irradiance for the five Brazilian regions, during 2016. The black line represents the 1:1 ratio and the red line represents the linear regression. The slope and intercept uncertainties are given.
Remotesensing 12 01331 g007
Figure 8. Histograms for four statistical parameters: (a) R2, (b) MBE, and (c) SDD and RMSE.
Remotesensing 12 01331 g008
Figure 9. Seasonal maps of precipitable water (upper panel), AOD (middle panel), and Rmin (lower panel) for 2016.
Remotesensing 12 01331 g009
Table 1. Summary of the monitoring networks used in this study.
NetworkNumber of StationsTemporal ResolutionWebsite
INMET40960 minhttp://www.inmet.gov.br/
SONDA51 minhttp://sonda.ccst.inpe.br/
SolRad-Net31−2 minhttps://solrad-net.gsfc.nasa.gov/
Table 2. Summary statistics of the comparison between daily mean solar irradiance from the GL model data against INMET ground data and high quality SONDA or SolRad-Net ground data. The distance between stations is also shown.
Station NameNetworkMBE SDDDistance
W m−2%W m−2km
FlorianópolisINMET−2.8−1.622.010
SONDA/BSRN4.02.222.4
PetrolinaINMET---42
SONDA/BSRN0.00.016.5
NatalINMET4.92.117.94
SONDA−2.0−0.815.6
BrasíliaINMET3.01.420.030
SONDA5.82.618.8
PalmasINMET32.815.719.68
SONDA25.611.319.2
Alta FlorestaINMET22.911.023.024
SolRad-Net18.08.120.2
ManausINMET16.89.019.724
SolRad-Net17.19.522.4
Rio BrancoINMET16.28.125.732
SolRad-Net8.24.021.7
Table 3. Summary statistics of the comparison between GL satellite-derived and INMET ground data, on a monthly basis, over each Brazilian region.
RegionMean MBE RMSE SDDR2Valid Months
W m−2 W m−2% W m−2% W m−2
North201.1 25.312.6 28.914.3 13.90.78506
Northeast230.2 5.82.5 16.67.2 15.60.811184
Midwest214.1 13.66.3 18.38.5 12.30.81731
Southeast208.6 3.61.7 12.56.0 12.00.901079
South194.3 3.11.6 8.84.5 8.20.97725
Table 4. Summary statistics of the comparison between GL satellite-derived and INMET ground data, on a daily basis, over each Brazilian region.
RegionMeanMBE RMSE SDDR2Valid Days
W m−2W m−2%W m−2%W m−2
North199.723.511.733.416.723.70.8612,889
Northeast228.84.92.126.711.624.90.8131,074
Midwest213.112.75.927.012.723.90.8718,429
Southeast206.93.61.724.411.824.10.9027,396
South195.22.51.221.110.820.90.9517,924