Article

The Autonomous Underwater Vehicle Integrated with the Unmanned Surface Vessel Mapping the Southern Ionian Sea. The Winning Technology Solution of the Shell Ocean Discovery XPRIZE

1
Department of Navigation and Marine Hydrography, Faculty of Navigation and Naval Weapon, Polish Naval Academy, 81-127 Gdynia, Poland
2
Center for Coastal and Ocean Mapping, University of New Hampshire, Durham, NH 03824, USA
3
INFOMAR, Geological Survey of Ireland, D04 K7X4 Dublin, Ireland
4
Geological Institute of Russian Academy of Sciences, Moscow 119017, Russia
5
National Institute of Water and Atmospheric Research, Wellington 6241, New Zealand
6
Earth Analytic, Inc., Santa Fe, NM 87501, USA
7
Hydrographic and Oceanographic Department in the Japan Coast Guard, Tokyo 135-0064, Japan
8
Hydrographic Unit of the Ministry of Housing and Land, Ebene 72202, Mauritius
9
Ocean Floor Geophysics, Burnaby, BC V5J 5J3, Canada
10
Kongsberg Maritime AS-Subsea, 3183 Horten, Norway
11
Yam-Yafo Marine Projects, Rishon Lezion 7570232, Israel
12
Hushcraft, Ltd., Tollesbury, Maldon CM9 8SE, UK
13
SEA-KIT Int., Tollesbury, Maldon CM9 8SE, UK
14
Robin Falconer Associates Ltd., Wellington 6241, New Zealand
15
Federal State Budgetary Institution: Arctic and Antarctic Research Institute, Saint Petersburg 199397, Russia
16
Petroleum Geology Department, Faculty of Petroleum and Mining Science, University of Matrouh, Matrouh 51511, Egypt
*
Author to whom correspondence should be addressed.
Remote Sens. 2020, 12(8), 1344; https://doi.org/10.3390/rs12081344
Submission received: 4 April 2020 / Revised: 19 April 2020 / Accepted: 21 April 2020 / Published: 23 April 2020

Abstract

:
The methods of data collection, processing, and assessment of the quality of the results of a survey conducted at the Southern Ionian Sea off the Messinian Peninsula, Greece are presented. Data were collected by the GEBCO-Nippon Foundation Alumni Team, competing in the Shell Ocean Discovery XPRIZE, during the Final Round of the competition. Data acquisition was conducted by the means of unmanned vehicles only. The mapping system was composed of a single deep water AUV (Autonomous Underwater Vehicle), equipped with a high-resolution synthetic aperture sonar HISAS 1032 and multibeam echosounder EM 2040, partnered with a USV (Unmanned Surface Vessel). The USV provided positioning data as well as mapping the seafloor from the surface, using a hull-mounted multibeam echosounder EM 304. Bathymetry and imagery data were collected for 24 h and then processed for 48 h, with the extensive use of cloud technology and automatic data processing. Finally, all datasets were combined to generate a 5-m resolution bathymetric surface, as an example of the deep-water mapping capabilities of the unmanned vehicles’ cooperation and their sensors’ integration.

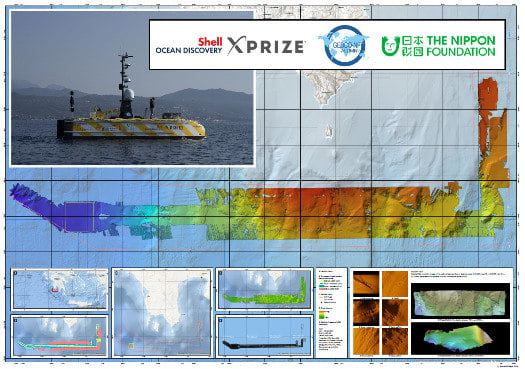
Graphical Abstract

1. Introduction

The ocean floor is the most remote and difficult part of our planet, yet to be explored. Due to the extreme conditions facing exploration, the majority of the world’s ocean floor is still unmapped [1,2]. Modern mapping techniques, based on the acoustic technology, allow us the possibility to collect bathymetric and water column data, but the survey process is slow and expensive. The majority of present-day surveying efforts go into the busier, shallow waters for the purpose of safety of navigation. While this represents an understandable and necessary approach, it results in the majority of the deep ocean still being unmapped. The overall shape of the global ocean floor is an estimation based on the satellite altimetry technique [3] and interpolation between sparse acoustic measurements.
The American foundation XPRIZE announced in 2015 that the next award will go to those who come up with the solution for faster, detailed mapping of the ocean floor, without exposing humans to the harsh sea environment. That was the beginning of the Shell Ocean Discovery XPRIZE. To compete in the final round of the Shell Ocean Discovery XPRIZE, each team had to present the solution for collecting bathymetric data and imagery data and successfully complete Round 1 in 2017. During the second round a year later, the bathymetric data collection had to achieve depths of up to 4000 m, with a vertical resolution of 0.5 m and a horizontal resolution of 5 m. The imagery needed to include images presenting recognizable geological, biological, or archaeological features on the seabed. The solution had to be autonomous or remote controlled, but there must have been no human inside the survey area, and no physical link between the devices and the mission control location. The mapping system, with all its elements, had to fit into one standard 40-ft shipping container. The minimum coverage to be achieved during the 24 h of data collection was 250 km 2 . The final bathymetric grid had to be ready to be presented to judges 48 h after the mapping equipment left the survey area. Each of those requirements separately could be easily met by the survey equipment available in the market. Meeting the resolution and coverage rate requirements at the same time, with the required level of reliability allowing no human intervention on the open sea for the whole survey period, was the real challenge.
The mapping system presented here was proposed by the GEBCO-Nippon Foundation Alumni Team, a group of former scholars of the Nippon Foundation-GEBCO Training Program at the University of New Hampshire (more in [4]), as an answer for the XPRIZE challenge.

2. Methods

This section presents the details of the mapping system used for bathymetric and imagery data acquisition, the characteristics of mapping area, and the survey plan, as well as the structure of the mapping system and the cooperation between two unmanned vessels.

2.1. Data Acquisition System

The timeline of the XPRIZE Competition was extremely tight, in terms of novel design and a proper testing of underwater vehicles capable of collecting reliable data related to the seafloor. As a result of this consideration, it was decided to choose a commercially available system, as close as possible to the XPRIZE requirements, and then identify the areas in which improvements were needed. The Autonomous Underwater Vehicle of the HUGIN type (see Figure 1) was used as a platform for the main mapping devices: the High Resolution Synthetic Aperture Sonar HISAS 1032, providing coverage over large swath width, and EM 2040 multibeam echosounder (MBES), covering the nadir gap, were used.
The AUV HUGIN is a proven concept of a robust deep-water vehicle, utilized worldwide by scientific institutions, survey companies, and navies [5,6,7,8]. The functions provided by the vehicle were a determinative factor for choosing this system for XPRIZE mission. The HUGIN is remotely programmed on the Topside Unit (computers and other hardware installed on the USV SEA-KIT) that are used for the configuration, control, monitoring, and maintenance of the AUV. The HUGIN Operator Station (HOS) comes with a collection of programs that interface with the AUV through specific modules used for mission planning, AUV configuration, and real-time control. The payload software controls and displays data from sensors in real time, allowing for assessment of sensors functionality at a global remote desktop location via satellite link through the Topside Unit, and subsequently back to the AUV through the subsea Modem using HiPAP. The HUGIN can operate in either autonomous or supervised mode and seamlessly switch between modes depending on the operator’s preference. Additionally, HUGIN AUVs are fitted with sensors for the detection of critical operational conditions and error handling systems. In the unlikely event of equipment failure, the HUGIN has redundant onboard safety checks and most issues can be solved onboard while underwater [9,10,11].
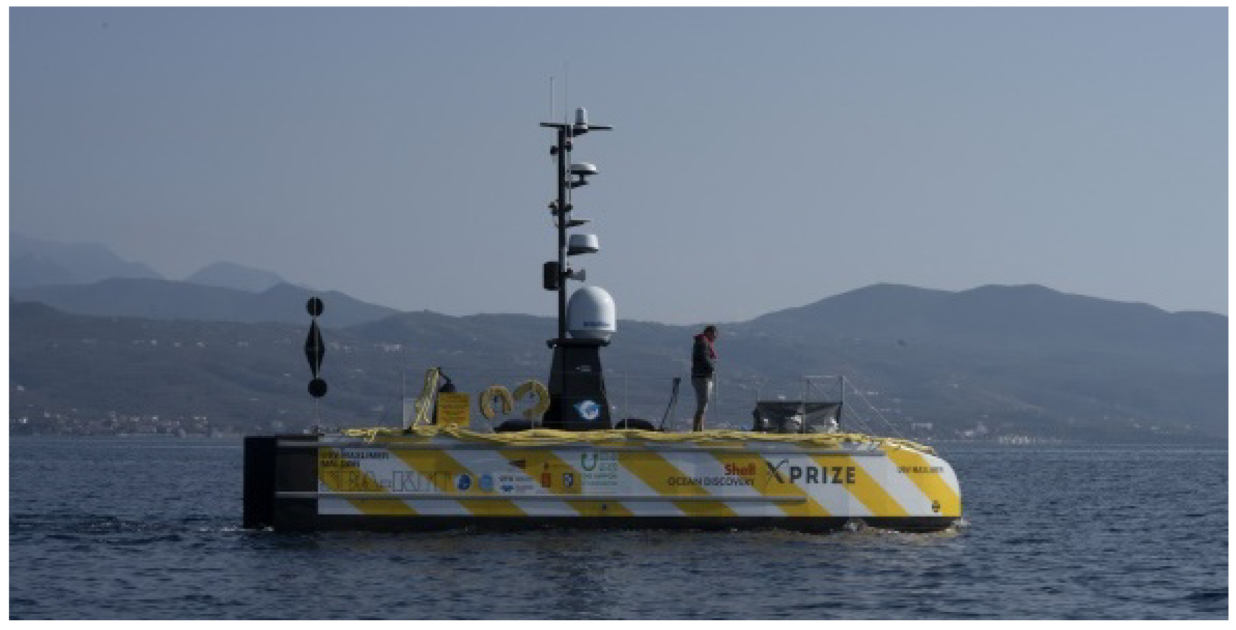
During the development phase of the tesam’s preparation, one of main issues that had to be addressed was related to the transportation of the AUV onsite, the unmanned launch and recovery and the positioning during mission. A new class of an Unmanned Surface Vessel, called SEA-KIT (see Figure 2), was designed and built to be able to fulfill those tasks. The USV was equipped with the pre-release version of deep water multibeam echosounder EM 304, providing for the collection of bathymetric data from the surface of the sea.
Basic data about both vehicles used during the survey are provided in Table 1 and Table 2. The detailed description of the design and functionalities of the mapping system can be found in [12,13,14].
Figure 3 presents the general concept of the survey, according to the Competition requirements. Two main stages—at sea and on shore—create the complete process of data acquisition and processing, resulting in the final deliverables.
The concept of combining two unmanned vehicles for one mapping campaign has appeared as a survey practice before. Ludvigsen et al. [15] presented the results of AUV HUGIN usage complemented by ROV data collection, although both were deployed from a manned research vessel. Using an USV as a source of positioning data is presented, for example, in [16,17], but those results are based on simulation only.
AUVs are widely used for the seafloor mapping at various depths and resolutions. A high-resolution survey conducted by the mean of AUV HUGIN equipped with SAS is presented in [18]. AUVs have traditionally been deployed from a large manned vessel. AUVs have been extensively used during the search of the lost Malaysian aircraft MH 370 and this situation showed the level of difficulty for ocean mapping to the general public [19]. The great capabilities of an AUV have been proved during the search of the ARA San Juan, the lost Argentinian submarine, found by Ocean Infinity surveyors, using a fleet of HUGINS [20]. In those well known examples, as well as during the years of scientific and commercial use of AUV, the vehicles cooperated with manned vessels for launching, recovery, positioning, battery charging, and data transfer.
The team recognized that the capability for the unmanned launch and recovery of an AUV could be the deciding factor for the success of the mapping campaign, where this kind of solution was not popular or accessible as an off-the-shelf solution. Meng et al. [21] and Gu et al. [22] presented studies on a device towed underwater for the recovery of an AUV. Solutions based on towing have been also proposed by other Shell Ocean Discovery XPRIZE participants [23], but their reliability in some cases might be not sufficient for open-sea operations.

2.2. Mapping Area

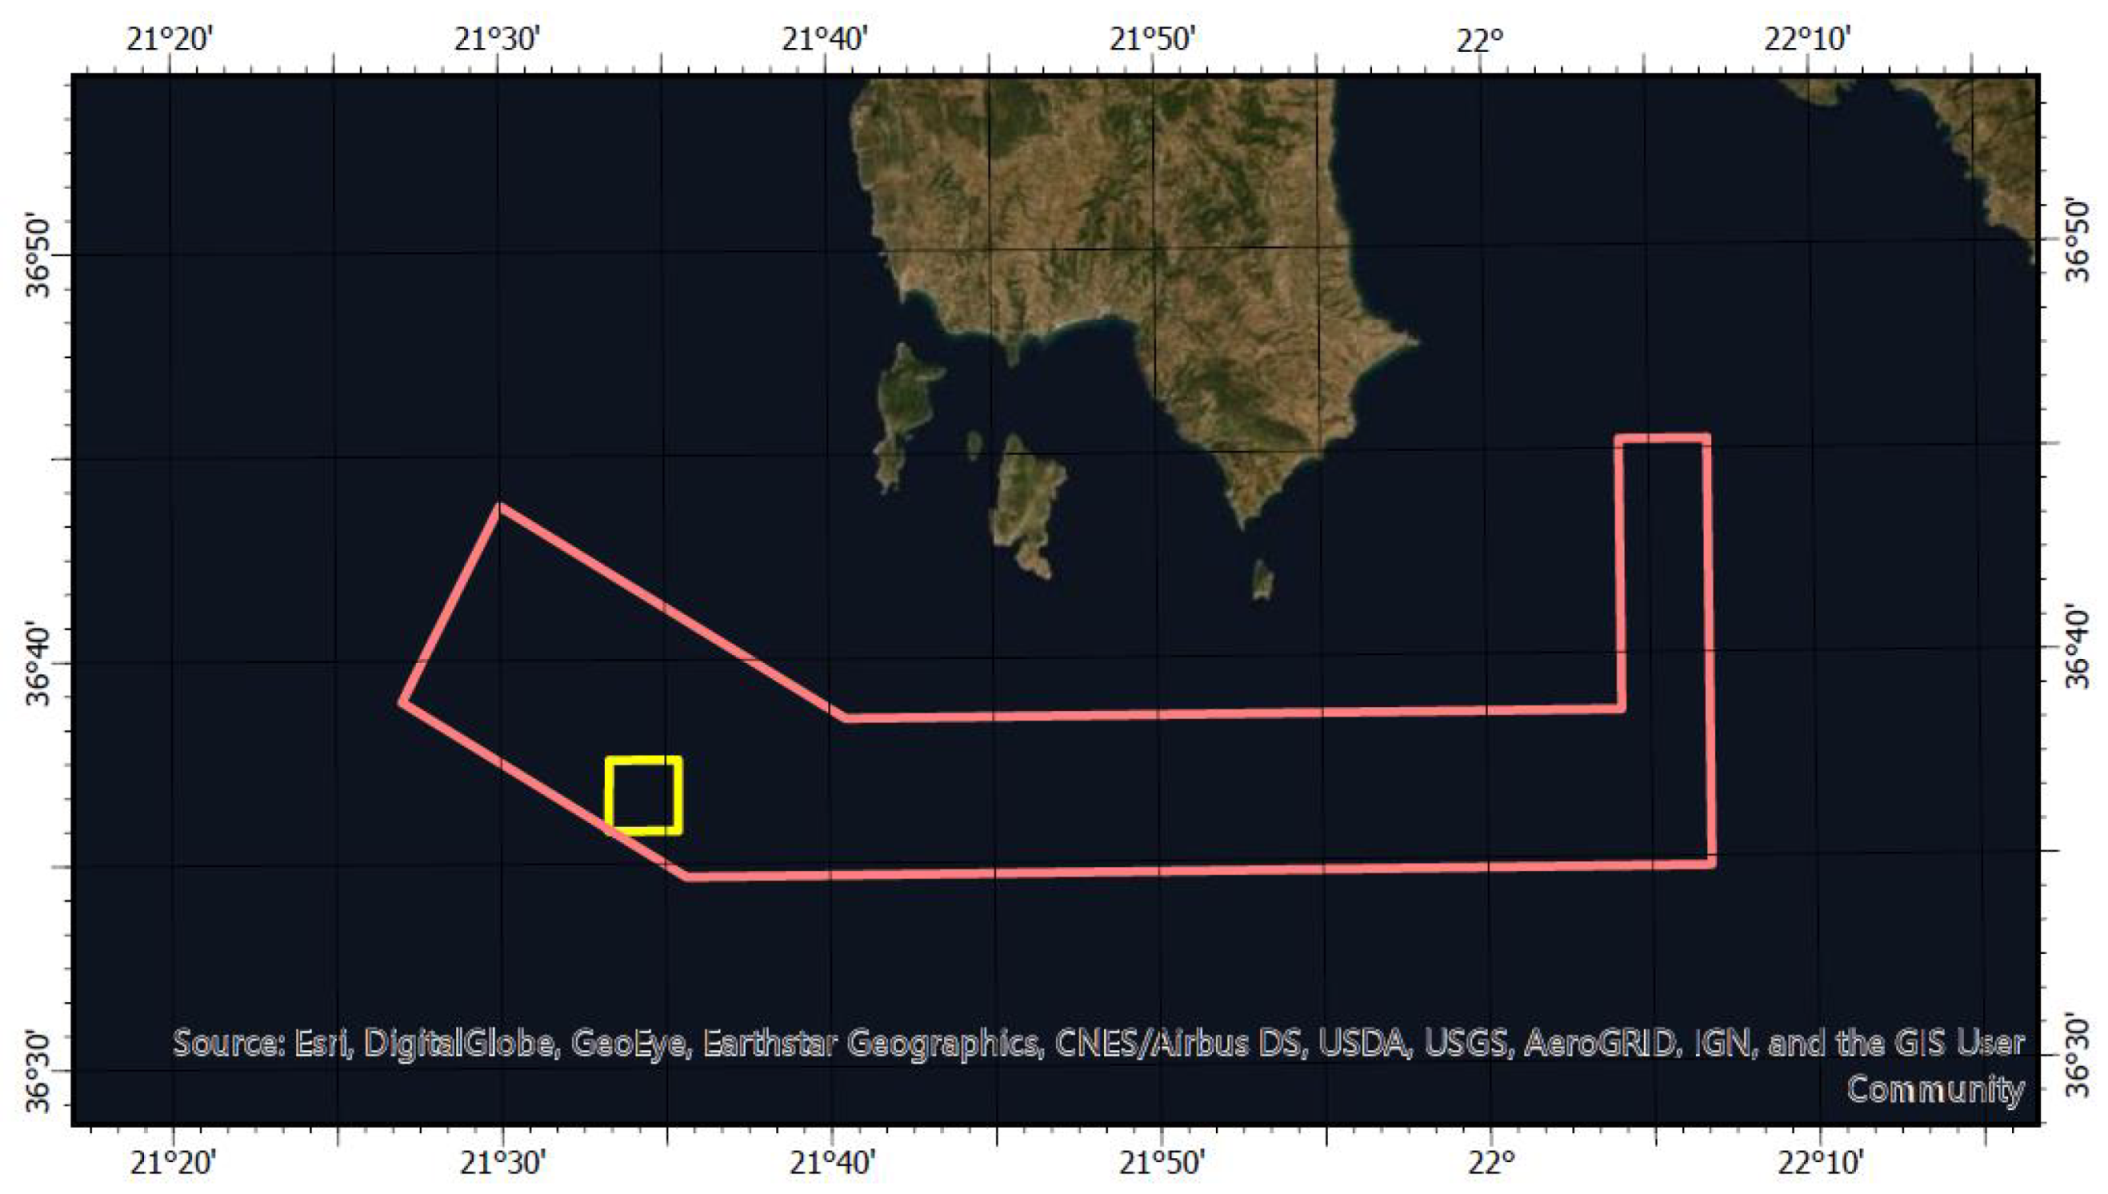
The exact coordinates of the mapping area were released by XPRIZE officials to the surveyors just a few days prior to the final survey being carried out. Table 3 presents the coordinates of the 500 km 2 area, at least half of which was required to be mapped according to the Competition rules (https://www.xprize.org/prizes/ocean-discovery/guidelines). The shape of the area is presented on the map in Figure 4. Table 4 gives location of an inset area where teams were to locate and image an object placed there by XPRIZE in order to test team solution. This area had to be mapped obligatory during the survey.
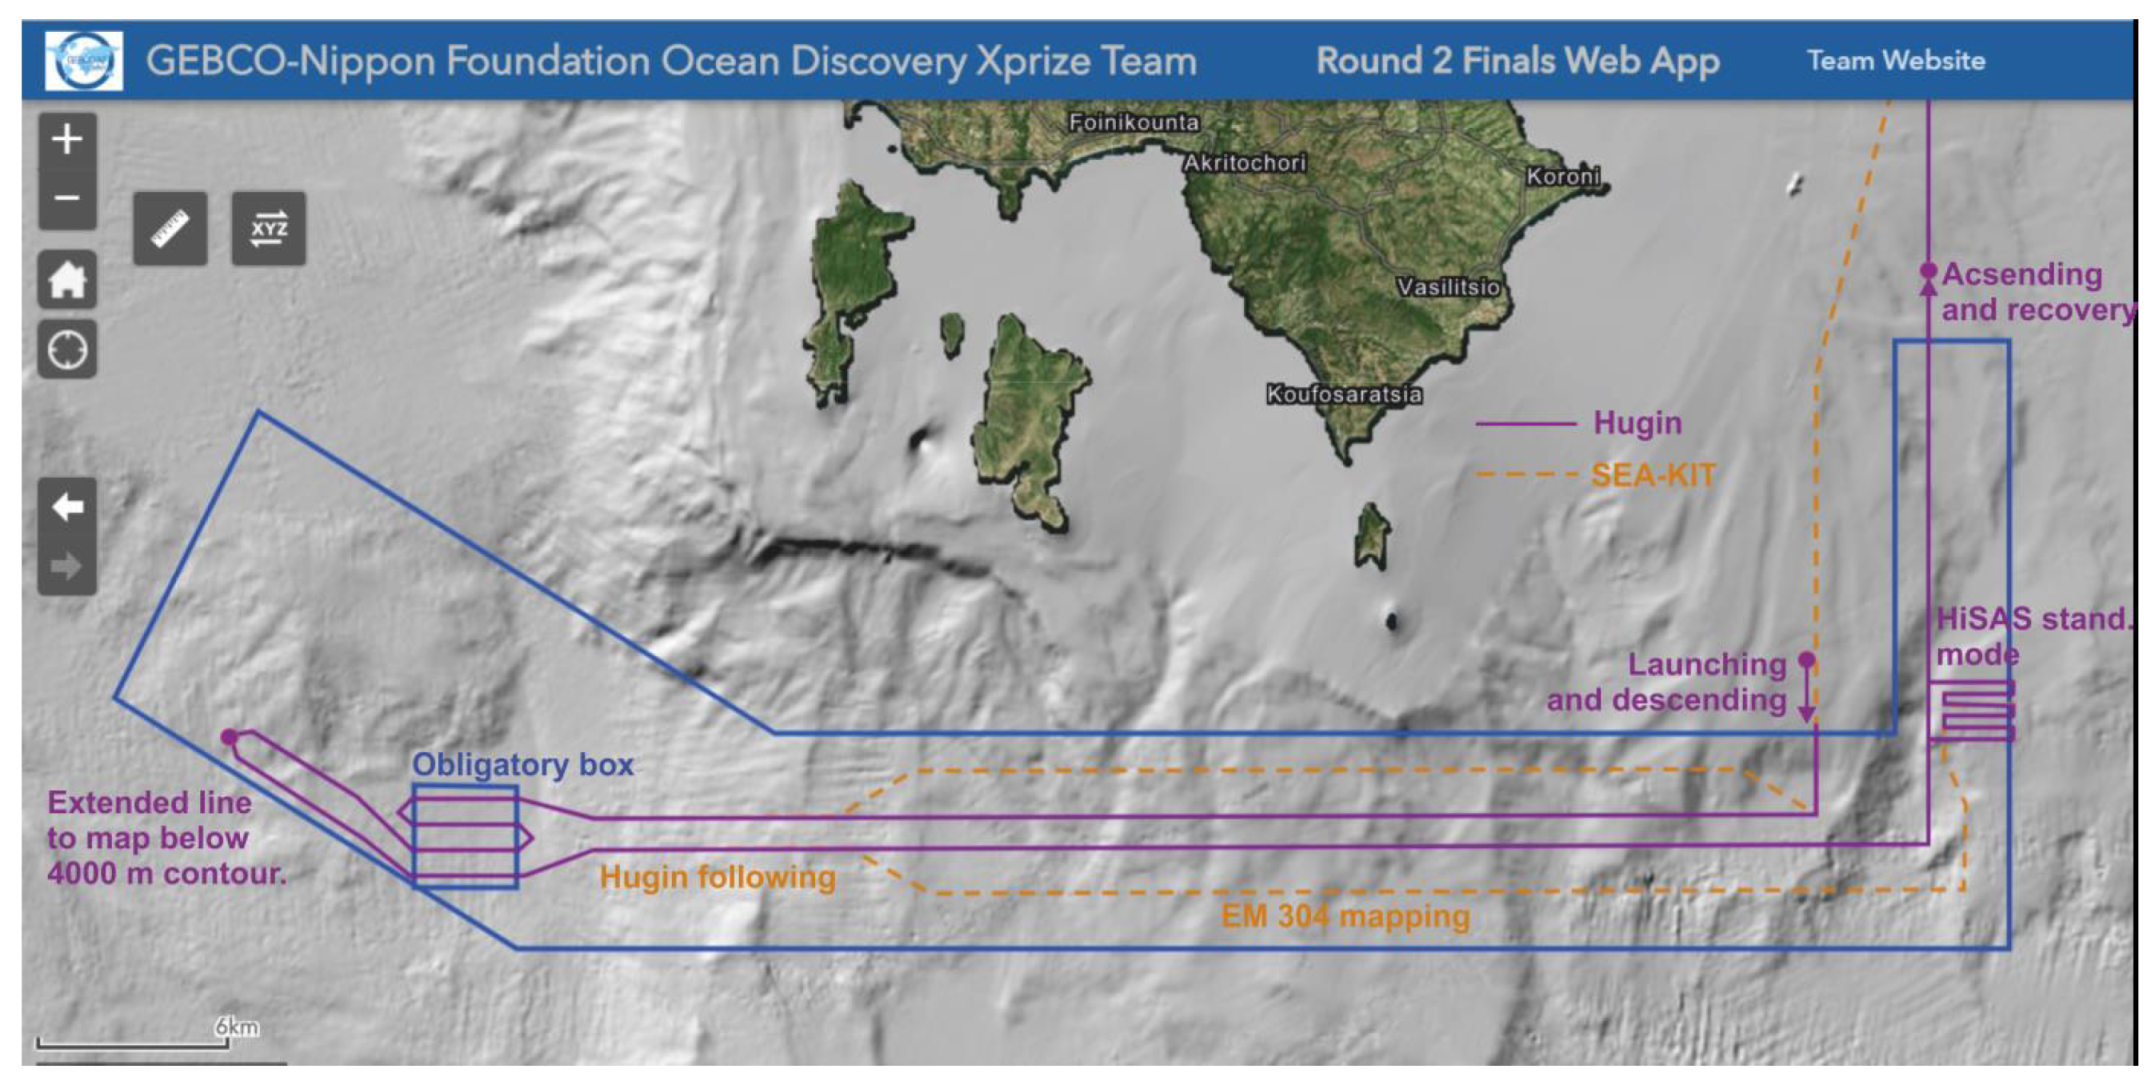
All the bathymetric and oceanographic data publicly available for the area around the south coasts of Greece were collected by the team in advance, after the XPRIZE organizers released the general location of the final field test area. Due to the high percentage of remote work by the team over the duration of the XPRIZE challenge, largely due to their global distribution, ArcGIS online tools were widely utilized for data sharing, visualization, analysis, and decision making, throughout the whole process. Figure 5 presents an example of the web app utilized by the team for planning purposes.
Bathymetric information is the primary consideration in relation to survey planning. EMODnet Bathymetry Portal (https://portal.emodnet-bathymetry.eu/) was used as a starting point, in the search for available high-resolution bathymetry in the area. The only available multibeam dataset (grid presented in colors on Figure 5) did not cover the area to be mapped during the competition, although the EMODnet bathymetric grid is available in this area. The EMODnet grid is a freely available bathymetric compilation of European waters, with the geographical boundaries defined by meridians 36 W and 43 E, parallel 15 N, and the North Pole, and is generated based on the EMODnet Bathymetry partnership by regional teams. The latest 2018 version has a grid size of 1/16 by 1/16 arc minutes. A subset of the grid is presented as the gray hillshade in Figure 6.

2.3. Survey Plan

The survey lines for both survey platforms were designed considering optimal combination of speed, interference mitigation, and maximum achievable swaths during data acquisition. The values for the aforementioned are presented in Table 5.
Considerations were made taking into account the allocated 48-h processing time following equipment departure from the survey area. As such, the mapping solution was scheduled to leave the survey area at the closest possible point to the harbor (approximately 16.5 nautical miles) to reduce transit time on the return. Given this requirement, all survey lines including all the assumed elements of the overall mission were planned ‘backwards’, to choose the launching point in such a way as to close the whole survey within 24 h of the equipment entering the survey area.
The team realized that the longest east–west leg can be almost completely mapped (excluding unavoidable gaps on the steep topography caused by side-scan ensonification geometry) in two parallel runs of the HUGIN–SEA-KIT pair. It also minimized the number of turns, increasing the overall data coverage rate and avoiding lost data due to suboptimal routines.
The latter form of operation allows the AUV to run autonomously parallel to the USV with sufficient separation to remove potential interference. In this mode, the AUV runs in a silent mode with predetermined interrogation intervals from the USV so as to maintain a log of the AUV position. These positions are logged and stored on the USV. Once on-shore, this positional information is used to post process the AUV navigation by bringing it to absolute by correcting drift. Note that these handshakes could be included in any mission plan to allow a period of positional updates for the AUV eliminating excessive drift during long operations.
In the west part of the survey area, additional lines were planned to completely cover the obligatory 10 km 2 box with the HISAS data acquired by HUGIN AUV. Two lines were extended to map the portion of the seafloor at an estimated 4000 m depth, in order to prove the system capabilities of working at the maximum depth required by the competition. Additional lines were planned for the north–south oriented leg in the east part of survey area, to collect high-resolution HUGIN HISAS data, while operating in the standard mode.
The HUGIN AUV capability to operate in an autonomous mode allowed SEA-KIT to simultaneously map the large portion of the longest east–west leg with the EM 304 deep-water echosounder system, running parallel to the HUGIN AUV. The deep-water testing prior the competition showed that, below 2000 m, the surface mounted EM 304 performance did not achieve data density sufficient for the XPRIZE-required gridding. Thus, it was decided to use SEA-KIT as a positioning platform in deeper areas, whereas in shallower part only regular but sparse acoustic checks were used. The obligatory box and 4000 m depth areas were planned to be mapped using the AUV following mode to improve AUV positioning. AUV following mode was also used during the high-resolution, standard HISAS survey on the last leg. This ‘AUV follow mode’ allows a complete hands off survey solution, where by the AUV is being fed its position in real time over the acoustic link derived from HiPAP, with SEA-KIT then following this received AUV position, maintaining a predefined offset, if required. The potential is present to run an entire mission hands off if required. The final mission plan is presented on Figure 6.

3. Results

The following section presents the overview of the data collected during the survey and the methods used to process the data, according to both the competition rules and hydrographic practices.

3.1. Data Collected

The mapping solution consisted of HISAS 1032 interferometric synthetic aperture sonar system, with an EM 2040 multibeam echosounder acting as a gap filler, congruently collecting bathymetry and imagery data onboard the HUGIN AUV. An EM 304 multibeam echosounder was mounted on a gondola under the hull of SEA-KIT, collecting bathymetry and backscatter data. Following the 24 h of data acquisition, 48 h were allocated by XPRIZE for the transit back port, data download, processing, and production of final products. The data download began immediately after SEA-KIT and the AUV docked in port.
The data stored locally on board the HUGIN consisted of raw HISAS data, imagery data, EM 2040 data, and navigation data, along with vehicle information and all the navigation inputs. Raw HISAS data consist of low volume, xtf files in addition to proprietary Kongsberg data. A CTD sensor onboard the HUGIN collected oceanographic information to derive a sound velocity profile used for further data processing.
The data stored topside, onboard SEA-KIT, consisted of the EM 304 data, topside navigation data, and vessel data. During the real-time operations, the mission folder on the HOS (HUGIN Operator Station) machine onboard SEA-KIT stored all topside logging of ancillary sensor data from the vessel (GPS and motion), including any data collected acoustically during the mission, such as HiPAP updates. Post-mission, these data were then collated with the data collected onboard the HUGIN, resulting in a final product of all relevant vehicle information in one folder, allowing for a more streamlined processing of the navigation and sonar data.
Table 6 presents the volumes of data collected by the two vehicles of the mapping system during the 24 h of data acquisition.
Table 7 presents the data types acquired by the sonar systems onboard SEA-KIT and the HUGIN. As all those mapping methods were conducted simultaneously (EM 304 working only in depths shallower than 2000 m), Table 7 also depicts the differences in mapping efficiency of the surface and underwater vehicles. Data quality is discussed in the next sections.

3.2. Data Processing

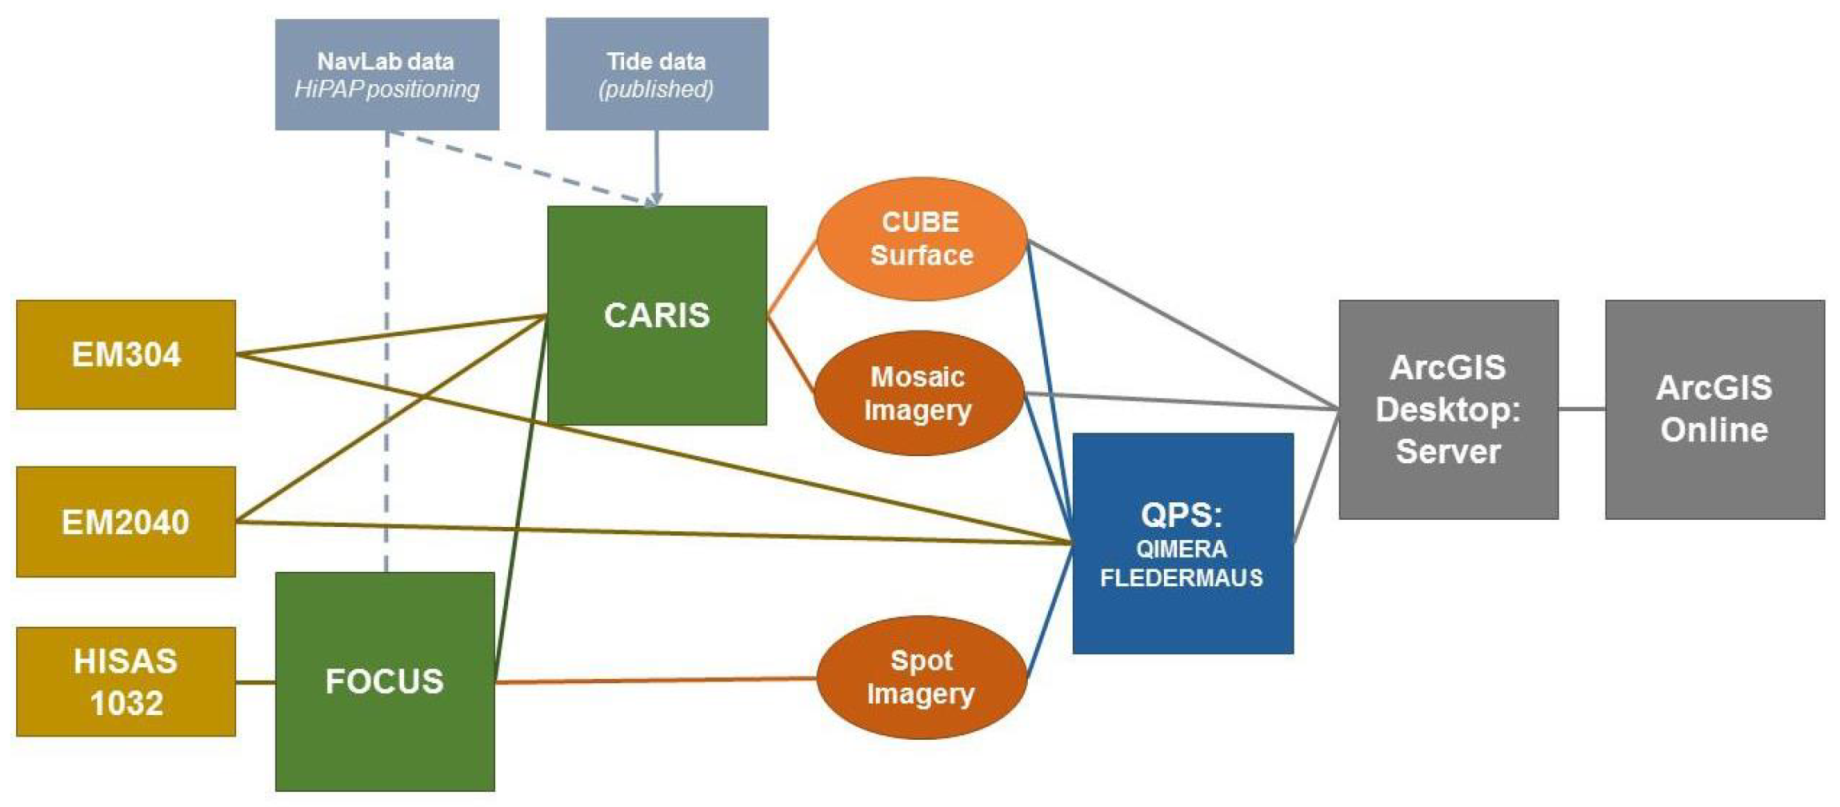
Following the 24 h of survey and transit to port, 43 h remained for data retrieval, processing, and product finalization. This is not something that would generally be possible using existing conventional methods; improvements in standard data processing techniques had to be made. These optimizations included selective prioritization on data transfer, utilization of CARIS Process Models, and cloud-based data processing to meet such tight XPRIZE time constraints. The team was fully committed to automated processing wherever possible, using both existing and emerging technologies, to speed up data processing and reduce human error. Prior to the competition, many sea trials were executed so as to collect high quality, noise free data. This allowed for the development of automated processing models, based on the Combined Uncertainty and Bathymetric Estimator (CUBE) [24] algorithm by CARIS HIPS [25]. To use the manpower in an optimal way, a portion of data was uploaded online so it could be processed remotely from the University of New Hampshire using Qimera and Fledermaus. These processed data were used to produce some of the impressive seafloor feature imagery. Finally, to combine and present all the results, mapping products and imagery were delivered using the ArcGIS online platform, making it possible to consume the information in an efficient manner. Figure 7 shows the simplified processing workflow.
The data processing workflow can be broken down into four main components:
  • Navigation and HISAS: HISAS was tightly integrated with the Aided Inertial Navigation of the HUGIN AUV and uses 4D Kalman filtering to process the raw data into bathymetry and imagery of the sea floor. Prior to processing the HISAS data, Navlab was utilized to generate a navigation solution [26] by injecting real-time transponder interrogations into the vehicle navigation algorithm. The navigation was then re-run through a Kalman filter, prior to running a smoothing algorithm on the output. In addition to the navigation processing, the depth was calculated using a UNESCO pressure to depth calculation [27], based on conductivity and temperature information extracted during the ascent and descent of the AUV during the mission. The output was a smoothed navigation file, containing all information relevant to the navigation of the vehicle within the mission, such as time, position, depth, attitude, etc. Once the navigation solution was generated, NEXUS software was used to communicate with the FOCUS machine to process the HISAS 1032 records, using the raw stave data to generate bathymetry and sidescan using the optimal navigation solution.
  • Bathymetry: CARIS HIPS and SIPS were utilized to process the EM 2040, HISAS, and EM 304 data. The Process Designer tool was used by the team to create process models, which were used to reduce processing times. The process models were used to merge the raw sonar data, sound velocity data, smoothed navigation data, and tide information used to produce bathymetric surfaces and side scan mosaics.
  • Imagery: EM 304 data were uploaded to the cloud, for remote data processing using Qimera and Fledermaus to process data and produce point cloud images and imagery of the sea floor. Ultra-high resolution acoustic images were generated on site from the HISAS data, using REFLECTIONS software to produce 2-cm resolution, spot processed images.
  • ArcGIS Visualization: When the processing was complete, all the combined bathymetric data were presented to the Shell Ocean Discovery XPRIZE representatives using the team’s ArcGIS online portal. Prior to publishing in the online account, all of the processed data were integrated within an ArcGIS Desktop map document. Vector datasets were published to an ArcGIS feature services. Raster products (bathymetric maps and imagery) were published to ArcGIS Image Services using Earth Analytic’s SmartOcean ArcGIS Enterprise Server Cluster. The datasets could then be manipulated using various functions such as hillshade, slope, aspect, and elevation. The mosaic datasets were published as ArcGIS image services and added to the final ArcGIS WebMap, which was in turn embedded in a customized web application. This application included ’pop-ups’ showing imagery linked to specific geographic locations.
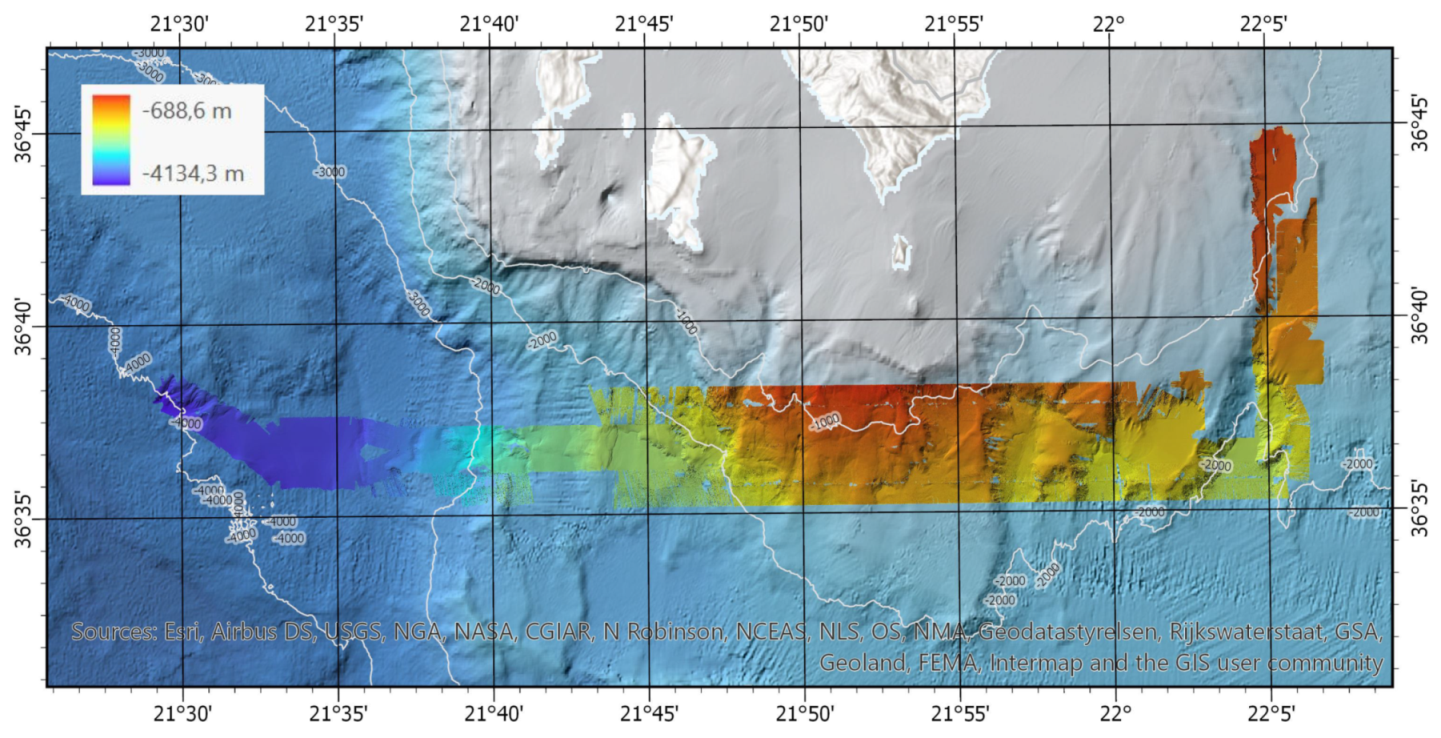
To summarize, the following software packages were used at various stages of data acquisition and processing. HUGIN Operator Station (HOS) was the control software of the AUV. Hybrid Autonomy Layer (HAL) controlled the autonomous guidance of speed and heading of the USV. K-Mate controller, with proprietary Kongsberg Maritime and Norwegian Defense Research Establishment (Forsvarets forskningsinstitutt—FFI) software, provided the remote control of USV during the mission. Remote SIS was utilized for EM 304 data collection. Vehicle navigation data were processed using NavLab. NEXUS (FOCUS) were used for initial HISAS data processing. The final surfaces were created using CARIS HIPS and SIPS, utilizing the Automated Processing Workflow. EM 304 data were cleaned and processed using Qimera. 3D draped imagery were produced using Fledermaus, and high resolution HISAS imagery were created with KM REFLECTIONS software. All the mapping products were uploaded to ArcGIS Online portal, which was also used for the reconnaissance data analysis. The overview of the bathymetry and backscatter results are presented in Figure 8 and Figure 9. The access to the data is provided to the readers by the online app (see the Supplementary Materials for details).
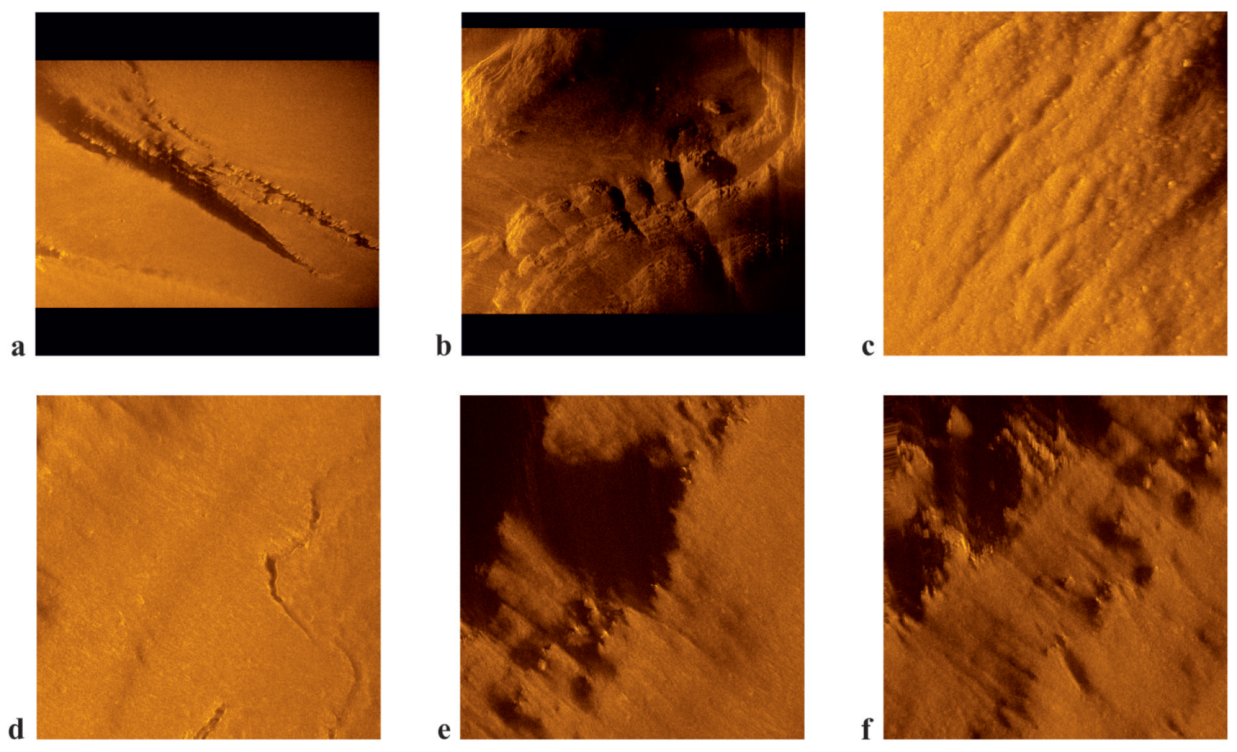
Figure 10 presents the examples of images generated using the spot-processing technique embedded in the REFLECTIONS software. Numerous fault structures and sediments features were depicted by the acoustical imagery.
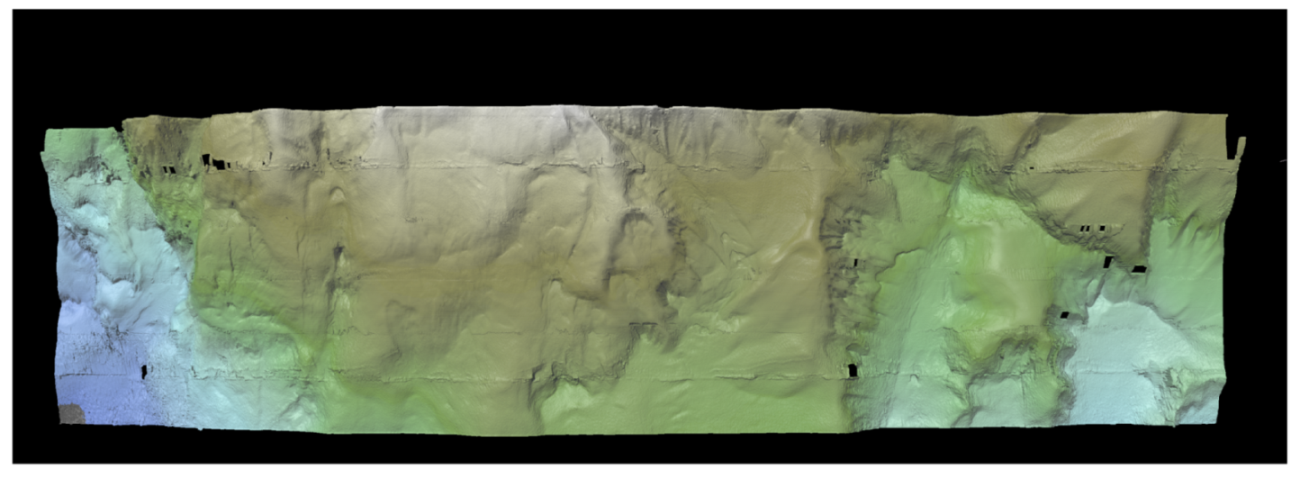
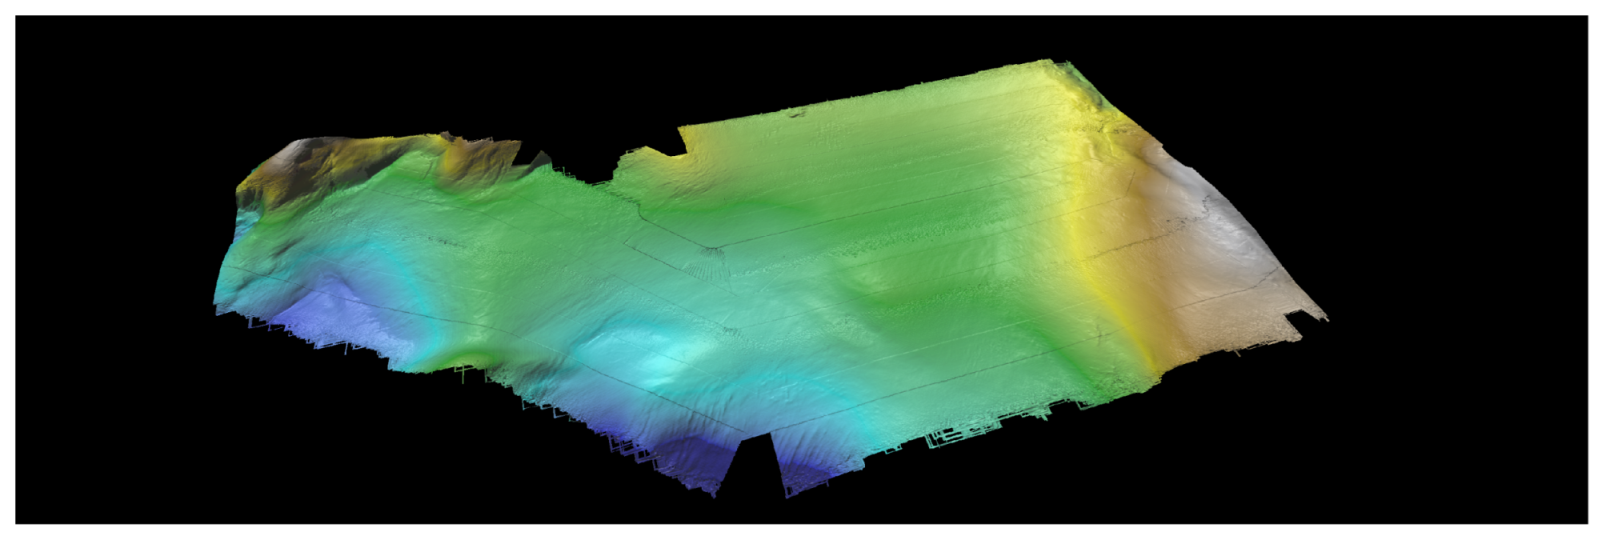
Bathymetry data rendered as a 3D shaded relief can be also considered as the imagery products of bathymetric survey. Examples are presented in Figure 11, Figure 12 and Figure 13.

4. Discussion

Data used for the bathymetric map production were collected by four different methods: high-resolution synthetic aperture sonar (HISAS) working in two modes (Wide Area and Standard), the multibeam echosounder on the AUV, and the surface multibeam echosounder on SEA-KIT. Each of those data sources is characterized by different error budget, resolution, and accuracy values. The compilation of the final DTM was a complex task, and the final DTM accuracy characteristic varied depending on how the data were collected in that particular area.

4.1. Uncertainty Estimation and Error Budget

The mapping system consists of three main components which in turn generate two primary modes of operation: (1) supervised AUV mapping; and (2) simultaneous EM 304 and wide area AUV mapping. Supervised operations means the AUV, as the survey platform, was being supported by the USV. This support includes the underwater vehicle positions, general control information and receiving data samples and health status during the mission. The basic scheme of primary survey system composition is presented on Figure 14.

4.1.1. Vertical Uncertainty Estimation

Vertical uncertainty parameters must be explained separately for AUV and USV measurement.

Measurements by AUV HUGIN

Final depth (d—for the symbols in this paragraph, refer to Figure 14) is the sum of the altitude measured by the sonar on AUV ( d e c h o s ) and the AUV depth ( d A U V ) minus the instantaneous water level to the reference datum ( d W L ). Those components are assumed independent, thus the uncertainty propagation method is used to assess the mapping uncertainty, according to Equation (1) [28,29]
σ d 2 = σ d A U V 2 + σ d e c h o s 2 + σ d W L 2
d A U V measurement uncertainty depends on pressure sensor mounted on the underwater vehicle. In our case, this is DigiQuartz 8CB4500 with full range of 4500 m. If we take into account the uncertainty for pressure-depth conversion model and the uncertainty for variation of barometric pressure, we receive the values of 0.8 m (2 σ ), for the AUV operating at the altitude of 60 m above the seafloor.
For the d W L , we assumed the following values for the uncertainty component and received the final value, as follows: 2 σ uncertainty for WL measurement equals 0.02 m and 2 σ uncertainty for WL zoning equals 0.1 m. It gives the total value of σ d A U V (2 σ ) equal to 0.1 m.
d e c h o s measurement uncertainty depends on the sonar, which measured the depth for the particular data point. The nadir sector from −60 to 60 is covered by multibeam echosounder. The rest of the 780 m wide swatch is covered by HISAS High resolution interferometric synthetic aperture sonar—sectors from −8 to −45 (portside) and 45 to 80 (starboard). There is a 15-degree overlap between those devices.
The EM 2040 MBES measurement uncertainty was assessed based on the methodology provided in [29]. Table 8 lists the parameters used.
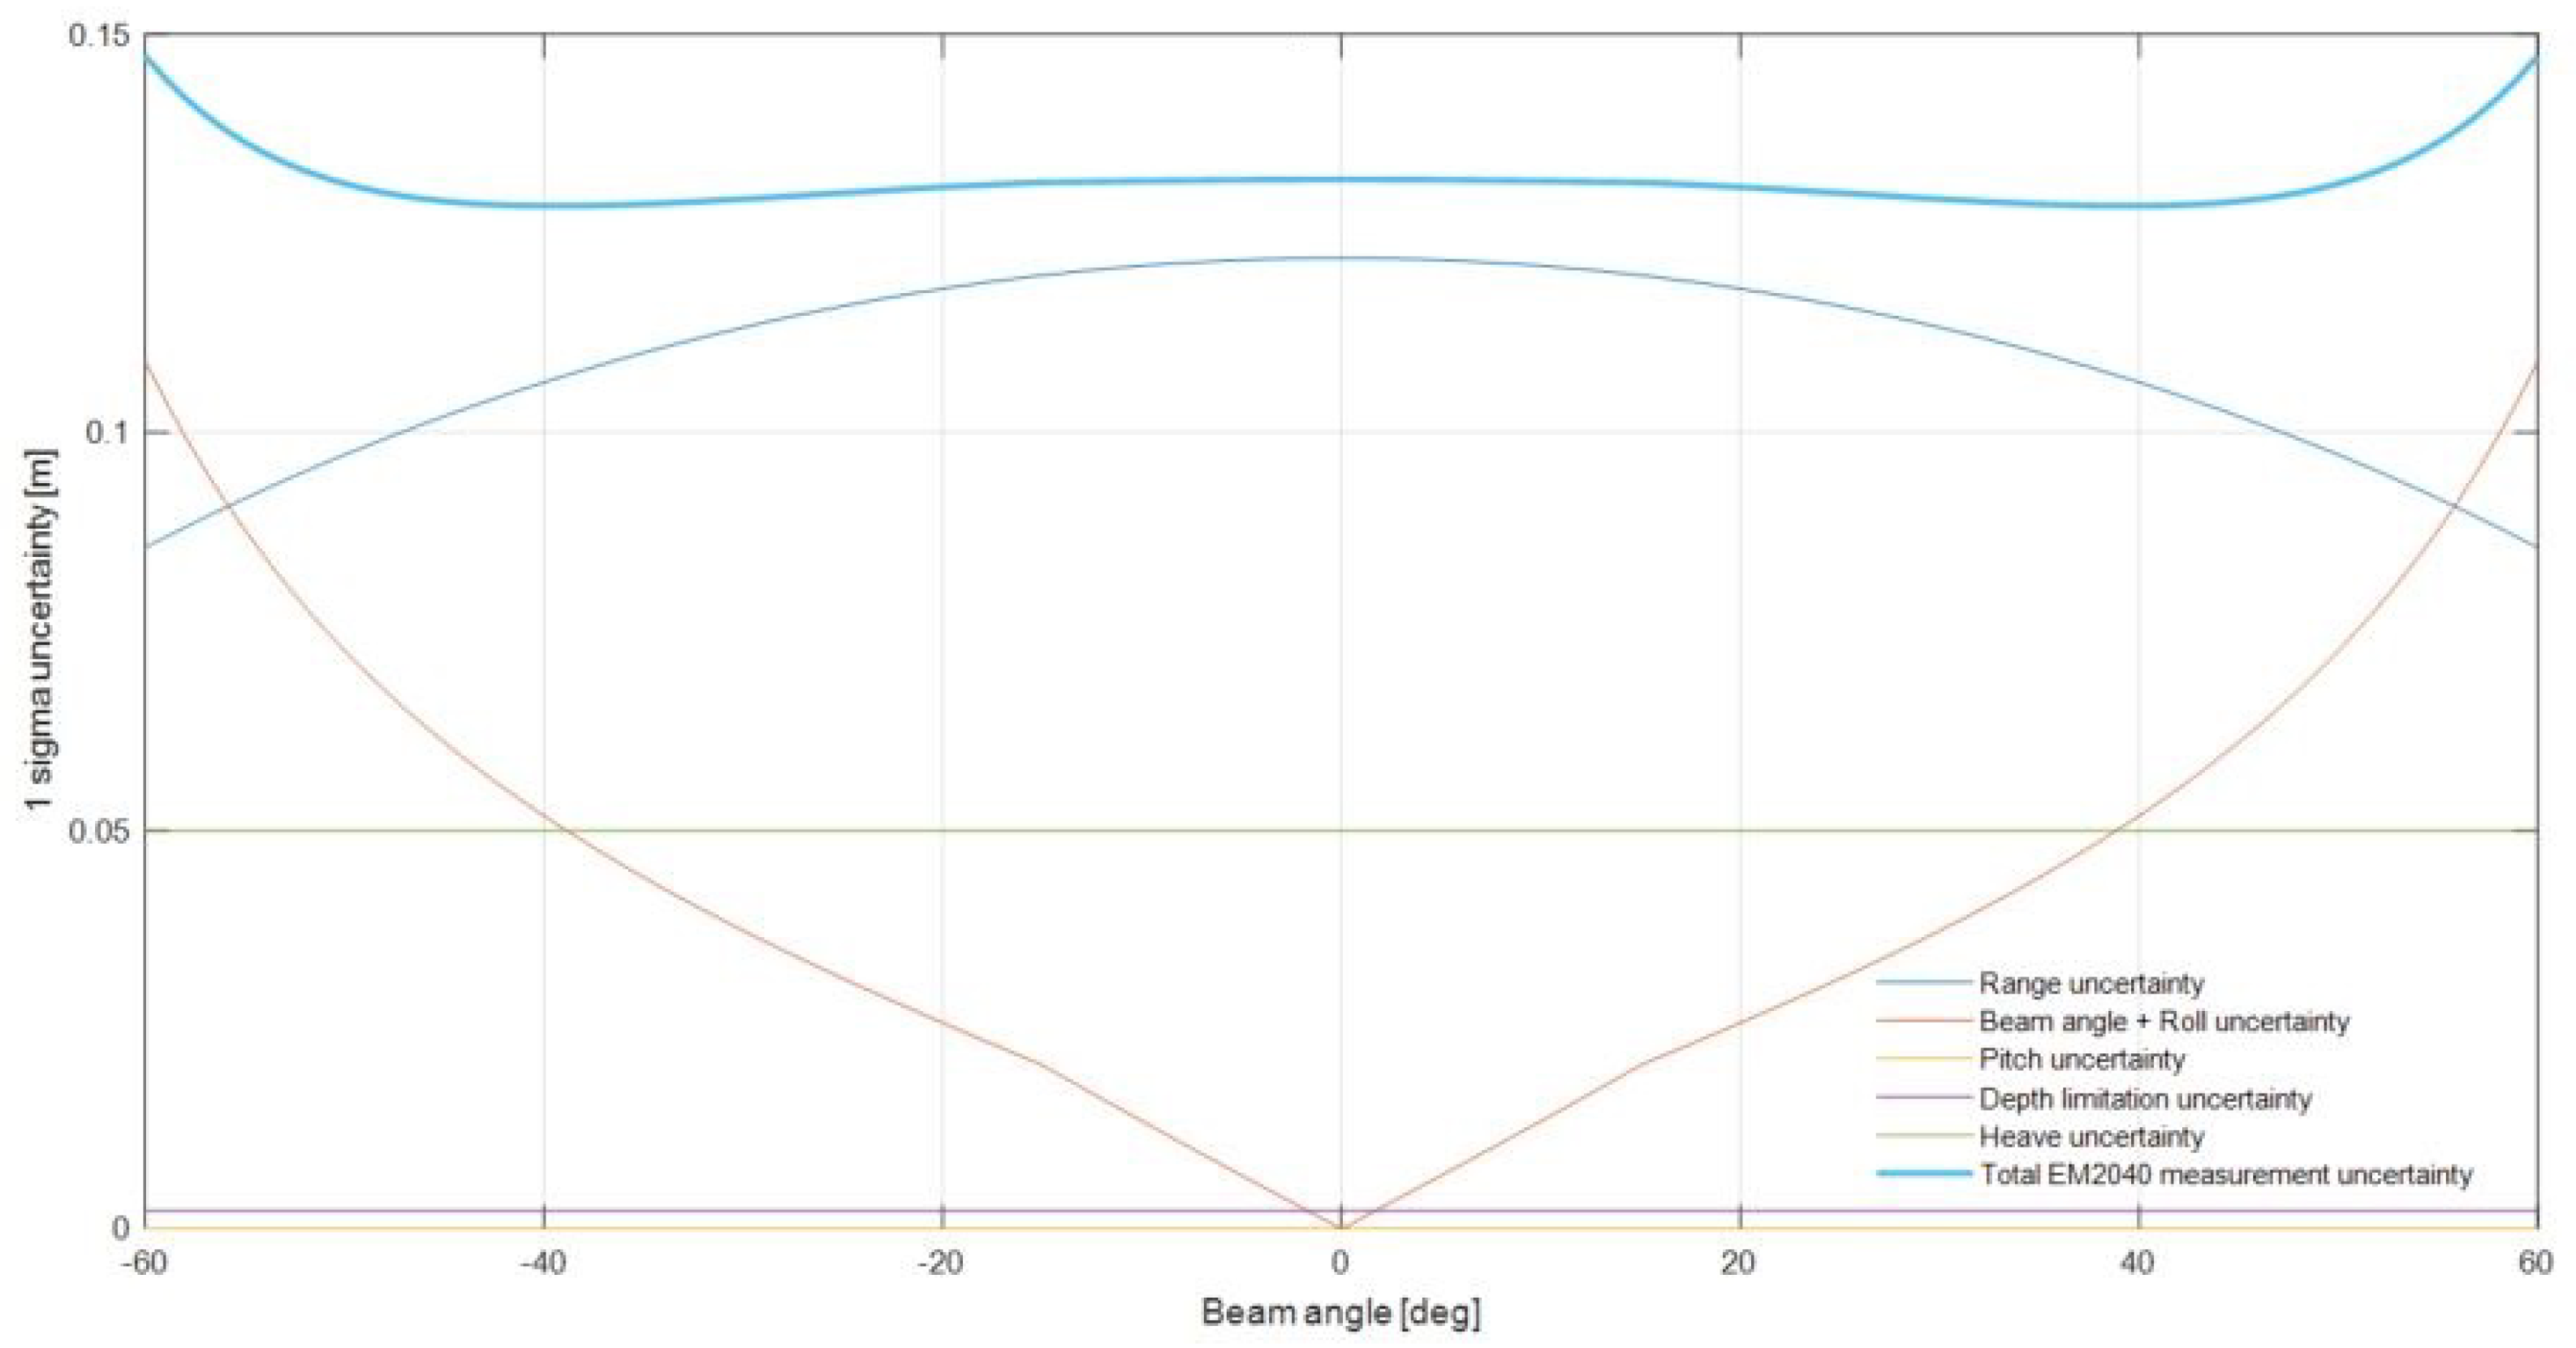
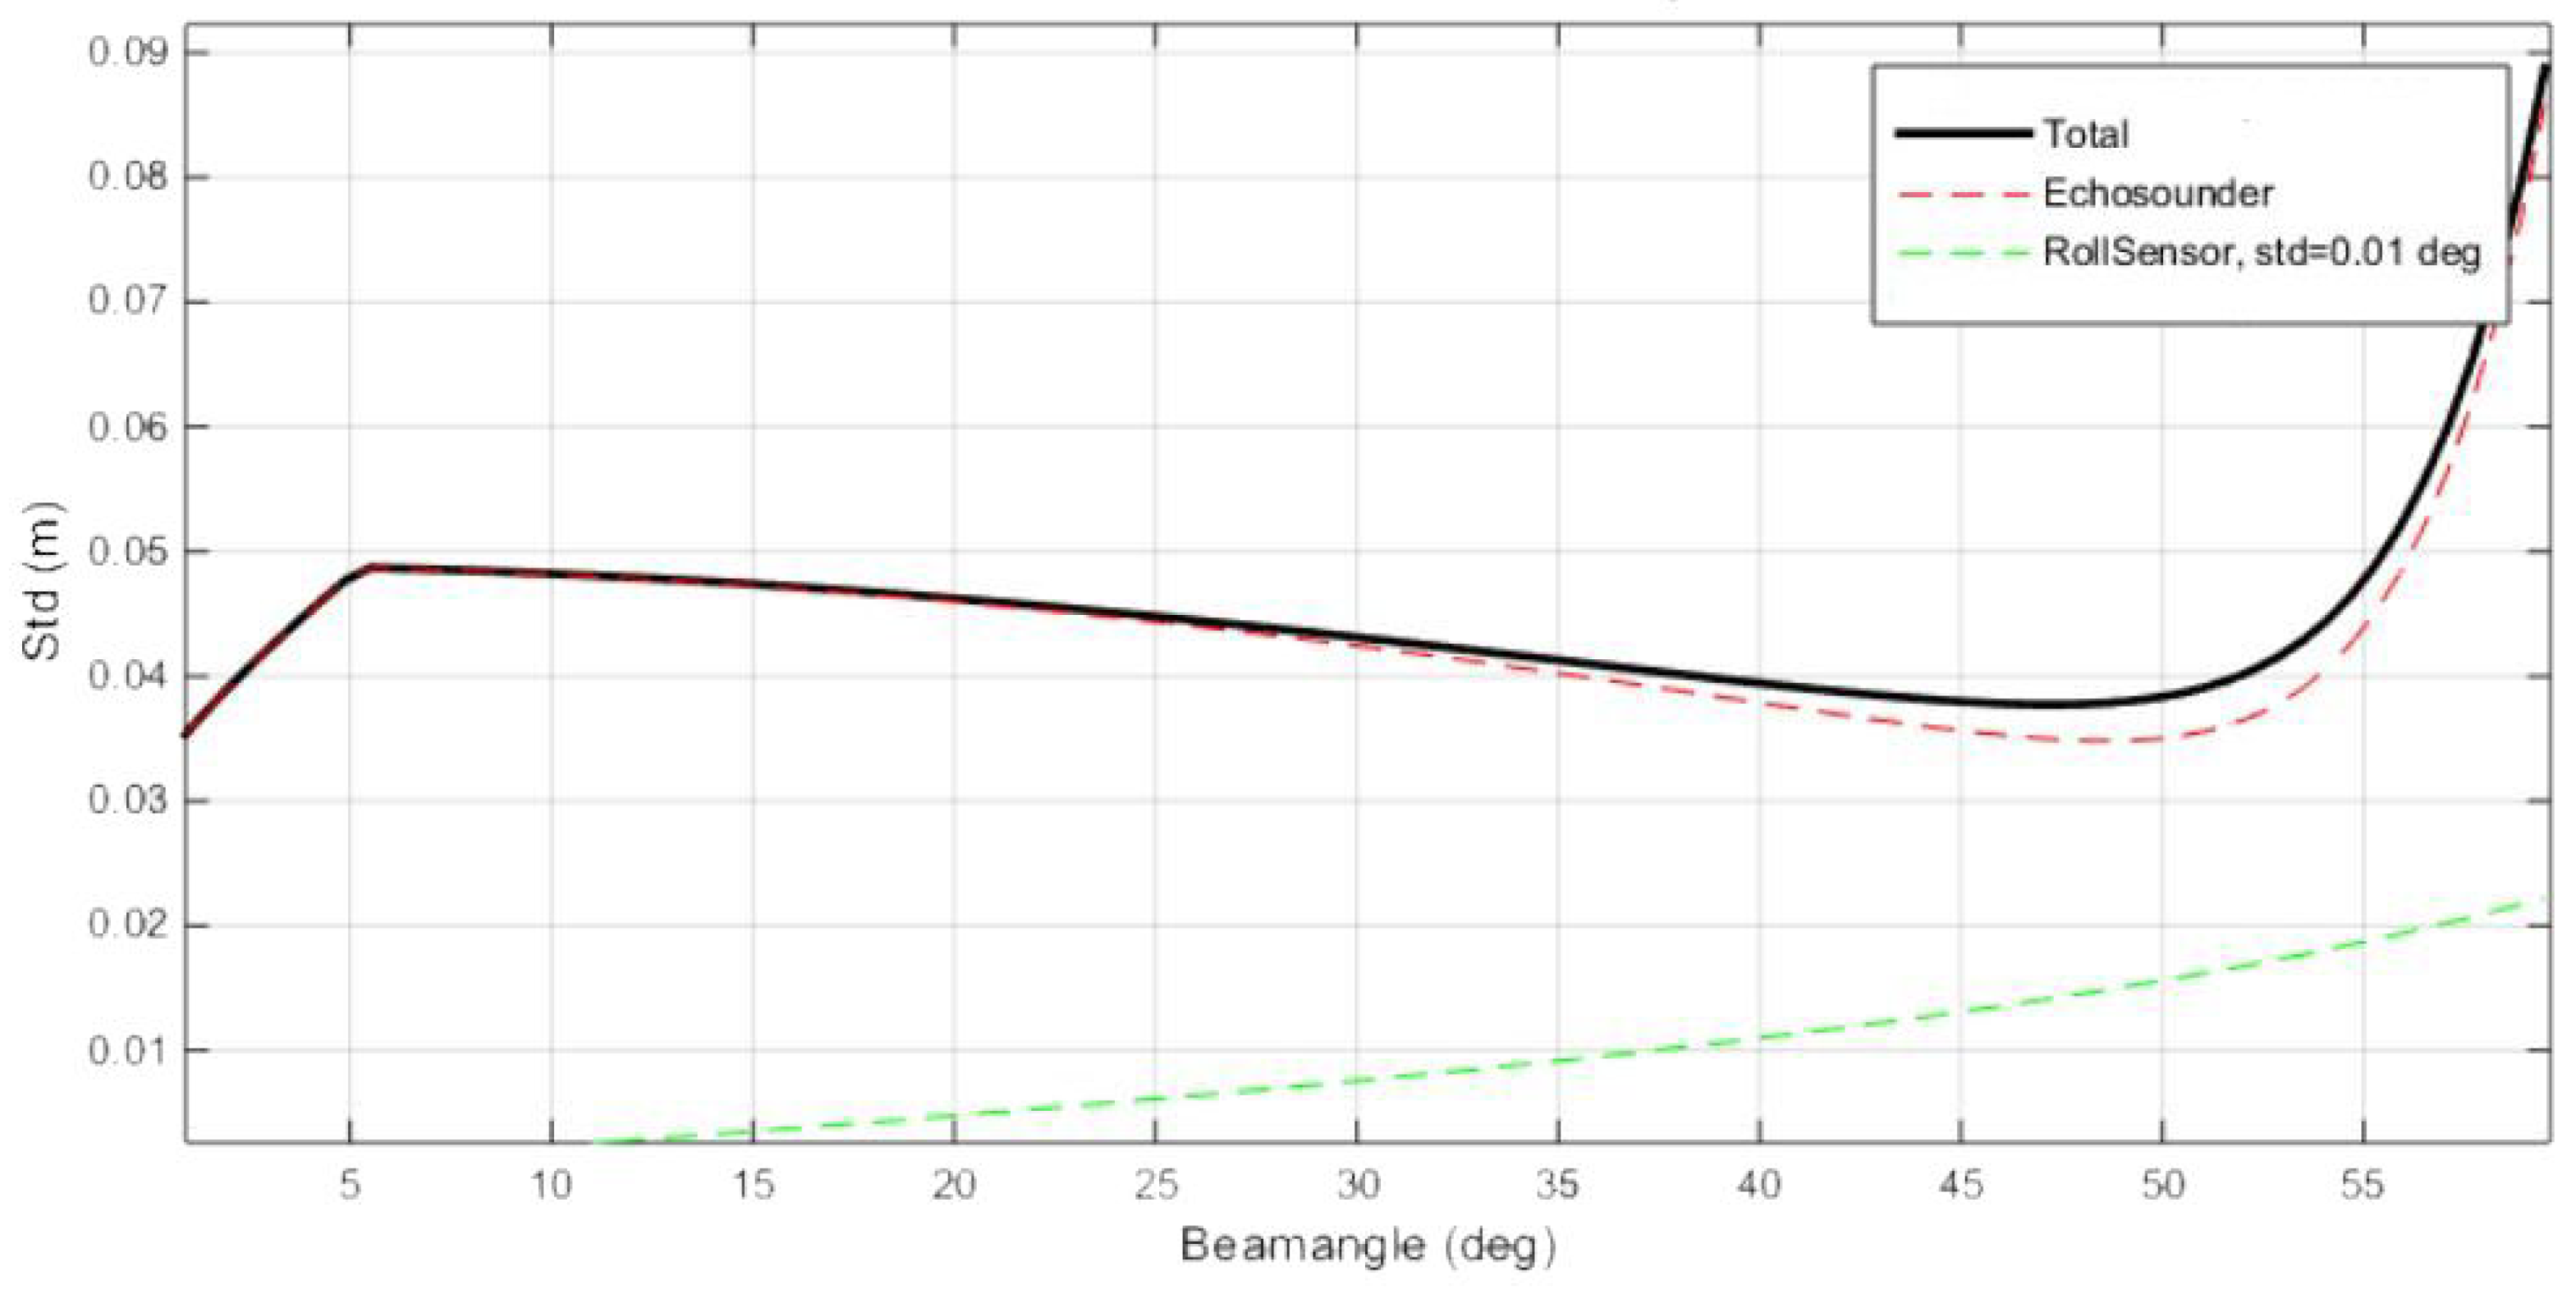
Several components of total MBES uncertainty are range dependent, thus the 2 σ uncertainty value is presented as a function of beam angle or ground range (Figure 15). The calculations methods from [29], applied for the EM 2040 component of the mapping system, resulted in the theoretical uncertainty values shown in Figure 15.
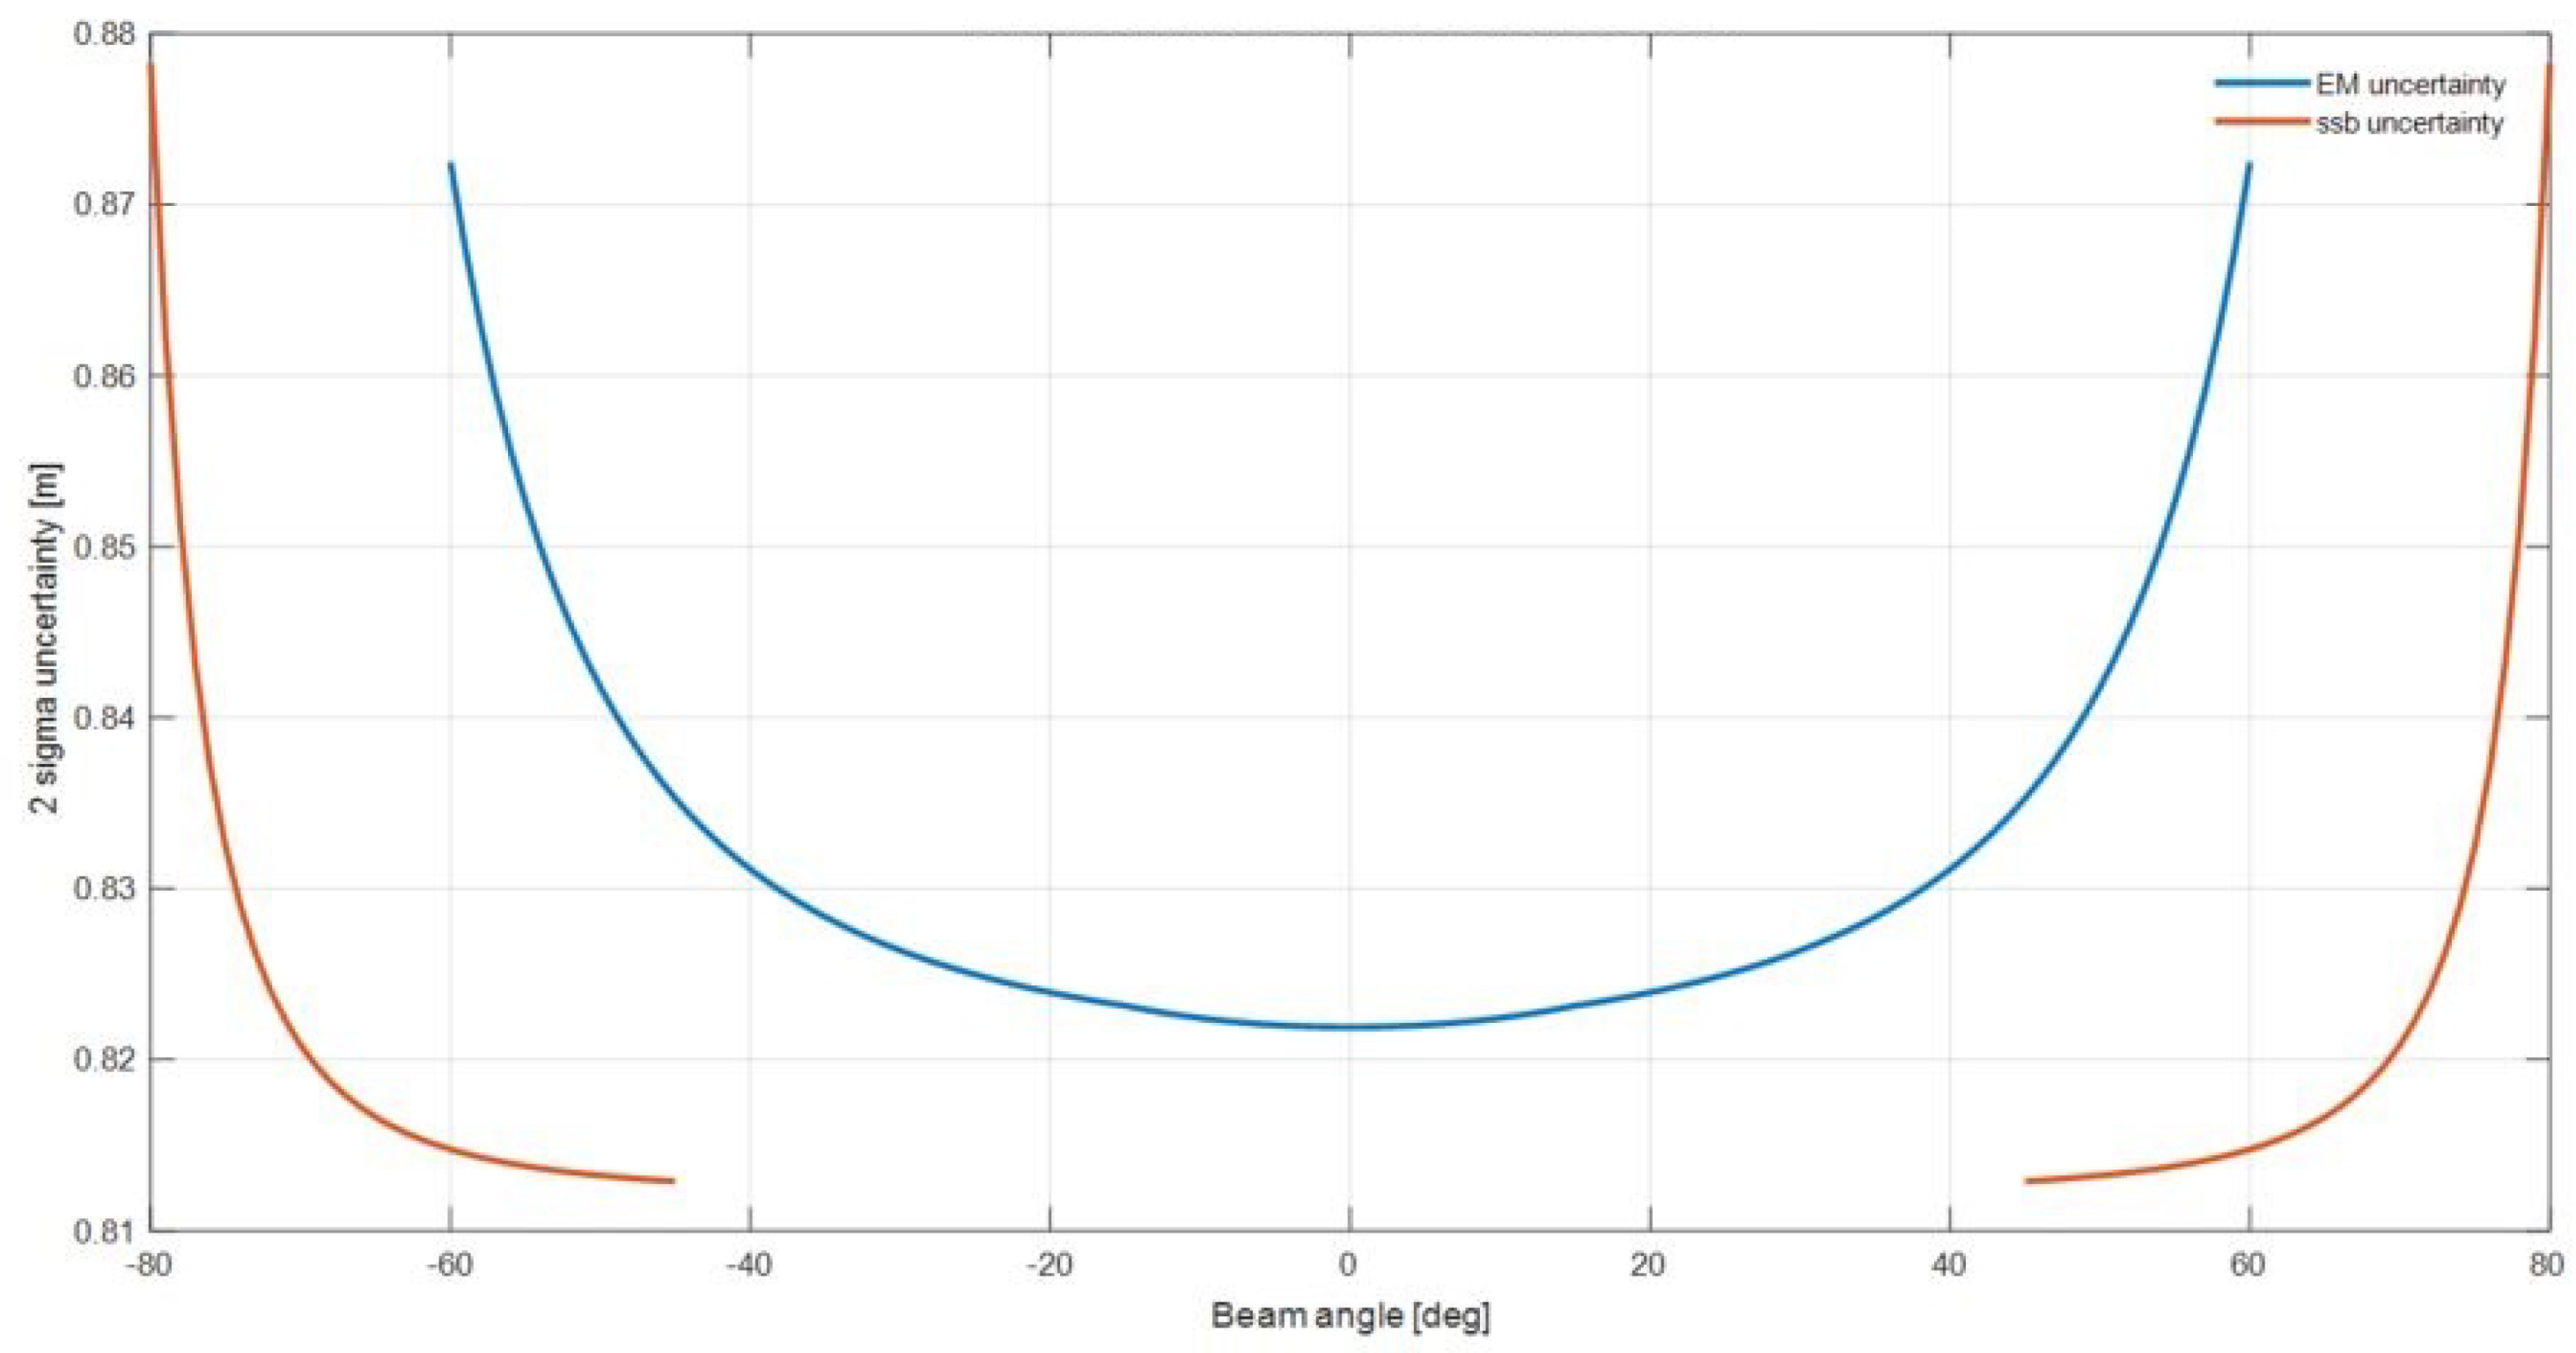
HISAS bathymetry measurement uncertainty was assessed based on the methodology presented in [30,31]. Figure 16 present the combined uncertainty values for both mapping devices, according to the sectors they cover.

Measurement by USV SEA-KIT

EM 304 measurement uncertainty was assessed based on the methodology provided in [28,29]. The parameters in Table 9 were used.
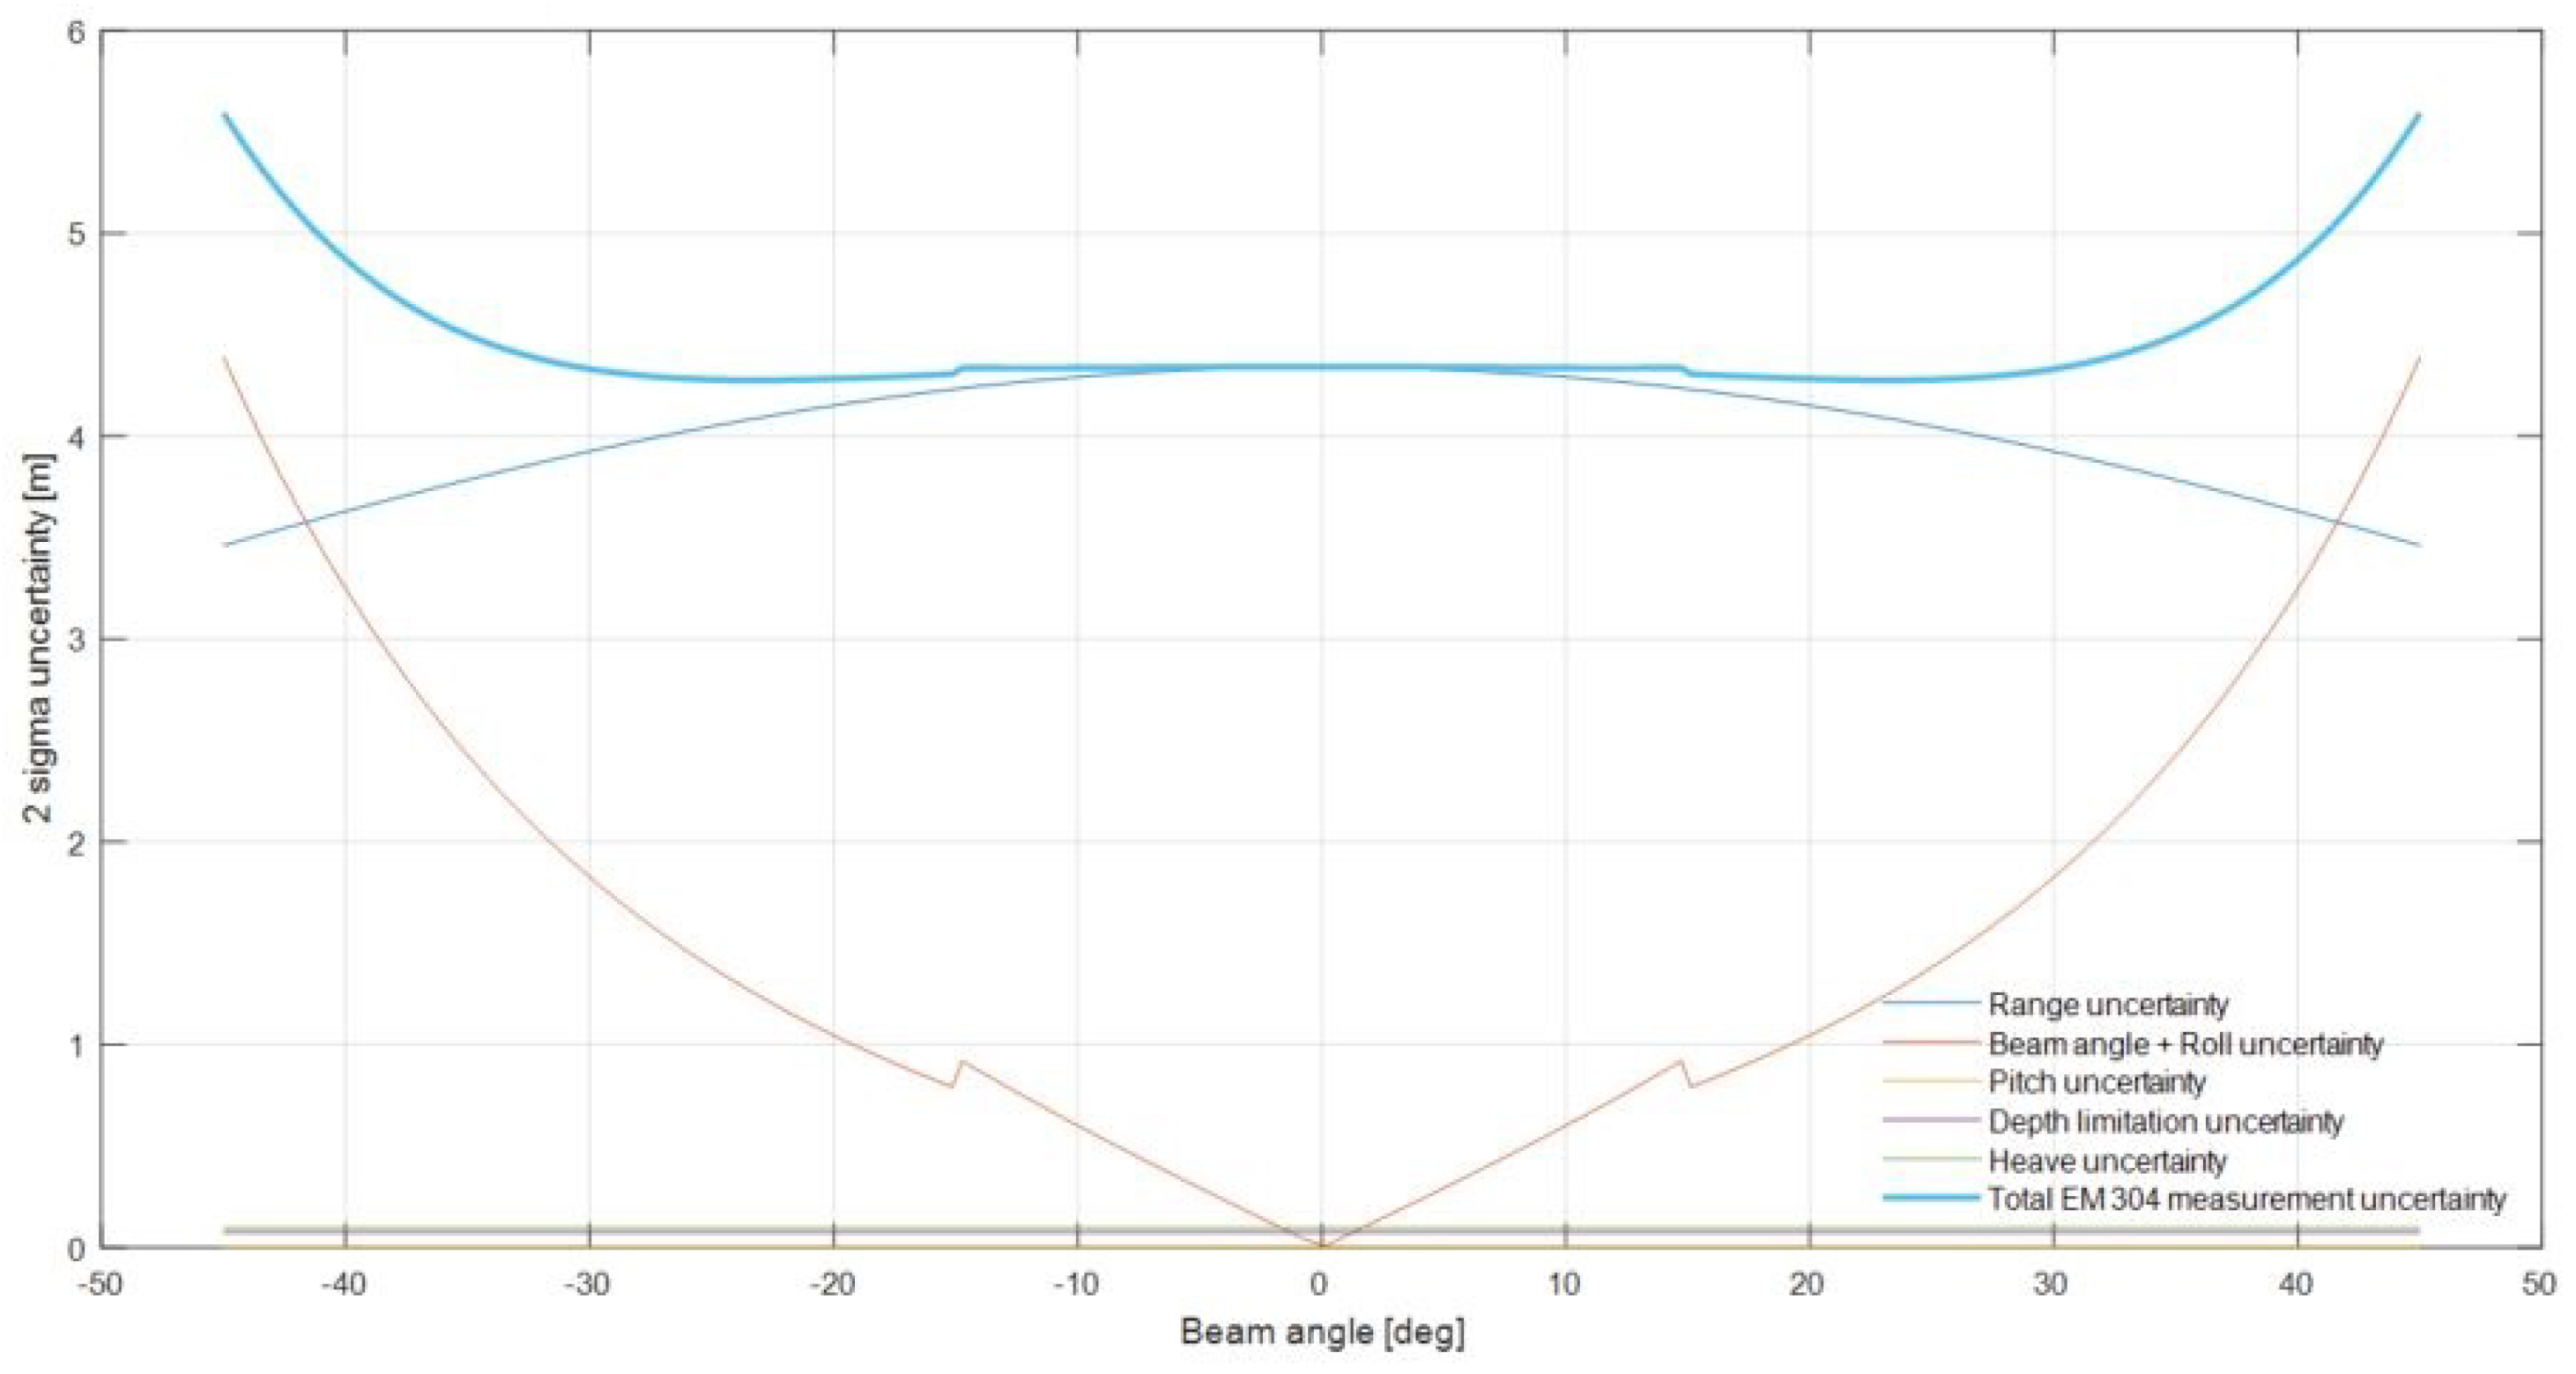
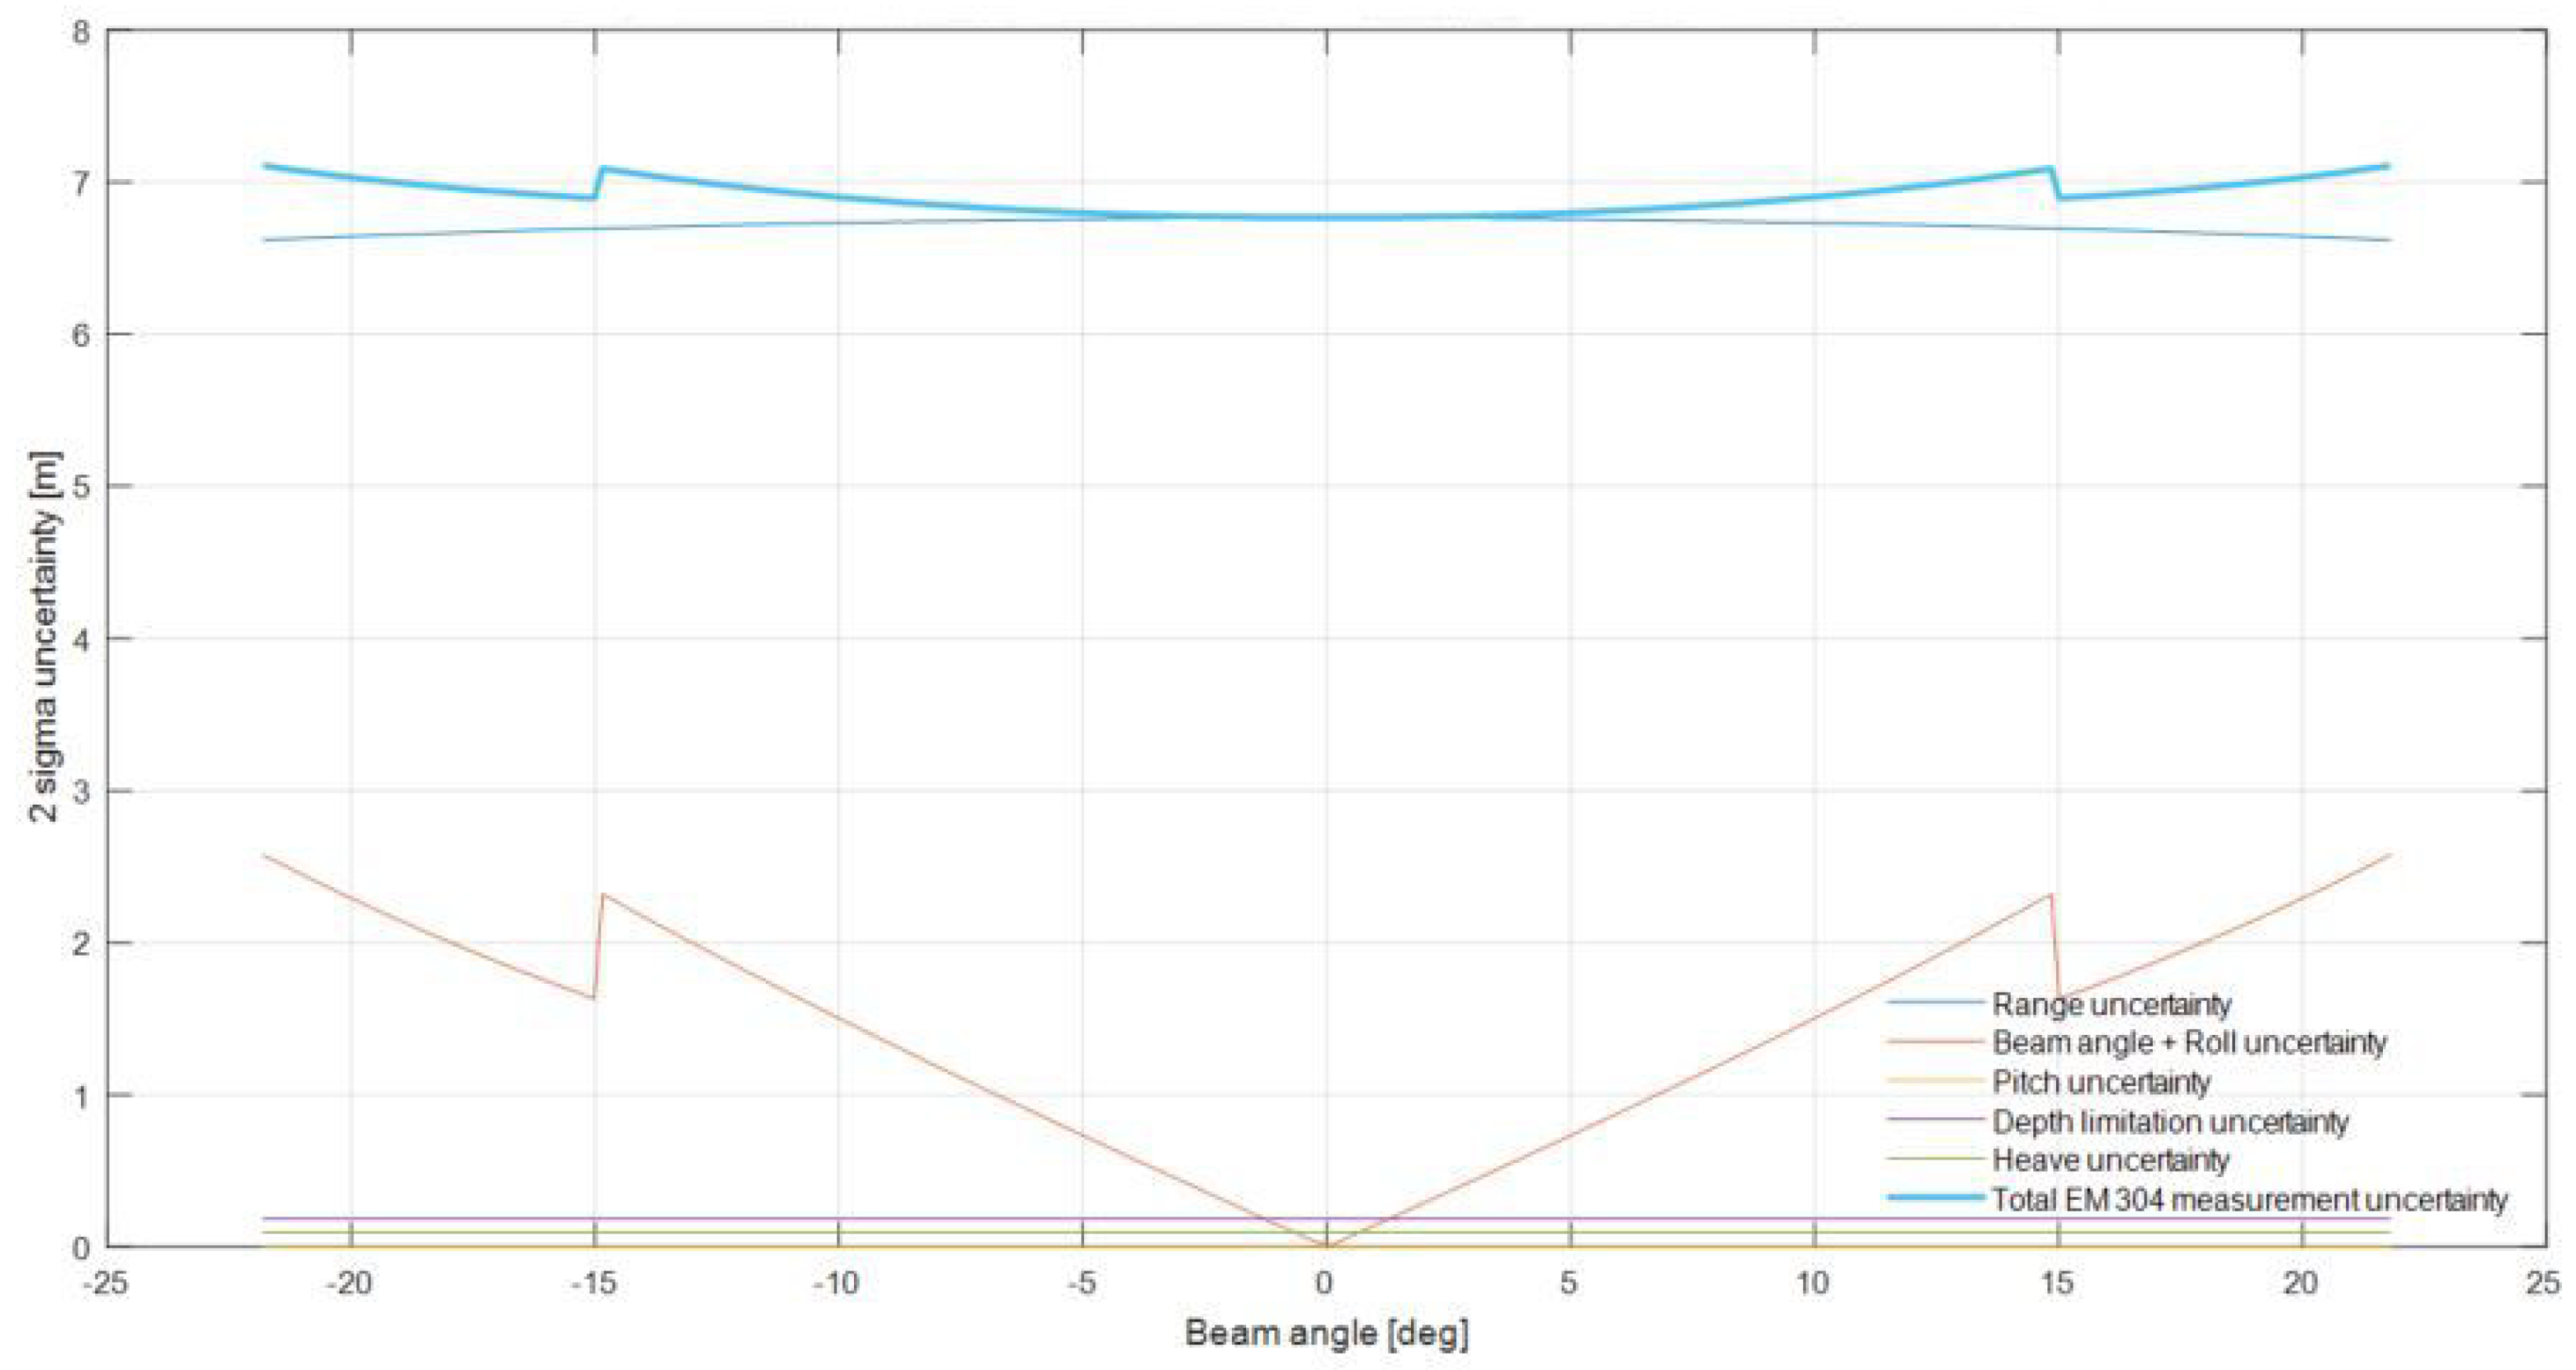
Several components of the total MBES uncertainty are range dependent, thus the 2 σ uncertainty value is presented as a function of beam angle. Figure 17 and Figure 18 refer to 1000 and 2500 m depths, respectively.

4.1.2. Horizontal Uncertainty Estimation

The following sources affect the combined GPS-USBL position estimates:
  • GPS accuracy;
  • USBL measurement accuracy;
  • surface ship attitude errors/measurement errors; and
  • sound velocity errors.
It should be understood that the complete estimation is the accumulation of the above; however, this does not consider the AINS component.
GPS accuracies, depending on the position determination method, vary from 2.0 m for Standard Positioning Service, to 0.01 m for Real-Time Kinematic positioning. These result in a simple direct accumulative error in the overall positioning budget of AUV. In the case of the survey described here, with the differential corrections, the accuracy of GNSS positioning was on the level of 0.1 m.
HiPAP USBL produces its position estimation based on measurements of horizontal bearing, vertical bearing, and distance. The bearing accuracy is 0.06 (1 σ ) and the distance accuracy of <0.05 m (1 σ ) assuming 20 db SNR is realized. The HiPAP 502 system utilized in Greece is a third generation system that generally achieved two times better angular accuracy with a twofold increase in range accuracy when compared with previous comparative studies done for these system [32]. Considering the system specification, the expected accuracies of HiPAP at various depths is shown in Table 10.
Since the linear offsets between the transducer and the reference point (RP) in AUV and GPS and RP in USV are small, the uncertainty introduced by system installation accuracy estimated in the lever arm calculation is also believed to be negligible. The AUV horizontal position uncertainty, due to surface ship attitude uncertainty assuming 0.01 (1 σ ) in roll and pitch and 0.1 (1 σ ) in heading, is shown in Table 11.
The above estimates were largely based on previous generation technology and used as inputs to the USBL positioning. At a depth of 2000 m, the uncertainty related to the ship attitude is about 0.49 m. The Seapath used in the Team’s setup is a 130 series equipped with an MGC inertial unit, which has expected roll and pitch uncertainties of 0.01 and the heading accuracy is given as 0.1 RMS. Compared to the estimates above, this means that the value 0.49 m has been overestimated.
The uncertainty of the SVP was assumed to be 1 m/s (1 σ ). In practice, the SVP error becomes smaller with depth due to stationary effects. It was, however, found that the horizontal AUV position error due to SVP uncertainty for a depth of 50 m case was about 0.05 m (1 σ ) [32].
Considering the above information, we can recalculate the overall error budget for the USBL, motion device and installation uncertainties, GPS uncertainties, and sound velocity as used in Kalamata, Greece. The estimates and system specification listed in Table 12 were used for this recalculation.
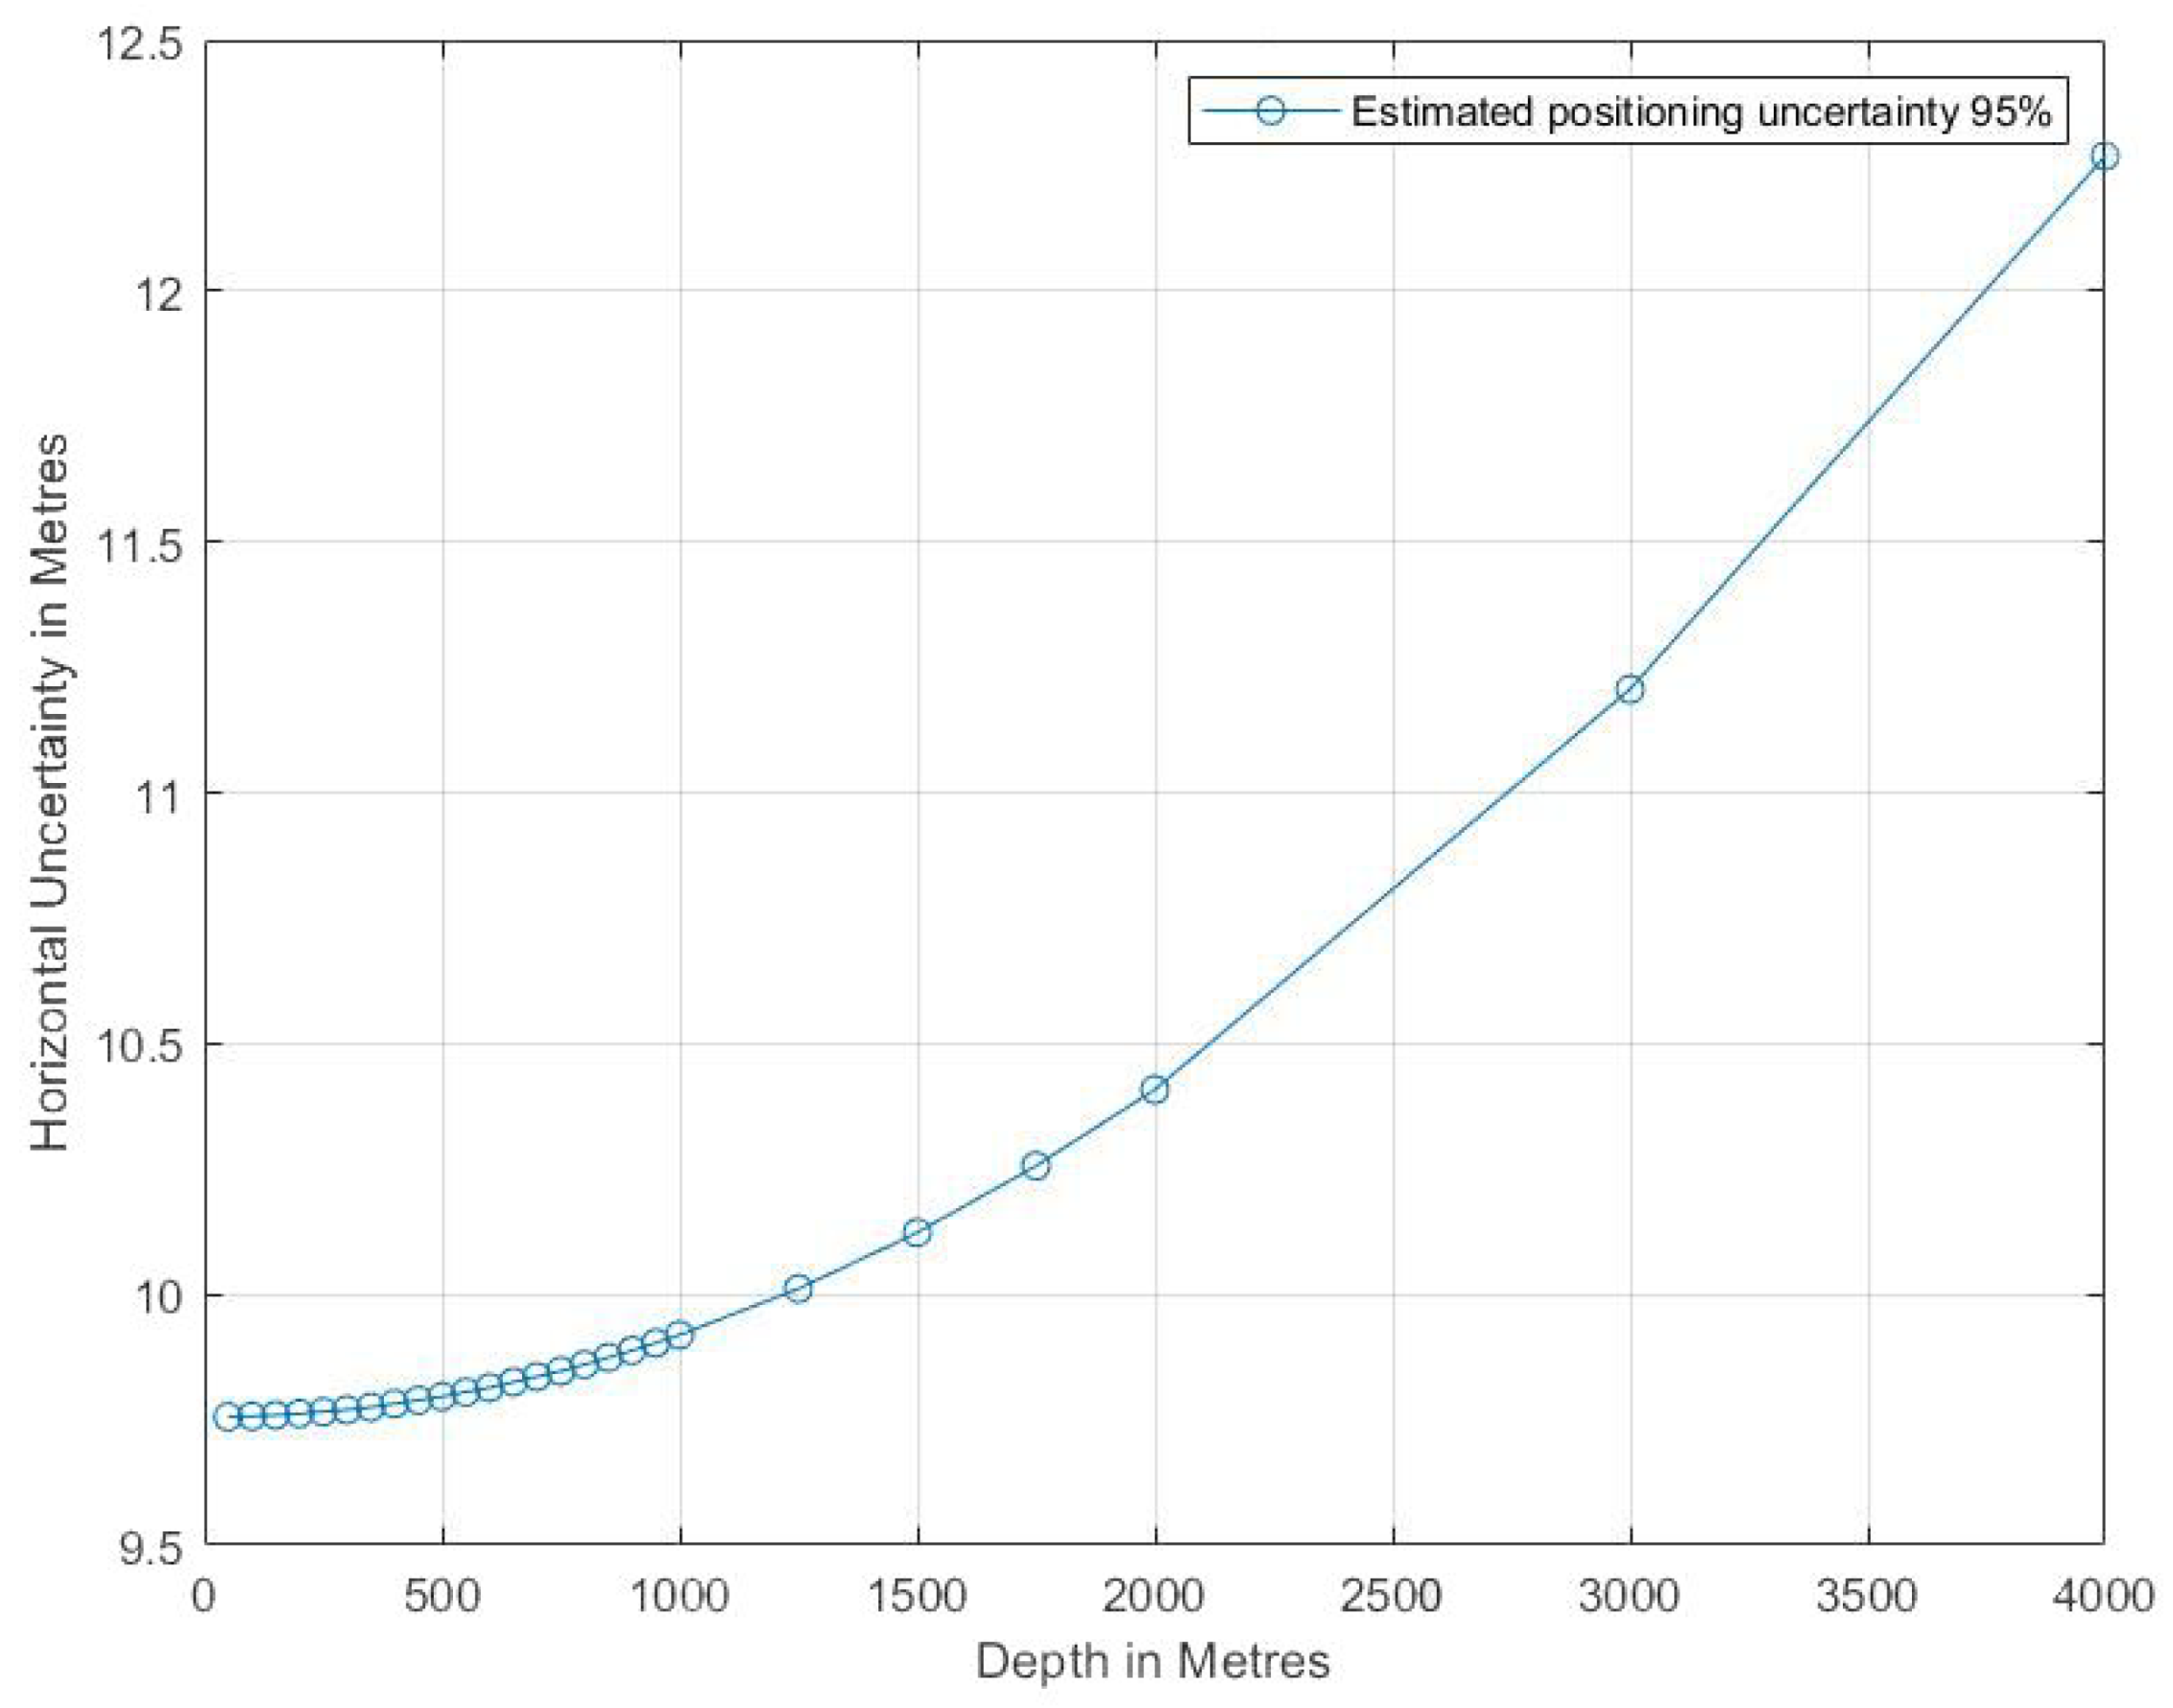
With the above, we calculated the total combined positioning uncertainty excluding the AINS uncertainty, 2 σ (Figure 19), assuming the offset in XY plane between AUV and USV equal to 50 m. This would be typical to the operational scenario, where the AUV was running in a supervised, standard HISAS operation.
If we consider the wide area mapping, the operation in Kalamata ran typically with an offset of X < 50 m, while Y extended to 1500 m. Considering this, the estimated total horizontal uncertainty translates to the graph presented in Figure 20.
While this exemplifies the accumulative error of USBL, positioning, motion, and sound velocity, the complete AUV navigation system is typically based on Aided Inertial Navigation System (AINS) performance and the use of a Kalman Filter (KF) for carrying out the fusion of the different sensor data (Droppler Velocity Log, Motion Sensor, and GPS) [33]. The sensor and system response models used to generate the KF are critical to the accuracy of the solution, and, as a result, the final AUV solution can be considerably better than the predicated USBL weighted solution above.
In using NavLab, Table 13 shows the predicted smoothed values (NavLab uses both past and future sensor measurements and KF co-variances to filter and smooth the value, hence significantly improving its accuracy) of the AUV aided inertial navigation system horizontal position uncertainty (1 σ ) with GPS-HiPAP system (Figure 20).
Sensor alignment error, AUV attitude sensor, and sound velocity profile (SVP) measurement affect the sounding related uncertainty. Assuming small offsets between the sensors, the introduced uncertainty is negligible. Hence, it is disregarded.
The AUV attitude is estimated by the AINS either in-situ or in post processing. The sounding horizontal position uncertainty (1 σ ), due to AUV attitude uncertainty of 0.004 (1 σ ) in roll and pitch and 0.04 (1 σ ) in heading, when the AUV is 25 m above the seafloor is between 0.02 and 0.14 m [32].
The SVP below the AUV is of importance for the horizontal sounding position. For the HISAS standard mode, the typical beam elevation angles relative to the nadir are between 45 and 85 [32]. This means that the SVP errors are of greater importance than in typical USBL operations. The performance of the HISAS will vary more in shallow than in deep waters, hence the SVP error usually becomes smaller with depth. The typical range of sounding position uncertainty (1 σ ) due to SVP uncertainty of 1 m/s (1 σ ) in deep water, with the AUV about 25 m above the seafloor, is between 0.02 and 0.14 m. The sounding position uncertainty depends on the ground range and beam elevation from nadir.
It should be pointed out that this report is composed based on theoretical uncertainty models described in the peer-review papers. The real system performance, due to sophisticated signal analysis algorithms, is able to provide more accurate data, which was observed during in-field tests.

4.2. Mapping Resolution

Vertical mapping resolution is considered as an ability to resolve between two depths values in the vertical plane, or the minimum vertical size of the object possible to be detected by the sonar. After this definition, we can equate it with the expected range resolution for operational parameters of each sonar. Horizontal mapping resolution (angular (along track) or range (across track)) is understood as a distance necessary to distinguish between two separate targets of equal reflection strength.

4.2.1. Vertical Mapping Resolution

The vertical component of the AUV generally is non-consequential when considering the vertical resolution. As an example, EM 2040 range resolution is governed by the pulse length. Industry traditionally accepts the following equation [34]:
R v = c T p 2
where R v is the vertical resolution [m]; c is the sound speed [m/s]; and T p is the pulse duration [s].
Therefore, with an effective 100 μ s pulse duration as used in Kalamata, we can expect 7.5 cm at nadir for range resolution. Note that KM echosounders use complex sampling which generally allows a division by 4 in the above formula, increasing the range resolution of the system to 3.75 cm. This is of course at nadir and the vertical resolution across track will vary as a function of detection type. This can be plotted from KM tools. The estimated vertical resolution across swath is shown in Figure 21.
The three types of bathymetry data, collected by the AUV, are characterized with the following approximate vertical resolution values for middle-swath beam, as presented in Table 14.
For EM 304, we can equate it with a range resolution, which for this echo sounder is approximately 0.46 m. Note that this EM 304 solution for the competition used a modified FM pulse, which allowed the greater bandwidth, in order to maintain the vertical mapping resolution of 0.5 m. This was achieved given the predetermined narrow swath angles that allow data density requirements to be met.

4.2.2. Horizontal Mapping Resolution

With respect to multibeam echosounder, traditionally, a horizontal resolution equates to or can be approximated as the 3-dB cutoffs in the transmission and reception beam patterns. Thus, the along track resolution is a function of the transmission pattern and for summed element amplitude beamformer the across track resolution is that of the receiver beam pattern. Modern processing techniques allowing split phase beamforming meaning the across track resolution becomes a function of the sampling rate and the ability to distinguish on the split phase arrays, hence the across track resolutions does not necessarily increase with angle. With interrferrometric system, the along track resolution is analogous to the multibeam; however, the across track becomes a function of pulse length, sampling rates, and detection methods.

1032 Wide Area Mode

Theoretical along track resolution of side scan bathymetry is frequency, range, and array-size dependent. A 3-dB resolution is then defined by the equation [30,31]:
r e s x = 0.891 · λ L · r
where λ is the wavelength [m]; L is the physical length of the receiving array [m]; and r is the range from the transducer to the sounding point [m].
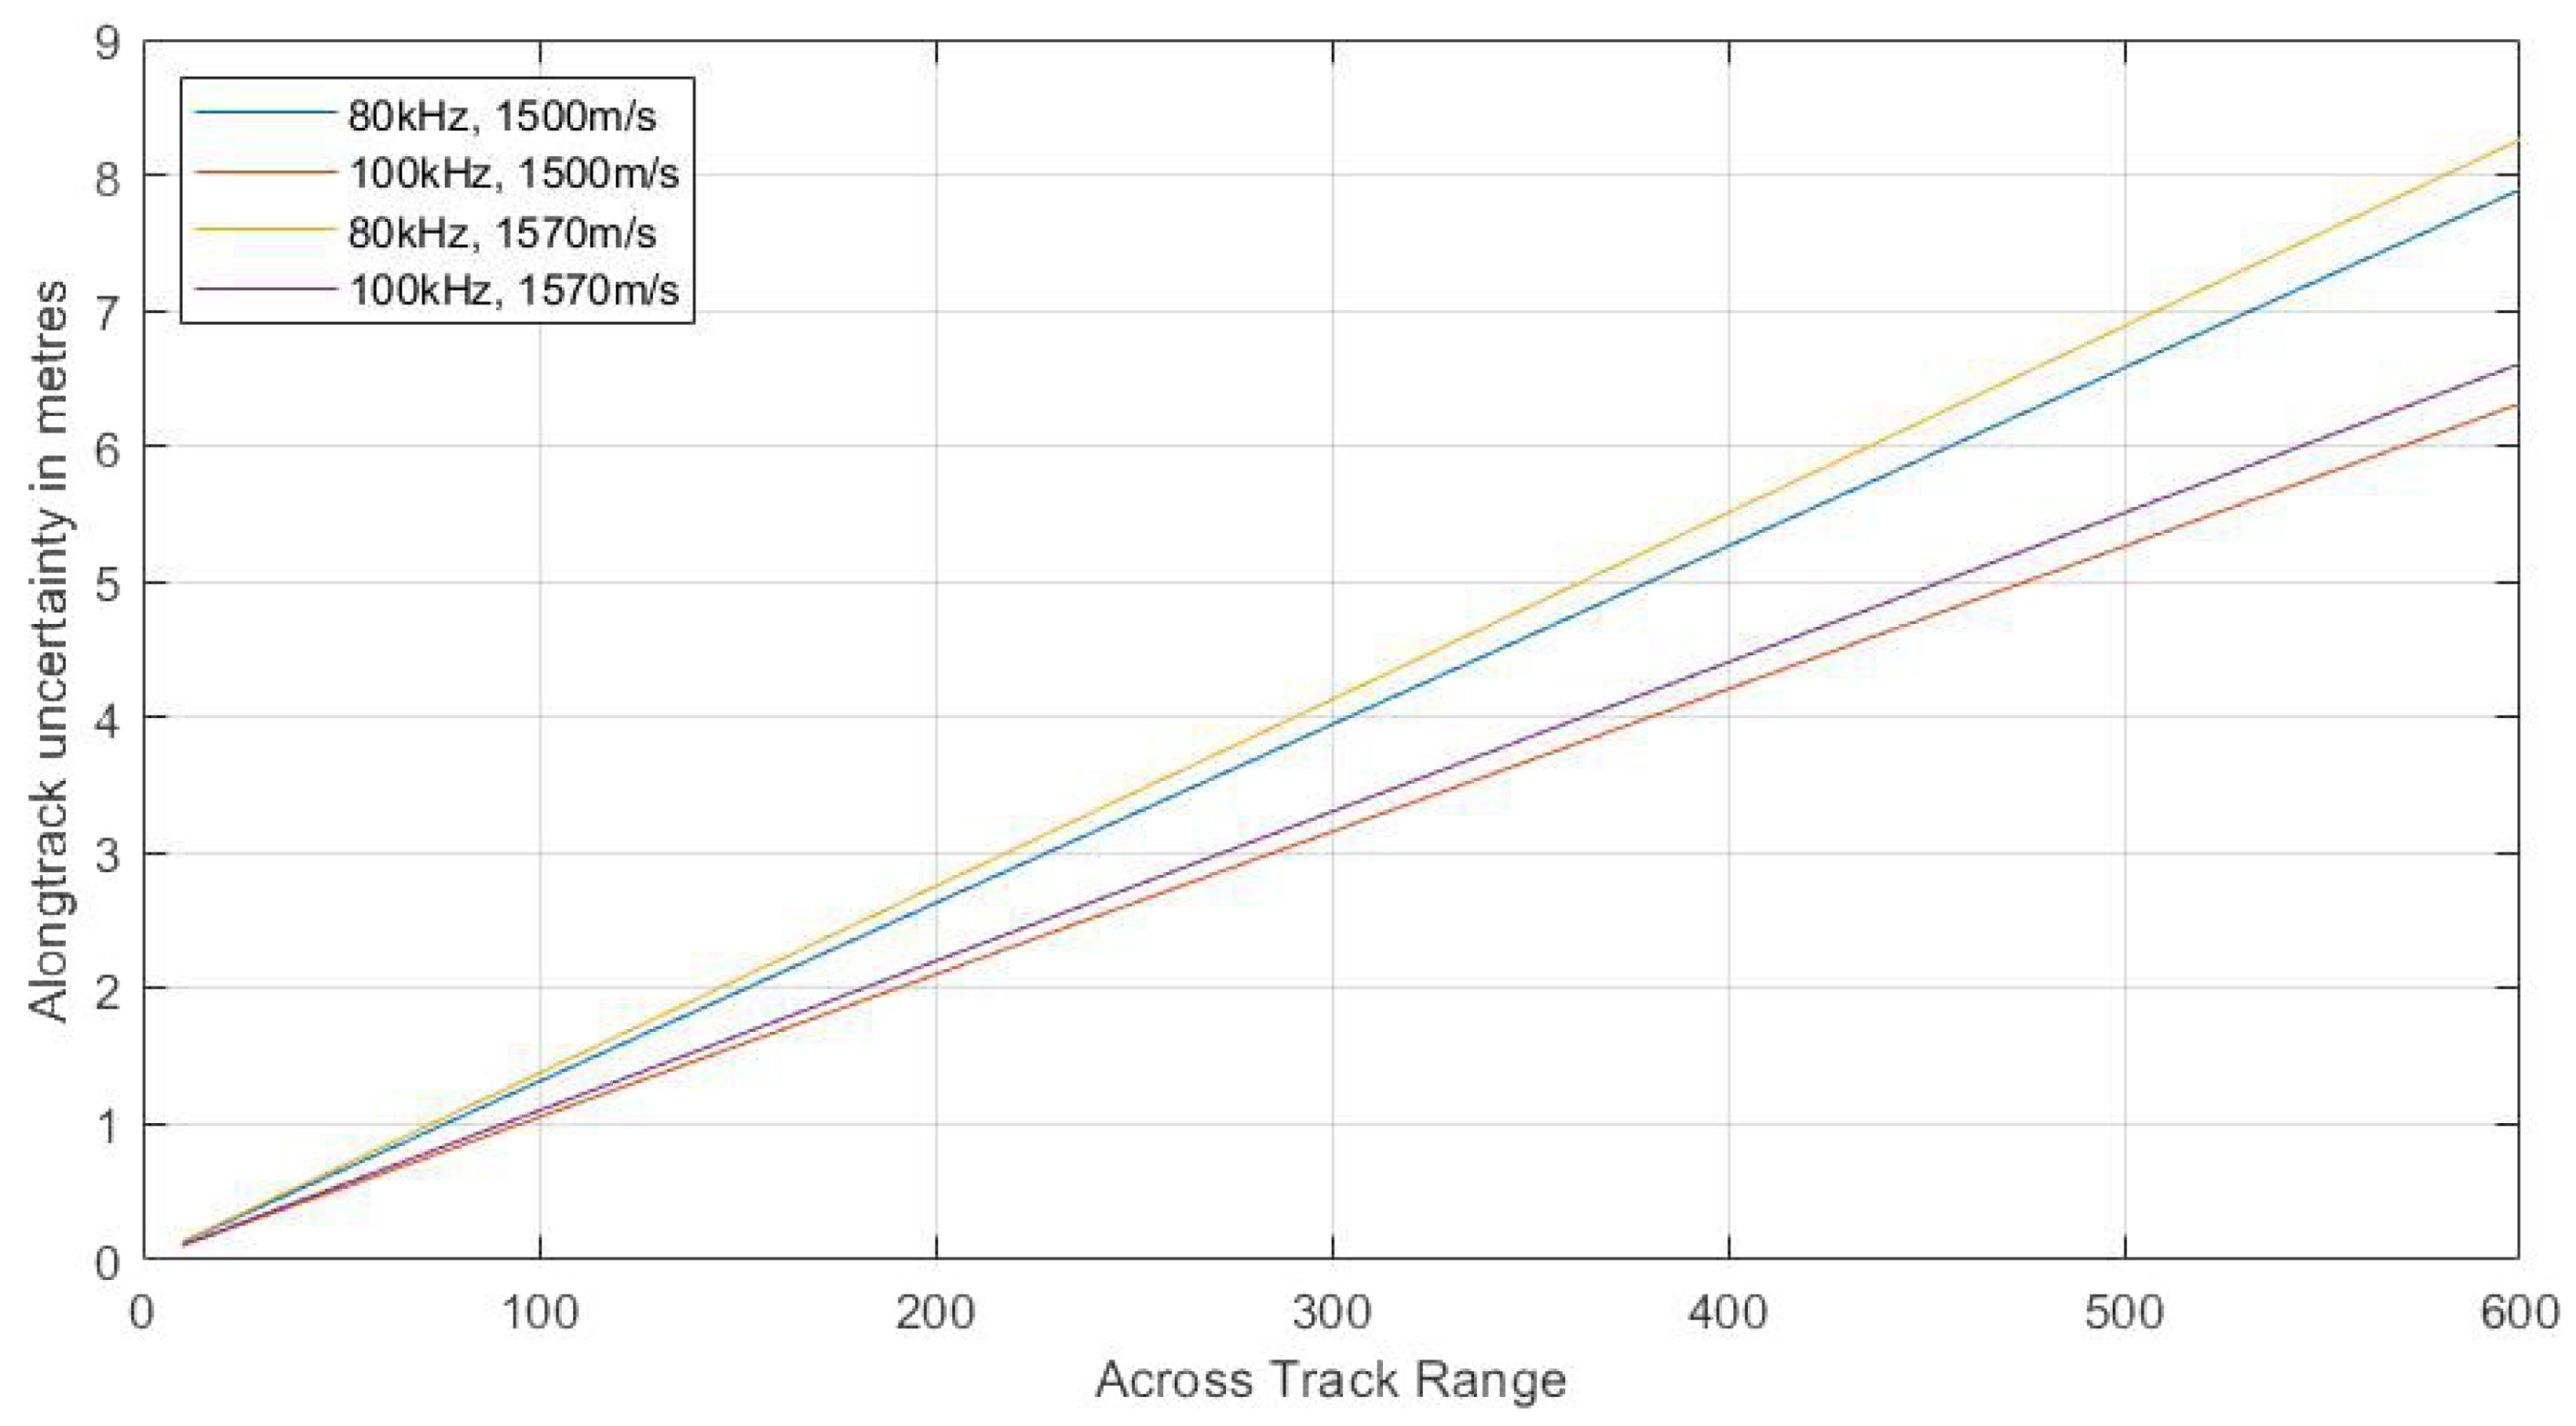
The results were calculated for the frequencies of 100 and 80 kHz, 1.27 m long Rx array (and a nominal sound speed of 1500 m/s versus 1570 as experienced at depth in Kalamata). Examples of the result values are presented in Figure 22.
Across track resolution is theoretically defined by the equation [30,31]:
r e s y = 4 3 · 3 4 · N s r r 2 h 2 · c 2 B
where N s is the the number of independent samples in a patch (an element of depth estimation process); h is the AUV altitude [m]; c is the sound speed [m/s]; and B is the signal bandwidth [Hz].
For h = 60 m, B = 30,000 Hz, c = 1500 m/s, and N s = 128, we received the results presented in Table 15.
Mapping resolution should not be confused with soundings density or the resolution of the final DTM. Sounding density measured across track for our survey is equal to 1.1 m for wide area mode. Along track separation between data points depends on the vehicle speed and pulse rate. Given the pulse rate of 1.2 Hz and nominal speed of 1.8 m/s, the wide area mode generates an along track sounding density of 1 point every 1.3 m. The final density then approximates from 1 to 1.5 points per 2 m cell, which was validated in the processed data. This allows the creation of a DTM of 5-m cell size with no interpolation, calculating each of the DTM points from multiple soundings.

HISAS 1032 Standard Mode

HISAS standard mode, after processing in dedicated software, offers data of much higher density and resolution. The achievable resolution, for both imagery and bathymetry, is in the order of centimeters and is range independent.
Theoretical along track resolution of SAS imagery is given by the equation [30,31]:
r e s x = d 2
where d is the receiver along-track element size.
For d = 3.75 cm, we received the 0.018 m along track resolution for all the ground ranges (here in the range from 40 to 1700 m.)
Across track resolution is theoretically defined by the equation:
r e s y = c 2 B
where c is the sound speed [m/s]; and B is the signal bandwidth [Hz]. This gives 0.0025 m of along track resolution for all ranges.
SAS bathymetry resolution depends of patch sizes, as follows:
r e s x b a t h y = r e s x P x , r e s y b a t h y = r e s y P y ,
where: r e s x and r e x y are the resolutions for SAS image; and P x and P y are the patch sizes (an element of depth estimation process).
Those parameters are specified in a processing software. For preferred values of P x = P y = 9 , we receive the along track resolution of 0.167 m and across track resolution of 0.225 m.

EM 2040

Resolution of Multibeam bathymetry data is limited by its footprint extent. This is theoretically defined by the equations:
r e s x = ϕ r c o s θ , r e s y = c T p 2 c o s θ ,
where c is the sound speed [m/s]; T p is the pulse duration [s]; ϕ is the beamwidth [rad]; and θ is the beam angle.
Note that, while the along track formula for r e s x remains valid for EM 2040, the across track r e s y becomes as per the HISAS system, a function of sample rate and sample density, controlled by the split phase detection of the EM system. This information is proprietary; however, the footprints can be calculated using a standard calculation tool provided from Kongsberg Maritime. Estimated beam footprints for 40 and 75 m altitude are shown in Table 16.
The above was calculated with the following oceanic parameters: temperature of 14.5 C, salinity of 38 ppt, and sound velocity of 1570 m/s.
Note that, as per HISAS, footprint size does not represent final DTM, and the sounding density should be taken into account. The respective sounding densities for EM 2040 at 40 and 70 m altitude are shown in Table 17.
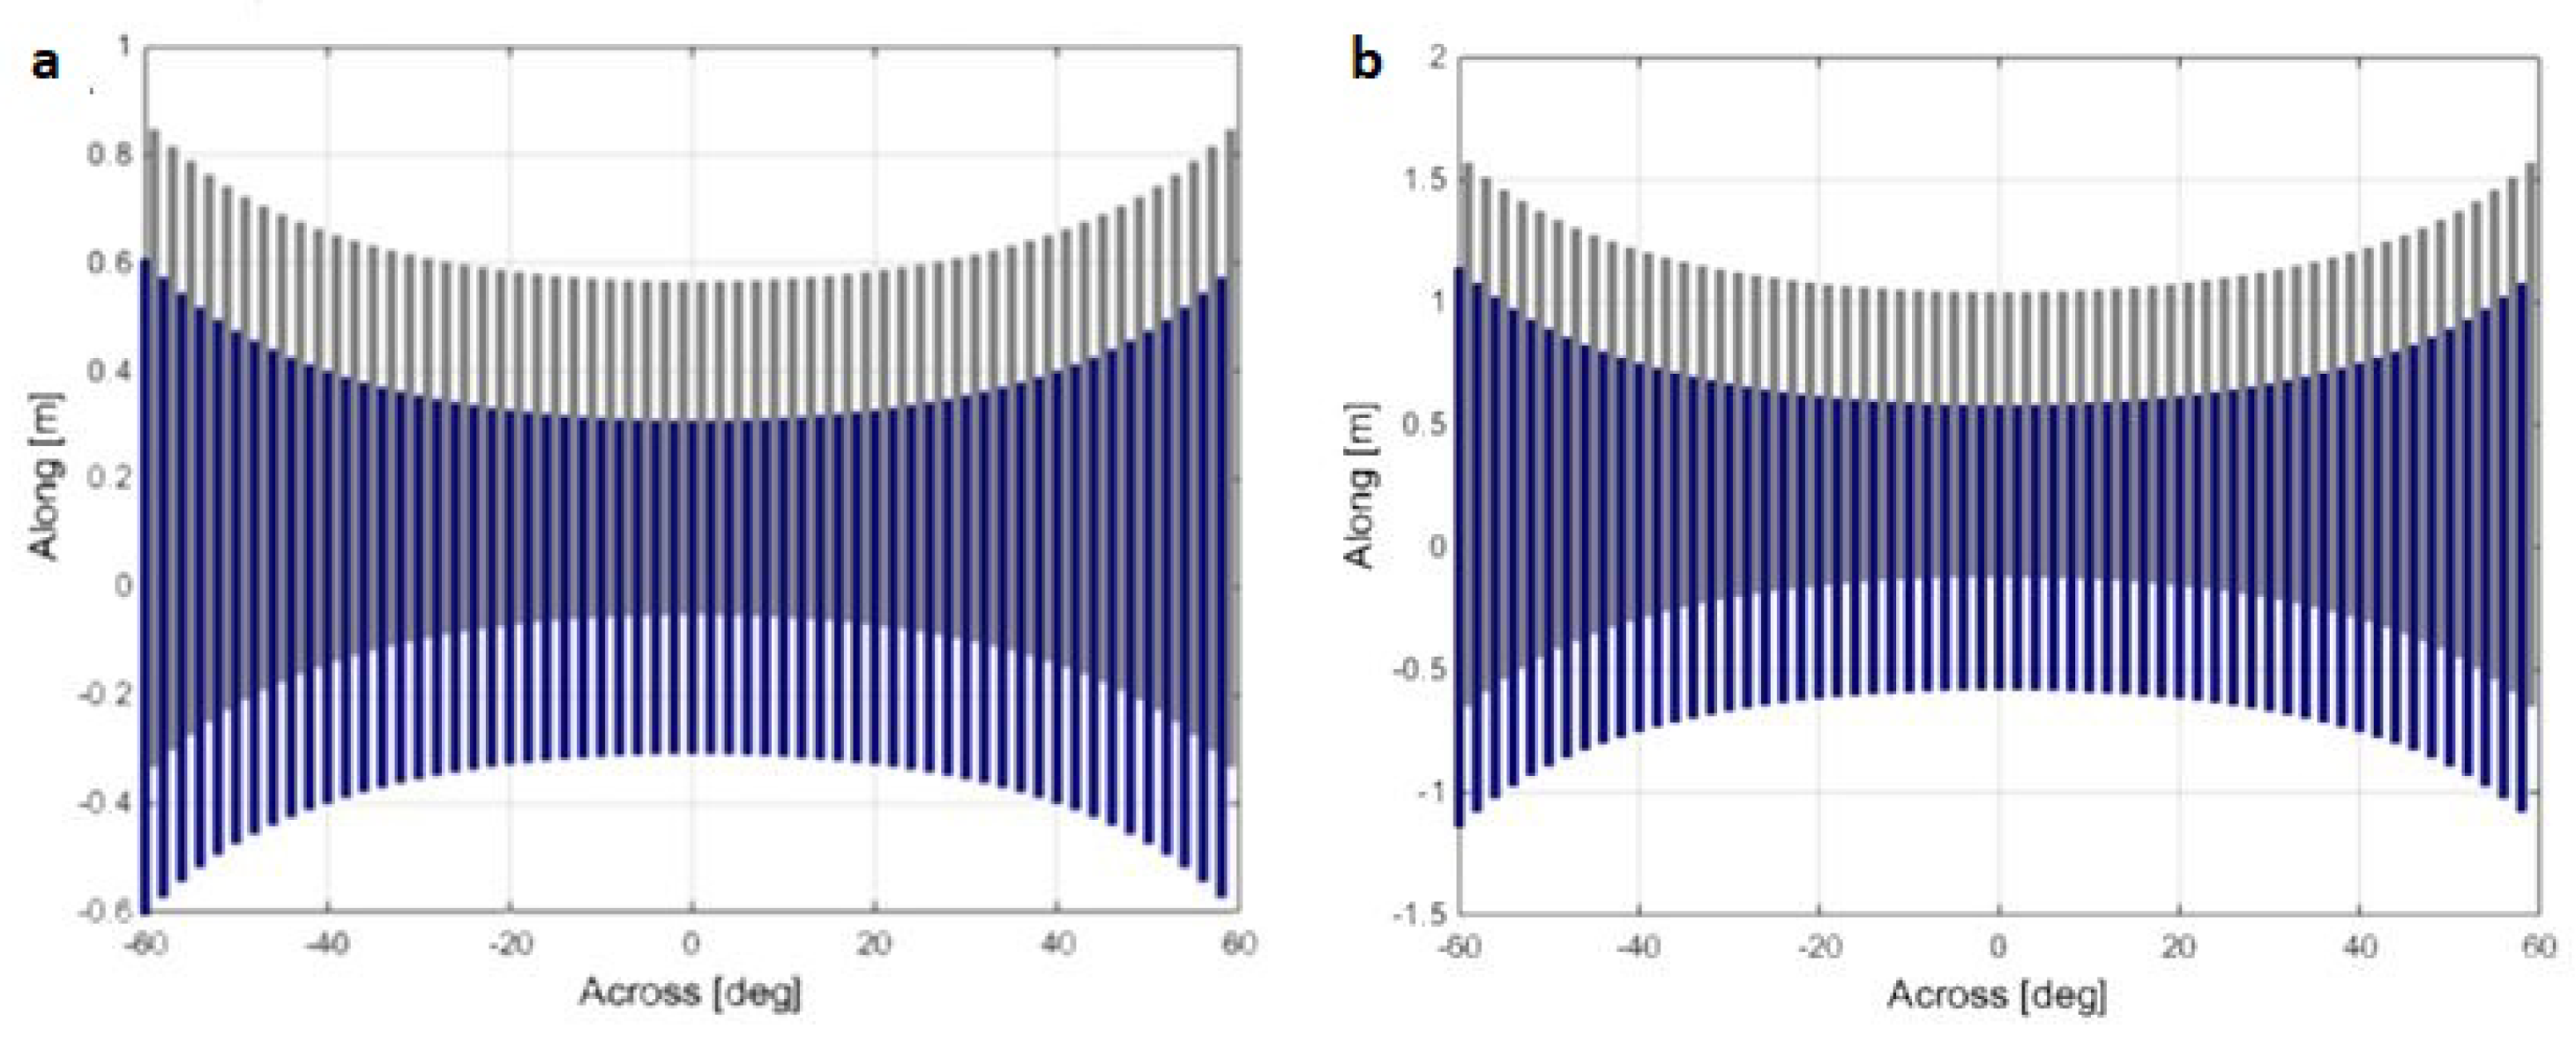
The expected footprints for 40 and 70 m altitudes are shown in Figure 23.

EM 304

The true resolution of the EM 304 is a function of Kongsberg internal beamforming and bottom detection algorithms. To properly classify the resolution of the system, Kongsberg internal calculation tools were used. Estimated beam footprints for various water depths are shown in Table 18.
The above was calculated with the following oceanic parameters: temperature of 14.5 C, salinity of 38 ppt, sound velocity of 1540 m/s (mean of the profile), noise equal to 54 dB (based on SEA-KIT noise, measured during the trials), backscatter estimate 25 dB, and vessel velocity of 1.8 m/s.
The sounding density should be taken into account for the final DTM generating. The respective sounding densities for EM 304 are shown in Table 19 for depths of 1000, 1500 and 2000 m. Note that this EM 304 generates 512 beams per swath and was running a dual swath operation with two transmission pulses actively steering per ping.
The expected footprints for 1000 and 2000 m depths are shown in Figure 24 and Figure 25.

4.3. The Assessment of AUV Performance While Cooperating with USV

The system performance was demonstrated during the Round 2 24-h data collection mission. All capabilities required by the competition, such as mapping, autonomy, collision avoidance, depth capability, endurance, and speed of survey, were achieved.
While AUVs are widely used for high-resolution seabed mapping of the deep seas, usually it implies launch and recovery from large manned vessels. Then, unmanned repetitive launch and recovery from the USV was a unique achievement in the team’s solution, particularly in comparison to the systems currently available on the market. During the Round 2 Field Test, both launch and recovery of the AUV were performed successfully. The AUV was launched outside the competition area according to the developed procedure and both vessels entered the survey box following their mission plans. The HUGIN AUV was at its operational altitude above the see floor on entering the survey area. The recovery procedure utilized both the telemetry input and the constant visual observation using CCTV. During the two years of preparation for the final survey in Greece, those maneuvers were repeated numerous times and brought to perfection, which was subsequently proved during the pipeline surveys performed in 2019 [35].
Collision avoidance is a necessary ability for any unmanned vehicle operated in the real environment. The teams were required by XPRIZE to demonstrate that the system operates safely in water and is able to avoid contact with other obstacles, using passive or active avoidance measures. The team demonstrated the capability to avoid collision, through situation awareness demonstrations and remote control piloting to and from the dock. During the sea trials, the CCTV signal was transmitted over the Satellite/Internet link to the land station, where it was constantly monitored. While the survey area was closed during the mapping process in Greece, both vehicles proved their collision avoidance capabilities in other circumstances. The AUV HUGIN is equipped with collision avoidance systems based on the acoustic sensors. In case of USV SEA-KIT, the collision avoidance is led by the shore operator, based on the full situation awareness provided by the Global Situation Awareness via Internet system (G-SAVI). This system allows CCTV, radar, thermal images, sound data, etc. to be sent through Internet/Satellite links from the SEA-KIT USV Maxlimer to the remote land station.
One of the Round 2 competition requirements was to demonstrate that the system was capable of mapping to water depths of 4000 m, with 5-m horizontal resolution. It was planned to map 4000 m using HISAS and EM 2040 mounted on the AUV. The SEA-KIT was operated in AUV following mode to provide accurate HiPAP positioning. The maximum depth reached by HUGIN AUV ‘Rental 1’ during the Round 2 Field Test was 3997.7 m. The deepest area of 4134 m was mapped during the survey.
The coverage of the overall mapping system was widely extended by the MBES mapping undertaken by the USV. The Kongsberg EM 304 multibeam echosounder, installed on SEA-KIT, was among the first of this model to be delivered, including a completely new version of the accompanying operating software, SISv5, and therefore required very close support from KM engineers and developers. Data acquisition was undertaken for the first time using the remote module of SISv5, enabling data visualization in real-time and full telemetry control over all system parameters. The density of information transmitted back from the vessel to the remote operator station was about 5–10 kB/s in reduced mode and this worked smoothly for the duration of the mission. It can, however, be configured dependent on available bandwidth. The vessel self-noise signature included a spike within the EM 304 frequency band. This had impeded the acoustic performance of the mulitbeam, requiring custom adaptations to some of the system properties. In addition, XPRIZE competition criteria required the outputs to be within a specific margin achieved by further modifications to operating modes.
To satisfy the 0.5 m vertical resolution criterion set by XPRIZE on the final data submission, the pulse mode of the EM 304 was internally modified to generate a short FM pulse, thus improving range resolution and SNR to overcome some of the vessel noise. On the receiving end, the beam number was doubled to 512 as this 4 . Rx unit was originally formed by only 256 beams. This allowed an increase in data density to satisfy the 5-m horizontal map resolution criterion set by XPRIZE. Runtime parameters included a maximal swath width that would not hinder horizontal spacing in the across-track dimension as well as vessel speed control for ping spacing in the along-track dimension.

5. Conclusions

The paper describes the process of a complex data acquisition and bathymetric products generation, by the means of the Autonomous Underwater Vehicle, operated in a partnership with the Unmanned Surface Vessel. Both vehicles were acquiring data by the hydroacoustic mapping devices. Additionally, the USV provided the AUV with positioning data and served as a communication link between AUV and the operators’ station on shore.
The survey presented here was a capstone of two years of development of a completely unmanned mapping system, capable of providing high-resolution data of the seafloor. The system can communicate with the operator located at any place in the world, with the AUV component worked autonomously according to the predefined plan.
The mapping system described here is an excellent example of the comparison between the mapping capabilities of surface and underwater vehicles. It also proves the capability of combining different AUV and USV systems in one complex survey campaign, which can also be realized with no human presence in the survey area.

Supplementary Materials

The ArcGIS online App is available here: https://gebco-nf-alumni.maps.arcgis.com/apps/webappviewer/. The App allows accessing the bathymetric surfaces and imagery data produced during the processing of data collected during the survey described here. A compilation of bathymetry data of European waters, used at the preparatory stage for the survey and utilized as the background data for the map, can be accessed from the EMODnet Project website: https://www.emodnet-bathymetry.eu/. EMODnet grid is a part of the global bathymetric compilation, the result of the GEBCO project. The newest grid, produced within the Seabed 2030 project is accessible here: https://www.gebco.net/.

Author Contributions

Conceptualization, R.W., H.S., R.F., Y.Z., N.T., and K.Z.; methodology, A.P., B.S., C.W., and Y.Z.; software, A.B., E.B., W.D., M.S., S.S., and M.E.A.-M.; validation and formal analysis, A.B., E.B., W.D., M.S., S.S., and M.E.A.-M.; resources, R.W. and W.D.; data curation, A.B., E.B., W.D., M.S., S.S., and M.E.A.-M.; writing—original draft preparation, K.Z., Y.Z., and A.B.; writing—review and editing, A.B. and R.W.; visualization, K.Z., A.B., E.B., W.D., M.S., S.S., and M.E.A.-M.; supervision, Y.Z. and K.Z.; project administration, R.W. and J.R.; funding acquisition, R.W., H.S., and R.F.; USV design, B.S.; and survey plan and operation, A.P., B.S., M.S., C.W., T.K., I.R., and K.Z. All authors have read and agreed to the published version of the manuscript

Funding

This research was funded by the Nippon Foundation and conducted under the supervision of the University of New Hamphire.

Acknowledgments

The authors, members of the GEBCO-NF Alumni Team, the winning team of the Shell Ocean Discovery XPRIZE, want to express the deep gratitude to the Nippon Foundation for the extensive support during the whole period of preparation to the unusual seabed mapping survey, presented in the paper. The participation in the competition and final mapping over the Hellenic Trench would not be possible without the support and expertise of the Center of Coastal and Ocean Mapping/Joint Hydrographic Center at the University of New Hampshire. The authors also would like to thank XPRIZE Foundation for the challenge idea and all the team’s industry partners for their participation at the various stages of the system composition, testing and seabed mapping. This includes Kongsberg Maritime, Hushcraft Ltd., Ocean Floor Geophysics, Teledyne Caris, Earth Analytics, OmniAccess, Shipowners’ Club, and ESRI. The authors would like to honor the GEBCO-NF Alumni Team member and adviser Robert Anderson, who sadly passed away in 2019. His enormous experience and the great combination of passion and common sense contributed a lot to this work.

Conflicts of Interest

The authors declare no conflict of interest. The founders had no role in the design of the study; in the collection, analyses, or interpretation of data; in the writing of the manuscript, or in the decision to publish the results.

Abbreviations

The following abbreviations are used in this manuscript:
AUVAutonomous Underwater Vehicle
USVUnmanned Surface Vessel
HISASHigh Resolution Synthetic Aperture Sonar
MBESMultibeam Echosounder
USBLUltra-short baseline
AINSAugmented Inertial Navigation System
IMUInertial Measurement Unit
CTDConductivity, Temperature, Depth
OFGOcean Floor Geophycisc
CCTVClosed Circuit Television
AGMAbsorbent Glass Mat
VRLAValve Regulated Lead Acid
CUBECombined Uncertainty and Bathymetry Estimation
WLWater Level
KFKalman Filter
GPSGlobal Positioning System
DVLDoppler Velocity Log
DTMDigital Terrain Model
HALHybrid Autonomy Layer

References

  1. Wölfl, A.C.; Snaith, H.; Amirebrahimi, S.; Devey, C.W.; Dorschel, B.; Ferrini, V.; Huvenne, V.A.I.; Jakobsson, M.; Jencks, J.; Johnston, G.; et al. Seafloor Mapping—The Challenge of a Truly Global Ocean Bathymetry. Front. Mar. Sci. 2019, 6, 283. [Google Scholar] [CrossRef]
  2. Mayer, L.; Jakobsson, M.; Allen, G.; Dorschel, B.; Falconer, R.; Ferrini, V.; Lamarche, G.; Snaith, H.; Weatherall, P. The Nippon Foundation—GEBCO Seabed 2030 Project: The Quest to See the World’s Oceans Completely Mapped by 2030. Geosciences 2018, 8, 63. [Google Scholar] [CrossRef] [Green Version]
  3. Smith, W.H.F.; Sandwell, D.T. Bathymetric prediction from dense satellite altimetry and sparse shipboard bathymetry. Pap. Geomagn. Paleomagn. Mar. Geol. Geophys. 1994. [Google Scholar] [CrossRef]
  4. Wigley, R.; Zarayskaya, Y.; Bazhenova, E.; Falconer, R.; Zwolak, K. Nippon Foundation/GEBCO ocean mapping training program at the University of New Hampshire: 13 years of success and alumni activities. In Proceedings of the OCEANS 2017, Aberdeen, UK, 19–22 June 2017. [Google Scholar] [CrossRef]
  5. Kristensen, J.; Vestgard, K. Hugin-an untethered underwater vehicle for seabed surveying. In Proceedings of the IEEE Oceanic Engineering Society, OCEANS’98, Conference Proceedings (Cat. No.98CH36259), Nice, France, 28 September–1 October 1998; Volume 1, pp. 118–123. [Google Scholar] [CrossRef]
  6. Hagen, P.E.; Storkersen, N.; Vestgard, K.; Kartvedt, P. The HUGIN 1000 autonomous underwater vehicle for military applications. In Proceedings of the Oceans 2003, Celebrating the Past...Teaming Toward the Future (IEEE Cat. No.03CH37492), San Diego, CA, USA, 22–26 September 2003; Volume 2, pp. 1141–1145. [Google Scholar]
  7. Hagen, P.E.; Storkersen, N.; Marthinsen, B.E.; Sten, G.; Vestgard, K. Military operations with HUGIN AUVs: Lessons learned and the way ahead. Eur. Ocean. 2005, 2, 810–813. [Google Scholar]
  8. Hagen, P.E.; Størkersen, N.; Marthinsen, B.E.; Sten, G.; Vestgård, K. Rapid environmental assessment with autonomous underwater vehicles—Examples from HUGIN operations. J. Mar. Syst. 2008, 69, 137–145. [Google Scholar] [CrossRef]
  9. Jalving, B.; Gade, K.; Svartveit, K.; Willumsen, A.B.; Sørhagen, R. DVL Velocity Aiding in the HUGIN 1000 Integrated Inertial Navigation System. Model. Identif. Control. 2004, 25, 223–236. [Google Scholar] [CrossRef] [Green Version]
  10. Kongsberg. Autonomous Underwater Vehicle—AUV. The HUGIN Family. Available online: https://www.kongsberg.com/globalassets/maritime/km-products/product-documents/hugin-family-of-auvs (accessed on 19 April 2020).
  11. Marthiniussen, R.; Vestgard, K.; Klepaker, R.A.; Storkersen, N. HUGIN-AUV concept and operational experiences to date. In Proceedings of the Oceans ’04 MTS/IEEE Techno-Ocean ’04 (IEEE Cat. No.04CH37600), Kobe, Japan, 9–12 November 2004; Volume 2, pp. 846–850. [Google Scholar]
  12. Proctor, A.A.; Zarayskaya, Y.; Bazhenova, E.; Sumiyoshi, M.; Wigley, R.; Roperez, J.; Zwolak, K.; Sattiabaruth, S.; Sade, H.; Tinmouth, N.; et al. Unlocking the Power of Combined Autonomous Operations with Underwater and Surface Vehicles: Success with a Deep-Water Survey AUV and USV Mothership. In Proceedings of the 2018 OCEANS—MTS/IEEE Kobe Techno-Oceans (OTO), Kobe, Japan, 28–31 May 2018. [Google Scholar] [CrossRef]
  13. Zwolak, K.; Simpson, S.; Anderson, B.; Bazhenova, E.; Falconer, R.; Kearns, T.; Minami, H.; Roperez, J.; Rosedee, A.; Sade, H.; et al. An unmanned seafloor mapping system: The concept of an AUV integrated with the newly designed USV SEA-KIT. In Proceedings of the OCEANS 2017, Aberdeen, UK, 19–22 June 2017. [Google Scholar] [CrossRef]
  14. Zarayskaya, Y.; Wallace, C.; Wigley, R.A.; Zwolak, K.; Bazhenova, E.; Bohan, A.; Elsaied, M.; Roperez, J.; Sumiyoshi, M.; Sattiabaruth, S.; et al. GEBCO-NF Alumni Team Technology Solution for Shell Ocean Discovery XPRIZE Final Round. In Proceedings of the OCEANS 2019, Marseille, France, 17–20 June 2019. [Google Scholar] [CrossRef]
  15. Ludvigsen, M.; Johnsen, G.; Lagstad, P.; Sørensen, A.; Odegard, O. Scientific Operations Combining ROV and AUV in the Trondheim Fjord. Mar. Technol. Soc. J. 2013, 48, 1–7. [Google Scholar] [CrossRef]
  16. Salavasidis, G.; Harris, C.A.; Rogers, E.; Phillips, A.B. Co-operative Use of Marine Autonomous Systems to Enhance Navigational Accuracy of Autonomous Underwater Vehicles. In Towards Autonomous Robotic Systems; Alboul, L., Damian, D., Aitken, J., Eds.; Lecture Notes in Computer Science; Springer: Berlin/Heidelberg, Germany, 2016; Volume 9716. [Google Scholar]
  17. Sarda, E.I.; Dhanak, M.R. A USV-Based Automated Launch and Recovery System for AUVs. IEEE J. Ocean. Eng. 2017, 42, 37–55. [Google Scholar] [CrossRef]
  18. Hansen, R.E. Mapping the ocean floor in extreme resolution using interferometric synthetic aperture sonar. Proc. Meet. Acoust. ICU 2019, 38, 055003. [Google Scholar] [CrossRef] [Green Version]
  19. Jacobs, T. Search for Flight MH 370 Shows Durability of AUVs. E&P Notes 2016. [Google Scholar] [CrossRef]
  20. Enzmann, R. Ocean Infinity in the Search for The Lost. Argentinian Submarine, ARA San Juan. ROVplanet 2019, 3, 39–42. [Google Scholar]
  21. Meng, L.; Gu, H.; Lin, Y.; Bai, G.; Tang, D. Study on the Mechanical Characteristics of a Towing Docking Device for USV Self-Recovering AUVs. In Proceedings of the OCEANS 2019, Marseille, France, 17–20 June 2019; pp. 1–8. [Google Scholar] [CrossRef]
  22. Gu, H.; Meng, L.; Tang, D.; Li, N.; Wang, Z.; Bai, G.; Liu, S.; Zhang, H.; Lin, Y. The Lake Trial about the Autonomous Recovery of the UUV by the USV Towed System. In Proceedings of the OCEANS 2019, Marseille, France, 17–20 June 2019; pp. 1–7. [Google Scholar] [CrossRef]
  23. Zwolak, K.; Zarayskaya, Y.; Wigley, R.; Lacerda, C.; Ketter, T.; Anderson, R.; Bazhenova, E.; Bohan, A.; Dorshow, W.; Elsaied, M.; et al. The Shell Ocean Discovery Xprize Competition Impact on the Development of Ocean Mapping Possibilities. Annu. Navig. 2018, 25, 125–136. [Google Scholar] [CrossRef] [Green Version]
  24. Calder, B.R.; Mayer, L.A. Automatic Processing of High-Rate, High-Density Multibeam Echosounder Data. Geochem. Geophys. Geosyst. 2003, 4. [Google Scholar] [CrossRef]
  25. Calder, B.R.; Wells, D.E. CUBE User’s Manual. Center for Coastal and Ocean Mapping. 1217. 2007. Available online: https://scholars.unh.edu/ccom/1217 (accessed on 19 April 2020).
  26. Gade, K. NavLab, a Generic Simulation and Post-processing Tool for Navigation. Model. Identif. Control. Nor. Soc. Autom. Control. 2005, 26, 135–150. [Google Scholar] [CrossRef]
  27. UNESCO. UNESCO: Algorithms for Computation of Fundamental Properties of Seawater; UNESCO Technical Papers in Marine Science; UNESCO: Paris, France, 1983; Volume 44, pp. 1–55. [Google Scholar]
  28. Minami, H. Estimation of Total Vertical Uncertainty for the Bathymetry Acquired by Autonomous Underwater Vehicle in Deep Water; Report of Hydrographic and Oceanographic Researches No. 50; Hydrographic Survey Division: Miyagi, Japan, 2013.
  29. Hare, R.; Godin, A.; Mayer, L.A. Accuracy Estimation of Canadian Swath (Multi-Beam) and Sweep (Multi-Transducer) Sounding Systems; Technical Report; Canadian Hydrographic Service: Ottawa, QC, Canada, 1995. [Google Scholar]
  30. Saebo, T.O. Seafloor Depth Estimation by means of Interferometric Synthetic Aperture Sonar. Ph.D. Thesis, University of Tromso, Tromso, Norway, 2010. [Google Scholar]
  31. Van Trees, H.L. Optimum Array Processing. Part IV of Detection, Estimation, and Modulation Theory; John Wiley & Sons: New York, NY, USA, 2002. [Google Scholar]
  32. Hegrenaes, O.; Saebo, T.O.; Hagen, P.E.; Jalving, B. Horizontal Mapping Accuracy in Hydrographic AUV Surveys. In Proceedings of the IEEE AUV Conference, Monterey, CA, USA, 20–23 September 2010. [Google Scholar]
  33. Hiller, T.; Reed, T.B.; Steingrimsson, A. Producing chart data from interferometric sonars on small AUVs. Int. Hydrogr. Rev. 2011. Available online: http://www.oicinc.com/res/pdf/USHydro_Abstract_Producing-Chart-Data.pdf (accessed on 19 April 2020).
  34. Lurton, X. An Introduction to Underwater Acoustics. Principles and Applications; Springer: Berlin/Heidelberg, Germany, 2002. [Google Scholar]
  35. Ocean News & Technology, Swire Seabed Completes Unmanned Subsea Pipeline Inspection for Equinor. Published: 19 August 2019. Available online: https://www.oceannews.com/news/subsea-intervention-survey/swire-seabed-completes-unmanned-subsea-pipeline-inspection-for-equinor (accessed on 2 March 2020).
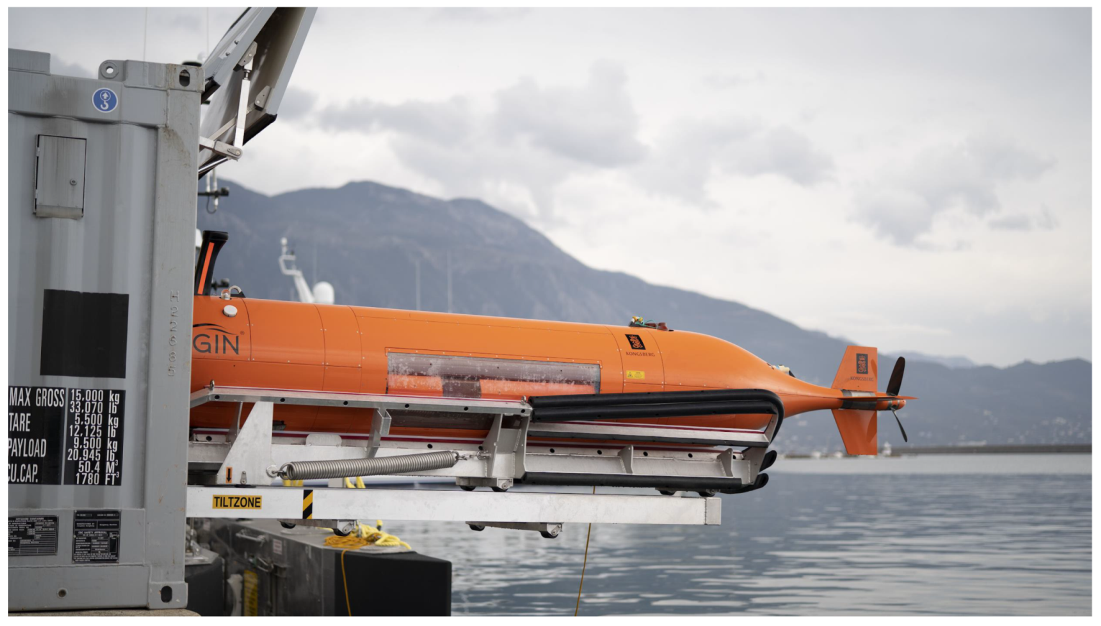
Figure 1. Autonomous Underwater Vehicle HUGIN during shore recovery: the underwater component of the mapping devices set used in Round 2 of Shell Ocean Discovery XPRIZE (Photography by XPRIZE).
Remotesensing 12 01344 g001
Figure 2. USV SEA-KIT ’Maxlimer’ during the preparation to the final survey, Kalamata, Greece: the surface part of the mapping devices set used in Round 2 of Shell Ocean Discovery XPRIZE (Photography by XPRIZE).
Remotesensing 12 01344 g002
Figure 3. The scheme of the survey process including the main stages and their crucial components.
Remotesensing 12 01344 g003
Figure 4. The boundary of the 500 km 2 competition area (red color) with the obligatory deep water 10 km 2 part marked in yellow.
Remotesensing 12 01344 g004
Figure 5. The ESRI ArcGIS Web App, an example of online GIS tools, utilized by the team for data sharing, visualization, analysis, and decision making.
Remotesensing 12 01344 g005
Figure 6. Planned survey lines for HUGIN AUV (purple solid) and SEA-KIT USV (orange dashed) including major elements of the mission.
Remotesensing 12 01344 g006
Figure 7. The scheme of simplified data processing workflow.
Remotesensing 12 01344 g007
Figure 8. The results of survey: bathymetry, combined from all sensors, presented as 5-m GRID, depicted in the form of shaded relief. EMODnet bathymetry as a background.
Remotesensing 12 01344 g008
Figure 9. The results of survey: backscatter, combined from all AUV’s sensors, 1 m resolution.
Remotesensing 12 01344 g009
Figure 10. Examples of images created by spot-processing technique in REFLECTIONS software. (a) Fault structure at the depth of 1556. 09 m (36 38.270 N, 022 05.476 E). (b) Steep rocky slope at the depth of 1742.14 m (36 38.369 N, 022 05.197 E). (c) Sediments structure at the depth of 1357.76 m (36 38.990 N, 022 05.149 E). (d) Cracks at the depth of 1544.25 m (36 38.290 N, 022 05.373 E). (e) Rocky sea floor at the depth of 1558.70 m (36 38.279 N, 022 05.345 E). (f) Rocky sea floor at the depth of 1546.18 m (36 38.265 N, 022 05.368 E). Images in (a,b) present 100 m by 100 m areas of the seafloor, while all others are generated for 50 m by 50 m subsection.
Remotesensing 12 01344 g010
Figure 11. 3D shaded relief of the part of the mapped area at the depth range of 700–2300 m.
Remotesensing 12 01344 g011
Figure 12. 3D shaded relief of the part of the mapped area at the depth range of 3700–4000 m.
Remotesensing 12 01344 g012
Figure 13. 3D shaded relief of the part of the mapped area at the depth range of 3700–4000 m.
Remotesensing 12 01344 g013
Figure 14. Basic scheme for AUV-acquired depth estimation (based on [28]).
Remotesensing 12 01344 g014
Figure 15. Uncertainties related to the EM 2040 depth measurement. The AUV altitude equals 60 m.
Remotesensing 12 01344 g015
Figure 16. Total measurement uncertainties for both sonars (red, HISAS; blue, EM 2040 MBES). The AUV altitude equals 70 m.
Remotesensing 12 01344 g016
Figure 17. Uncertainties related to the EM 304 multibeam echosounder at the depth of 1000 m, for the swath width of 2000 m.
Remotesensing 12 01344 g017
Figure 18. Uncertainties related to the EM 304 multibeam echosounder at the depth of 2500 m, for the swath width of 2000 m.
Remotesensing 12 01344 g018
Figure 19. The total combined positioning uncertainty excluding the AINS uncertainty, 2 σ , assuming an XY Vessel AUV relationship of 50 m.
Remotesensing 12 01344 g019
Figure 20. The total combined positioning uncertainty excluding the AINS uncertainty, 2 σ , assuming X < 50 m and Y = 1500 m.
Remotesensing 12 01344 g020
Figure 21. Estimated vertical resolution across swath for EM 2040 multibeam echosonder, calculated for the following parameters: single swath, continuous wave, bandwidth of 5.0 kHz, noise level of 45 dB, and water depth of 75 m.
Remotesensing 12 01344 g021
Figure 22. HISAS along track uncertainty for frequencies equal to 80 and 1000 kHz, at 1500 and 1570 m/s.
Remotesensing 12 01344 g022
Figure 23. TX footprint for two swaths (Single swath mode): (a) 40 m altitude; and (b) 75 m altitude.
Remotesensing 12 01344 g023
Figure 24. TX footprint for two swaths (Dual swath mode) at 1000 m depth.
Remotesensing 12 01344 g024
Figure 25. TX footprint for two swaths (Dual swath mode) at 2000 m depth.
Remotesensing 12 01344 g025
Table 1. Specifications of Kongsberg Maritime HUGIN AUV ‘Rental 1’, used for the high-resolution bathymetric and imagery data collection during the final survey in Kalamata, Greece.
FeatureData
DimensionsLength: 6.9 m, diameter: 750 mm, weight: 1200 kg (estimated), speed: 2–6 kn
Depth ratings4500 m
CommunicationHiPAP USBL system providing Acoustic Command
Data and Emergency Link Functionality
Radio Link—ELPRO 455U, 2–4 km range
Wireless LAN250
Iridium Satellite Link
Visual Relocation Xenon flash beacon on vehicle body and on vehicle nose
NavigationNavP Aided Inertial Navigation System (AINS)
MGC R3 Inertial Measurement Unit (IMU)
500 kHz Nortek Doppler velocity log
Digiquarz depth sensor
Forward looking Sonar (Obstacle Avoidance System)
UTP Navigational Capability
Terrain Navigation Module
PayloadHISAS 1032
EM 2040 Multibeam Echosounder
PipeTracker
Camera (CathX—10 Megapixel native resolution) and LED Strobes
CathX Laser system
Edgetcth 2205 SBP 2–16 kHz
OFG SCM Magnetometer
SAIV CTD
Environmental Package including:
Contros Co2, Contros PAH, METS, HydroFlash O2, FLNTU
Table 2. Specifications of USV SEA-KIT ‘Maxlimer’, used for the data collection, transportation, launch and recovery, communication, and positioning of the AUV during the final survey in Kalamata, Greece.
FeatureData
DimensionsLength: 11.75 m, beam: 2.2 m, transport height: 2.0 m, operational height: 8.5 m, weight: 12,000 kg (estimated)
CommunicationFully redundant communication system: WiFi, Radio
Satellite (Iridium and Inmarsat)
Kongsberg Maritime Broadband Radio (<45 km offshore)
CCTV: 2 interior and 6 fore and aft cameras, 360 degree FLIR camera
Propulsion2 × 10 kW/1200 rpm electric directional thrust motors
Power supplyGenerator 2 × 18 kW 48V DC, fuel 2000 l
56 Gel and Absorbent Glass Mat (AGM) types
of valve-regulated lead-acid battery (VRLA) Marine Batteries
12 V–214 Ah capacity
4 dry cell Absorbed Glass Matt (AGM) VRLA 12 V 100Ah
Marine Dual Purpose Batteries for the engine and propulsion
PayloadEM 304 Multibeam Echosounder - pre-release version
HiPAP 502 High Precision Acoustic Positioning System
Kongsberg Seatex MGC-R3-SB50 motion sensor and gyro compass
sound velocity probe
Table 3. The coordinates of the points delimiting the boundaries of the main survey area (500 km 2 ) to be mapped by the teams participating in the Final Round of Shell Ocean Discovery XPRIZE (WGS84 Spheroid, WGS84 Datum, UTM Projection coordinates refer to Zone 34 North).
Easting [m]Northing [m]Latitude [N]Longitude [ E]
1540,222.14,056,141.236.65 21.45
2553,120.44,048,232.936.58 21.59
3599,597.54,048,815.436.58 22.11
4599,355.04,068,167.336.75 22.11
5595,352.64,068,119.836.75 22.07
6595,508.64,055,864.736.64 22.07
7560,327.14,055,423.736.64 21.68
8544,645.04,065,037.636.73 21.50
Table 4. The coordinates of the points delimiting the boundaries of the obligatory survey box (10 km 2 ) to be mapped by the teams participating in the Final Round of Shell Ocean Discovery XPRIZE (WGS84 Spheroid, WGS84 Datum, UTM Projection coordinates refer to Zone 34 North).
Easting [m]Northing [m]Latitude [N]Longitude [E]
1549,583.24,053,524.336.625968 21.554558
2552,745.54,053,524.236.625798 21.589924
3552,745.54,050,362.036.597292 21.589707
4549,582.94,050,361.936.597461 21.554350
Table 5. Main parameters affecting the survey performance and mission planning.
Mapping EquipmentSurvey Speed [kn]Height above the
Seafloor [m]
Max. Swath
(Approximate) [m]
HUGIN—HISAS wide area mode3.5701000
HUGIN—HISAS standard mode3.540350
SEA-KIT—EM 3043.5–4.2surface vessel2000
multibeam echosounder
Table 6. Actual data volumes from the 24 h of data collection during Round 2 Field Test in Kalamata, Greece.
Data TypeData Volume
Navigation and vehicle health from the CP40 GB
Payload data from the PP/NAS (Bathy data)22 GB
SEA-KIT navigation data1 MB
EM 304 data from SEA-KIT6.5 GB bathy plus 150 GB of water column data
NAS bottle (HUGIN collected data)958 GB
Table 7. Data types collected and processed during the 24 h survey with basic parameters.
SonarFile TypeData TypeResolution [m]Survey Time [h]Survey Speed [kn]Full Swath
Width [km]
Coverage [km 2 ]
EM 304*.kmallBathymetry
and backscatter
depth
dependent
12.63.52 *163.3 ***
EM 2040*.allBathymetry
and backscatter
<1243.50.28 **43.6
HISAS
Standard
mode
*.all
*.xtf
Bathymetry
SAS Imagery
1
0.04
23.50.354.5
HISAS
Wide-area
mode
*.all
*.xtf
Bathymetry
SAS Imagery
5
1
223.51142.6
Total (taking into account the overlaps and some data lost on turns):278.9
* Working in constant swath-width mode; ** covering nadir gap of HISAS data; *** combined with EM 2040 data in the nadir zone.
Table 8. Values of parameters necessary for uncertainty assessment.
ParameterValue2 σ Uncertainty
Sound speed1500 m/s1.2 m/s
Surface sound speed1500 m/s0.6 m/s
AUV pitch0 0.02 (for measurement),
0.1 (for misalignment)
AUV roll0 0.02 (for measurement),
0.1 (for misalignment)
Table 9. Values of parameters necessary for uncertainty assessment.
ParameterValue2 σ Uncertainty
Beamwidth2 × 4 -
Sound speed1500 m/s6.0 m/s
Surface sound speed1500 m/s0.04 m/s
Vessel pitch0 0.02 (for measurement),
0.1 (for misalignment)
Vessel roll0 0.02 (for measurement),
0.1 (for misalignment)
Range sampling resolution0.46 m-
Pulse length5 ms-
Heave measurement uncertainty0.05 m-
Table 10. Expected AUV positioning accuracies of HiPAP measurement (1 σ ).
AUV depth [m]50100500100030004000
AUV positioning uncertainty [m]0.200.250.521.043.144.188
Table 11. Estimated position uncertainties due to surface ship attitude (1 σ ).
AUV depth [m]5010050010003000
AUV positioning uncertainty [m]0.120.130.170.280.75
Table 12. Estimated position uncertainties due to surface ship attitude.
Source of ErrorValue
GPS 2D error (DRMS)0.1 m
USBL measurement error (1 σ )d R = 0.03 m; d e = 0.06 ; d a = 0.06
Ship attitude error (1 σ )d M r = 0.01 (roll); d M p = 0.01 (pitch); d M h = 0.08 (heading)
USBL calibration/alignment error (1 σ )d A r = 0.0 (roll); d A p = 0.01 (pitch); d A h = 0.02 (yaw)
Error due to fixed SVP error (1 σ )d S V P = 0.8 m/s
Note: assuming constant 1500 m/s true SVP.
Table 13. Estimated position uncertainties related to AINS.
AUV depth [m]50100500100030004000
AUV positioning uncertainty [m]0.200.210.430.691.45Est < 2
Table 14. Approximate vertical resolution for middle-swath beam angles.
Data TypeApproximate Vertical Resolution
for Middle-Swath Beam Angles [m]
HISAS Wide area mode 0.30
HISAS Standard mode (SAS bathymetry) 0.23
EM 2040 bathymetry 0.1
Table 15. Across track resolutions for chosen ground ranges.
Ground range [m]60150240310390
Across track resolution [m]3.52553.44653.29853.25943.2376
Table 16. Along and Across track resolutions for EM 2040 at 40 and 75 m altitudes, respectively.
Altitude [m]404040757575
Beam Pointing Angle [ ]0306003060
Alongtrack Footprint0.30.350.60.560.651.12
Acrosstrack Footprint0.690.690.691.31.31.3
Table 17. Sounding distance along and across track for EM 2040 at 1.8 m/s forward velocity of the vessel.
Altitude40 m75 m
Along track Spacing in m0.250.46
Across track Spacing in m0.350.65
Sounding Density 5 m cell280.683.5
Table 18. Along and across track resolutions for EM 304 2x4, 1000/1500/2000 m, and swath limited to 2 km.
Altitude [m]100010001000150015001500200020002000
Beam Pointing Angle [ ]030600306003060
Alongtrack Footprint [m]34.8540.2449.2952.3160.463.8669.7780.5776.98
Acrosstrack Footprint [m]9.249.249.249.719.719.718.68.68.6
Table 19. Along and across track resolutions for EM 304 2 × 4, 1000, 1500, 2000 m, and swath limited to 2 km.
Altitude1000 m1500 m2000 m
Along track Spacing [m]2.193.263.76
Across track Spacing [m]4.624.864.31
Sounding Density 5 m cell2.51.61.5