Article

Investigation of Aerosol Peak Height Effect on PBL and Volcanic Air Mass Factors for SO2 Column Retrieval from Space-Borne Hyperspectral UV Sensors

1
Division of Earth Environmental System Science, Major of Spatial Information Engineering, Pukyong National University, Busan 608-737, Korea
2
UV-Visible DOAS Research Group, Royal Belgian Institute for Space Aeronomy, Ringlaan 3, B-1180 Brussels, Belgium
3
Department of Atmospheric Sciences, Yonsei University, Seoul 03722, Korea
*
Author to whom correspondence should be addressed.
Remote Sens. 2020, 12(9), 1459; https://doi.org/10.3390/rs12091459
Submission received: 17 March 2020 / Revised: 30 April 2020 / Accepted: 2 May 2020 / Published: 4 May 2020
(This article belongs to the Section Atmospheric Remote Sensing)

Abstract

:
We investigate the effects of aerosol peak height (APH) and various parameters on the air mass factor (AMF) for SO2 retrieval. Increasing aerosol optical depth (AOD) leads to multiple scattering within the planetary boundary layer (PBL) and an increase in PBL SO2 AMF. However, under high AOD conditions, aerosol shielding effects dominate, which causes the PBL SO2 AMF to decrease with increasing AOD. The height of the SO2 layer and the APH are found to significantly influence the PBL SO2 AMF under high AOD conditions. When the SO2 and aerosol layers are of the same height, aerosol multiple scattering occurs dominantly within the PBL, which leads to an increase in the PBL SO2 AMF. When the APH is greater than the SO2 layer height, aerosol shielding effects dominate, which decreases the PBL SO2 AMF. When the SO2 and aerosol layers are of the same height under low AOD and solar zenith angle (SZA) conditions, increased surface reflectance is found to significantly increase the PBL SO2 AMF. However, high AOD dominates the surface reflectance contribution to PBL SO2 AMF. Under high SZA conditions, Rayleigh scattering contributes to a reduction in the light path length and PBL SO2 AMF. For volcanic SO2 AMF, high SZA enhances the light path length within the volcanic SO2 layer, as well as the volcanic SO2 AMF, because of the negligible photon loss by Rayleigh scattering at high altitudes. High aerosol loading and an APH that is greater than the SO2 peak height lead to aerosol shielding effects, which reduce the volcanic SO2 AMF. The SO2 AMF errors are also quantified as a function of uncertainty in the input data of AOD, APH, and surface reflectance. The SO2 AMF sensitivities and error analysis provided here can be used to develop effective error reduction strategies for satellite-based SO2 retrievals.

Graphical Abstract

1. Introduction

Through the formation of gas-phase sulfuric acid and sulfate aerosol, sulfur dioxide (SO2) plays an important role in atmospheric chemistry on a global scale and affects short-term pollution as well as climate forcing [1,2]. Natural emissions of volcanic and biogenic dimethyl sulfide account for only ~30% of total global SO2 emissions, whereas >70% is derived from anthropogenic sources including fossil fuel combustion and metal smelting [3,4]. The SO2 emitted from anthropogenic sources is likely to be present in the planetary boundary layer (PBL), particularly near the surface. To date, SO2 in the PBL has been regionally or globally monitored by multiple hyperspectral ultraviolet (UV) satellite sensors including the Global Ozone Monitoring Experiment (GOME) [5,6], the Scanning Imaging Absorption Spectrometer for Atmospheric Cartography (SCIAMACHY) [7,8], GOME-2 [9,10,11], the Ozone Monitoring Instrument (OMI) [12,13], the Ozone Mapping and Profiler Suite (OMPS) [14,15], and the TROPOspheric Monitoring Instrument (TROPOMI) [16]. The differential optical absorption spectroscopy (DOAS) spectral fitting method has been widely used to retrieve SO2 column amounts from radiance data measured by these hyperspectral satellite sensors [2,5,6,7,9,10,11,17,18,19,20,21,22,23].
Spectral fitting methods such as the DOAS or Principal Component Analysis (PCA) techniques are first used to retrieve the SO2 slant column density (SCD), which is the integral part of the SO2 concentration that is present over the path between a light source and the sensor [24]. SO2 vertical column density (VCD) is obtained by dividing the SO2 SCD into the SO2 air mass factor (AMF). When the SO2 AMF is simulated using a radiative transfer model (RTM), multiple input parameters are required to calculate the SO2 AMF. Uncertainties in the input data used for these parameters can lead to errors in the AMF calculations. Several studies have investigated the dependence of volcanic SO2 AMF on the parameters used in its calculation. Thomas et al. [23] reported the dependence of volcanic SO2 AMF on aerosol optical depth (AOD), aerosol type, and SO2 plume height. The effects of solar zenith angle (SZA), SO2 profile, and albedo on the volcanic SO2 AMF were studied by Khokhar et al. [6]. Richter et al. [10] investigated the dependence of SO2 AMF on wavelength, SZA, O3 VCD, SO2 VCD, and surface reflectivity for a layer with elevated volcanic SO2. Theys et al. [25] reported the SO2 vertical distribution effect on volcanic and PBL SO2 AMF. Finally, Lee et al. [26] carried out a PBL SO2 AMF error analysis for surface reflectance, aerosol properties, cloud fraction, and SO2 vertical distribution.
These previous studies have contributed to a general quantitative understanding of the effects of various parameters on SO2 AMF. However, although aerosol scattering and absorption have important effects on AMF, especially over the short UV wavelength interval of 300–325 nm where PBL SO2 AMF is usually calculated, the cumulative effects of aerosol vertical location and AOD along with other parameters (e.g., surface reflectance and the ozone column density) on SO2 AMF have not been studied. In addition, few studies have investigated the influence of the parameters on PBL SO2 AMF and the effects of their associated uncertainties on PBL SO2 retrieval error, despite the fact that accurate PBL SO2 retrievals are required over regions where coal-related industrial activities are prevalent. Quantitative information for each parameter’s contribution to SO2 AMF uncertainty will be useful for reducing errors in SO2 retrievals. The aim of this study is to investigate the simultaneous effects of aerosol peak height (APH), AOD, geometric information, SO2 vertical profile (PBL vs. volcanic), ozone amount, ozone vertical profile, and surface reflectance on both PBL and volcanic SO2 AMF. This study also quantifies SO2 AMF errors caused by input data uncertainty for APH and other parameters.

2. Methods

The AMF is applied to convert SCD into vertical column density (VCD; AMF = SCD/VCD). The AMF can be calculated using the formulation of Palmer et al. [27], and can be expressed in terms of the scattering weight and shape factor, as follows:
AMF = A M F G 0 ω ( z ) S z ( z ) d z
where AMFG is the geometric AMF, ω ( z ) is the scattering weight, and S z ( z ) is the shape factor for each layer. The scattering weight is the sensitivity of the backscattered spectrum to the abundance of the absorber at each layer, and the shape factor is a normalized vertical profile of number density [27]. The scattering weight is affected by trace gas absorption optical depth, scattering due to air molecules (Rayleigh), and the aerosol extinction optical depth (Mie scattering) [28]. The SO2 AMF depends on the SO2 vertical profile, surface albedo, observational geometry (solar zenith, viewing zenith, and relative azimuth angles), total ozone column, aerosols, and clouds [6,10,23,25,26]. Here, the SO2 AMF was calculated using the linearized pseudo-spherical scalar and vector discrete ordinate radiative transfer model (VLIDORT, version 2.6). A detailed description of AMF computation using VLIDORT can be found in Spurr and Christi [28]. The PBL SO2 AMF was computed for 318 nm, which is representative of the wavelength interval of 310–326 nm and includes the strong SO2 absorption band that peaks between about 310 and 313 nm, and which was used for the spectral fitting. Although SO2 retrievals in this fitting window are suitable for small anthropogenic SO2 column amounts, the retrieval accuracy for large volcanic SO2 amounts is limited by saturation of the SO2 SCD retrievals caused by strong SO2 absorption [2,10,22,29]. Therefore, to calculate the volcanic SO2 AMF, we used a wavelength of 375 nm for use with the fitting window of 360–390 nm employed to retrieve SO2 columns caused by volcanic eruption [2,18,22].
Figure 1 summarizes the SO2 AMF calculation. Scattering weight was computed using the AOD, single scattering albedo (SSA), APH, half width (HW) of aerosol vertical distribution, surface reflectance, viewing zenith angle (VZA), and SZA. We calculated the shape factor using the SO2 vertical profile and its absorption cross-section at 298 K [30].

2.1. Vertical Distributions of SO2 and O3

The O3 vertical profiles used for the SO2 AMF calculations are shown in Figure 2. The nine O3 vertical distributions obtained from the TOMS-V8 O3 profile climatology, which vary with latitude and O3 column, are used to verify the effect of the O3 vertical profile and vertical column densities (VCD) on the SO2 scattering weights. A detailed description of the TOMS O3 climatology can be found in Bhartia and Wellemeyer [31], McPeters et al. [32], and Wellemeyer et al. [33]. As the general SO2 vertical profile is unknown [2,22], a hypothetical SO2 profile is used to determine the SO2 shape factor for anthropogenic pollution (Figure 3a). For anthropogenic SO2, SO2 box concentration profiles of 1 km thickness are arranged from the surface to a height of 1 km in the PBL. For the volcanic SO2 case, we chose Iceland’s Eyjafjallajökull (63.63°N, 19.62°W; 1666-m altitude) eruption on 14 April 2010. This eruption ejected a SO2 plume 8–13 km high into the atmosphere [11,34]. Therefore, for the volcanic SO2 case, it was assumed that a total SO2 column of 200 DU was distributed throughout a 1 km box profile from 9 to 10 km in the lower stratosphere (Figure 3b).

2.2. Aerosols

AOD, aerosol upper limit, aerosol lower limit, and APH are used to determine the aerosol vertical profiles. To quantify the effects of aerosols on SO2 AMF, we used the AOD, APH, aerosol upper limit, and aerosol lower limit as inputs for the AMF calculations. Applying the Gaussian distribution function (GDF) described by Hong et al. [35] and Jeong et al. [36], the aerosol profile can be defined as follows:
GDF = z n 1 z n 2 W e h ( z z p ) [ 1 + e h ( z z p ) ] 2 d z
η = ln ( 3 + 8 ) h
where z n 1 and z n 2 are the aerosol lower and upper limits, respectively; W is a normalization constant related to total aerosol loading; h is related to the half width (HW) of aerosol vertical distribution η ; and z p is the APH [28,35,36]. For the PBL SO2 AMF calculation, the AOD ranges from 0.0 to 2.0 based on values obtained from the Level-3 OMI Aerosol product (L3 OMAEROe) over East Asia from 2005 to 2010. Though most aerosol particles are present near the surface, previous studies have shown that APH values of up to 2 km can exist for Asian dust cases [37,38,39,40]. APH values of 0.0, 1.0, and 2.0 km are used to investigate the effects of aerosols on the PBL SO2 AMF according to the aerosol peak height relative to the SO2 layer height. Values for each variable are provided in Table 1. A single scattering albedo value of 0.93 was derived from the mean value obtained from the Level-3 OMI Aerosol product (L3 OMAEROe) over East Asia for 2005–2010. The half width is fixed at 3 km, and the lower and upper limits for the aerosol layer are set to surface level and 10 km, respectively. Figure 3a shows examples of aerosol extinction profiles for various APH with AOD of 0.3. As shown in Figure 3a, for Case 1 (APH = 0 km) the aerosol layer almost overlaps with that of the SO2 layer, but it is higher than the SO2 layer in Cases 2, 3, and 4 (APH = 1, 2, and 3 km, respectively). For volcanic SO2, the AOD ranges from 0.5 to 5.0 (see Table 1) and the APH is set to 0, 4, and 8 km, which are either lower than or similar to the volcanic SO2 layer (9–10 km; Figure 3b).
Sulfate aerosols were assumed for industrial regions with high anthropogenic SO2 emissions, and volcanic ash was used for the volcanic SO2 case. Model input values for each aerosol type, such as refractive index, fine-mode fraction, fine- and coarse-mode radii and variance, can be found in Torres et al. [41].

2.3. Observational Geometry and Surface Reflectance

Five SZA and VZA values (0.1°, 20°, 40°, 60°, and 70°) and five relative azimuth angle (RAA) values (0°, 45°, 90°, 135°, and 180°) were used for the SO2 AMF calculations. According to several previous studies, SO2 AMF is strongly dependent on the surface reflectance [10,23,26]. Thus, surface reflectance was set to range from 0.0 to 0.15, which includes values typical of grassland, ocean, and deciduous forest in the UV–VIS range.

3. Results

3.1. Effects of Geometry and Aerosol Optical Depth on PBL SO2

Figure 4 shows SO2 AMF variations as a function of satellite measurement geometry (e.g., RAA, SZA, and VZA) and AOD. The SO2 AMF is greatly affected by SZA and VZA, whereas RAA shows negligible contributions to the SO2 AMF variation because the geometric AMF, which consists of the SZA and VZA, is enhanced as a result of the increased light path length through the Earth’s atmosphere between the Sun and the space-borne sensor. The SO2 AMF tends to decrease with increasing SZA (Figure 4a). When SZA is 20° and 60°, the SO2 AMF at RAA of 90° is 0.23 and 0.11, respectively (Figure 4a), which suggests a shortened SO2 absorption light path length in the PBL. This shorter length within the PBL results in fewer photons reaching the PBL for higher SZA conditions. The decrease in SO2 AMF with increasing SZA is the inverse of the correlation between NO2 AMF and SZA reported by Hong et al. [35]. The NO2 AMF tends to increase with increasing SZA [35]. This difference between the trends of SO2 and NO2 AMFs with SZA can be attributed to the absorption wavelength of SO2 that is generally used for spectral fitting, which is much shorter and more affected by ozone absorption and Rayleigh scattering than is that of NO2.
Figure 4b shows the effects of AOD and measurement geometry (SZA and RAA) on SO2 AMF. The difference between SO2 AMFs at SZA 20° and 60° is found to increase with increasing AOD, which indicates a large influence of AOD on the PBL SO2 AMF. The SO2 AMFs at SZA 20° and 60° are 0.33 (0.63) and 0.27 (0.53), respectively, for an AOD of 0.0 (0.6) and a RAA of 90° (Figure 4b). However, at SZA 20° and 60°, the SO2 AMFs are 0.70 (0.72) and 0.55 (0.50), respectively, for an AOD of 0.9 (2.0) and a RAA of 90°. The SO2 AMFs for both SZA conditions (20° and 60°) are much larger at high AOD than at low AOD. These enhanced SO2 AMF values at high AOD may be due to the increased SO2 absorption light path length caused by the multiple scattering effect within the PBL when SO2 molecules and aerosols are present in the same layer (Figure 4b). However, multiple scattering caused by high aerosol loading does not necessarily lead to the increase in SO2 AMF for certain aerosol peak heights, as discussed later in this section. In comparison with the large AOD effects under high and low SZA conditions on SO2 AMFs, the variation of the SO2 AMF with changes in RAA is found to be small under both high and low AOD conditions (Figure 4b). Thus, the AOD effect on the SO2 AMF changes more with SZA than with RAA.
As shown in Figure 5a, both large SZA and large VZA lead to a significant decrease in SO2 AMFs, and both small SZA and small VZA increase the SO2 AMFs. This suggests that both high SZA and high VZA decrease the absorption light path length in the PBL. A small number of photons can reach the PBL at large SZA, and few of them from the PBL with the presence of SO2 reach the satellite sensor at large VZA because of the increased photon loss at short SO2 absorption wavelengths caused by Rayleigh scattering and stratospheric ozone absorption. Competition between the effects of ozone amount and measurement geometry on the PBL SO2 AMF was also investigated, and is discussed later in this section. High AOD (1.2) leads to higher SO2 AMF compared with low AOD (0.3) for most SZA and VZA conditions, except for very high VZA and SZA (>60°). The larger SO2 AMFs for high AOD (1.2) than for small AOD (0.3) suggest that high aerosol loadings cause multiple scattering, which leads to a longer light path length in the PBL where both aerosols and SO2 are present. However, under very large VZA and SZA (>60°), SO2 AMFs for high AOD (1.2) are found to be slightly smaller than for low AOD (0.3). This inverse relationship of SO2 AMF under high and low AOD conditions at high SZA and VZA is next discussed in detail using the results shown in Figure 5b.
The SZA and AOD effects on the SO2 AMF were investigated in detail, as the RAA effect on the PBL SO2 AMF is found to be small. SO2 AMFs at large SZA tend to be smaller than those at small SZA (Figure 4a,b and Figure 5a). However, at large SZA (40°–70°), the SO2 AMF tends to increase only to certain AOD values before it begins to decrease as AOD increases. For example, the SO2 AMF at a SZA of 60° increases as a function of AOD over the AOD range 0.0–0.9 and tends to decrease with increasing AOD over the AOD range 0.9–2.0. Under low aerosol loading, the increased light path length that results from multiple scattering in the PBL is dominant. However, when AOD becomes high, the aerosol layer provides more of a shielding effect, which reduces the enhancement of light path length in the PBL. Even though shielding effects reduce the enhancement of the light path length under high AOD conditions, aerosols still play an enhancing role in SO2 AMF calculations, compared with the case of no aerosols (AOD = 0). The differences between SO2 AMFs for SZA < 40° are small compared with those for SZA > 40°, as there is little difference in geometric AMFs in low SZA conditions (SZA < 40°). These small differences in geometric AMFs lead to little change in light path lengths in the PBL, which can be partly attributed to the similar geometrical AMFs between SZA = 0.1° and 40°. In particular, when no aerosols are present, SO2 AMFs for low SZA (SZA < 40°) are almost similar. However, in the presence of aerosols (AOD > 0), SO2 AMFs for SZA = 0.1° tend to be smaller than those for SZA = 20° and 40° for all but the highest AOD conditions (AOD > 1.5). The higher SO2 AMFs for SZA = 0.1° than for SZA = 20° or 40° in the presence of aerosols may be sensitive to aerosol composition.

3.2. Effects of Ozone Column and Aerosol Optical Depth on PBL SO2

Figure 6 compares the ozone and SZA effects on the SO2 AMF as a function of AOD. As discussed for the results shown in Figure 5b (Section 3.1), SO2 AMFs for small SZA tend to be higher than those for large SZA because they are less affected by Rayleigh scattering in the troposphere and ozone absorption in the stratosphere. In terms of O3 effects, SO2 AMFs are found to decrease with increasing of the total O3 amount. However, this decrease is small. For an AOD of 1.5 (0) and a SZA of 20°, the SO2 AMFs are 0.76 (0.35), 0.75 (0.34), and 0.73 (0.33) for total ozone = 275, 375, and 475 DU, respectively. For SZA = 60°, the SO2 AMFs are 0.57 (0.28), 0.54 (0.27), and 0.51 (0.26) for total ozone = 275, 375, and 475 DU, respectively, for an AOD of 1.5 (0). The SO2 AMFs are found to be more affected by SZA than by the O3 amount, particularly over the AOD range 0.5–2.0 (Figure 6). For AOD = 0.9 (2) and total O3 = 375 DU, the SO2 AMFs for SZA = 20° and 60° are 0.72 (0.73) and 0.56 (0.50), respectively. This larger SZA effect on the SO2 AMF compared with the O3 effect shows greater photon loss from Rayleigh scattering than from stratospheric O3 absorption. The short SO2 absorption wavelength coupled with high SZA leads to enhanced Rayleigh scattering and stratospheric O3 absorption before photons reach the PBL where SO2 molecules are present. More photons reach the PBL under low SZA conditions than under high SZA conditions, where they undergo multiple scattering within the PBL, causing the SO2 absorption light path length to increase significantly compared with high SZA conditions. Although ozone effects on the SO2 AMF are smaller than those of SZA and AOD, the effect of the aerosol vertical profile is examined next.

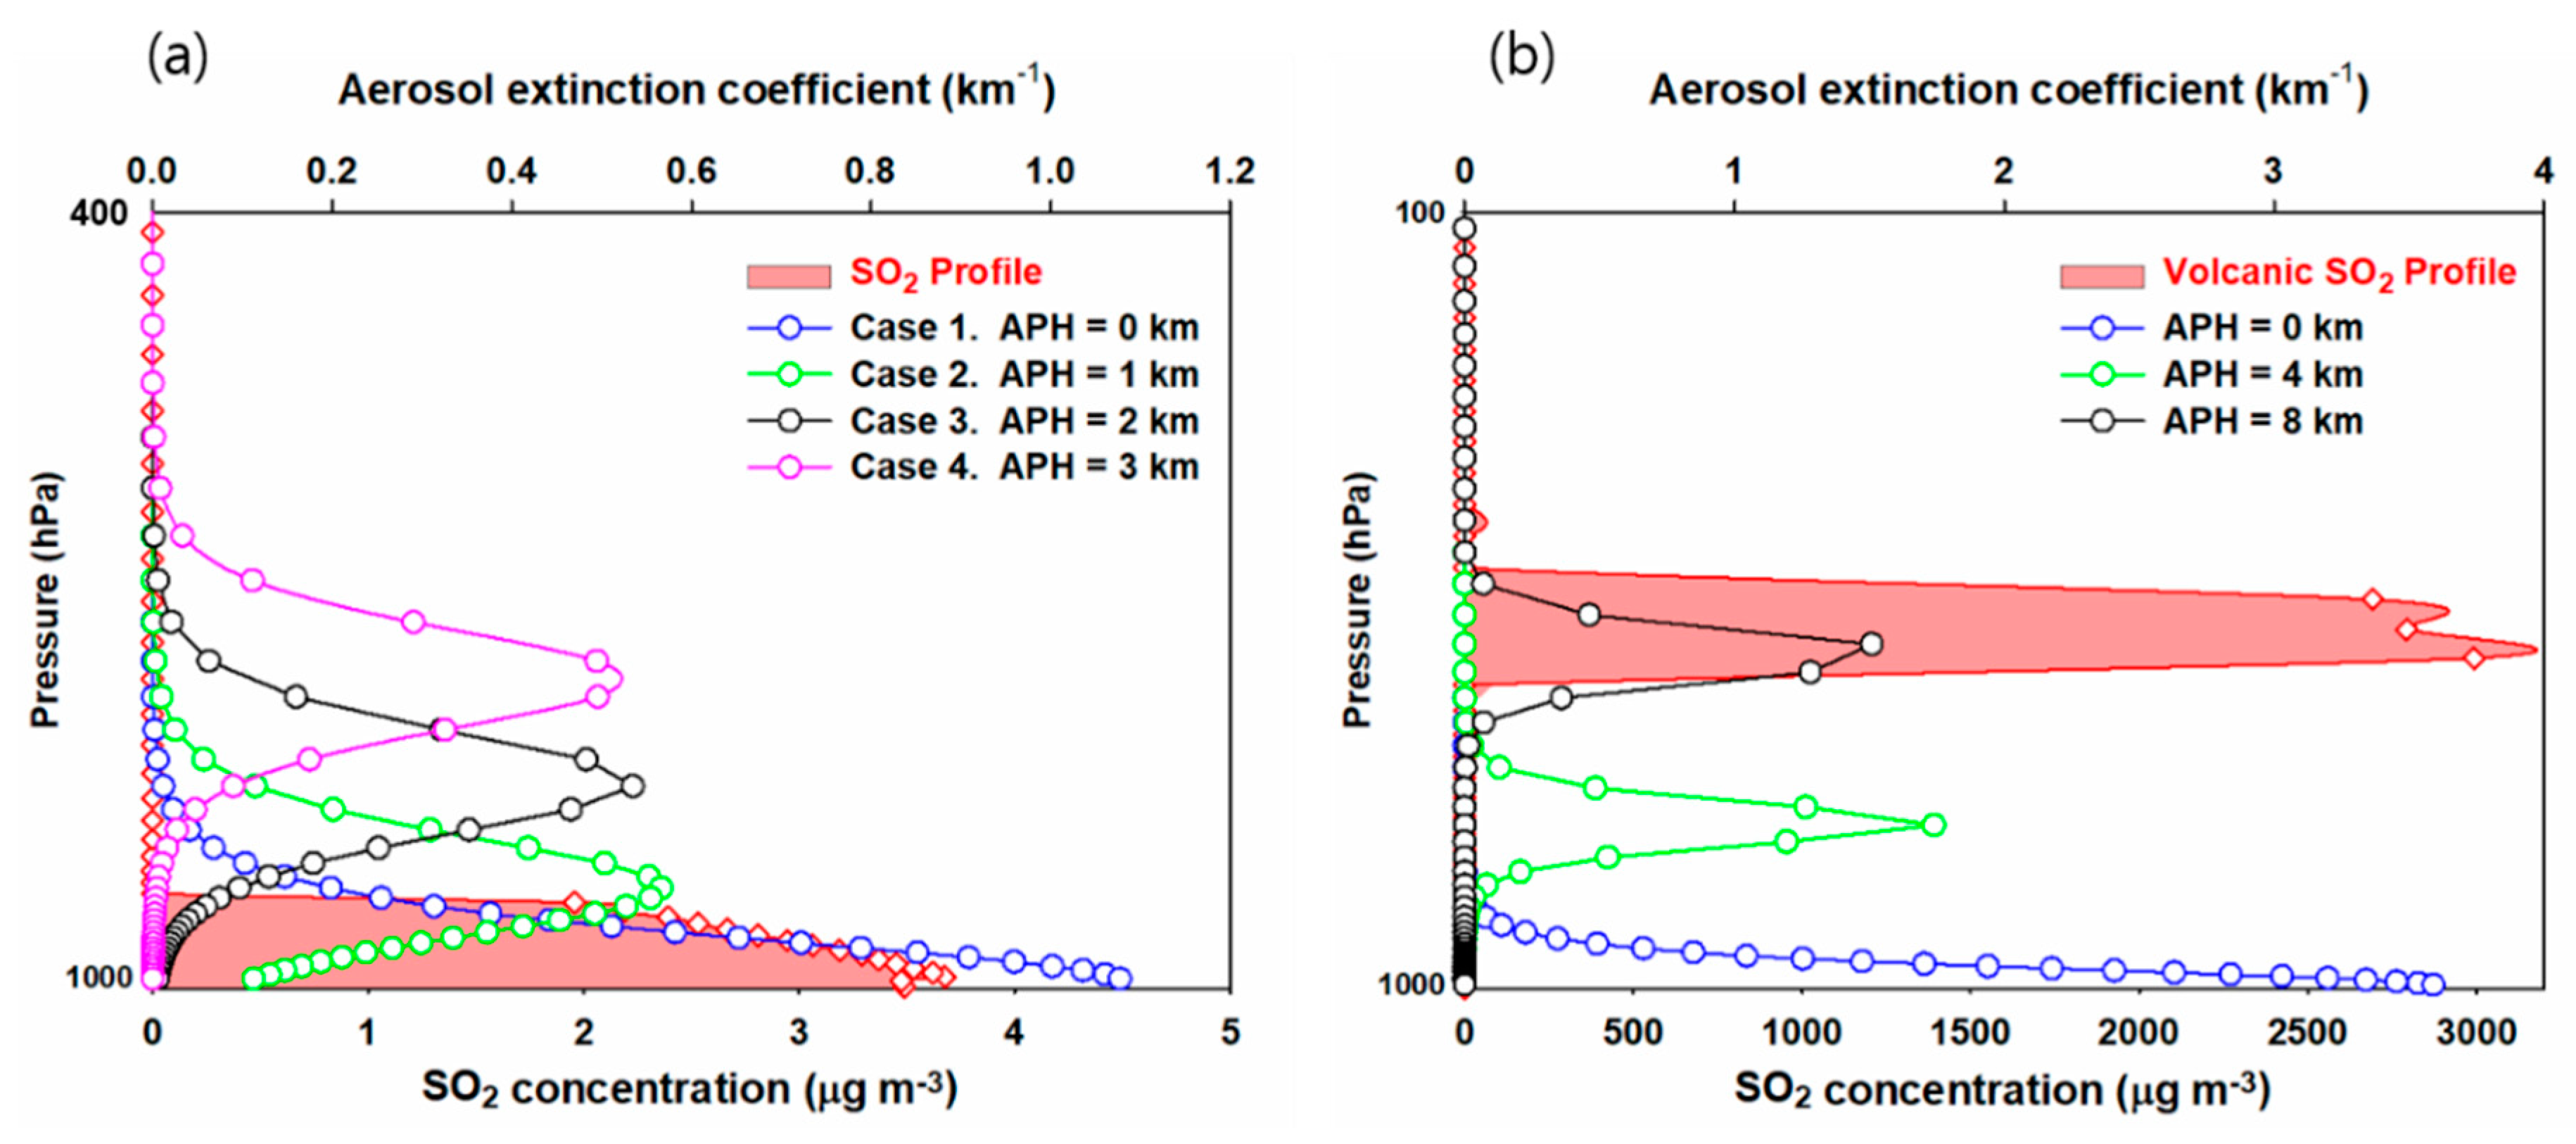
3.3. Effects of Aerosol Peak Height and Aerosol Optical Depth on PBL SO2

As discussed for the results shown in Figure 4 and Figure 5, aerosols increase the light path length and the PBL SO2 AMF by multiple scattering effects when aerosols and SO2 are present in the same layer. We investigated changes in the aerosol effects on the SO2 AMF with changes in the aerosol peak height relative to the SO2 layer height. The vertical profiles of SO2 and aerosols, with indicators of their corresponding layers, are shown in Figure 3. Figure 7a shows the APH effect on the SO2 AMF as a function of AOD. The PBL SO2 AMF is found to increase with decreasing APH, which indicates an increase in light path length in the PBL caused by a large multiple scattering effect when both the aerosol and SO2 layers are at the same height. For AOD values of 0.3 (2.0), the SO2 AMF is 0.55 (0.75), 0.36 (0.21), and 0.28 (0.10) for an APH of 0, 1, and 2 km, respectively. For APH = 0 km (Case 1 in Figure 3a) where the aerosol layer almost overlaps the SO2 layer, the AOD increases the SO2 AMF. The SO2 AMF increases from 0.55 to 0.75 with an increase in AOD from 0.3 to 2.0. However, aerosols are found to decrease the SO2 AMF for APH = 1, 2, and 3 km (Cases 2, 3, and 4 in Figure 3a). For APH = 2 and 3 km where the aerosol layer is located above that of SO2, the SO2 AMF tends to decrease with increasing AOD, which suggests an aerosol shielding effect. The shielding effect is found to be more important than the multiple scattering effect for APH = 1 km where the aerosol layer is slightly higher than but partially overlaps that of SO2. For APH = 1 km, the SO2 AMF is 0.36 and 0.21 for an AOD of 0.3 and 2.0, respectively, which shows the decreasing trend of SO2 AMF as a function of AOD. The APH effect on SO2 AMF is also investigated with respect to both SZA and AOD. The trend of SO2 AMF as a function of APH and AOD (Figure 7b) is similar to those shown in Figure 7a. However, the SO2 AMF for high SZA (SZA = 60°) is found to be smaller than for low SZA (SZA = 20°) for all APH and AOD conditions because of greater Rayleigh scattering under high SZA conditions, as discussed for the results shown in Figure 4, Figure 5 and Figure 6.

3.4. Effects of Aerosol Optical Depth and Surface Reflectance on PBL SO2

Surface reflectance effects on SO2 AMF are also investigated. As SZA, AOD, and APH are found to have important effects on SO2 AMF (Figure 4, Figure 5, Figure 6 and Figure 7), the surface reflectance effect is quantified as a function of AOD and SZA for APH = 0 and 2 km. Surface reflectance is found to increase the SO2 AMF. When SO2 and aerosols are present in the same layer (APH = 0 km), SO2 AMF tends to increase significantly with increasing surface reflectance under low aerosol loading conditions (Figure 8). For SZA = 60° (20°), the SO2 AMF increases from 0.41 (0.43) to 0.68 (0.81) as surface reflectance increases from 0.0 to 0.15 for AOD = 0.3, but increases only slightly from 0.52 (0.72) to 0.56 (0.81) for AOD = 2.0, indicating a large effect of surface reflectance on the PBL SO2 AMF under low aerosol conditions.
When the aerosol layer is higher than the SO2 layer (APH = 2 km), it has a shielding effect and the SO2 AMF tends to increase significantly with increasing surface reflectance, particularly under low AOD conditions. For SZA = 60° (20°) and APH = 2 km, the SO2 AMF increases from 0.11 (0.15) to 0.37 (0.55) for AOD = 0.3 as surface reflectance increases from 0.0 to 0.15, increasing by a factor of greater than three. The SO2 AMF increases from 0.02 (0.04) to 0.07 (0.13) for AOD = 1.8 and SZA = 60° (20°). Under high AOD conditions for both APH = 0 and 2 km, surface reflectance affects the PBL SO2 AMF less than it does under low AOD conditions. Thus, the PBL SO2 AMF is found to be affected more by SZA, VZA, AOD, APH, and surface reflectance than by RAA, total column O3, and the O3 vertical profile.

3.5. Effects of Aerosol Peak Height and Aerosol Optical Depth on Volcanic SO2

We also investigated the AMF for volcanic SO2, which is located at a much higher altitude than is the case for PBL SO2. Figure 9 shows the effects of SZA, AOD, and APH on volcanic SO2 AMF. Here, we use a 10 km SO2 layer height [34] and volcanic aerosols [41] to calculate the volcanic SO2 AMF. The APH is set to 0, 4, and 8 km, which are either lower than or close to the volcanic SO2 layer between 9 and 10 km (Figure 3b). The volcanic SO2 AMF is found to be significantly affected by SZA. However, SZA affects the volcanic SO2 AMF differently than the PBL SO2 AMF. High SZA is found to increase the volcanic SO2 AMF (Figure 9), whereas the PBL SO2 AMF decreases with increasing SZA (Figure 8). This increasing trend of volcanic SO2 AMF with increasing SZA suggests a weaker Rayleigh scattering effect at high SZA at altitudes above the PBL. Higher SZA increases the light path length within the volcanic SO2 layer because of decreased photon loss. These photons penetrate into the SO2 layer (above the PBL), which leads to higher volcanic SO2 AMFs.
For SZA = 60°, the volcanic SO2 AMFs tend to decrease with increasing APH under high AOD conditions. For AOD = 5.0, the volcanic SO2 AMFs are 3.73 and 3.40 for APH = 0 and 8 km, respectively. Under very high AOD conditions, the aerosol layer under high aerosol loading conditions at an APH of 8 km completely overlaps the volcanic SO2 layer, which leads to a large shielding effect. The SO2 AMF is much lower at SZA = 20° than that at SZA = 60°. Lower SZA reduces the light path length within the volcanic SO2 layer. For low AOD (0–2) and SZA = 60°, the volcanic SO2 AMF is not significantly affected by APH.

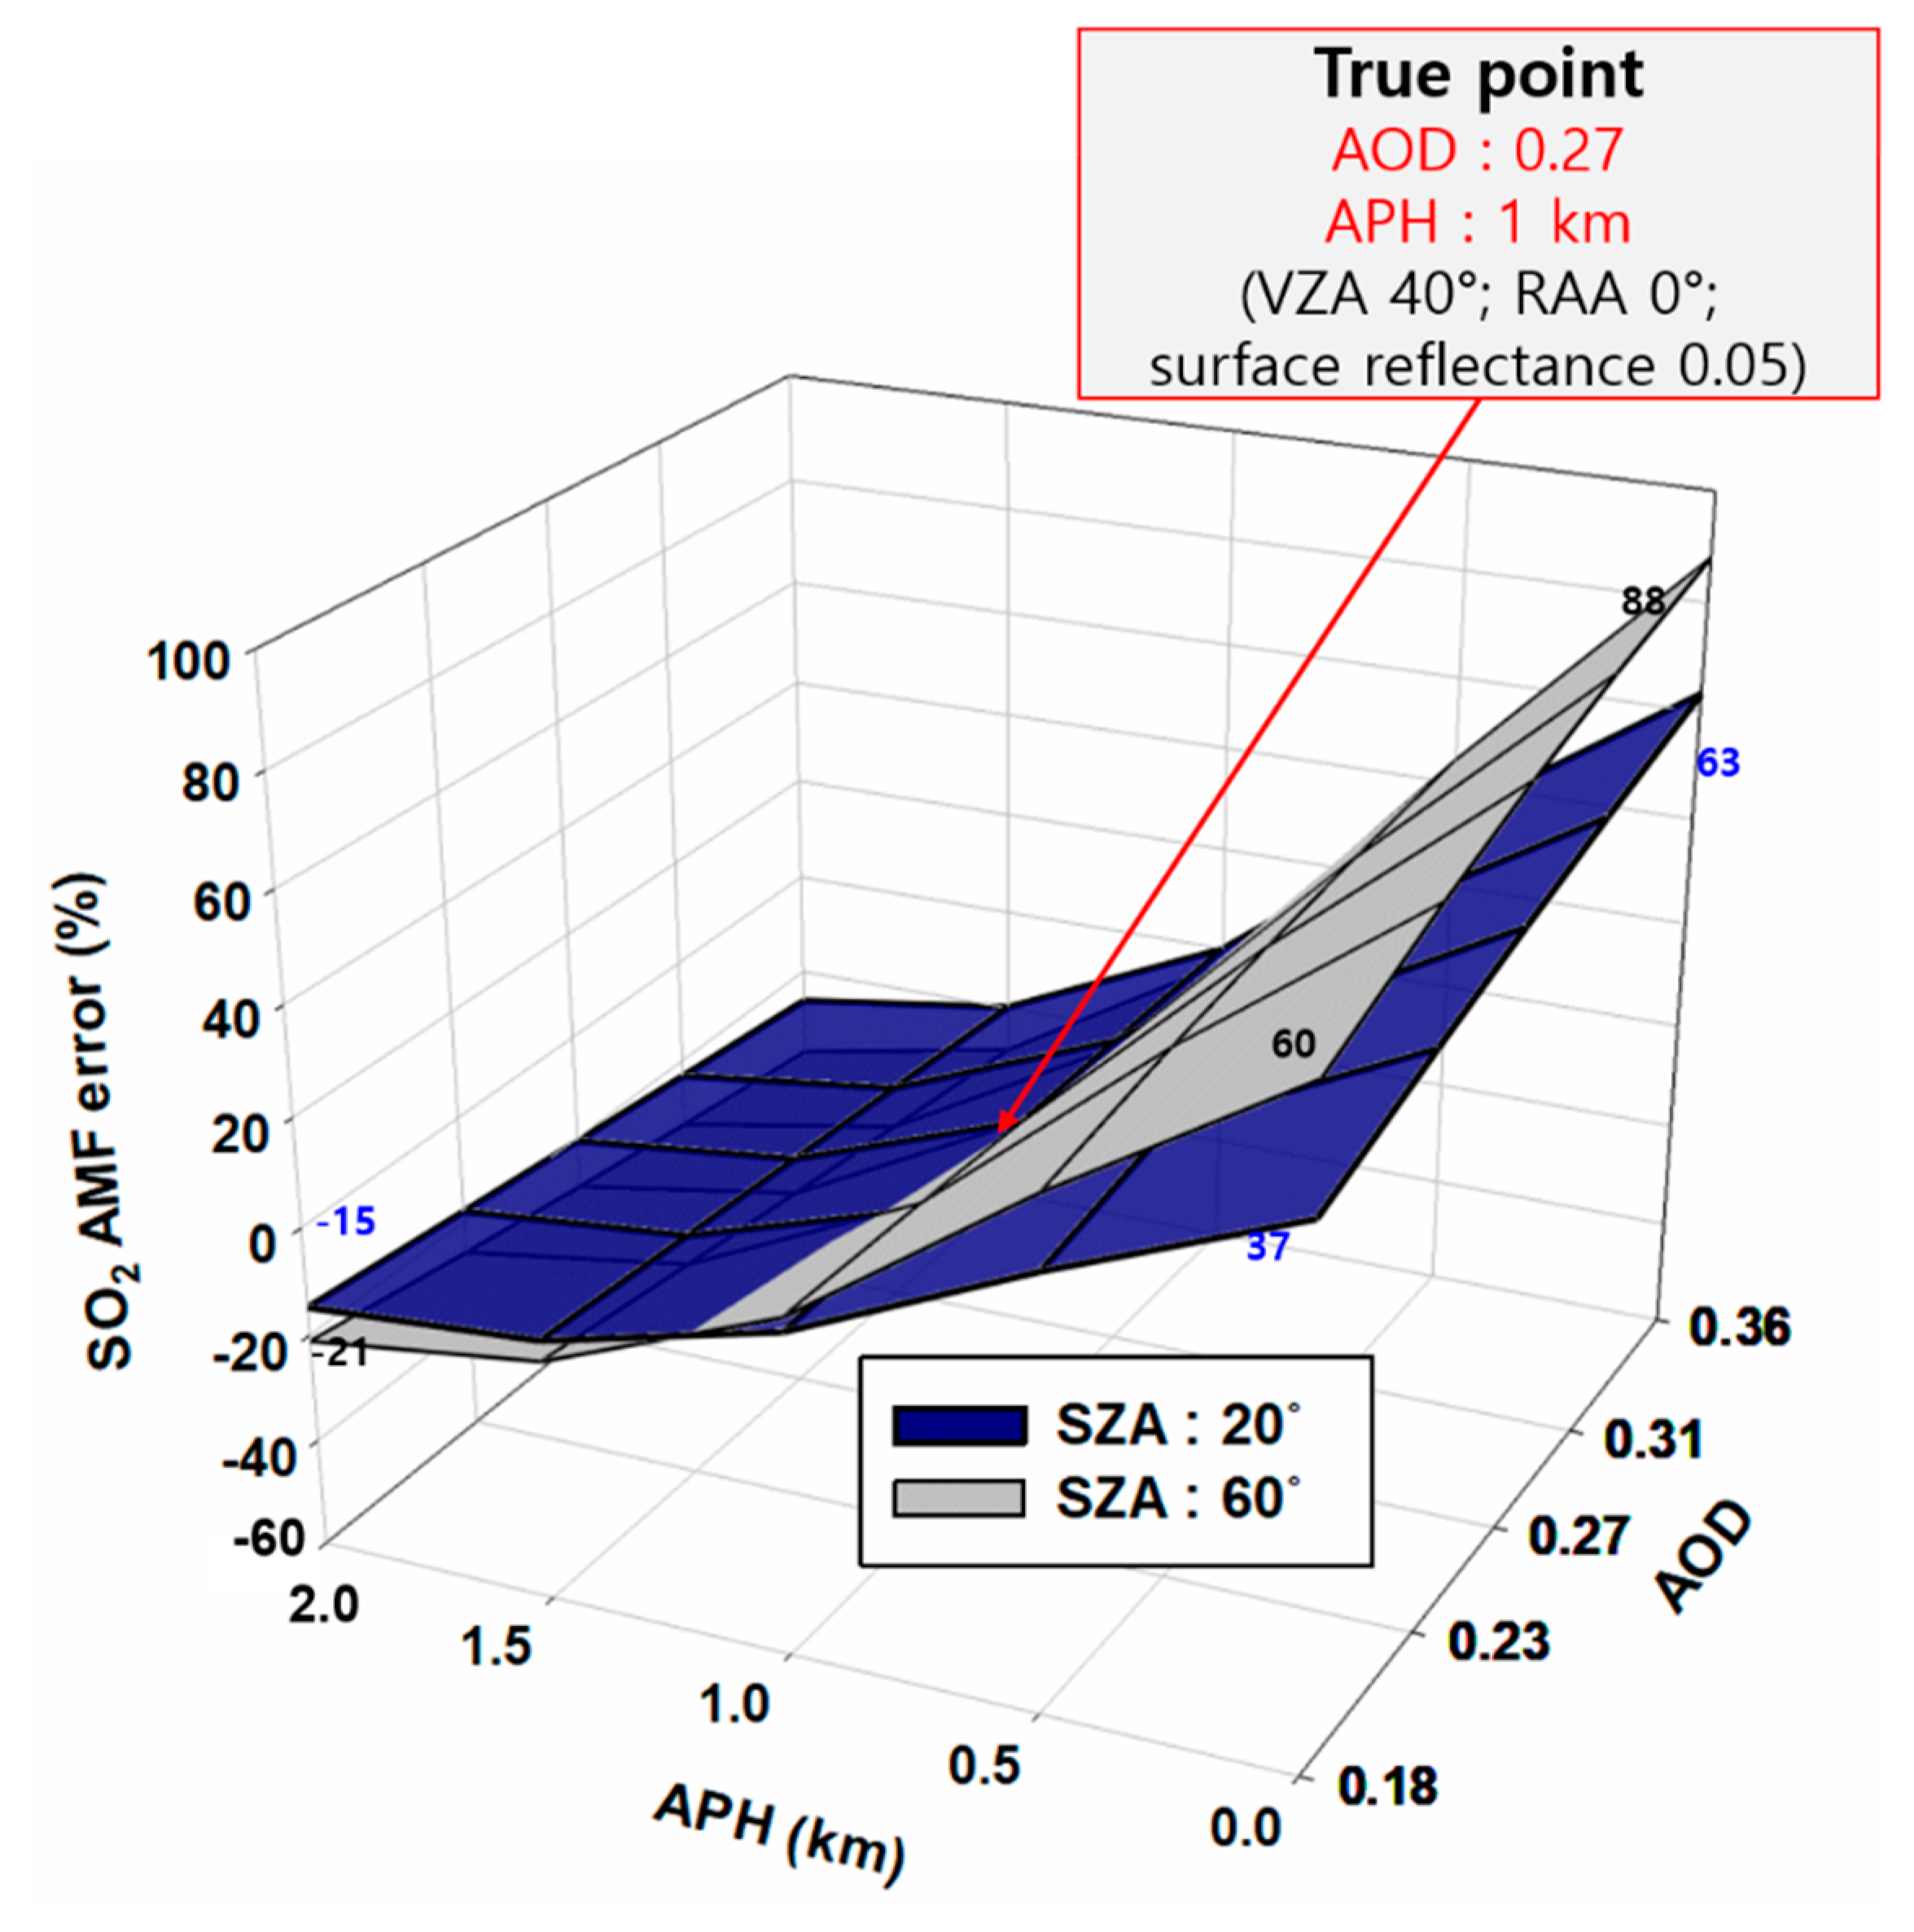
3.6. Estimation of SO2 AMF Errors

3.6.1. PBL SO2 AMF Error

SO2 AMF errors can be caused by inaccuracy of the input data used for the RTM calculations. The AMF errors are quantified as a function of uncertainty in the input data for AOD, APH, and surface reflectance, as these affect the SO2 AMF the most among parameters. An APH of 1 km, an AOD of 0.27, and a surface reflectance of 0.05 were used as ‘true’ values for the PBL SO2 AMF calculation. In Figure 10 and Figure 11, true AOD and surface reflectance values were obtained from mean values obtained from the Level-3 OMI Aerosol product (OMAEROe) and Level-3 OMI LER climatology (OMLER), respectively, over East Asia from 2005–2010. The uncertainties in AOD and surface reflectance input data were based on the MODIS Near Real Time (NRT) product (MYD04 and MYD09, respectively). Detailed uncertainty information is provided in Table 2. The expected error of APH is assumed as 1 km, which is suggested in Fishman et al. [42].
Figure 10 shows the percent difference in PBL SO2 AMF as a function of APH and AOD against the true AMF. The VZA and RAA were set to 40° and 0°, respectively, and two SZA conditions (20° and 60°) were used. The true AMF values, which are calculated for APH = 1 km and AOD = 0.27, are 0.36 and 0.28 for SZA = 20° and 60°, respectively (Figure 10). Under high SZA conditions, the PBL SO2 AMFs are more strongly affected by AOD and APH than under low SZA conditions. In particular, when the APH used in the AMF calculation is smaller than the ‘true’ APH, the SO2 AMF error is significantly larger under high SZA conditions. When APH = 0 km (1 km smaller than the ‘true’ value) and AOD = 0.18 (0.33% smaller than the ‘true’ AOD of 0.27), the SO2 AMF errors are +60% and +37% for SZA = 60° and 20°, respectively (Figure 10). When APH = 0 km and AOD = 0.36 (0.33% larger than the ‘true’ AOD), the SO2 AMF error is overestimated by 88% (63%) for SZA 60° (20°).
When the APH used in the AMF calculation is larger than the ‘true’ APH, the magnitude of the SO2 AMF error is found to be smaller than when the APH that is used is smaller than the ‘true’ APH. When an artificially large APH value (2.0 km) is used, the SO2 AMF error is underestimated by 21% (15%) for SZA = 60° (20°) with AOD = 0.18 (33% smaller than the ‘true’ AOD). When APH = 2 km and AOD = 0.36 (33% larger than the ‘true’ AOD), the SO2 AMF errors are −37% and −26% for SZA = 60° and 20°, respectively.
We also quantified the contributions of surface reflectance uncertainties to the PBL SO2 AMF error. Figure 11 shows the percent difference in PBL SO2 AMF as a function of surface reflectance and AOD against the ‘true’ AMF. The ‘true’ PBL SO2 AMF (AMF error = 0 %) is calculated for AOD = 1.0 and APH = 4 km. The PBL SO2 AMFs under high SZA conditions are found to be more affected by AOD and surface reflectance than those under low SZA conditions. In addition, the trend of SO2 AMF as a function of AOD and surface reflectance for SZA = 20° is opposite that when SZA = 60°. When surface reflectance = 0.042 (15% smaller than the ‘true’ value) and AOD = 0.18 (33% smaller than the ‘true’ AOD of 0.27), the SO2 AMF error is underestimated by 15% and 3% for APH = 0 and 2 km, respectively, and SZA = 20° (Figure 11a). However, under the same surface reflectance (0.042) and AOD (0.18) conditions but for SZA = 60°, the SO2 AMF error is 3% and −13% for APH = 0 and 2 km, respectively (Figure 11b). For a surface reflectance of 0.057 (15% larger than the ‘true’ value) and AOD = 0.18, the SO2 AMF error is −4% and 18% for APH = 0 and 2 km, respectively, and SZA = 20° (Figure 11a). For the same surface reflectance (0.0575) and AOD (0.18) conditions but with SZA = 60°, the SO2 AMF error is 23% and −5% for APH = 0 and 2 km, respectively (Figure 11b). The PBL SO2 AMF error is also found to be both negatively and positively biased, depending on the AOD, APH, and surface reflectance error. For example, for high APH (APH = 2 km), overestimated AOD (AOD = 0.36) leading to aerosol shielding effects, and a surface reflectance of 0.042, the SO2 AMF error is calculated to be –16%, which is negatively biased compared with the ‘true’ AMF. This indicates that a positively biased AOD value under high APH conditions (APH = 2 km) artificially increases aerosol shielding effects and leads to a SO2 AMF value that is smaller than the ‘true’ value. This smaller SO2 AMF is, thus, negatively biased.
The error budget of the PBL SO2 AMF is additionally calculated based on the TROPOMI measurement condition, since the TROPOMI is the most recent sensor that monitors SO2 column densities. The PBL SO2 AMF error budget was calculated on the basis of the uncertainties associated with the APH, AOD, and surface reflectance because we found that the SO2 AMF errors were caused mainly by the APH, AOD, and surface reflectance rather than the measurement geometries and ozone profile. We used Gaussian error propagation (GEP) to estimate the PBL SO2 AMF error as follows [44,45].
( AMF χ i ) 2 σ χ i 2 = ε A M F ,     χ i
ε AMF = ε A M F ,   A O D 2 + ε A M F ,   s u r f a c e   r e f l e c t a n c e 2 + ε A M F ,   A P H 2 = i = 1 3 ( AMF χ i ) 2 σ χ i 2
where ε A M F ,     χ i   is the error of the PBL SO2 AMF caused by the input parameters χi, ε AMF is the total error of the PBL SO2 AMF, ( AMF χ i ) is the partial derivative of the PBL SO2 AMF by the input parameters χi, σχi represents the uncertainty of the ith input parameter χi, and σχi2 is the variance. Equation (5) assumes that errors from the various input parameters are independent of one another. We calculated the error budget of the PBL SO2 AMF error as the percentage error to effectively present the SO2 AMF error caused by uncertainties in APH, AOD, and surface reflectance (Equations (6) and (7)). To calculate the percentage error for each parameter, ε A M F ,     χ i was divided by the true PBL SO2 AMF and then averaged using the number of values in dataset z (Equation (6)). To calculate the total percentage error, ε A M F was divided by the true PBL SO2 AMF and then averaged using the number of values in dataset z (Equation (7)).
percentage   error   for   χ i   ( % ) = 0 z ε A M F ,     χ i T r u e   S O 2   A M F z × 100
total   percentage   error   ( % ) = 0 z ε A M F T r u e   S O 2   A M F z × 100
According to the TROPOMI SO2 Algorithm Theoretical Basis Documents (ATBD), the climatological monthly minimum Lambertial equivalent reflector (minLER) data from Kleipool et al. [46] are used as the input data for surface reflectance during operational SO2 retrieval [47]. We used an uncertainty of 0.02 for the minLER data in our error budget calculations [47]. Aerosol parameters, such as the aerosol extinction profile, which accounts for the AOD and APH, are not considered in the operational retrieval of TROPOMI SO2 [47]. Therefore, in our error budget calculations, we assumed that the uncertainty associated with the MODIS AOD was the same as the AOD for TROPOMI SO2 retrieval [43]. The uncertainty associated with the APH was assumed to be 1 km according to the previous study [42]. To calculate ( AMF χ i ) 2 , we simulated the PBL SO2 AMF using an RTM with input parameters to assume the measurement condition of the TROPOMI as shown in Table 3. To calculate the error budget in thin and thick aerosol cases, two AOD intervals (interval A: 0.2 ≤ AOD ≤ 1.0; interval B: 1.0 < AOD ≤ 2.0) were considered. In addition, the SO2 AMF was found to be affected by the APH relative to the SO2 layer height, and three APH conditions (0, 1, and 2 km) were considered in our error analysis. For the APH, AOD, and surface reflectance, the new SO2 AMF was simulated using Xi + σXi. ∂Xi denotes the difference between the true Xi and Xi + σXi, and ∂AMF is the difference between the ‘true’ AMF simulated with ‘true’ input values and the new AMF simulated using input parameters, with the uncertainty of each parameter being Xi + σXi.
Table 4 summarizes the total error budget of the PBL SO2 AMF caused by the uncertainties associated with the individual input parameters (APH, AOD, and surface reflectance) and the TROPOMI measurement conditions using Equations (6) and (7). In general, the APH uncertainty makes the greatest contribution to the total SO2 AMF error among the individual input parameters based on the TROPOMI measurement conditions (Table 3). In particular, when the APH is 1 km, inaccurate APH values can lead to PBL SO2 AMF percentage errors of 72.1% under lower AOD conditions (interval A), whereas the PBL SO2 AMF error related to APH uncertainty increases to 173.4% under higher AOD conditions (interval B). It is also evident that uncertainties in APH and AOD tend to cause higher PBL SO2 AMF percentage errors for high AODs (interval B) compared with low AODs (interval A), which suggests that the uncertainties in APH and AOD have a greater effect on the PBL SO2 AMF percentage error under high AOD conditions. However, for high SO2 conditions, the effect of the surface reflectance uncertainty on the PBL SO2 AMF is smaller than that of the AOD and APH in the error budget, based on the TROPOMI measurement conditions.

3.6.2. Volcanic SO2 AMF Error

Volcanic SO2 AMF errors are also quantified as a function of the uncertainties of APH and AOD, which are used as inputs for the RTM calculations. Figure 12 shows the percent difference in volcanic SO2 AMF as a function of APH and AOD against the ‘true’ AMF. To calculate the ‘true’ volcanic SO2 AMF, AOD = 1.0 and APH = 4 km were used following previous studies [48,49,50,51] that reported volcanic plume heights during the Eyjafjallajökull eruptions. Volcanic SO2 AMF errors for a SZA of 20° are similar to those for SZA = 60° when APH = 0 km, instead of the ‘true’ APH of 4 km. The volcanic SO2 AMF errors are −3% (−4%) and 12% (10%) for AOD values of 0 and 5, respectively, when the ‘true’ AOD is 1. However, volcanic SO2 AMF errors for SZA = 20° increase significantly when APH = 8 km and AOD = 0 (for a ‘true’ APH of 4 km and AOD of 1). The volcanic SO2 AMF error for SZA = 20° is 13% for APH = 8 km and AOD = 5. This positively biased volcanic SO2 AMF may be associated with enhanced multiple scattering effects for the artificially high APH value of 8 km for SZA = 20°.

4. Discussion

The uncertainties associated with the SO2 AMF are an important aspect of our understanding of SO2 VCD retrieval errors generated by hyperspectral UV sensors. Previous studies [6,10,23,25,26] have reported that several factors can cause these SO2 AMF sensitivities and uncertainties. Khokhar et al. [6] and Richter et al. [10] investigated the effect of various parameters, such as SZA, SO2 profile, and surface reflectance, on the volcanic SO2 AMF. Theys et al. [25] studied the SO2 vertical distribution effect on the volcanic and PBL SO2 AMF. Lee et al. [26] carried out error analysis of the PBL SO2 AMF for surface reflectance, aerosol properties, cloud fraction, and the SO2 vertical distribution. However, none of these studies investigated the critical role of APH on the SO2 AMF under various measurement conditions. Hong et al. [35] reported the simultaneous effects of APH and other aerosol properties on the NO2 AMF. In this section, we discuss several important findings with respect to the APH effects on the SO2 AMF and compare our findings with those for NO2 AMF reported by Hong et al. [35].
The AOD effect on the PBL SO2 AMF changes with the APH relative to the SO2 layer height. With the existence of both SO2 and aerosols within the PBL, the PBL SO2 AMFs are largely increased under high-AOD conditions due to the increased SO2 absorption caused by multiple scattering. When the aerosol layer is located above the SO2 layer, the aerosol shielding effect leads to a reduction in the SO2 AMF with increasing AOD. A previous study by Hong et al. [35] reported similar patterns between the NO2 AMF and APH. The increase in AOD leads to increases in NO2 AMF when the APH and NO2 layer are at the same height, and to decreases in NO2 AMF with the shielding effect due to high-APH conditions [35].
In terms of the APH effect on the volcanic SO2 AMF, under very high AOD and SZA, APH has a significant influence on the volcanic SO2 AMF, which is reduced by the shielding effect. The APH also influences the PBL SO2 AMF, which can either be reduced or increased depending on the AOD condition and APH relative to the SO2 layer height.
Increases in the SZA and VZA cause the PBL SO2 AMF to decrease. The Rayleigh scattering effect generated at high SZA or VZA values is found to largely decrease the light path length at the SO2 absorption wavelength. The decrease in SO2 AMF with increasing SZA is the inverse of the correlation between NO2 AMF and SZA reported by Hong et al. [35]. This difference between the trends of SO2 and NO2 AMFs with SZA can be attributed to the absorption wavelength of SO2 that is generally used for spectral fitting, which is much shorter and more affected by ozone absorption and Rayleigh scattering than is that of NO2.
Hence, in this present study, we additionally calculated the error budget of the PBL SO2 AMF caused by uncertainties associated with the APH, AOD, and surface reflectance based on the TROPOMI measurement conditions. The APH uncertainty was the most important factor with respect to the PBL SO2 AMF error (up to 171.9%). Uncertainties in both the APH and AOD tend to cause an increase in the PBL SO2 AMF percentage error under high AOD conditions and when using the TROPOMI measurement conditions. However, the effect of the uncertainty related to the surface reflectance on the SO2 AMF error is not sensitive to the AOD level. In this present study, the high SO2 AMF error caused by APH uncertainty in the error budget shows that aerosol height needs to be considered in the error budget of operational SO2 retrieval algorithms.
In the future, the SO2 AMF sensitivities and error analysis provided here could be used to inform error reduction strategies for an SO2 retrieval algorithm developed for use with new space-borne satellite sensors such as the Geostationary Environmental Monitoring Spectrometer (GEMS). Here, we have investigated the effect of APH under various measurement conditions on SO2 AMF for clear sky conditions. In future studies, the sensitivity of SO2 AMF to APH under cloudy conditions needs to be investigated because space-borne measurements are often performed in cloudy skies.

5. Summary and Conclusions

SO2 retrieval error includes errors in spectral fitting and errors in the calculation of AMFs, which are used in DOAS SO2 retrieval algorithms. Here, we examined the simultaneous effects of AOD, APH, ozone column density, ozone vertical profile, and surface reflectance under various measurement geometries (SZA, VZA, and RAA). These effects are quantified for PBL and volcanic SO2 AMFs. The important findings of this work are summarized as follows.
The PBL SO2 AMF tends to decrease with increasing SZA and VZA. A large Rayleigh scattering effect at high SZA or VZA is found to reduce the light path length at the SO2 absorption wavelength used for spectral fitting. However, under high AOD conditions, the aerosol layer provides more of a shielding effect, which reduces the light path length in the PBL and, thus, the SO2 AMF.
The influence of AOD on the PBL SO2 AMF varies with the APH relative to the SO2 layer height. When both SO2 and most aerosols are present within the PBL, the PBL SO2 AMFs are greatly enhanced under high AOD conditions because of the increased SO2 absorption caused by the longer light path length induced by multiple scattering. When the aerosol layer is above the SO2 layer, the SO2 AMF tends to decrease with increasing AOD because of the aerosol shielding effect.
We found a large contribution of surface reflectance to the PBL SO2 AMF under low aerosol and SZA conditions. Enhanced surface reflectance significantly increases the PBL SO2 AMF.
SZA affects the volcanic SO2 AMF differently to the PBL SO2 AMF. Higher SZA is found to increase the volcanic SO2 AMF because of negligible Rayleigh scattering at high altitudes. When the aerosol layer overlaps that of SO2 under high SZA and AOD conditions, aerosol shielding effects slightly decrease the volcanic SO2 AMF.

Author Contributions

H.L. designed and interpreted the entire experiments. W.C. simulated synthetic radiance using radiative transfer model and estimated SO2 AMF errors. J.Y. produced input data for radiative transfer model and calculated aerosol effect on SO2 AMF. M.V.R. interpreted results of radiative transfer calculation and summarized previous studies. J.-H.K. displayed the experimental results and compared them with results from previous studies. J.P. and D.K. calculated the effect of ozone column and surface reflectance on SO2 AMF. All authors have read and agreed to the published version of the manuscript.

Funding

This work was funded by the Korea Meteorological Administration Research and Development Program under Grant KMI2018-02160.

Conflicts of Interest

The authors declare no conflict of interest.

References

  1. Charlson, R.J.; Schwartz, S.E.; Hales, J.M.; Cess, R.D.; Coakley, J.J.; Hansen, J.E.; Hofmann, D.J. Climate forcing by anthropogenic aerosols. Science 1992, 255, 423–430. [Google Scholar] [CrossRef] [PubMed]
  2. Theys, N.; De Smedt, I.; Yu, H.; Danckaert, T.; van Gent, J.; Hörmann, C.; Wagner, T.; Hedelt, P.; Bauer, H.; Romahn, F.; et al. Sulfur dioxide retrievals from TROPOMI onboard Sentinel-5 Precursor: Algorithm theoretical basis. Atmos. Meas. Tech. 2017, 10, 119. [Google Scholar] [CrossRef] [Green Version]
  3. Whelpdale, D.M.; Summers, P.W.; Sanhueza, E.; Artz, R.A.; Ayers, G.P.; Delmas, R.J.; Galloway, J.N.; Gillett, R.W.; Hara, H.; Lacaux, J.P.; et al. A Global Overview of Acid Deposition; WMO Publication: Geneva, Switzerland, 1996. [Google Scholar]
  4. Faloona, I. Sulfur processing in the marine atmospheric boundary layer: A review and critical assessment of modeling uncertainties. Atmos. Environ. 2009, 43, 2841–2854. [Google Scholar] [CrossRef]
  5. Eisinger, M.; Burrows, J.P. Tropospheric sulfur dioxide observed by the ERS-2 GOME instrument. Geophys. Res. Lett. 1998, 25, 4177–4180. [Google Scholar] [CrossRef] [Green Version]
  6. Khokhar, M.F.; Frankenberg, C.; Van Roozendael, M.; Beirle, S.; Kühl, S.; Richter, A.; Platt, U.; Wagner, T. Satellite observations of atmospheric SO2 from volcanic eruptions during the time-period of 1996–2002. Adv. Space Res. 2005, 36, 879–887. [Google Scholar] [CrossRef]
  7. Lee, C.; Richter, A.; Weber, M.; Burrows, J.P. SO2 retrieval from SCIAMACHY using the Weighting Function DOAS (WFDOAS) technique: Comparison with standard DOAS retrieval. Atmos. Chem. Phys. 2008, 8, 6137–6145. [Google Scholar] [CrossRef] [Green Version]
  8. Richter, A.; Wittrock, F.; Burrows, J.P. May. SO2 measurements with SCIAMACHY. In Proceedings of the Atmospheric Science Conference, Frascati, Italy, 8–12 May 2006. [Google Scholar]
  9. Nowlan, C.R.; Liu, X.; Chance, K.; Cai, Z.; Kurosu, T.P.; Lee, C.; Martin, R.V. Retrievals of sulfur dioxide from the Global Ozone Monitoring Experiment 2 (GOME-2) using an optimal estimation approach: Algorithm and initial validation. J. Geophys. Res. Atomos. 2011, 116, D18301. [Google Scholar] [CrossRef] [Green Version]
  10. Richter, A.; Wittrock, F.; Schönhardt, A.; Burrows, J.P. Quantifying volcanic SO2 emissions using GOME2 measurements. In Proceedings of the EGU General Assembly, Vienna, Austria, 19–24 April 2009. [Google Scholar]
  11. Rix, M.; Valks, P.; Hao, N.; Loyola, D.; Schlager, H.; Huntrieser, H.; Flemming, J.; Koehler, U.; Schumann, U.; Inness, A. Volcanic SO2, BrO and plume height estimations using GOME-2 satellite measurements during the eruption of Eyjafjallajökull in May 2010. J. Geophys. Res. Atomo 2012, 117, D00U19. [Google Scholar] [CrossRef] [Green Version]
  12. Krotkov, N.A.; Carn, S.A.; Krueger, A.J.; Bhartia, P.K.; Yang, K. Band residual difference algorithm for retrieval of SO2 from the aura ozone monitoring instrument (OMI). IEEE Trans. Geosci. Remote Sens. 2006, 44, 1259–1266. [Google Scholar] [CrossRef]
  13. Yang, K.; Krotkov, N.A.; Krueger, A.J.; Carn, S.A.; Bhartia, P.K.; Levelt, P.F. Retrieval of large volcanic SO2 columns from the Aura Ozone Monitoring Instrument: Comparison and limitations. J. Geophys. Res. Atmos. 2007, 112, D24S43. [Google Scholar] [CrossRef] [Green Version]
  14. Yang, K.; Dickerson, R.R.; Carn, S.A.; Ge, C.; Wang, J. First observations of SO2 from the satellite Suomi NPP OMPS: Widespread air pollution events over China. Geophys. Res. Lett. 2013, 40, 4957–4962. [Google Scholar] [CrossRef] [Green Version]
  15. Zhang, Y.; Li, C.; Krotkov, N.A.; Joiner, J.; Fioletov, V.; McLinden, C. Continuation of long-term global SO2 pollution monitoring from OMI to OMPS. Atmos. Meas. Tech. 2017, 10, 1495. [Google Scholar] [CrossRef] [Green Version]
  16. Veefkind, J.P.; Aben, I.; McMullan, K.; Förster, H.; De Vries, J.; Otter, G.; Claas, J.; Eskes, H.J.; De Haan, J.F.; Kleipool, Q.; et al. TROPOMI on the ESA Sentinel-5 Precursor: A GMES mission for global observations of the atmospheric composition for climate, air quality and ozone layer applications. Temote Sens. Environ. 2012, 120, 70–83. [Google Scholar] [CrossRef]
  17. Afe, O.T.; Richter, A.; Sierk, B.; Wittrock, F.; Burrows, J.P. BrO emission from volcanoes: A survey using GOME and SCIAMACHY measurements. Geophys. Res. Lett. 2004, 31, 24. [Google Scholar] [CrossRef] [Green Version]
  18. Bobrowski, N.; Kern, C.; Platt, U.; Hörmann, C.; Wagner, T. Novel SO2 spectral evaluation scheme using the 360–390 nm wavelength range. Atmos. Meas. Tech. Discuss. 2010, 3, 879–891. [Google Scholar] [CrossRef] [Green Version]
  19. Hörmann, C.; Sihler, H.; Bobrowski, N.; Beirle, S.; De Vries, M.P.; Platt, U.; Wagner, T. Systematic investigation of bromine monoxide in volcanic plumes from space by using the GOME-2 instrument. Atmos. Chem. Phys. 2013, 13, 4749. [Google Scholar] [CrossRef]
  20. Krueger, A.J. Sighting of El Chichon sulfur dioxide clouds with the Nimbus 7 total ozone mapping spectrometer. Science 1983, 220, 1377–1379. [Google Scholar] [CrossRef] [Green Version]
  21. Stutz, J.; Platt, U. Numerical analysis and estimation of the statistical error of differential optical absorption spectroscopy measurements with least-squares methods. Appl. Opt. 1996, 35, 6041–6053. [Google Scholar] [CrossRef] [Green Version]
  22. Theys, N.; De Smedt, I.; Gent, J.; Danckaert, T.; Wang, T.; Hendrick, F.; Stavrakou, T.; Bauduin, S.; Clarisse, L.; Li, C.; et al. Sulfur dioxide vertical column DOAS retrievals from the Ozone Monitoring Instrument: Global observations and comparison to ground-based and satellite data. J. Geophys. Res. Atmos. 2015, 120, 2470–2491. [Google Scholar] [CrossRef]
  23. Thomas, W.; Erbertseder, T.; Ruppert, T.; Van Roozendael, M.; Verdebout, J.; Balis, D.; Meleti, C.; Zerefos, C. On the retrieval of volcanic sulfur dioxide emissions from GOME backscatter measurements. J. Atmos. Chem. 2005, 50, 295–320. [Google Scholar] [CrossRef]
  24. Platt, U.; Stutz, J. Differential absorption spectroscopy. In Differential Optical Absorption Spectroscopy; Springer: Heidelberg/Berlin, Germany, 2008; pp. 135–174. [Google Scholar]
  25. Theys, N.; Brenot, H.; Van Roozendael, M. Sulphur Dioxide Data Service Algorithm description Document. Available online: http://www.sciamachy.org/products/SO2/SO2sc_BIRA_AD.pdf (accessed on 27 April 2020).
  26. Lee, C.; Martin, R.V.; van Donkelaar, A.; O’Byrne, G.; Krotkov, N.; Richter, A.; Gregory Huey, L.; Holloway, J.S. Retrieval of vertical columns of sulfur dioxide from SCIAMACHY and OMI: Air mass factor algorithm development, validation, and error analysis. J. Geophys. Res. Atmos. 2009, 114, D22303. [Google Scholar] [CrossRef] [Green Version]
  27. Palmer, P.I.; Jacob, D.J.; Chance, K.; Martin, R.V.; Spurr, R.J.; Kurosu, T.P.; Bey, I.; Yantosca, R.; Fiore, A.; Li, Q. Air mass factor formulation for spectroscopic measurements from satellites: Application to formaldehyde retrievals from the Global Ozone Monitoring Experiment. J. Geophys. Res. Atmos. 2001, 106, 14539–14550. [Google Scholar] [CrossRef] [Green Version]
  28. Spurr, R.; Christi, M. On the generation of atmospheric property Jacobians from the (V) LIDORT linearized radiative transfer models. J. Quant. Spectrosc. Radiat. Transf. 2014, 142, 109–115. [Google Scholar] [CrossRef]
  29. Yang, K.; Liu, X.; Bhartia, P.; Krotkov, N.; Carn, S.; Hughes, E.; Krueger, A.; Spurr, R.; Trahan, S. Direct retrieval of sulfur dioxide amount and altitude from spaceborne hyperspectral UV measurements: Theory and application. J. Geophys. Res. 2010, 115, D00L09. [Google Scholar] [CrossRef] [Green Version]
  30. Vandaele, A.C.; Hermans, C.; Fally, S. Fourier transform measurements of SO2 absorption cross sections: II.: Temperature dependence in the 29 000–44 000 cm− 1 (227–345 nm) region. J. Quant. Spectrosc. Radiat. Transf. 2009, 110, 2115–2126. [Google Scholar] [CrossRef]
  31. Bhartia, P.K.; Wellemeyer, C. TOMS-V8 total O3 algorithm. OMI Algorithm Theor. Basis Doc. 2002, 2, 15–31. [Google Scholar]
  32. McPeters, R.D.; Labow, G.J.; Logan, J.A. Ozone climatological profiles for satellite retrieval algorithms. J. Geophys. Res. Atmos. 2007, 112, D05308. [Google Scholar] [CrossRef] [Green Version]
  33. Wellemeyer, C.G.; Taylor, S.L.; Seftor, C.J.; McPeters, R.D.; Bhartia, P.K. A correction for total ozone mapping spectrometer profile shape errors at high latitude. J. Geophys. Res. Atmos. 1997, 102, 9029–9038. [Google Scholar] [CrossRef]
  34. Piscini, A.; Carboni, E.; Del Frate, F.; Grainger, R.G. Simultaneous retrieval of volcanic sulphur dioxide and plume height from hyperspectral data using artificial neural networks. Geophys. J. Int. 2014, 198, 697–709. [Google Scholar] [CrossRef] [Green Version]
  35. Hong, H.; Kim, J.; Jeong, U.; Han, K.S.; Lee, H. The Effects of Aerosol on the Retrieval Accuracy of NO2 Slant Column Density. Remote Sens. 2017, 9, 867. [Google Scholar] [CrossRef] [Green Version]
  36. Jeong, U.; Kim, J.; Ahn, C.; Torres, O.; Liu, X.; Bhartia, P.K.; Spurr, R.J.; Haffner, D.; Chance, K.; Holben, B.N. An optimal-estimation-based aerosol retrieval algorithm using OMI near-UV observations. Atmos. Chem. Phys. 2016, 16, 177–193. [Google Scholar] [CrossRef] [Green Version]
  37. Hayasaka, T.; Satake, S.; Shimizu, A.; Sugimoto, N.; Matsui, I.; Aoki, K.; Muraji, Y. Vertical distribution and optical properties of aerosols observed over Japan during the Atmospheric Brown Clouds–East Asia Regional Experiment 2005. J. Geophys. Res. Atmos. 2007, 112, D22S35. [Google Scholar] [CrossRef]
  38. Kim, S.W.; Yoon, S.C.; Kim, J.; Kim, S.Y. Seasonal and monthly variations of columnar aerosol optical properties over east Asia determined from multi-year MODIS, LIDAR, and AERONET Sun/sky radiometer measurements. Atmos. Environ. 2007, 41, 1634–1651. [Google Scholar] [CrossRef]
  39. Noh, Y.M. Single-scattering albedo profiling of mixed Asian dust plumes with multiwavelength Raman lidar. Atmos. Environ. 2014, 95, 305–317. [Google Scholar] [CrossRef]
  40. Shimizu, A.; Sugimoto, N.; Matsui, I.; Arao, K.; Uno, I.; Murayama, T.; Kagawa, N.; Aoki, K.; Uchiyama, A.; Yamazaki, A. Continuous observations of Asian dust and other aerosols by polarization lidars in China and Japan during ACE-Asia. J. Geophys. Res. Atmos. 2004, 109, D19S17. [Google Scholar] [CrossRef]
  41. Torres, O.; Tanskanen, A.; Veihelmann, B.; Ahn, C.; Braak, R.; Bhartia, P.K.; Veefkind, P.; Levelt, P. Aerosols and surface UV products from Ozone Monitoring Instrument observations: An overview. J. Geophys. Res. Atmos. 2007, 112, D24S47. [Google Scholar] [CrossRef] [Green Version]
  42. Fishman, J.; Iraci, L.T.; Al-Saadi, J.; Chance, K.; Chavez, F.; Chin, M.; Coble, C.; Davis, C.; Digiacomo, P.M.; Edwards, D.; et al. The United States’ next generation of atmospheric composition and coastal ecosystem measurements: NASA’s Geostationary Coastal and Air Pollution Events (GEO-CAPE) mission. Bull. Am. Meteorol. Soc. 2012, 93, 1547–1566. [Google Scholar] [CrossRef] [Green Version]
  43. Chu, D.A.; Kaufman, Y.J.; Ichoku, C.; Remer, L.A.; Tanré, D.; Holben, B.N. Validation of MODIS aerosol optical depth retrieval over land. Geophys. Res. Lett. 2002, 29, MOD2-1. [Google Scholar] [CrossRef] [Green Version]
  44. Kreyszig, E. Introductory Mathematical Statistics; John Wiley & Sons: Hoboken, NJ, USA, 1970. [Google Scholar]
  45. Molders, N.; Jankov, M.; Kramm, G. Application of Gaussian error propagation principles for theoretical assessment of model uncertainty in simulated soil processes caused by thermal and hydraulic parameters. J. Hydrometeorol. 2005, 6, 1045–1062. [Google Scholar] [CrossRef]
  46. Kleipool, Q.L.; Dobber, M.R.; de Haan, J.F.; Levelt, P.F. Earth surface reflectance climatology from 3 years of OMI data. J. Geophys. Res. 2008, 113, D18308. [Google Scholar] [CrossRef]
  47. Theys, N.E.A. S5P/TROPOMI SO2 ATBD, Tech. Rep. 1.1.0, BIRA. Available online: Ttps://sentinels.copernicus.eu/documents/247904/2476257/Sentinel-5P-ATBD-SO2-TROPOMI (accessed on 27 April 2020).
  48. Ansmann, A.; Tesche, M.; Groß, S.; Freudenthaler, V.; Seifert, P.; Hiebsch, A.; Schmidt, J.; Wandinger, U.; Mattis, I.; Muller, D.; et al. The 16 April 2010 major volcanic ash plume over central Europe: EARLINET lidar and AERONET photometer observations at Leipzig and Munich, Germany. Geophys. Res. Lett. 2010, 37. [Google Scholar] [CrossRef] [Green Version]
  49. Langmann, B.; Folch, A.; Hensch, M.; Matthias, V. Volcanic ash over Europe during the eruption of Eyjafjallajökull on Iceland, April–May 2010. Atmos. Environ. 2012, 48, 1–8. [Google Scholar] [CrossRef]
  50. Matthias, V.; Aulinger, A.; Bieser, J.; Cuesta, J.; Geyer, B.; Langmann, B.; Serikov, I.; Mattis, I.; Minikin, A.; Mona, L.; et al. The ash dispersion over Europe during the Eyjafjallajökull eruption–Comparison of CMAQ simulations to remote sensing and air-borne in-situ observations. Atmos. Environ. 2012, 48, 184–194. [Google Scholar] [CrossRef]
  51. Schumann, U.; Weinzierl, B.; Reitebuch, O.; Schlager, H.; Minikin, A.; Forster, C.; Baumann, R.; Sailer, T.; Graf, K.; Mannstein, H.; et al. Airborne observations of the Eyjafjalla volcano ash cloud over Europe during air space closure in April and May 2010. Atmos. Chem. Phys. 2011, 11, 2245–2279. [Google Scholar] [CrossRef] [Green Version]
Figure 1. Flow chart of SO2 air mass factor (AMF) calculation.
Remotesensing 12 01459 g001
Figure 2. O3 vertical distributions used for the SO2 AMF calculation.
Remotesensing 12 01459 g002
Figure 3. SO2 and aerosol vertical distributions used for the (a) planetary boundary layer (PBL) and (b) volcanic SO2 AMF calculations. The half width is 3 km, and the lower and upper limits for the aerosol height are set to surface level and 10 km, respectively.
Remotesensing 12 01459 g003
Figure 4. Changes in PBL SO2 AMF (a) as a function of the relative azimuth angle (RAA) and viewing zenith angle (VZA) at low and high solar zenith angles (SZA) under the conditions of surface reflectance = 0.05, O3 vertical column density (VCD) = 275 DU, wavelength = 318 nm, and aerosol optical depth (AOD) = 0, and (b) as a function of RAA and AOD at low and high SZA under conditions of surface reflectance = 0.05, O3 VCD = 275 DU, wavelength = 318 nm, and aerosol peak height (APH) = 0 km.
Remotesensing 12 01459 g004
Figure 5. Changes in PBL SO2 AMF (a) as a function of SZA and VZA at low and high AOD, and (b) as a function of SZA and AOD under conditions of VZA = 40°, RAA = 45°, surface reflectance = 0.05, O3 VCD = 275 DU, wavelength = 318 nm, and APH = 0 km.
Remotesensing 12 01459 g005
Figure 6. (a) Changes in PBL SO2 AMF as a function of AOD under various total O3 column densities, and (b) O3 profiles at low and high SZA (VZA = 40°; RAA = 45°; surface reflectance = 0.05; wavelength = 318 nm; APH = 0 km).
Remotesensing 12 01459 g006
Figure 7. (a) Changes in PBL SO2 AMF as a function of AOD for various APH, and (b) simultaneous effects of AOD and APH at low and high SZA (VZA = 40°; RAA = 45°; surface reflectance = 0.05; O3 VCD = 275 DU; wavelength = 318 nm; APH = 0 km).
Remotesensing 12 01459 g007
Figure 8. Changes in PBL SO2 AMF as a function of AOD and surface reflectance at APH = 0 and 2 km under the conditions of (a) SZA = 20° and (b) SZA = 60° (VZA = 40°; RAA = 45°; surface reflectance = 0.05; O3 VCD = 275 DU; wavelength = 318 nm).
Remotesensing 12 01459 g008
Figure 9. Changes in volcanic SO2 AMF as a function of AOD and APH at low and high SZA (VZA = 40°; RAA = 45°; surface reflectance = 0.05; O3 VCD = 275 DU; wavelength = 375 nm; aerosol type = volcanic ash).
Remotesensing 12 01459 g009
Figure 10. Percent difference in PBL SO2 AMF calculated with various AOD, APH, and SZA values and compared with a ‘true’ AMF that is calculated for AOD = 0.27, APH = 1 km, and SZA = 20° and 60° (VZA = 40°; RAA = 0°; surface reflectance = 0.05; O3 VCD = 275 DU; wavelength = 318 nm; aerosol type = sulfate).
Remotesensing 12 01459 g010
Figure 11. Percent difference in PBL SO2 AMF calculated with various AOD, surface reflectance, and APH values compared with a ‘true’ AMF that is calculated for AOD = 0.27, surface reflectance = 0.05, and APH = 0 and 1 km for (a) SZA = 20° and (b) SZA = 60° (VZA = 40°; RAA = 0°; O3 VCD = 275 DU; wavelength = 318 nm; aerosol type = sulfate).
Remotesensing 12 01459 g011
Figure 12. Percent difference in volcanic SO2 AMF calculated with various AOD, APH, and SZA values compared with a ‘true’ AMF that is calculated for AOD = 1.0, APH = 4 km, and SZA = 20° and 60° (VZA = 40°; RAA = 0°; surface reflectance = 0.05; O3 VCD = 275 DU; wavelength = 375 nm; aerosol type = volcanic aerosol).
Remotesensing 12 01459 g012
Table 1. Variables used to calculate the SO2 AMF.
VariableValue
O3 profile (TOMS climatology O3 profile)High latitude, middle latitude, and low latitude
O3 VCD (DU)275, 375, and 475
SZA (°)0.1, 20, 40, 60, and 70
VZA (°)0.1, 20, 40, 60, and 70
RAA (°)0, 45, 90, 135, and 180
Surface Reflectance0.0, 0.05, 0.10, 0.125, and 0.15
PBLAOD0, 0.3, 0.6, 0.9, 1.2, 1.5, and 2.0
Aerosol Peak Height (km)0, 1, 2, and 3
SO2 profileFrom the surface to 1 km (1 km box profile)
VolcanoAOD0.5, 1.0, 1.5, 2.0, 3.0, 4.0, and 5.0
Aerosol Peak Height (km)0, 4, and 8
SO2 profile9–10 km (1 km box profile)
Table 2. AOD and surface reflectance uncertainty.
Input DataUncertaintyReference
MODIS AOD (MYD04)± (0.05 + 0.15 × AOD)Chu et al. [43]
MODIS Surface reflectance (MYD09)± (0.005 + 0.05 × surface reflectance)EOS Land Validation: https://landval.gsfc.nasa.gov
Aerosol height± 1 km (expected error)Fishman et al. [42]
Table 3. Variables and values used in calculating the PBL SO2 AMF error budget related to uncertainties in the APH, AOD, and surface reflectance based on the TROPOMI measurements.
VariableValue
SZA (°)10, 30, 50, and 70
VZA (°)10, 30, 50, and 70
RAA (°)0.0, 45.0, 90.0, 135.0, and 180.0
surface reflectance0.05, 0.10, 0.15, and 0.20
aerosol optical depthInterval A: 0.2, 0.4, 0.6, 0.8, and 1.0
Interval B: 1.2, 1.4, 1.6, 1.8, and 2.0
aerosol peak height [km]0, 1, and 2
O3 profile (TOMS climatology O3 profile)Middle latitude
O3 VCD (DU)275 DU
PBL SO2 profileFrom the surface to 1 km (1 km box profile)
Table 4. Summary of PBL SO2 AMF errors caused by uncertainties in APH, AOD, and surface reflectance based on the TROPOMI measurements.
0.2 ≤ AOD < 1.0 1.0 ≤ AOD < 2.0
APH = 0 kmSO2 AMF percentage error (%)SO2 AMF percentage error (%)
AOD3.8%4.2%
Surface reflectance6.4%2.8%
APH49.3%77.3%
Total error49.9%77.5%
APH = 1.0 kmSO2 AMF percentage error (%)SO2 AMF percentage error (%)
AOD9.1%21.0%
Surface reflectance12.5%9.1%
APH70.5%171.9%
Total error72.1%173.4%
APH = 2.0 kmSO2 AMF percentage error (%)SO2 AMF percentage error (%)
AOD19.1%42.2%
Surface reflectance19.4%20.2%
APH37.1%110.8%
Total error46.0%120.2%

