Article

Analysis of the Occurrence Frequency of Seedable Clouds on the Korean Peninsula for Precipitation Enhancement Experiments

1
Convergence Meteorological Research Department, National Institute of Meteorological Sciences, Seogwipo, Jeju 63568, Korea
2
Planning and Finance Division, National Institute of Meteorological Sciences, Seogwipo, Jeju 63568, Korea
*
Author to whom correspondence should be addressed.
Remote Sens. 2020, 12(9), 1487; https://doi.org/10.3390/rs12091487
Submission received: 25 March 2020 / Revised: 1 May 2020 / Accepted: 5 May 2020 / Published: 7 May 2020
(This article belongs to the Section Atmospheric Remote Sensing)

Abstract

:
Our study analyzed the occurrence frequency and distribution of seedable clouds around the Korean Peninsula in order to better secure water resources. Cloud products from the Communication, Ocean, and Meteorological Satellite (COMS), including cloud fraction, cloud top height, cloud top temperature, cloud phase, cloud top pressure, cloud optical thickness, and rainfall intensity, were used. Daytime hourly data between 0900 and 1800 local standard time (LST) observed from December 2016 to November 2019 was used. Seedable clouds occurring within this period were evaluated based on seasonal cloud phases, occurrence frequency, and cloud characteristics according to land, sea, and cloud type. These clouds exhibited varying average occurrence frequencies in different seasons. Sc (stratocumulus) clouds exhibited the highest occurrence frequency for all seasons, with an average of 63%, followed by Cu (cumulus) at 15%, As (altostratus) at 13%, and Ac (altocumulus) at 6%. We determined that low-level clouds primarily occurred around the Korean Peninsula, and the occurrence frequency of stratiform clouds was highest for water phase seedable clouds, while the occurrence frequency of cumuliform clouds was highest for ice phase seedable clouds. We believe that precipitation enhancement experiments could be suitable for western and eastern seas around the Korean Peninsula as well as for mountainous regions on land.

Graphical Abstract

1. Introduction

The rise in the temperature of the earth surface and its atmosphere owing to global warming is causing climate change worldwide. Additionally, these factors are contributing to meteorological disasters such as heavy rain, floods, heatwaves, and droughts [1,2]. In particular, droughts are more widespread than other meteorological disasters and have the potential to cause human and physical damage over long periods. Fluctuations in water resources are also increasing due to climate change [3]. Droughts in South Korea typically begin in the summer and last until the winter of the same year or the summer of the following year in the case of severe droughts [4]. Because droughts are inversely related to precipitation, an increase in precipitation can help alleviate droughts. Two-thirds of annual precipitation in summer leads to difficulties in securing water resources in South Korea [5,6,7]. Regional precipitation also varies greatly depending on the season and type of precipitation [8]. Therefore, it is essential to develop alternative water resources and measures for securing water resources in the Korean Peninsula.
The rapid urbanization and industrialization of South Korea have continuously increased water demand, leading to rising concerns about future water resources. Dam construction can be the most effective measure for securing water resources, but can also lead to environmental issues, such as alterations to the surrounding terrain and environment and the destruction of ecosystems in submerged areas. Additionally, it can cause economic problems. A variety of alternative water resources are available, including groundwater, riverside filtered water, desalination, deep ocean water, and precipitation enhancement experiments. Currently, researchers are considering precipitation enhancement experiments as the preferable measure to minimize environmental problems and secure water resources at a relatively low cost [9,10]. A precipitation enhancement experiment involves implementing artificial microphysical processes in clouds with low precipitation probability or low precipitation efficiency to induce precipitation [11]. Precipitation enhancement experiments are usually conducted by aircraft but can also be performed on the ground. Weather modification experiments for precipitation enhancement are being developed and put to practical use worldwide, and they have shown numerous economic benefits [12,13,14]. The United States, China, Thailand, and Australia have conducted long-term precipitation enhancement experiments using aircraft. Researchers from these countries have reported statistical annual increases in precipitation in these experiments [15,16,17,18,19]. In South Korea, precipitation enhancement experiments have promised high economic savings, including an annual KRW 22,500 million from forest fire prevention, KRW 28,500 million from a reduction in drought damage, and KRW 350 million from securing water resources in dam watershed areas [20].
The Korea Meteorological Administration (KMA) first conducted precipitation enhancement experiments for weather modification in 1963. This was subsequently discontinued due to budgetary constraints before being restarted in 1995 due to severe droughts. Prior to the introduction of the KMA/NIMS (National Institute of Meteorological Sciences) Atmospheric Research Aircraft (NARA) in November 2017, 53 precipitation enhancement experiments had been conducted using civilian aircraft from 1995 to 2017. Subsequently, 12 experiments were conducted in 2018 and 15 were conducted in 2019. The NARA is a Beechcraft King Air 350HW that can carries a total of five researchers, including the pilot, and can fly for approximately 7 hours to an altitude of 10 km. It is equipped with atmospheric/cloud observation devices such as a CCN-200 (cloud condensation nuclei counter), CCP (cloud combination probe), PIP (precipitation imaging probe), and Sky-OPC (optical particle counter). This aircraft performs atmospheric observation for weather modification and analysis of climate change and weather phenomena [7,21]. Precipitation enhancement experiments for weather modification have gradually increased in number due to the growing need for research on dam watershed water resources, forest fire prevention, fog dissipation, and fine dust reduction [3,7,22].
To verify and analyze precipitation enhancement experiments, studies have been performed using numerical simulations [23,24] and ground/space observational data (radar, lidar, and satellite) [25,26,27]. Satellite data is very useful because it enables the continuous monitoring of large areas. Koshida et al. [28] and Morrison et al. [29] used satellite data to analyze cloud occurrence and characteristics. It is important to thoroughly review locations for conducting precipitation enhancement experiments and to determine whether clouds suitable for seeding occur. Therefore, our study analyzed the occurrence frequency and distribution of seedable clouds to be able to conduct better precipitation enhancement in weather modification experiments using atmospheric aircraft in South Korea. The occurrence frequency of seedable clouds is a research topic recommended by the World Meteorological Organization (WMO) climate change guidelines [30]. Consequently, a principal task for weather and climate change researchers is to investigate the distribution and characteristics of clouds. This research can be utilized by future studies, such as relieving drought and preventing forest fires, in addition to helping secure future water resources.

2. Materials and Methods

The cloud products of the geostationary satellite Communication, Ocean, and Meteorological Satellite (COMS) were used to analyze the occurrence frequency and characteristics of seedable clouds around the Korean Peninsula [31]. COMS, located at 0° N and 128.2° E, observes the Korean Peninsula area at a spatial resolution of 4 km × 4 km every 15 min. Unlike polar-orbiting satellites or ground observation equipment, the cloud products of geostationary satellites are appropriate for analyzing the characteristics of clouds generated around the Korean Peninsula because they can continuously observe clouds over a wide area [32,33]. The data used for analysis consisted of cloud fraction (CF), cloud top height (CTH), cloud top temperature (CTP), cloud phase, cloud top pressure (CTP), cloud optical thickness (COT), and rainfall intensity (RI) information collected from hourly data between 0900 and 1800 LST observed from December 2016 to November 2019. It is dangerous to conduct precipitation enhancement experiments at night because atmospheric aircraft needs to fly around the top and bottom of clouds. Therefore, most experiments were conducted in the daytime when a safe field of view was ensured.
To detect seedable clouds using satellite data, clouds were classified using the algorithm shown in Figure 1. For satellite data, the grid data around a reference grid of an area of 5 × 5 grids was averaged. This was necessary because the data characteristics may not be continuous due to the grid data calculated by each grid of satellite data. Seedable clouds were defined as having a CF exceeding 80%, a CTH within 1–4 km, and a RI below 5 mm/h [28]. The CF represents the percentage of the clouds detected within 7 × 7 grids around the reference grid [34]. Since the uncertainty of cloud detection increased as CF decreased toward the edge of the cloud [35], sufficient CF, i.e., exceeding 80%, was defined as a condition in this study. Additionally, for a cloud to be used for seeding, it must have a suitable CTH and little or no natural precipitation. The minimum and maximum CTH were set using the minimum and maximum CTH and combustion rate of flares specified by experiments conducted by Cha et al. [21] and NIMS [36]. Because of the nature of passive sensors in geostationary satellites, low-level atmospheric information of clouds observed by the satellite cannot be determined. As a result, lower-level clouds with a top height exceeding 4 km were not detected.
In precipitation enhancement experiments using atmospheric aircraft, the seeding material serves as an artificial cloud seed, which might help to develop the cloud while causing rainfall (snowfall). The precipitation development process varies with temperature. Therefore, the seeding materials for cold and warm clouds are different [37,38]. For cold clouds, dry ice or silver iodide (AgI), which serves as the nucleus of ice, are seeded to cause snowfall or rainfall. In warm clouds, hygroscopic calcium chloride (CaCl2) or sodium chloride (NaCl) are seeded to cause rainfall [39,40,41]. The seedable clouds can be classified as ice or water phase clouds based on satellite images [31]. If a mixed phase is observed, it is classified as an ice-cloud phase if the CTT is below −5 °C, whereas it is classified as a water-cloud phase if the CTT is −5 °C or higher [25]. The occurrence frequency of seedable clouds can then be analyzed accordingly [28]. Clouds that could not be classified or did not correspond to the weather conditions presented in this study were excluded from the analysis. In addition, the occurrence frequency of seedable clouds occurred on land and sea and occurrence frequency according to cloud types were analyzed. Cloud types were classified using CTP and the COT calculated from COMS according to the method specified by the International Satellite Cloud Climatology Project (ISCCP) [42]. Using this method, cloud types were classified according to height (low-level: 1000–680 hPa, mid-level: 680–440 hPa, high-level: 440–50 hPa) and optical thickness (thin: 0–3.6, middle: 3.6–23, thick: 23–379).
In this study, the COMS cloud products used for the determination of seedable clouds with uncertainties were calculated as follows: Cloud detection using infrared channel brightness temperature (BT) was estimated using the split window and threshold methods, and the probability of detection (POD) was found to be above 88% compared with moderate resolution imaging spectroradiometer (MODIS) data [43]. POD is the rate at which clouds are detected as clouds or clear sky (Ncloud/(Ncloud + Nclear) × 100(%)). The cloud phase was estimated via the threshold method using the infrared channel BT of water vapor, which showed an average POD of 80% based on the MODIS cloud phase [44]. Additionally, in accordance with the reflectivity of the 0.6-µm channel, the COT was calculated using a simulated look-up table method depending on the different atmospheric conditions. The root mean square errors (RMSE), obtained on the basis of MODIS COT, were about 3 and 5 in the water and ice phases, respectively [45]. For optically thick clouds (COT > 10), CTT and CTP were estimated using BT10.8, whereas for optically thin clouds, they were estimated using ratio of BT10.8 and BT6.7. The uncertainty of CTT and CTP was 3 K and 50 hPa, respectively [31,46]. Based on regression method using the infrared channel BT, RI was calculated, and in accordance with SSM/I, it showed RMSE below 1 mm/h [47]. The abovementioned verification values also included artificial errors resulting from the matching of the spatiotemporal resolution of COMS and MODIS data for verification [48,49,50]. Because of the nature of passive sensors in geostationary satellites, low-level atmospheric information of clouds observed by the satellite cannot be determined. As a result, lower-level clouds with a top height exceeding 4 km were not detected. Joiner et al. [51] conducted a multilayer cloud detection study using MODIS data. They found that on an average, mid-latitudes generated about 11% of multilayered clouds, and that the occurrence frequency of multilayered clouds on land was higher than that on the sea, i.e., 12% and 10%, respectively. Therefore, in this study, the occurrence frequency of seedable clouds was analyzed by detecting clouds with limited height. However, it can be assumed that, in practice, the occurrence frequency of seedable clouds is higher or similar than the occurrence frequency observed in this study even given the uncertainty shown above. Additionally, the average CTH of seedable clouds detected under limited CTH (~4 km) may be lower than seedable clouds detected under unlimited CTH. Similarly, CTT may be higher.

3. Results

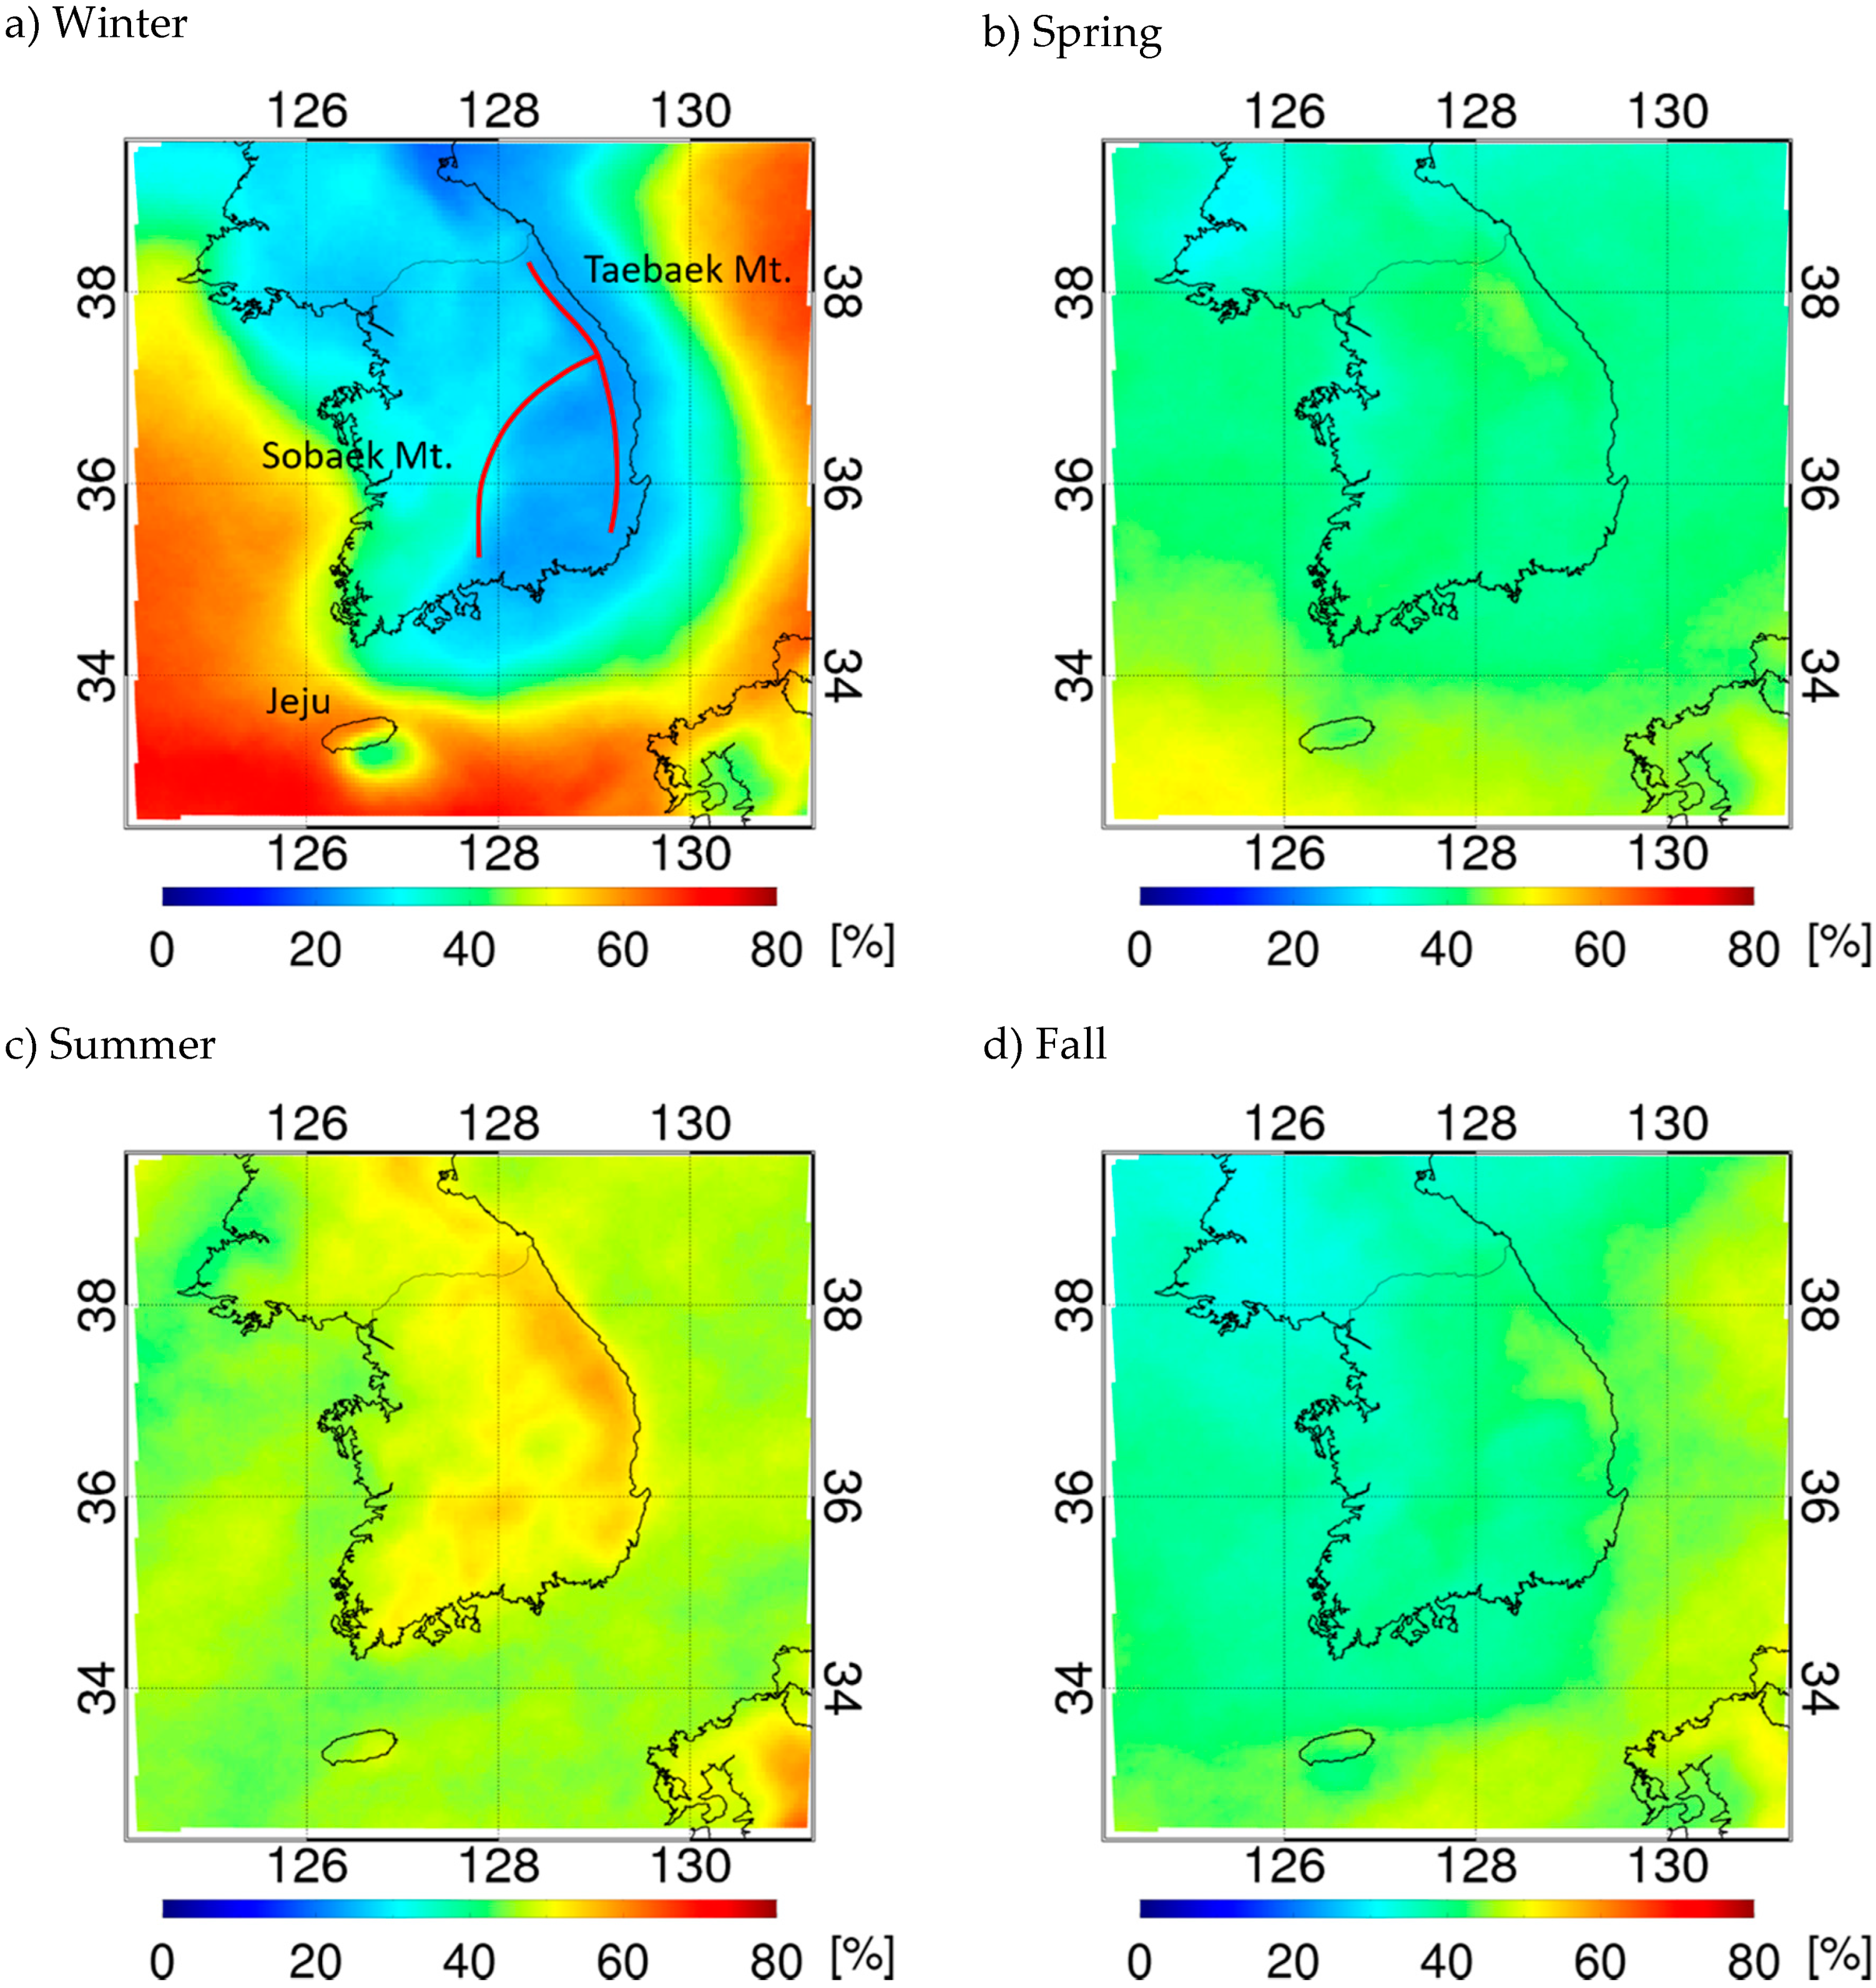
Figure 2 shows the frequency distribution of the seasonal occurrence of clouds with a cloud fraction exceeding 80% during the time period specified by our study. The seasonal samples of data for each grid are average 2618 (winter), 2697 (spring), 2730 (summer), and 2687 (fall), respectively. The occurrence frequency of clouds around the Korean Peninsula in winter was approximately 49% on sea and 31% on land. The occurrence frequency of clouds was approximately 6% higher during this season than others due to the development of cumulus column clouds in the warm and humid atmosphere caused by warm current. This excluded the downwind regions on the Korean Peninsula located in the westerly wind zone (East Coast, South Coast, and Jeju Island) [23,52]. The occurrence frequency of clouds on land was approximately 8% higher than in other regions due to the development of orographic clouds near the Taebaek and Sobaek Mountains (Figure 2a), which are located at an altitude of 500 m to 1000 m and sometimes higher [8]. Jeju Island is surrounded by the sea, and the occurrence frequency of clouds is therefore approximately 28%. This is about 17% higher than other land areas due to the inflow of clouds generated at sea [53]. There was no substantial difference between land and sea cloud occurrence frequency in all seasons except winter. Summer exhibited the highest occurrence frequency of clouds at approximately 47%, with frequencies of at least 60% around the Taebaek and Sobaek Mountains. Overall, winter exhibited cloud fractions exceeding 80% with a high occurrence frequency, and the difference in frequency between land and sea was found to be large. Therefore, the frequency distribution of clouds differs according to the season, land, sea, and topographical characteristics around the Korean Peninsula [54]. However, not all distributed clouds have the characteristics necessary for precipitation enhancement.
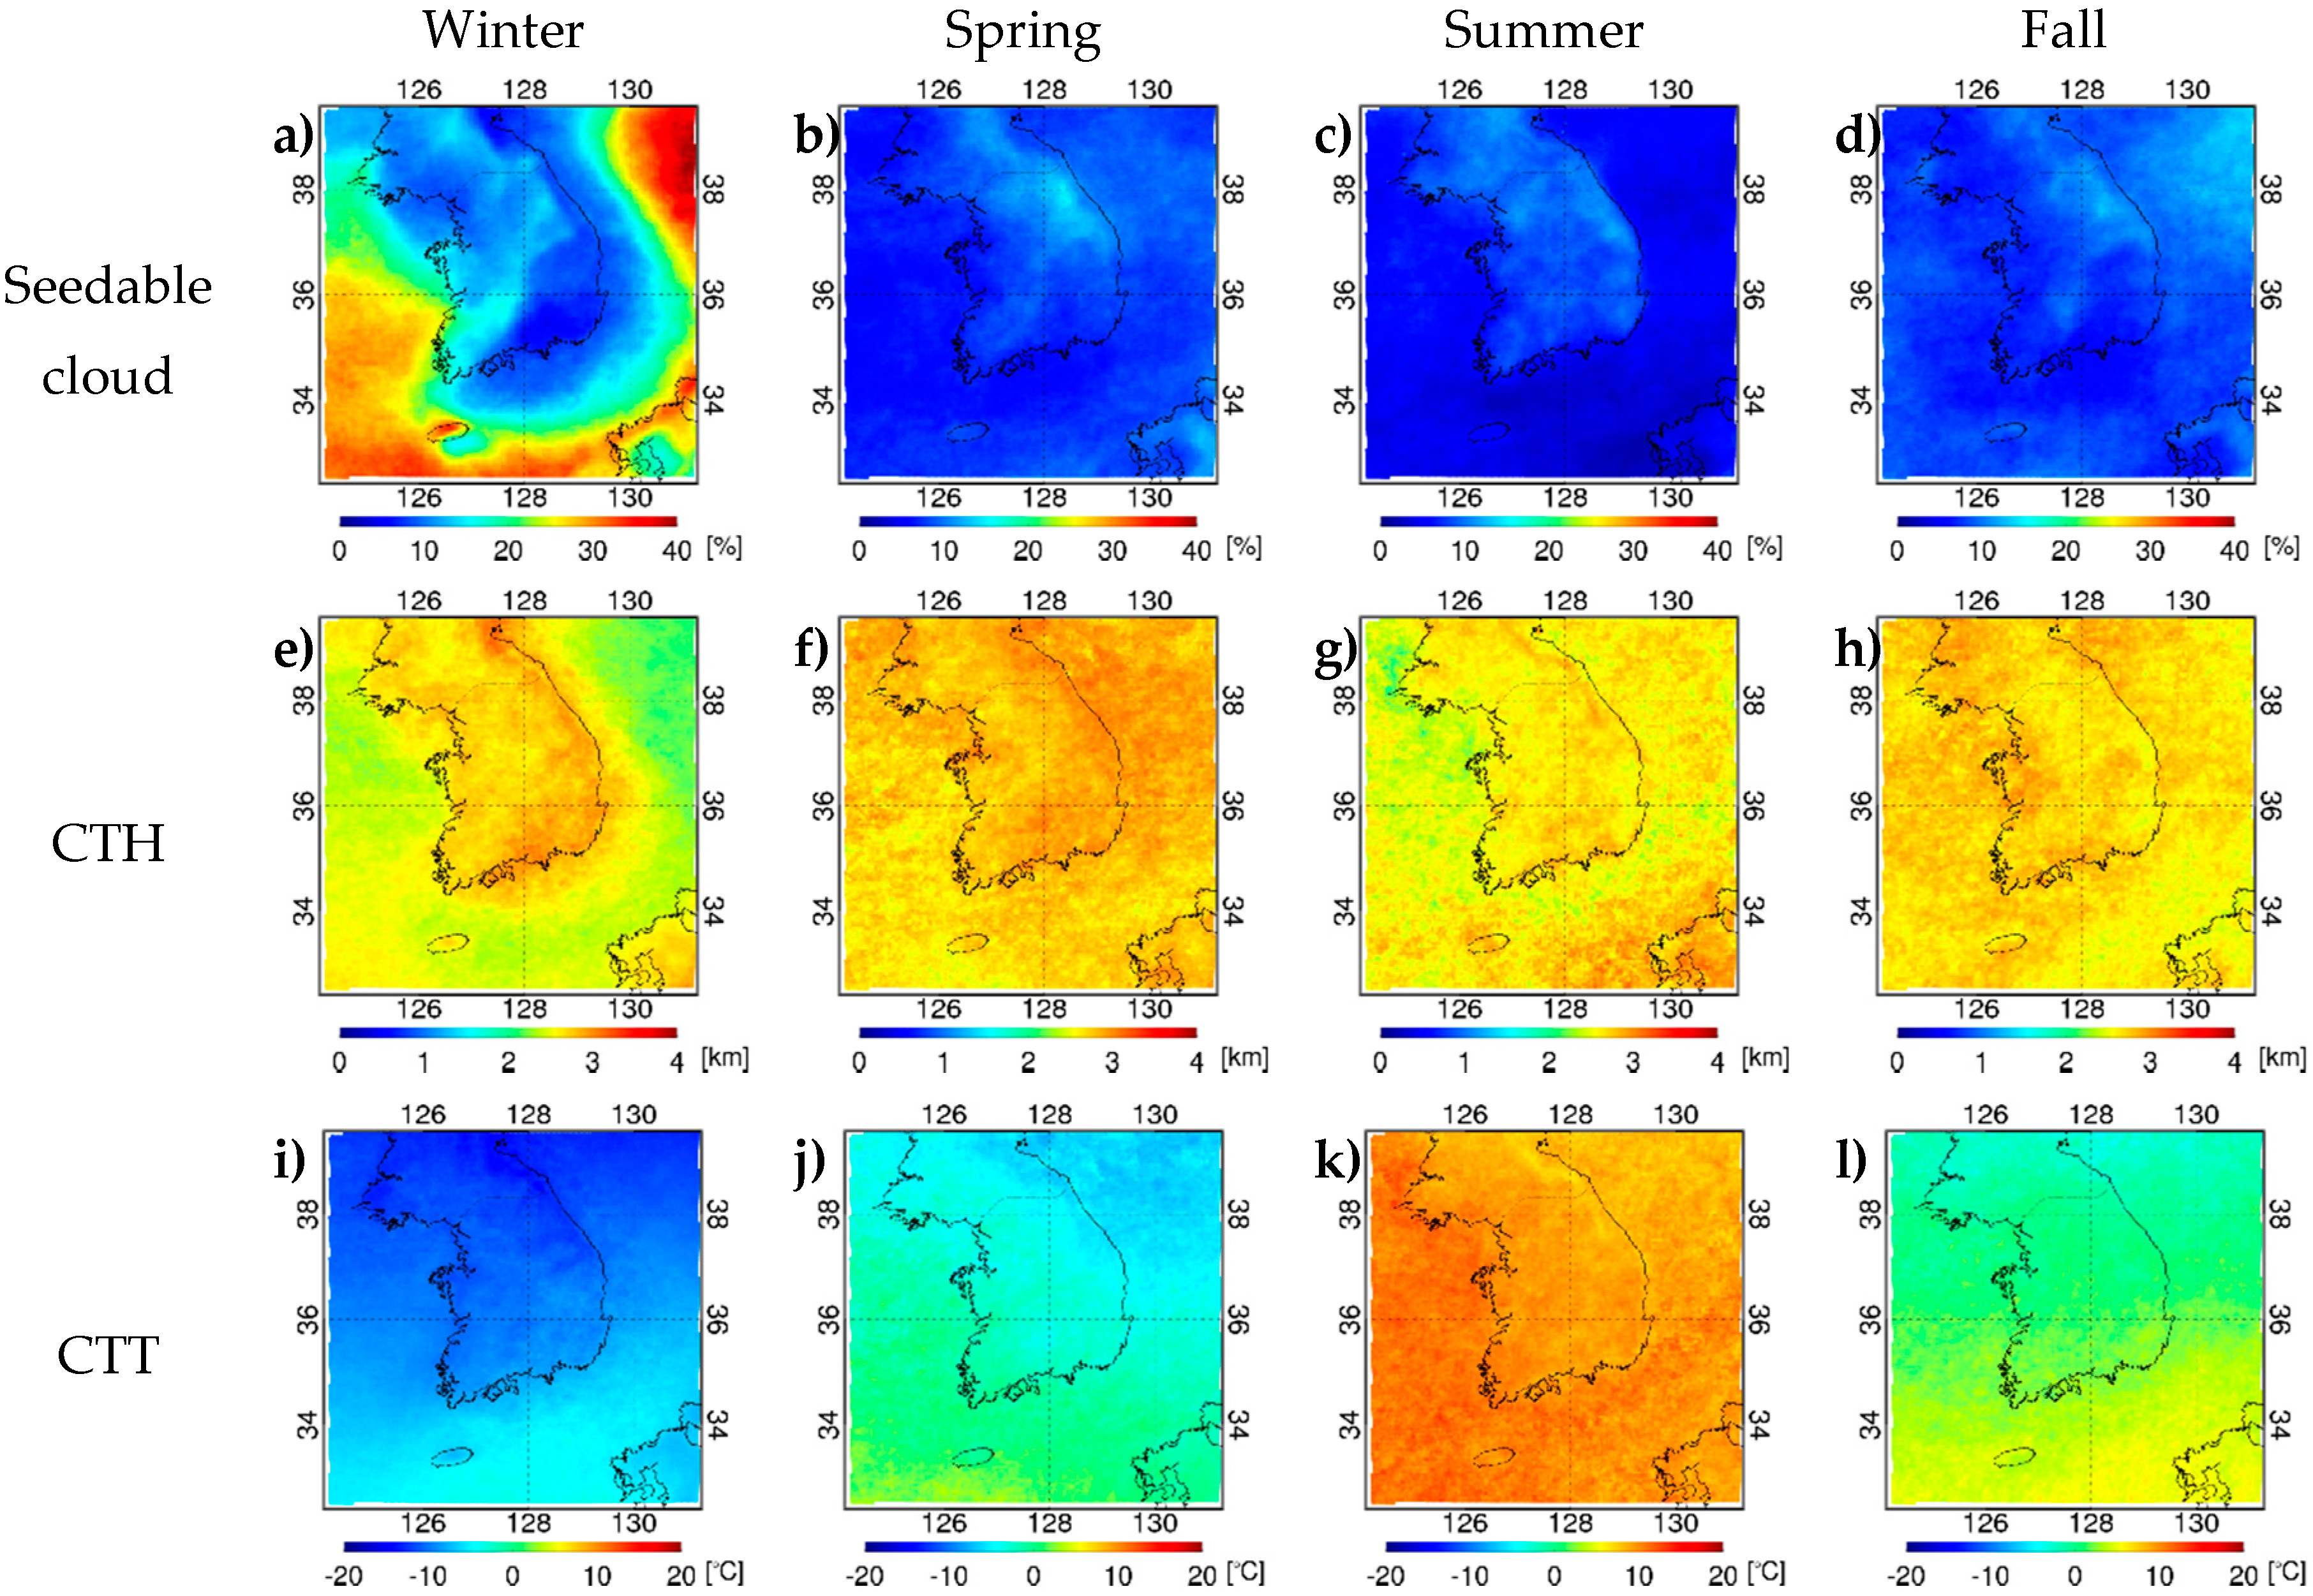
Figure 3 shows the distribution of CTT, CTH, and occurrence frequency of seedable clouds (both water and ice cloud phases) generated around the Korean Peninsula. As shown in Figure 2, the occurrence frequency of seedable clouds was high in regions with a high frequency of cloud occurrence. Approximately 42% of the occurrence frequency of clouds corresponded to seedable clouds; the average occurrence in seasons other than winter was approximately 17%. Winter had the highest occurrence frequency of seedable clouds at approximately 13% on land and 21% on sea (overall average of 18%). Seedable clouds on land had an average CTH of approximately 2.73 km, which was 0.30 km higher than average sea CTH. The distribution of CTT varied with the latitude, and was approximately 2 K lower on land, at an average of −10.30 °C. The average occurrence frequency of seedable clouds around the Korean Peninsula in the spring and fall was approximately 8%. However, the frequency distribution of these clouds was 10% to 15% around the Taebaek/Sobaek Mountains and Jeju Island, respectively. The summer season exhibited the lowest occurrence frequency of seedable clouds at approximately 6% and also showed a low frequency on land at an average of 8%. The average CTH in summer was 2.61 km, which is similar to other seasons. However, the CTT in summer was the highest of all seasons at 9.79 °C. Table 1 shows the occurrence frequency and characteristics of seedable clouds according to season and cloud type.
Table 1 shows the characteristics of seedable clouds, including land and sea regions within a radius of 150 km from the Korean Peninsula. This is assumed to be the maximum distance that the effect of seeding (rainfall or snowfall) can occur on the ground when precipitation enhancement experiments are conducted on seedable clouds [24]. Sc (stratocumulus), a low-level cloud, displayed the highest frequency for all seasons with an average of 63%, followed by Cu (cumulus) at 15%, As (altostratus), a mid-level cloud, at 13%, and Ac (altocumulus) at 6%. In particular, Sc clouds showed a very high frequency in the summer at approximately 70% of seedable clouds, while As displayed an approximately 4% higher frequency in winter and spring. High-level clouds, including Ci, Cs, and Cb, were not observed when classifying seedable clouds according to the conditions proposed in this study. Thus, seedable clouds occurring around the Korean Peninsula showed a characteristically higher frequency in stratiform than other cloud types. The average CTH of low-level clouds was 2.42 km, and the average CTT was 1.15 °C. Mid-level clouds exhibited top height and temperature averages of 3.27 km and −1.80 °C, respectively. St (stratus) and Ns (nimbostratus) clouds had a very low occurrence frequency in the ISCCP cloud classification due to the low frequency of cases in which the COT calculated from COMS exceeded 23. Hence, it is difficult to represent the cloud characteristics of cloud types when the seedable cloud occurrence frequency is less than 1%.
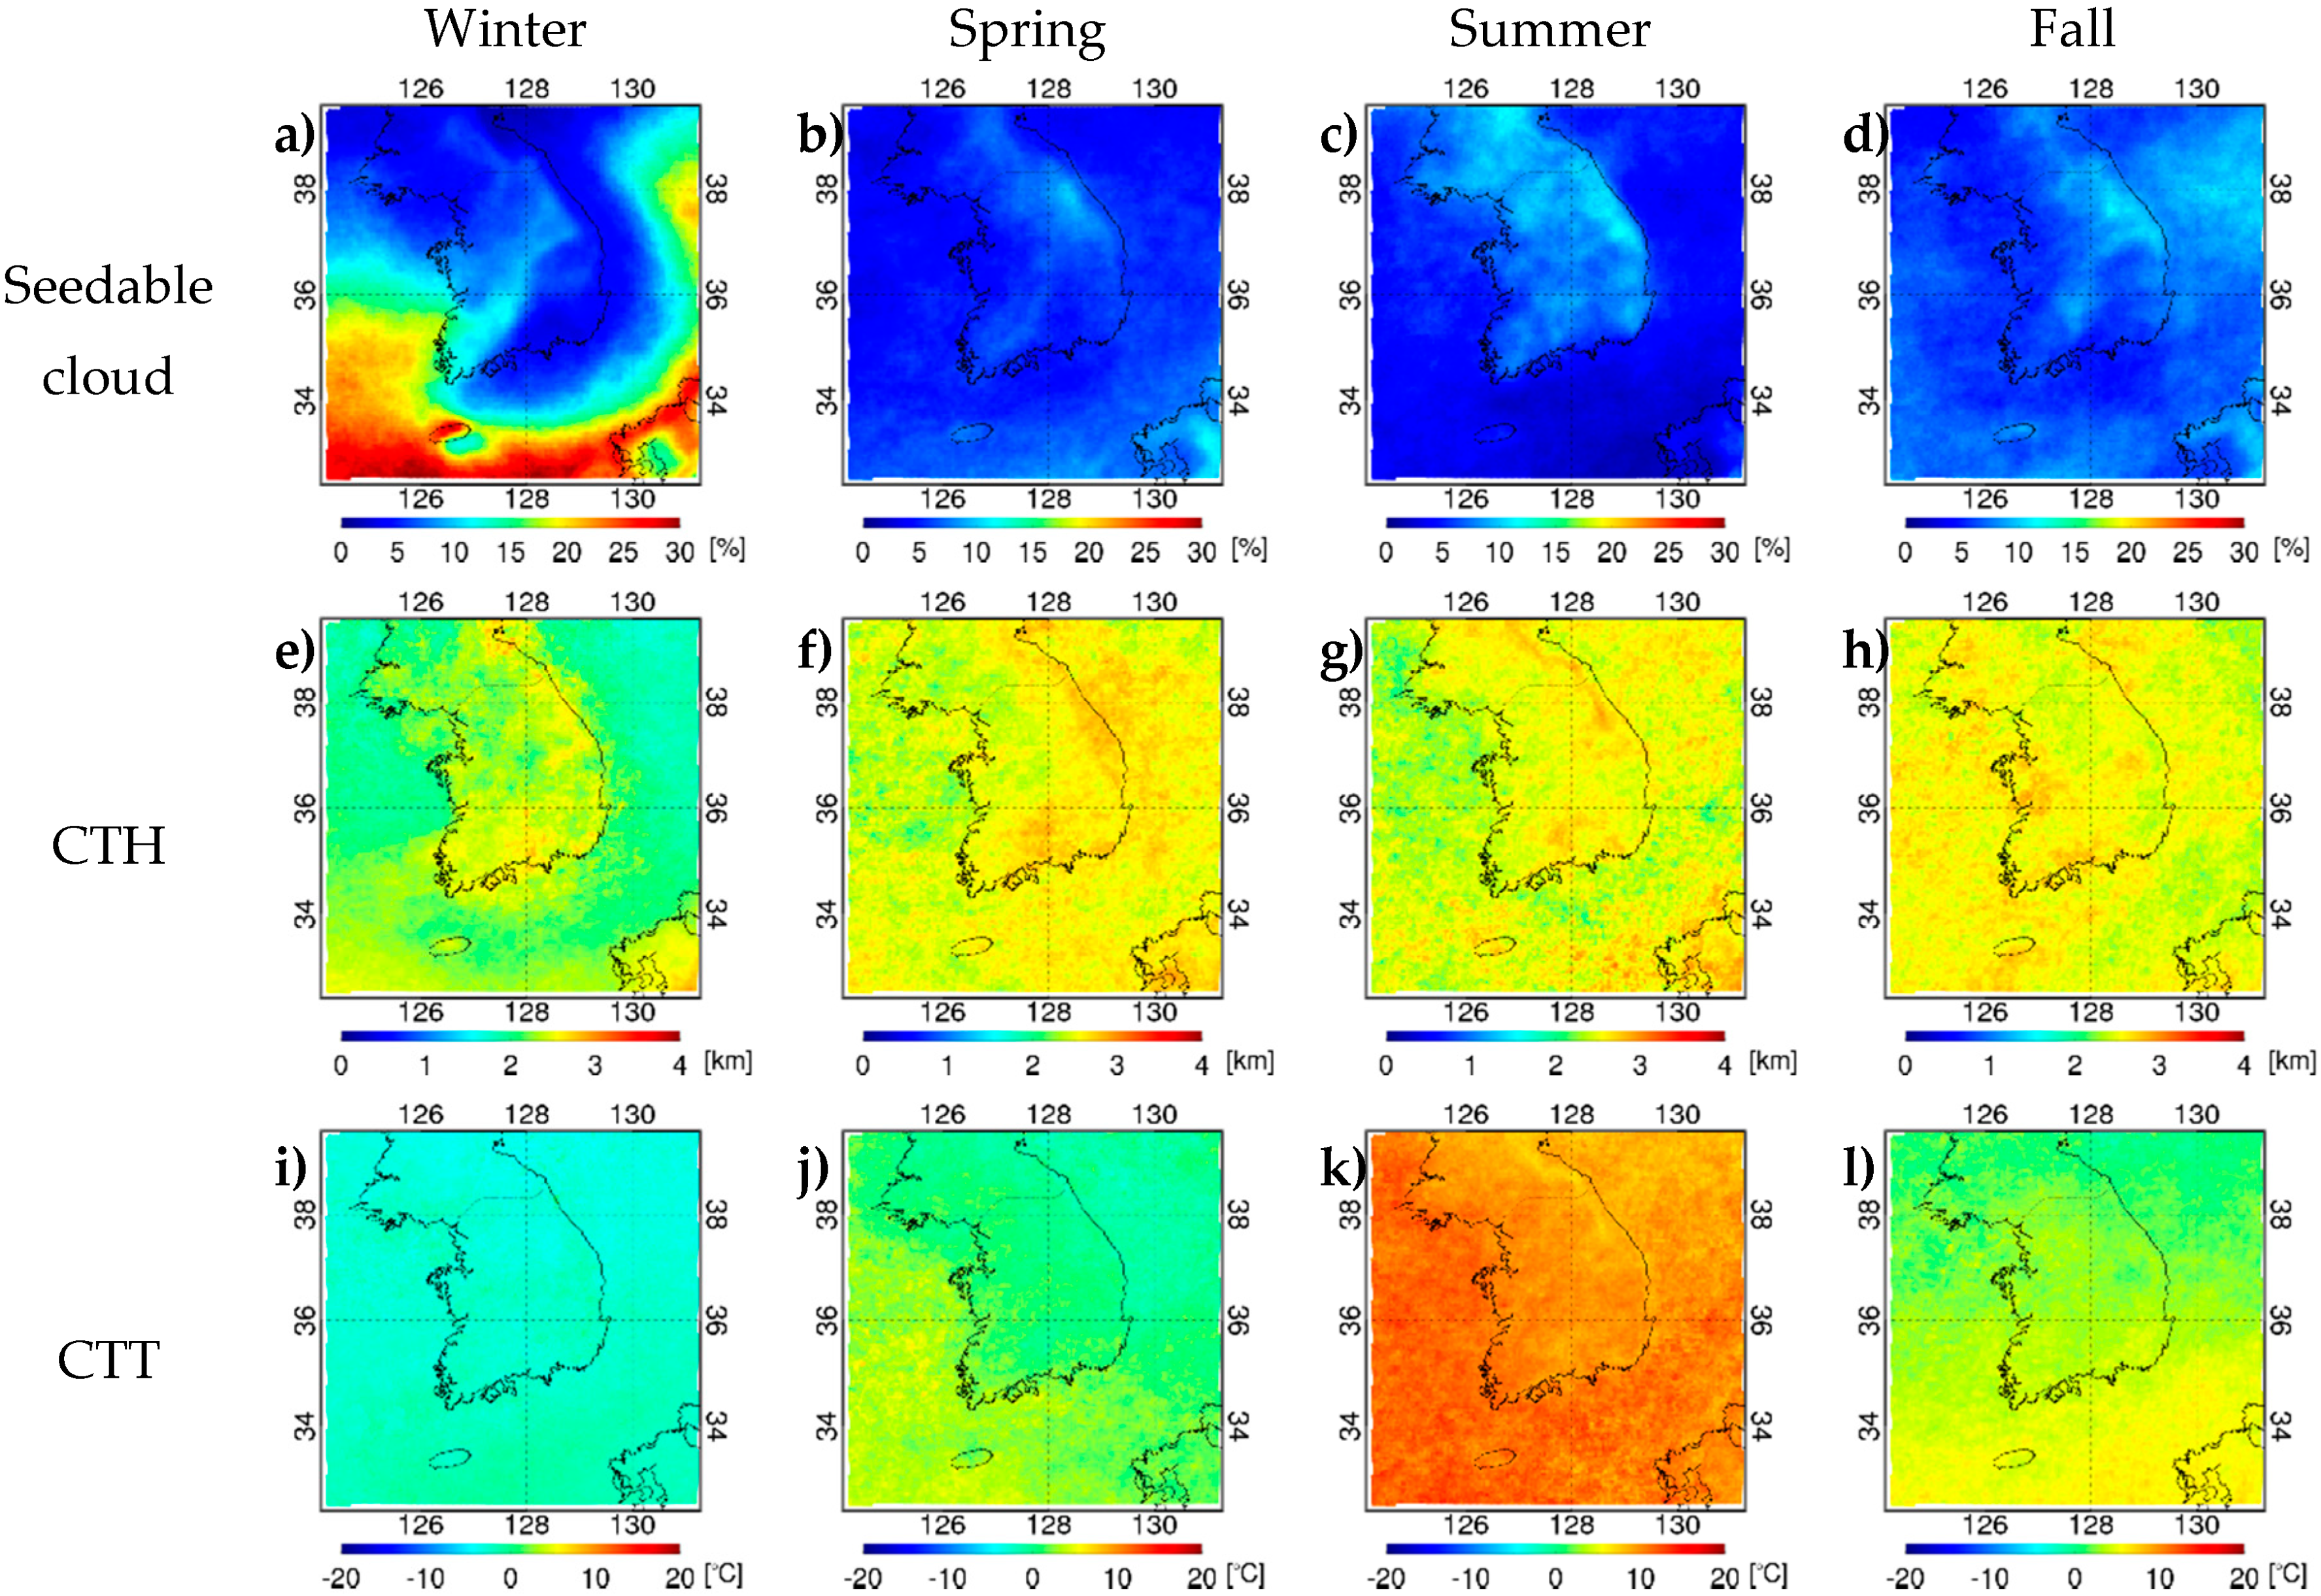
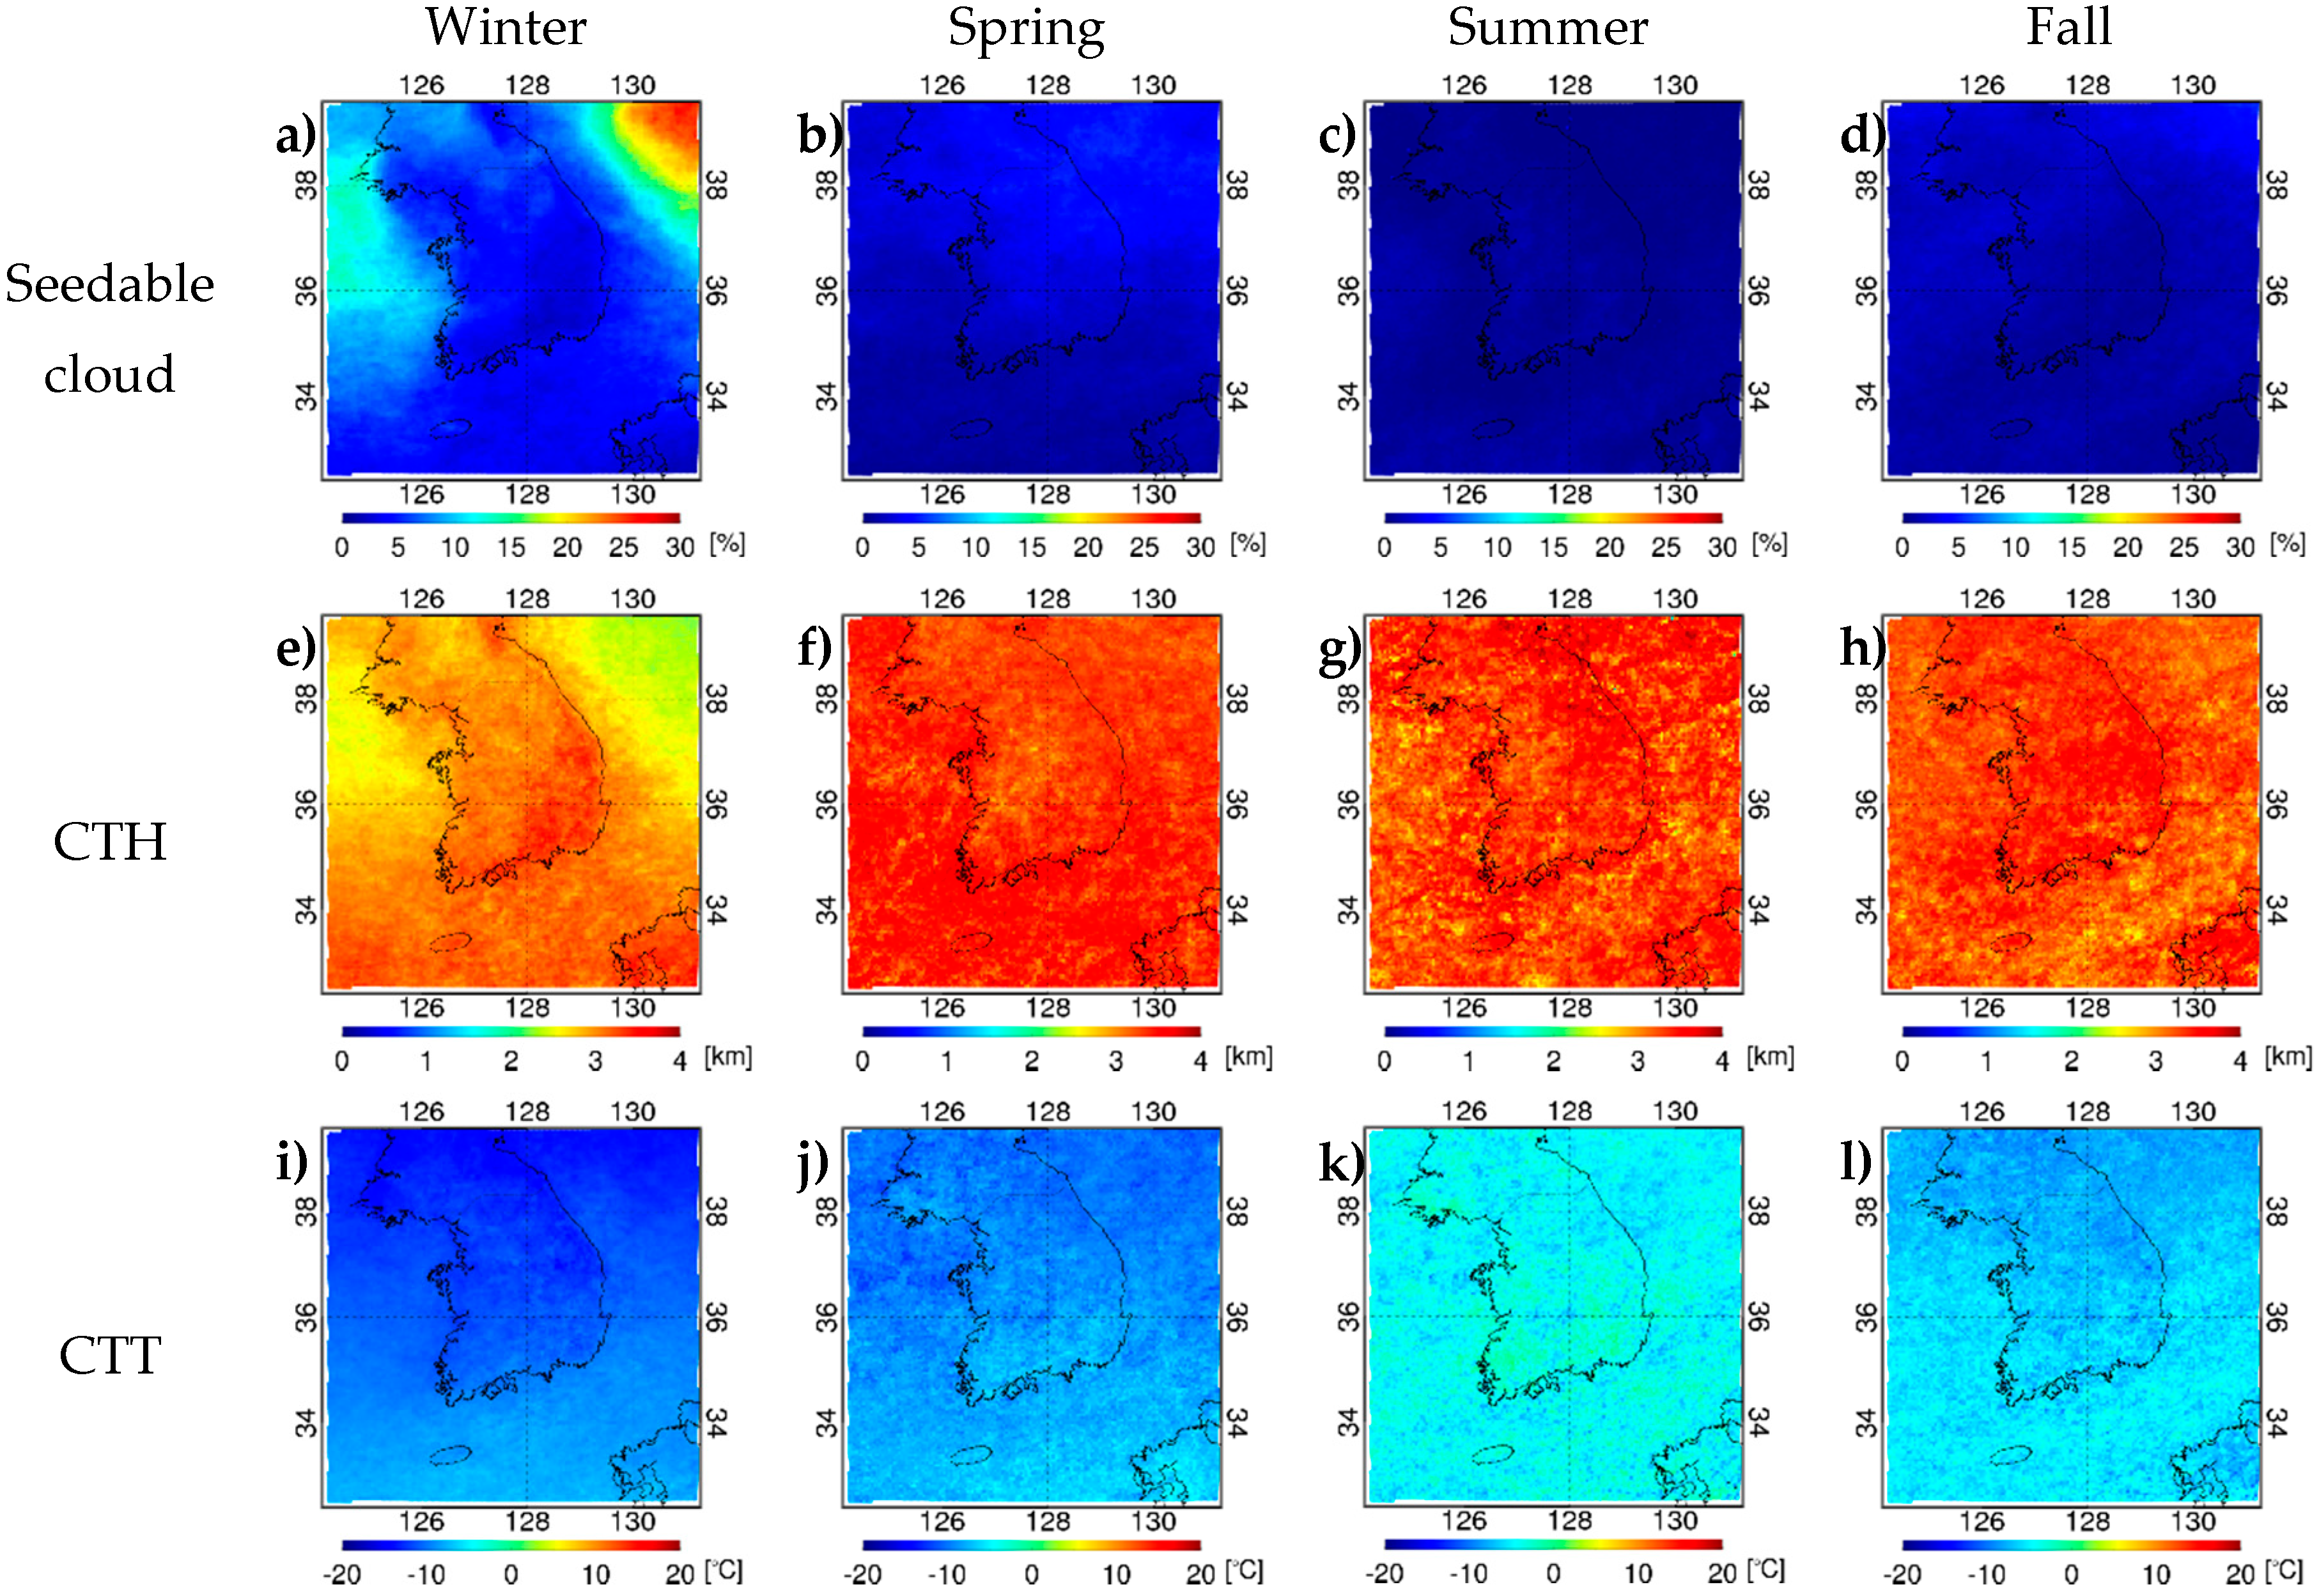
Figure 4 and Figure 5 show cloud frequency based on the water and ice cloud phases. Water phase seedable clouds displayed a frequency distribution of at least 20% on the southern coast during winter and at least 15% on the central western coast and sea distant from the eastern coast. Liquid phase seedable clouds showed higher frequencies on land than sea during nonwinter seasons, with a frequency of approximately 8% on the Korean Peninsula in the summer. Ice phase seedable clouds had frequencies of 10%–25% in the northern East Sea and West Sea in the winter and an average frequency of 2% in other seasons. In the summer, the occurrence frequency of the ice cloud phase or mixed-phase clouds with a CTT below −5 °C within an altitude suitable for precipitation enhancement experiments was very low, at less than 1%. The average CTH of the low-level clouds was 3.33 km, and the average CTT was −5.64 °C. In all seasons, the average CTH for the ice cloud phase was 3.24 km, which was 0.81 km higher than water phase seedable clouds. The average temperature was 11.52 K lower at −8.41 °C. Winter clouds with an average CTH of 2.20 km that were located below 36° N exhibited a maximum frequency of approximately 31%, and clouds with an average CTH of 2.48 km occurring on land in the summer showed a maximum frequency of approximately 13%. Excluding clouds on land in the winter, the seasonal changes in ice phase seedable clouds had relatively similar characteristics on land (average of 5% in winter and 1% in summer).
Table 2 shows the occurrence frequency and characteristics of seedable clouds by cloud type (Table 1) from Figure 4 and Figure 5. Low-level Sc clouds had the highest frequency among water phase seedable clouds in all seasons at approximately 72%. The mid-level As cloud was determined to have a frequency of 13% in all seasons. Low-level Cu clouds exhibited the highest frequency among ice phase seedable clouds at approximately 30%, while Ac mid-level clouds had a frequency of 27%. In summer, Sc clouds had the highest occurrence frequency for water phase seedable clouds at approximately 76%, and Cu and Ac clouds had the highest occurrence frequencies for ice phase seedable clouds at approximately 39% and 35%, respectively. Overall, the occurrence frequency of stratiform clouds was highest for water phase seedable clouds, while the occurrence frequency of cumuliform clouds was highest for ice phase seedable clouds. In addition, the low-level Sc cloud was determined to have a 7% higher average frequency on land than sea (67% vs. 60%, respectively), while Cu clouds had an average frequency that was 6% higher on sea than land (18% vs. 12%, respectively). Mid-level Ac and As clouds exhibited similar frequencies of approximately 7% and 14%, respectively, on both land and sea. The CTH of low-level clouds on land was 0.13 km higher than at sea (2.51 km), and the CTT was 1.75 °C lower than the temperature at sea (−0.14 °C). The CTH of mid-level clouds on land was 0.08 km lower than it was on sea (3.25 km), and the CTT was 1.91 °C lower than at sea (2.58 °C).
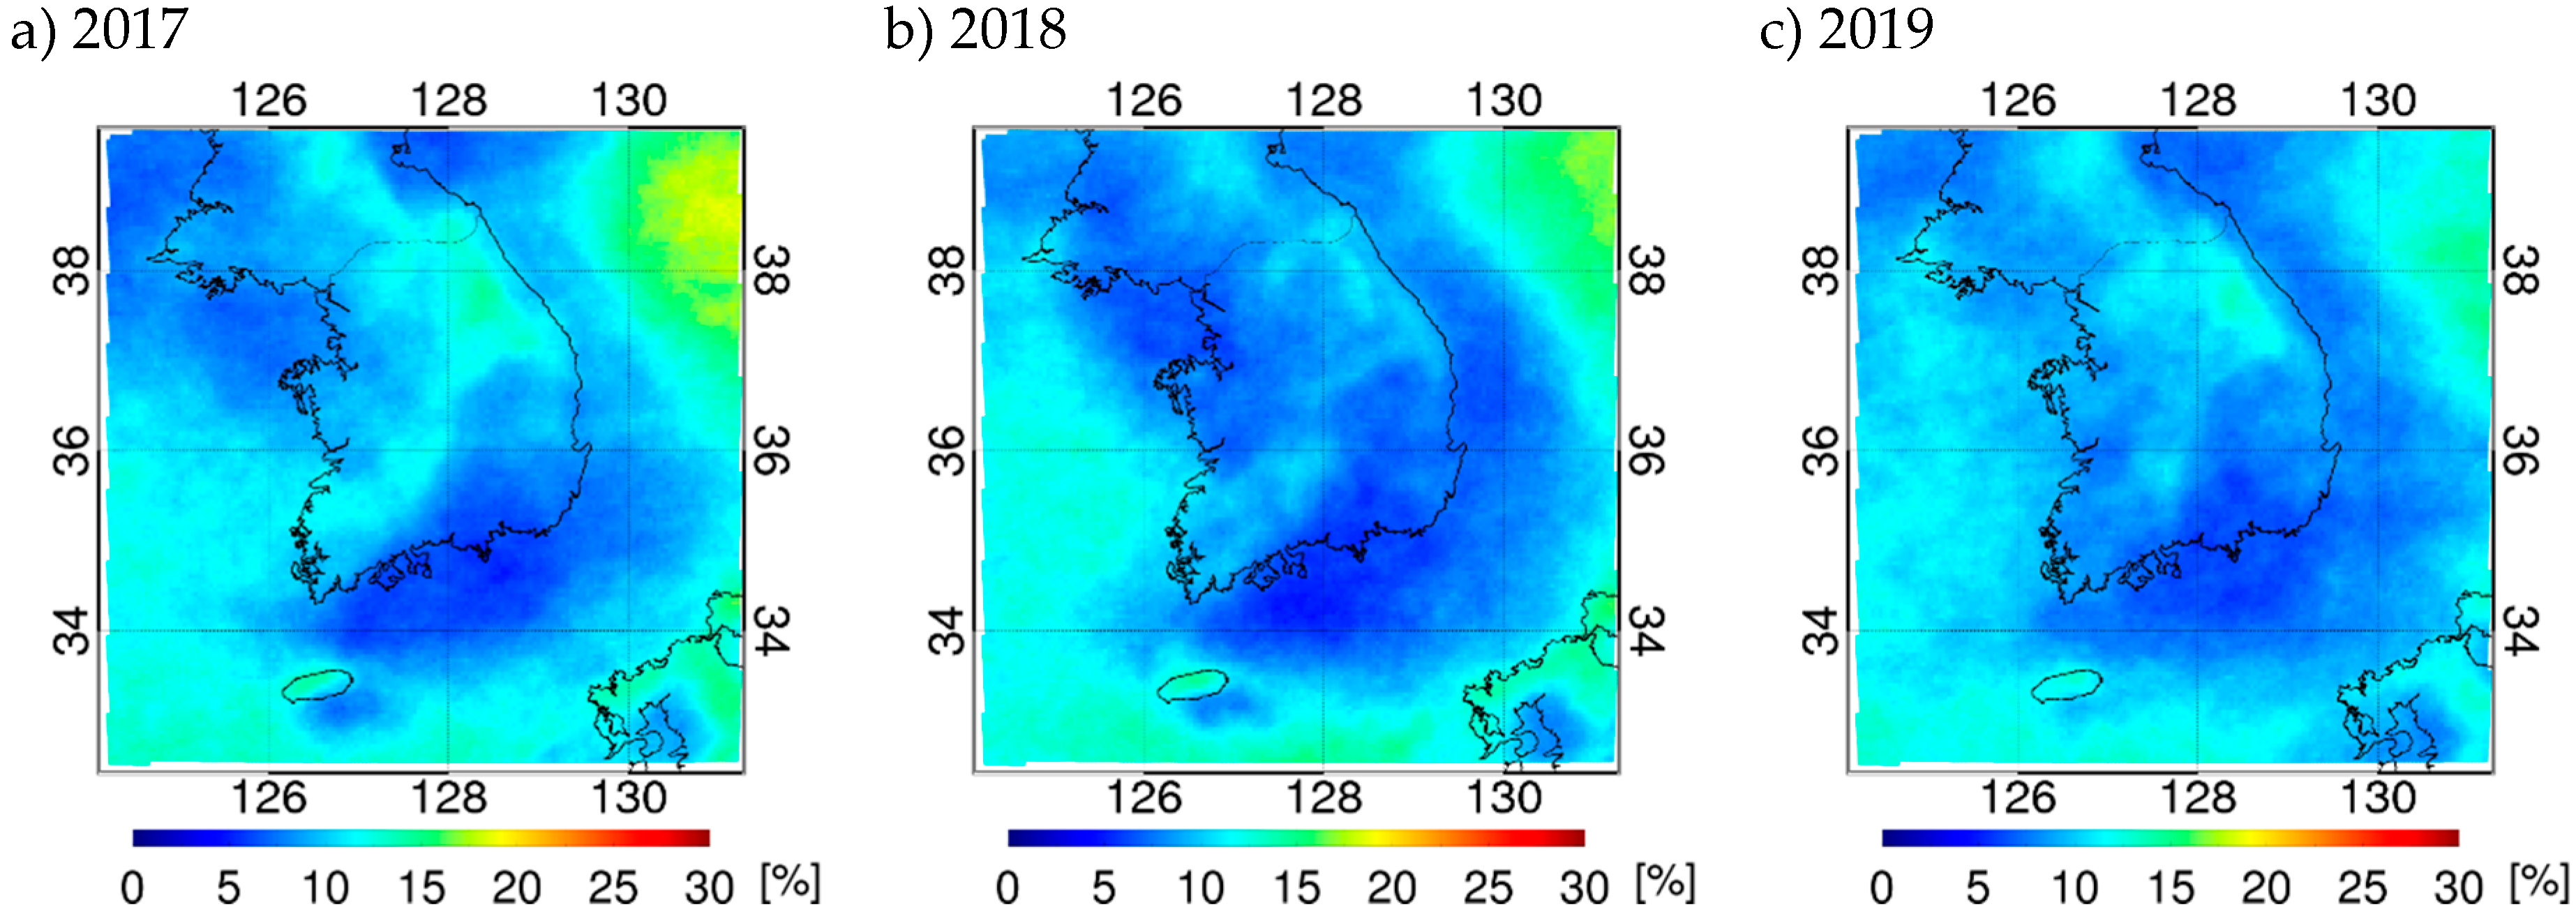
Figure 6 shows the annual frequency distribution of seedable clouds around the Korean Peninsula. The data used for this analysis ranged from December of the previous year to November of the corresponding year. Consequently, the 2017 annual average distribution in Figure 6a uses data from December 2016 to November 2017. The annual average frequency of seedable clouds was 10% (9% on land and 10% on sea), with a difference of about 1% per year. This demonstrates that the frequency distribution of seedable clouds of different types was very similar. Specifically, seedable clouds occurred for about 36 days over the course of one year (approximately 17 days in winter, 7 days in spring, 5 days in summer, and about 7 days in fall). However, this figure is simply the occurrence frequency of seedable clouds.

4. Discussion

We determined that the frequency of cases in which a seeding effect causing rainfall or snowfall can be generated on the ground is generally low and depends on the wind system of the vertical atmosphere. Because the Korean Peninsula is located in the westerly wind zone, a seeding effect on land can be expected when clouds located in the northern and southern areas of the West Sea are seeded. In the typical west-high, east-low pressure pattern of the Korean Peninsula during winter, a rainfall (snowfall) effect on land can be expected due to northeast winds flowing to the East Coast [52,55,56,57]. Seeding effects can be expected in the upwind or downwind sides around mountainous terrain with high land on the Korean Peninsula for water phase seedable clouds [9,23,26]. These results suggest that it may be useful to seed seeding material such as AgI in ice phase clouds occurring in the Northeast and West Sea to form ice nuclei and induce both snowfall and rainfall. Also, it could be possible to seed seeding material such as CaCl2 in water phase clouds occurring in the Southwest Sea and West Coast to form condensation nuclei and to induce precipitation. In particular, the Taebaek Mountains is located between the inland and the sea, and the clouds are generated from November to March and remain below a temperature of zero degrees. Therefore, these clouds are well suited for precipitation experiments using AgI.
The COMS cloud products used to detect seedable clouds in this study include uncertainty for each product, as shown in Section 2. This uncertainty leads to false detection of seedable clouds. However, geostationary satellites cannot detect lower-level clouds as they are underneath the upper clouds. In other words, lower-level clouds underneath the clouds exceeding the cloud top height, set in this study as seedable clouds, cannot be detected. Joiner et al. [51] reported that, on average, approximately 11% of these multi-layered clouds occur in the middle latitudes. In other words, the frequency of the undetected seedable clouds in the lower level, underneath the upper cloud, may be higher than the seedable clouds not detected due to the uncertainty of COMS cloud products. Therefore, the occurrence frequency of the seedable clouds analyzed may be higher or similar. However, land- and sea-based, as well as regional differences, may occur [51,58].

5. Conclusions

Our study analyzed the distribution frequency and characteristics of seedable clouds generated around the Korean Peninsula from December 2016 to November 2019. Our data consisted of cloud top height, cloud top temperature, cloud phase, cloud top pressure, cloud optical thickness, and rainfall intensity from the meteorological satellite COMS. Data with a high spatiotemporal resolution, from which cloud distribution and characteristics could be analyzed over a wide area, was used preferentially. Seedable clouds with a sufficient cloud fraction were classified into water cloud and ice cloud phases. In cases where phases were mixed, clouds were classified as ice cloud phase if the CTT was below −5 °C or water cloud phase if it was −5 °C or higher [25,28,39]. Seedable clouds around the Korean Peninsula exhibited the following average frequencies by season: 18% in winter, 8% in spring, 6% in summer, and 8% in fall. In winter, water phase seedable clouds showed high frequencies of 15–20% in the central West Sea, South Coast, and East Sea. Ice phase seedable clouds had high frequencies of 15–20% in the northern East Sea and West Sea. Water phase seedable clouds exhibited an average occurrence frequency of 8% on land, with frequencies that were 2–7% higher around the Taebaek and Sobaek Mountains than other land regions. Thus, the development and inflow of clouds on the sea around the Korean Peninsula, in addition to the development of mountainous clouds on high-altitude land, led to the high occurrence frequency of clouds suitable for seeding [9,23,26,52,55,56,57].
Water and ice phase seedable clouds exhibited an average CTH of 2.43 km and 3.24 km, with a difference of 0.81 km, and a CTT of 3.11 °C and −8.41 °C, with a difference of 11.52 K. Both water and ice phase seedable clouds had similar CTH on land and sea, though the CTT was approximately 0.65 K higher on sea. The Sc cloud type had the highest distribution of seedable clouds around the Korean Peninsula. It had the highest average frequency for all seasons at 63%, followed by Cu clouds at 15%, As clouds at 13%, and Ac clouds at 6%. The occurrence frequency of Sc clouds on land was 7% higher than on sea, and the occurrence frequency of Cu clouds on land was 6% lower than on sea. Approximately 78% of seedable clouds occurring around the Korean Peninsula were low-level clouds, and approximately 19% were mid-level clouds. The low-level Sc cloud type had the highest frequency at approximately 72% among water phase seedable clouds, and As clouds had the lowest frequency at approximately 13%. Among ice phase seedable clouds, the low-level Cu clouds exhibited the highest frequency at approximately 30%, and mid-level Ac clouds had a frequency of 27%. Therefore, the occurrence frequency of stratiform clouds was highest for water phase seedable clouds, while the occurrence frequency of cumuliform clouds was highest for ice phase seedable clouds. The annual average frequency of seedable clouds was 10%, with a difference of about 1% per year. This demonstrates that the frequency distribution of seedable clouds was very similar. In particular, the northern and southern sea regions of the Korean Peninsula in winter were found to be most suitable areas for conducting precipitation enhancement experiments because of the high occurrence frequency of seedable clouds. On land, the Taebaek and Sobaek Mountains were found to be suitable areas for these experiments [52,59].
Field research is currently being conducted on precipitation enhancement experiments worldwide [11,17,60,61,62]. There is an increasing socioeconomic demand for addressing droughts, securing water resources, and preventing forest fires, which has led to the development of meteorological projects and the substantial growth of activities for precipitation enhancement [2]. Researchers have attempted experiments for precipitation enhancement using various equipment in addition to atmospheric aircraft, such as helicopters, rockets, and drones [22,27]. Precipitation enhancement technology may represent the only method for increasing water supply in its natural state and developing reserve water resources in situations where natural water resources are limited [63]. Accordingly, continuous precipitation experiments and efforts for objective and systematic technology development are required. In addition, identifying the occurrence and distribution of seedable clouds can enhance the seeding effect [2,30]. Continuous precipitation enhancement experiments and related studies can be conducted by identifying seedable clouds, observing cloud characteristics in extensive areas via satellite, establishing a plan for precipitation enhancement experiments, and exploring areas of interest with high seedable cloud occurrence frequencies. Meteorological satellite data is essential to perform these studies, and satellites such as GK-2A and Himawari-8 that have a high spatiotemporal resolution can be used to analyze cloud characteristics and examine their distribution more accurately.

Author Contributions

Conceptualization, B.-Y.K. and J.W.C.; methodology, B.-Y.K., J.W.C., and A.-R.K.; software, B.-Y.K.; validation, B.-Y.K.; investigation, B.-Y.K., W.J., and A.-R.K.; writing—original draft preparation, B.-Y.K.; writing—review and editing, B.-Y.K., J.W.C., A.-R.K., W.J., and J.-C.H.; visualization, B.-Y.K.; supervision, J.W.C.; project administration, J.-C.H.; All authors have read and agreed to the published version of the manuscript.

Funding

This research was funded by the Korea Meteorological Administration (KMA), grant number KMA2018-00222.

Acknowledgments

This work was funded by the Korea Meteorological Administration Research and Development Program “Development of Application Technology on Atmospheric Research Aircraft” under Grant (KMA2018-00222).

Conflicts of Interest

The authors declare no conflict of interest.

References

  1. IPCC. Climate Change 2013: The Physical Science Basis. Contribution of Working Group I to the Fifth Assessment Report of the Intergovernmental Panel on Climate Change; Cambridge University Press: Cambridge, UK; New York, NY, USA, 2013; pp. 1–1535. [Google Scholar]
  2. WMO. Peer Review Report on Global Precipitation Enhancement Activities; WWRP 2018-1; WMO: Geneva, Switzerland, 2018; pp. 1–129. [Google Scholar]
  3. Kyoung, M.S.; Kim, H.S.; Sivakumar, B.; Singh, V.P.; Ahn, K.S. Dynamic characteristics of monthly rainfall in the Korean Peninsula under climate change. Stoch. Environ. Res. Risk Assess. 2011, 25, 613–625. [Google Scholar] [CrossRef]
  4. Choi, K.S.; Kim, D.W.; Byun, H.R. Possible impact of spring sea ice anomaly in the North Pacific on the Korean summer drought. Asia-Pac. J. Atmos. Sci. 2009, 45, 331–346. [Google Scholar]
  5. Barlow, M.; Cullen, H.; Lyon, B. Drought in central and southwest Asia: La Niña, the warm pool, and Indian Ocean precipitation. J. Clim. 2002, 15, 697–700. [Google Scholar] [CrossRef] [Green Version]
  6. Rao, V.B.; Giarolla, E.; Kayano, M.T.; Franchito, S.H. Is the recent increasing trend of rainfall over northeast Brazil related to sub-Saharan drought? J. Clim. 2006, 19, 4448–4453. [Google Scholar] [CrossRef] [Green Version]
  7. Lee, C.; Chang, K.H.; Jung, J.W.; Cha, J.W.; Choi, Y.J.; Kim, K. Strategy for the meteorological and environmental airborne observations over the Korean Peninsula. Asia-Pac. J. Atmos. Sci. 2011, 47, 91–96. [Google Scholar] [CrossRef]
  8. Baik, J.; Choi, M. Spatio-temporal variability of remotely sensed precipitation data from COMS and TRMM: Case study of Korean peninsula in East Asia. Adv. Space Res. 2015, 56, 1125–1138. [Google Scholar] [CrossRef]
  9. Bruintjes, R.T. A review of cloud seeding experiments to enhance precipitation and some new prospects. Bull. Am. Meteorol. Soc. 1999, 80, 805–820. [Google Scholar] [CrossRef] [Green Version]
  10. Korneev, V.P.; Potapov, E.I.; Shchukin, G.G. Environmental aspects of cloud seeding. Russ. Meteorol. Hydrol. 2017, 42, 477–483. [Google Scholar] [CrossRef]
  11. Silverman, B.A. A critical assessment of glaciogenic seeding of convective clouds for rainfall enhancement. Bull. Am. Meteorol. Soc. 2001, 82, 903–924. [Google Scholar] [CrossRef]
  12. Griffith, D.A.; Solak, M.E. Economic feasibility assessment of winter cloud seeding in the Boise River drainage, Idaho. J. Weather Modif. 2018, 34, 39–46. [Google Scholar]
  13. Griffith, D.A.; Solak, M.E.; Yorty, D.P.; Brinkman, B. A level II weather modification feasibility study for winter snowpack augmentation in the Salt River and Wyoming ranges in Wyoming. J. Weather Modif. 2007, 39, 76–83. [Google Scholar]
  14. Bangsund, D.; Leistritz, F.L. Economic Impacts of Cloud Seeding on Agricultural Crops in North Dakota; Report for North Dakota Atmospheric Resource Board; NDSU: Bismarck, ND, USA, 2009; pp. 1–37. [Google Scholar]
  15. Ma, J.; Guo, X.; Zhao, C.; Zhang, Y.; Hu, Z. Recent progress in cloud physics research in China. Adv. Atmos. Sci. 2007, 24, 1121–1137. [Google Scholar] [CrossRef]
  16. Morrison, A.E.; Siems, S.T.; Manton, M.J.; Nazarov, A. On the analysis of a cloud seeding dataset over Tasmania. J. Appl. Meteorol. Climatol. 2009, 48, 1267–1280. [Google Scholar] [CrossRef]
  17. Manton, M.J.; Warren, L.; Kenyon, S.L.; Peace, A.D.; Bilish, S.P.; Kemsley, K. A confirmatory snowfall enhancement project in the snowy mountains of Australia. Part I: Project design and response variables. J. Appl. Meteorol. Climatol. 2011, 50, 1432–1447. [Google Scholar] [CrossRef]
  18. Manton, M.J.; Warren, L. A confirmatory snowfall enhancement project in the Snowy Mountains of Australia. Part II: Primary and associated analyses. J. Appl. Meteorol. Climatol. 2011, 50, 1448–1458. [Google Scholar] [CrossRef]
  19. Colorado Water Conservation Board (CWCB). Inventory and Assessment of Colorado Weather Modification Programs: A Summary of Current Programs and Opportunities for Enhancements; CWCB Reports; Colorado Water Conservation Board: Denver, CO, USA, 2015; pp. 1–300.
  20. Lee, C.; Chang, K.H.; Cha, J.W.; Jung, J.W.; Jeong, J.Y.; Yang, H.Y.; Seo, S.K.; Bae, J.Y.; Kang, S.Y.; Choi, Y.J.; et al. Estimation for the economic benefit of weather modification (Precipitation enhancement and fog dissipation). Atmosphere 2010, 20, 187–194, (In Korean with English abstract). [Google Scholar]
  21. Cha, J.W.; Jung, W.; Chae, S.; Ko, A.R.; Ro, Y.; Chang, K.H.; Seo, S.; Ha, J.C.; Park, D.; Hwang, H.J.; et al. Analysis of results and techniques about precipitation enhancement by aircraft seeding in Korea. Atmosphere 2019, 29, 481–499, (In Korean with English abstract). [Google Scholar]
  22. Guo, X.L.; Fu, D.H.; Li, X.Y.; Hu, Z.X.; Lei, H.C.; Xiao, H.; Hong, Y.C. Advances in cloud physics and weather modification in China. Adv. Atmos. Sci. 2015, 32, 230–249. [Google Scholar] [CrossRef]
  23. Seto, J.; Tomine, K.; Wakimizu, K.; Nishiyama, K. Artificial cloud seeding using liquid carbon dioxide: Comparisons of experimental data and numerical analyses. J. Appl. Meteorol. Climatol. 2011, 50, 1417–1431. [Google Scholar] [CrossRef]
  24. Chae, S.; Chang, K.H.; Seo, S.; Jeong, J.Y.; Kim, B.J.; Kim, C.K.; Yum, S.S.; Kim, J. Numerical Simulations of airborne glaciogenic cloud seeding using the WRF model with the modified morrison scheme over the Pyeongchang Region in the winter of 2016. Adv. Meteorol. 2018, 2018, 1–15. [Google Scholar] [CrossRef] [Green Version]
  25. Rosenfeld, D.; Yu, X.; Dai, J. Satellite-retrieved microstructure of AgI seeding tracks in supercooled layer clouds. J. Appl. Meteorol. 2005, 44, 760–767. [Google Scholar] [CrossRef]
  26. Geerts, B.; Pokharel, B.; Kristovich, D.A. Blowing snow as a natural glaciogenic cloud seeding mechanism. Mon. Weather Rev. 2015, 143, 5017–5033. [Google Scholar] [CrossRef]
  27. Tessendorf, S.A.; French, J.R.; Friedrich, K.; Geerts, B.; Rauber, R.M.; Rasmussen, R.M.; Xue, L.; Ikeda, K.; Blestrud, D.R.; Kunker, M.L.; et al. A transformational approach to winter orographic weather modification research: The SNOWIE Project. Bull. Am. Meteorol. Soc. 2019, 100, 71–92. [Google Scholar] [CrossRef]
  28. Koshida, T.; Murakami, M.; Yoshida, K.; Fujibe, F.; Takahashi, K. Assessment of clouds suitable for summertime precipitation augmentation over Shikoku Island. SOLA 2012, 8, 160–164. [Google Scholar] [CrossRef] [Green Version]
  29. Morrison, A.E.; Siems, S.T.; Manton, M.J. On a natural environment for glaciogenic cloud seeding. J. Appl. Meteorol. Climatol. 2013, 52, 1097–1104. [Google Scholar] [CrossRef]
  30. World Meteorological Organization (WMO). WMO Weather Modification Statement and Guidelines (updated in the ET meeting in Abu Dhabi. 22–24 March 2010). Available online: https://www.wmo.int/pages/prog/arep/wwrp/new/documents/WMR_documents.final_27_April_1.FINAL.pdf (accessed on 10 March 2020).
  31. Choi, Y.S.; Ho, C.H.; Ahn, M.H.; Kim, Y.M. An exploratory study of cloud remote sensing capabilities of the Communication, Ocean and Meteorological Satellite (COMS) Imagery. Int. J. Remote Sens. 2007, 28, 4715–4732. [Google Scholar] [CrossRef]
  32. Kim, H.D.; Kang, G.S.; Lee, D.K.; Jin, K.W.; Seo, S.B.; Oh, H.J.; Ryu, J.H.; Lambert, H.; Laine, I.; Meyer, P.; et al. COMS, the new eyes in the sky for geostationary remote sensing. Remote Sens.–Adv. Tech. Platf. 2012, 235–268. [Google Scholar] [CrossRef] [Green Version]
  33. Kim, B.Y.; Lee, K.T. Radiation Component Calculation and Energy Budget Analysis for the Korean Peninsula Region. Remote Sens. 2018, 10, 1147. [Google Scholar] [CrossRef] [Green Version]
  34. National Meteorology Satellite Center (NMSC). Algorithm Theoretical Basis Document for Cloud Amount; NMSC/SCI/ATBD/CA Issue 1, Rev. 4; National Meteorology Satellite Center: Beijing, China, 2012; pp. 1–22. [Google Scholar]
  35. Heidinger, A.K.; Evan, A.T.; Foster, M.J.; Walther, A. A naive Bayesian cloud-detection scheme derived from CALIPSO and applied within PATMOS-x. J. Appl. Meteorol. Climatol. 2012, 51, 1129–1144. [Google Scholar] [CrossRef]
  36. NIMS. Advanced Research on Applied Meteorology (II); No. 11-1360000-001128-10; Korea Meteorological Agency: Seoul, Korea, 2014; pp. 1–223, (In Korean with English abstract).
  37. Young, K.C. Microphysical Processes in Clouds; Oxford University Press: Oxford, UK, 1993; pp. 1–427. [Google Scholar]
  38. Guo, X.; Zheng, G. Advances in weather modification from 1997 to 2007 in China. Adv. Atmos. Sci. 2009, 26, 240–252. [Google Scholar] [CrossRef]
  39. Orville, H.D. A review of cloud modeling in weather modification. Bull. Am. Meteorol. Soc. 1996, 77, 1535–1556. [Google Scholar] [CrossRef] [Green Version]
  40. Woodley, W.L.; Rosenfeld, D.; Silverman, B.A. Results of on-top glaciogenic cloud seeding in Thailand. Part I: The demonstration experiment. J. Appl. Meteorol. 2003, 42, 920–938. [Google Scholar] [CrossRef]
  41. Rosenfeld, D.; Axisa, D.; Woodley, W.L.; Lahav, R. A quest for effective hygroscopic cloud seeding. J. Appl. Meteorol. Climatol. 2010, 49, 1548–1562. [Google Scholar] [CrossRef]
  42. Rossow, W.B.; Schiffer, R.A. ISCCP cloud data products. Bull. Am. Meteorol. Soc. 1991, 72, 2–20. [Google Scholar] [CrossRef]
  43. National Meteorology Satellite Center (NMSC). Cloud Detection (CLD) Algorithm Theoretical Basis Document; NMSC/SCI/ATBD/CLD, Issue 1, Rev. 0; National Meteorology Satellite Center: Beijing, China, 2012; pp. 1–28. [Google Scholar]
  44. National Meteorology Satellite Center (NMSC). CP Algorithm Theoretical Basis Document; NMSC/SCI/ATBD/CP, Issue 1, Rev. 4; National Meteorology Satellite Center: Beijing, China, 2012; pp. 1–22. [Google Scholar]
  45. National Meteorology Satellite Center (NMSC). COT Algorithm Theoretical Basis Document; NMSC/SCI/ATBD/COT, Issue 1, Rev. 4; National Meteorology Satellite Center: Beijing, China, 2012; pp. 1–43. [Google Scholar]
  46. National Meteorology Satellite Center (NMSC). CTTP Algorithm Theoretical Basis Document; NMSC/SCI/ATBD/CTTP, Issue 1, Rev. 5; National Meteorology Satellite Center: Beijing, China, 2012; pp. 1–40. [Google Scholar]
  47. National Meteorology Satellite Center (NMSC). Rainfall Intensity (RI) Basis Document; NMSC/SCI/ATBD/RI, Issue 1, Rev. 0; National Meteorology Satellite Center: Beijing, China, 2012; pp. 1–22. [Google Scholar]
  48. Kim, B.Y.; Lee, K.T.; Jee, J.B.; Zo, I.S. Retrieval of outgoing longwave radiation at top-of-atmosphere using Himawari-8 AHI data. Remote Sens. Environ. 2018, 204, 498–508. [Google Scholar] [CrossRef]
  49. Lee, S.H.; Kim, B.Y.; Lee, K.T.; Zo, I.S.; Jung, H.S.; Rim, S.H. Retrieval of reflected shortwave radiation at the top of the atmosphere using Himawari-8/AHI data. Remote Sens. 2018, 10, 213. [Google Scholar] [CrossRef] [Green Version]
  50. Kim, B.Y.; Lee, K.T. Using the himawari-8 ahi multi-channel to improve the calculation accuracy of outgoing longwave radiation at the top of the atmosphere. Remote Sens. 2019, 11, 589. [Google Scholar] [CrossRef] [Green Version]
  51. Joiner, J.; Vasilkov, A.; Bhartia, P.K.; Wind, G.; Platnick, S.; Menzel, W.P. Detection of multilayer and vertically extended clouds using the A-Train sensors. Atmos. Meas. Tech. 2010, 3, 233–247. [Google Scholar] [CrossRef] [Green Version]
  52. Kim, C.K.; Yum, S.S.; Park, Y.S. A numerical study of winter orographic seeding experiments in Korea using the Weather Research and Forecasting model. Meteorol. Atmos. Phys. 2016, 128, 23–38. [Google Scholar] [CrossRef]
  53. Ito, J.; Niino, H. Atmospheric Kármán Vortex Shedding from Jeju Island, East China Sea: A Numerical Study. Mon. Weather Rev. 2016, 144, 139–148. [Google Scholar] [CrossRef]
  54. Houze, R.A., Jr. Orographic effects on precipitating clouds. Rev. Geophys. 2012, 50, 1–47. [Google Scholar] [CrossRef]
  55. Watson, C.D.; Lane, T.P. Further sensitivities of orographic precipitation to terrain geometry in idealized simulations. J. Atmos. Sci. 2014, 71, 3068–3089. [Google Scholar] [CrossRef]
  56. Geerts, B.; Yang, Y.; Rasmussen, R.; Haimov, S.; Pokharel, B. Snow growth and transport patterns in orographic storms as estimated from airborne vertical-plane dual Doppler radar data. Mon. Weather Rev. 2015, 143, 644–665. [Google Scholar] [CrossRef] [Green Version]
  57. French, J.R.; Friedrich, K.; Tessendorf, S.A.; Rauber, R.M.; Geerts, B.; Rasmussen, R.M.; Xue, L.; Kunkel, M.L.; Blestrud, D.R. Precipitation formation from orographic cloud seeding. Proc. Natl. Acad. Sci. USA 2018, 115, 1168–1173. [Google Scholar] [CrossRef] [PubMed] [Green Version]
  58. Jin, Y.; Rossow, W.B. Detection of cirrus overlapping low-level clouds. J. Geophys. Res. Atmos. 1997, 102, 1727–1737. [Google Scholar] [CrossRef]
  59. Cotton, W.D.; Pielke, R.A. Human Impacts on Weather and Climate, 2nd ed.; Cambridge University Press: Cambridge, UK, 2007; pp. 1–330. [Google Scholar]
  60. Yoshida, Y.; Murakami, M.; Kurumisawa, Y.; Kato, T.; Hashimoto, A.; Yamazaki, T.; Haneda, N. Evaluation of snow augmentation by cloud seeding for drought mitigation. J. Jpn. Soc. Hydrol. Water Resour. 2009, 22, 209–222. [Google Scholar] [CrossRef] [Green Version]
  61. Manton, M.J.; Peace, A.D.; Kemsley, K.; Kenyon, S.; Speirs, J.C.; Warren, L.; Denholm, J. Further analysis of a snowfall enhancement project in the snowy mountains of Australia. Atmos. Res. 2017, 193, 192–203. [Google Scholar] [CrossRef]
  62. Rasmussen, R.M.; Tessendorf, S.A.; Xue, L.; Weeks, C.; Ikeda, K.; Landolt, S.; Breed, D.; Deshler, T.; Lawrence, B. Evaluation of the Wyoming Weather Modification Pilot Project (WWMPP) using two approaches: Traditional statistics and ensemble modeling. J. Appl. Meteorol. Climatol. 2018, 57, 2639–2660. [Google Scholar] [CrossRef] [Green Version]
  63. Mulyana, E.; Bahri, S. Recent progress in precipitation enhancement research. In Proceedings of the International Symposium on Weather Modification, Tsukuba, Japan, 3–4 March 2011. [Google Scholar]
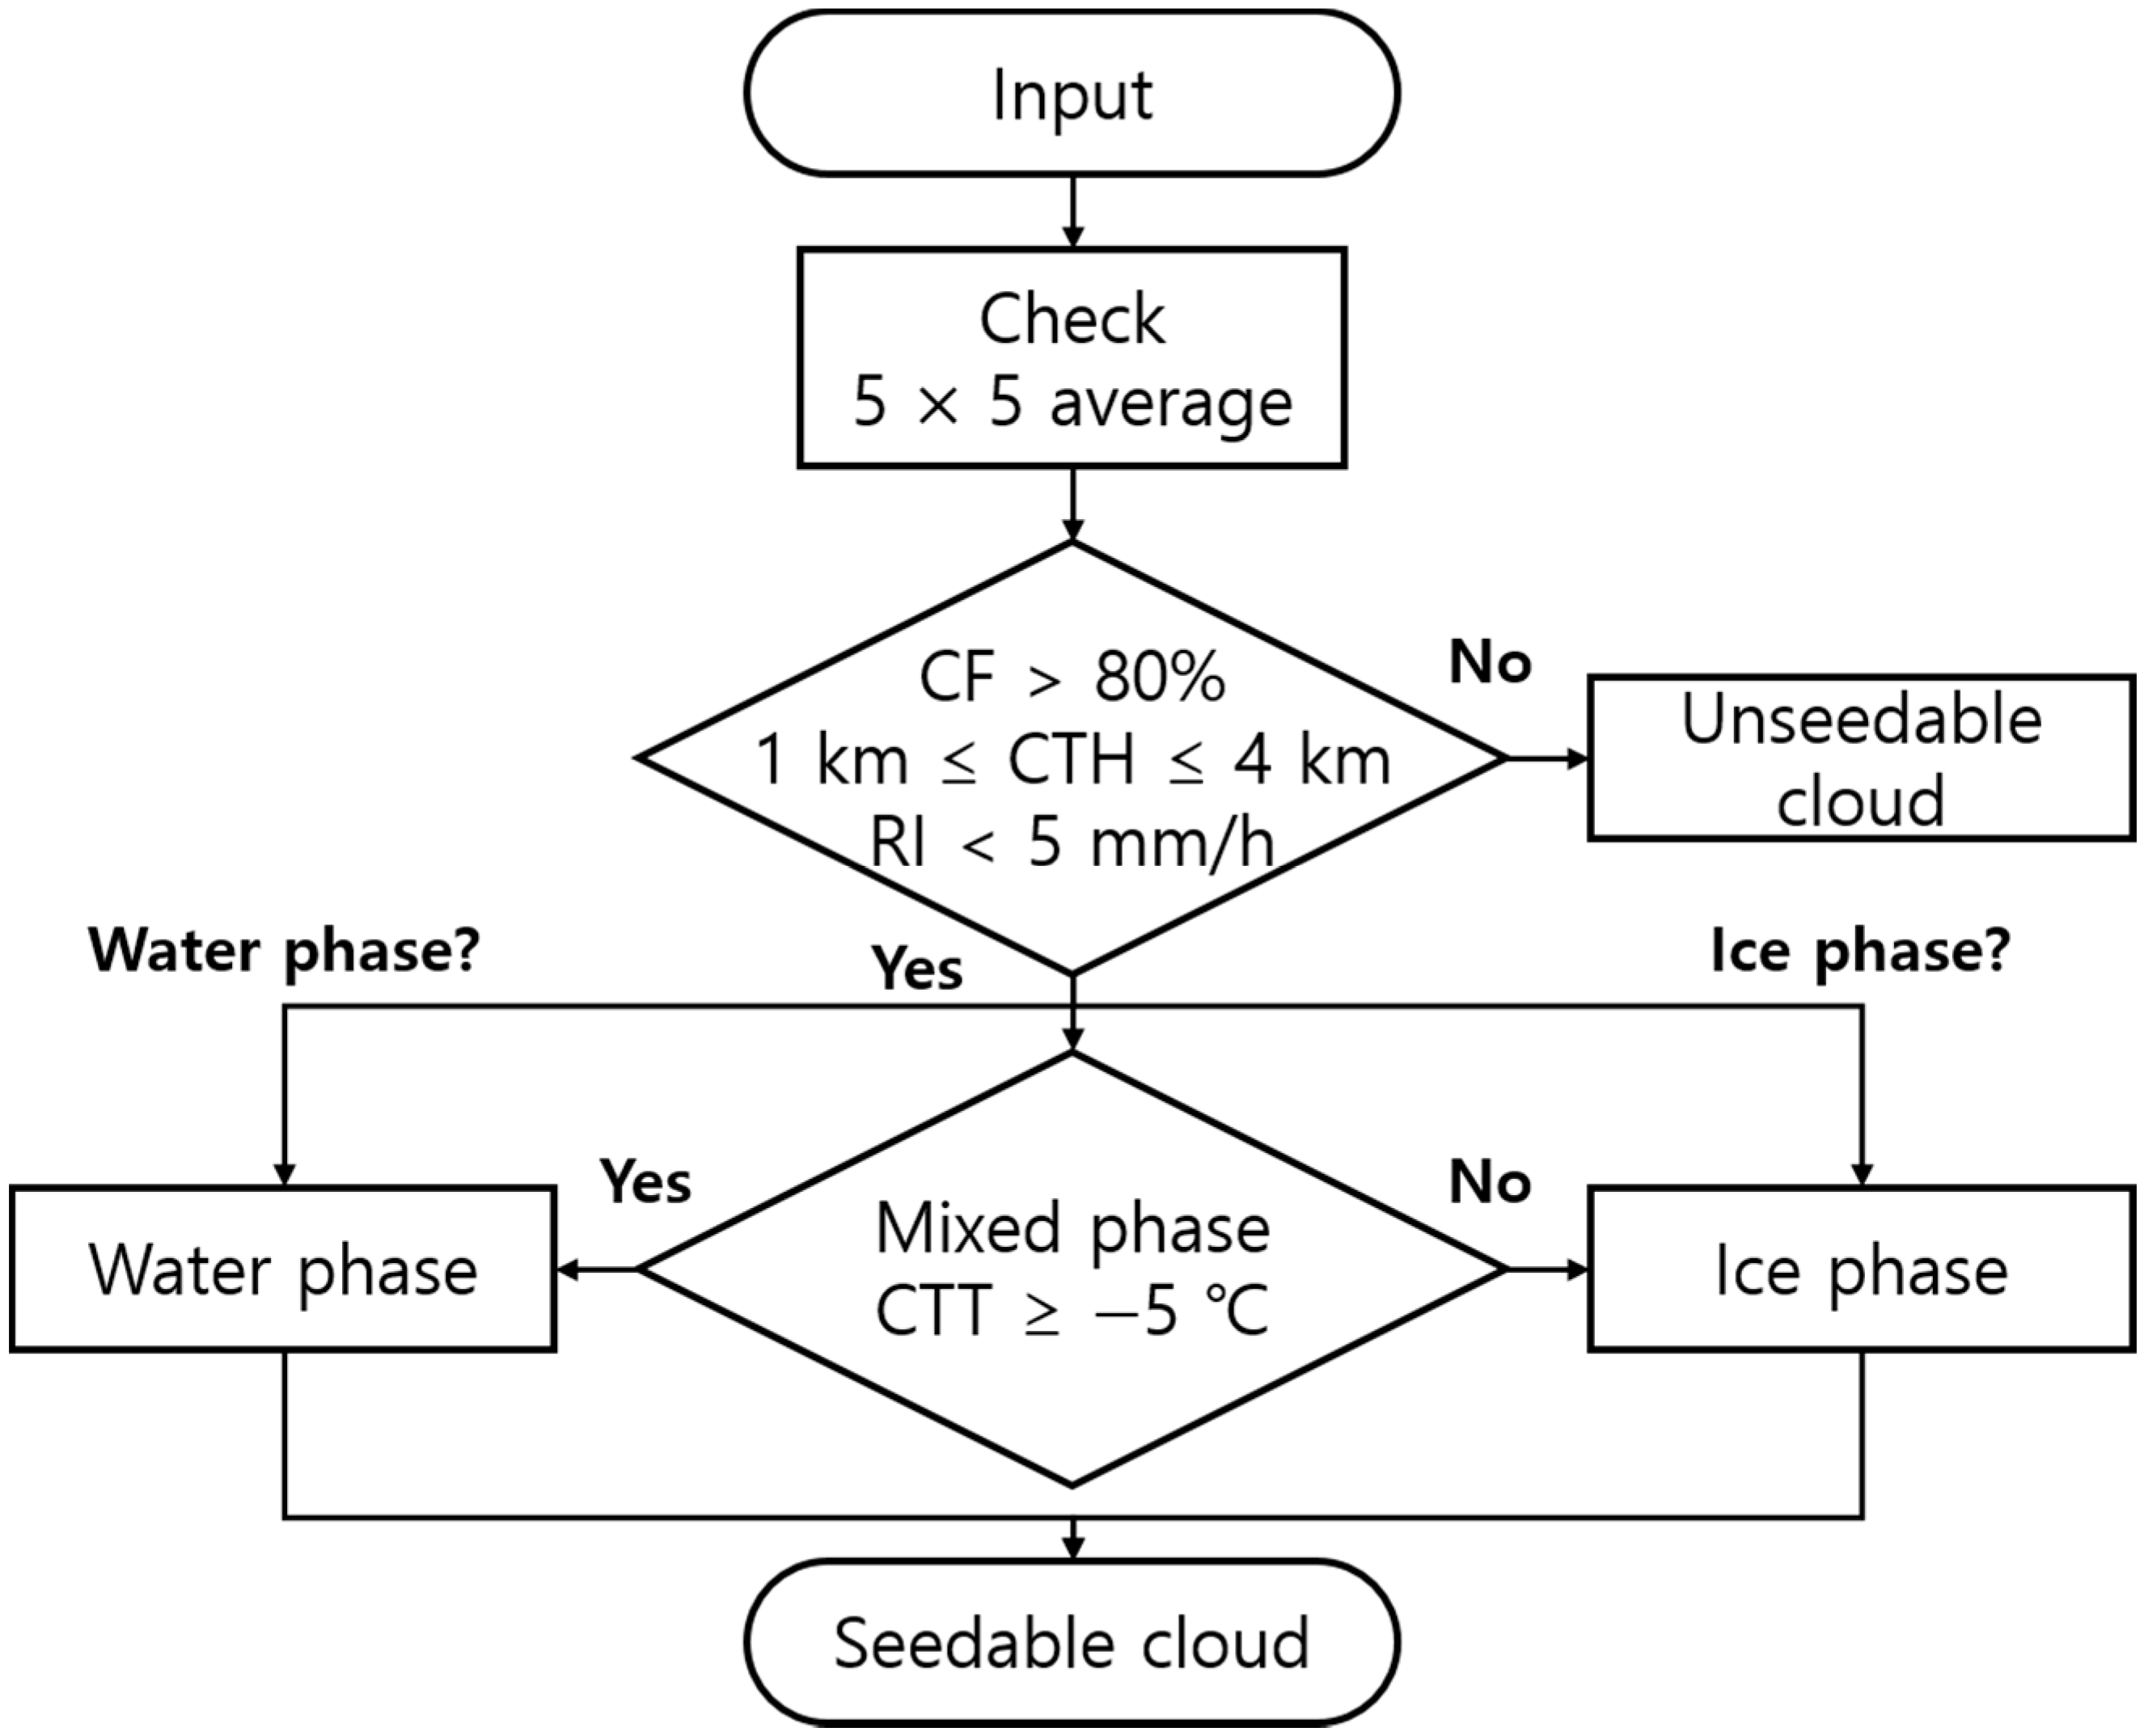
Figure 1. Flow chart of seedable cloud detection algorithm using COMS data (CF is cloud fraction, CTH is cloud top height, RI is rainfall intensity, CTT is cloud top temperature).
Remotesensing 12 01487 g001
Figure 2. Frequency distribution by season (ad) of clouds with COMS cloud fraction exceeding 80% (the solid red line indicates the Taebaek and Sobaek Mountains).
Remotesensing 12 01487 g002
Figure 3. Frequency distribution of seedable clouds (both water cloud phase and ice cloud phase (ad) and cloud characteristics (CTH: (eh)), (CTT: (il)) by season around the Korean Peninsula.
Remotesensing 12 01487 g003
Figure 4. Frequency distribution of water phase seedable clouds (ad) and cloud characteristics (CTH: (eh), CTT: (il)) around the Korean Peninsula.
Remotesensing 12 01487 g004
Figure 5. Frequency distribution of ice phase seedable clouds (ad) and cloud characteristics (CTH: (eh), CTT: (il)) around the Korean Peninsula.
Remotesensing 12 01487 g005
Figure 6. Annual frequency distribution of seedable clouds (ac) around the Korean Peninsula.
Remotesensing 12 01487 g006
Table 1. Average seedable cloud occurrence frequency, cloud top height (CTH), and cloud top temperature (CTT) by season and seedable cloud type. Freq. denotes the occurrence frequency (%), CTH is in km, CTT is in °C, and N is seasonal seedable cloud frequency according to the cloud phase. < 0.01 indicates a frequency of less than 0.01%.
AcAsNsCuScStN
WinterFreq.5.0415.040.0317.4462.390.072,037,643
CTH3.363.133.352.402.252.37
CTT−11.48−7.89−6.67−7.72−7.33−6.05
SpringFreq.8.8318.930.0313.4358.78<0.012,496,801
CTH3.533.253.332.612.372.48
CTT−7.89−5.15−2.32−5.01−1.48−0.50
SummerFreq.4.8411.48<0.0113.3670.32<0.012,270,728
CTH3.553.242.742.482.312.36
CTT5.566.1510.9710.7811.2914.74
FallFreq.8.2812.980.0218.9559.750.021,743,879
CTH3.523.193.062.502.272.64
CTT−1.69−0.20−0.992.653.50−1.03
Table 2. Average seedable cloud occurrence frequency, cloud top height (CTH), cloud top temperature (CTT) by season, seedable water phase cloud type, and ice phase clouds. Freq. denotes the occurrence frequency (%). CTH is in km, CTT is in °C, and N is seasonal seedable cloud frequency according to cloud phase. < 0.01 indicates a frequency less than 0.01%. There was no data with minus signs (−).
Water PhaseIce Phase
AcAsNsCuScStNAcAsNsCuScStN
WinterFreq.0.4712.850.0313.2373.330.091,386,09414.7519.690.0326.3939.120.03651,549
CTH3.263.073.202.062.142.423.453.393.672.712.481.84
CTT−2.72−2.45−2.88−1.61−1.86−2.15−12.13−10.40−7.77−11.14−11.30−9.46
SpringFreq.2.8416.990.0410.1370.01<0.011,792,84524.0823.870.0121.8630.18<0.01703,956
CTH3.543.223.332.292.262.473.583.493.632.942.763.19
CTT−2.220.25−1.460.842.953.94−10.31−11.29−8.88−10.22−11.26−6.28
SummerFreq.1.6511.23<0.0110.6576.47<0.012,056,29635.3913.85-39.4411.31-214,432
CTH3.533.222.712.322.282.363.623.64-2.892.93-
CTT3.986.1411.2111.2311.4114.74−5.74−5.57-−5.78−6.02-
FallFreq.4.3212.130.0216.4367.090.021,497,37032.3118.180.0234.2715.200.03246,509
CTH3.513.153.042.362.222.583.633.583.562.842.853.07
CTT−0.052.622.833.755.313.40−7.91−8.65−11.73−8.30−9.54−9.17