Article

A Novel Urban Composition Index Based on Water-Impervious Surface-Pervious Surface (W-I-P) Model for Urban Compositions Mapping Using Landsat Imagery

School of Geography and Information Engineering, China University of Geosciences, Wuhan 430074, China
*
Author to whom correspondence should be addressed.
Remote Sens. 2021, 13(1), 3; https://doi.org/10.3390/rs13010003
Submission received: 10 December 2020 / Revised: 18 December 2020 / Accepted: 19 December 2020 / Published: 22 December 2020
(This article belongs to the Special Issue Optical Remote Sensing Applications in Urban Areas)

Abstract

:
Monitoring urban compositions spatially and temporally is a crucial issue for urban planning and management. Nowadays, remote sensing techniques have been widely applied for urban compositions extraction. Compared with other remote sensing techniques, spectral indices have significant advantages due to their parameter-free and easy implementation. However, existing indices cannot extract different urban compositions well, and some of them can only extract one composition with less attention to other urban compositions. In this study, based on the water- impervious surface-pervious surface (W-I-P) model, a novel urban composition index (UCI) was developed by analyzing the robust features from the global spectral samples. Additionally, a semi-empirical threshold of UCI was proposed to extract different urban compositions (water, impervious surface area and pervious surface area). Four cities of China were selected as study areas, Landsat-8 images and Google Earth images were used for quantitative analysis. Correlation analysis, separability analysis, and accuracy assessment were conducted among UCI and five other existed indices (single and multiple composition indices) at the urban and global scales. Results indicated that UCI had a stronger correlation with the ISA proportion and a higher separability between each urban composition. UCI also achieved the highest overall accuracy and Kappa coefficient in urban compositions extraction. The suggested semi-empirical threshold was also testified to be reliable and can be a reference for practical application. There is convincing evidence that UCI is a simple, efficient, and reliable index for urban compositions extraction.

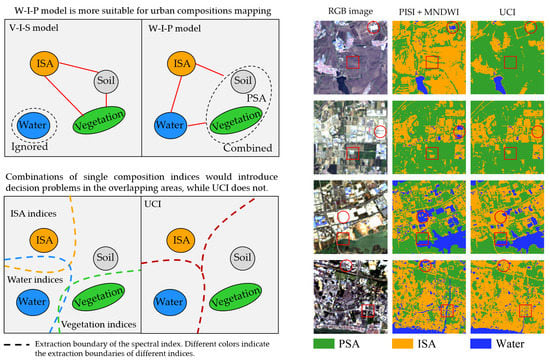
Graphical Abstract

1. Introduction

Urbanization is a complex process, with the drastically changing urban areas. Since the end of the 19th century, urbanization has taken place at an unprecedented rate and will continue in the future decades [1]. The rapid urbanization brings social and economic benefits as well as the severe deterioration of the environment and social issues, such as air and water pollution, loss of biodiversity, urban heat island effect, runoff problems, economic and social inequality [2,3,4]. Therefore, it is essential to monitor urban compositions timely and accurately for environmental management and local planning [5].
With the relatively low cost and repeat coverage of a large geographic area, remote sensing techniques have been widely applied to analyze urban compositions [6]. Furthermore, the increasing availability of remote sensing data, especially the Landsat imagery, has extended the possibilities for both the periodic and high-resolution analysis [7,8,9,10]. In the last several years, various approaches have been developed to extract urban compositions. These methods can be grouped into three major categories: machine learning methods, spectral mixture analysis (SMA), and spectral indices [3].
The first category, machine learning methods, includes regression/decision tree method [11,12], artificial neural network [13], regression modeling [14], object-oriented and knowledge-based classification methods [15,16,17]. Through analyzing and learning from the collected samples with different spectral and spatial characteristics, the empirical relationship was obtained and then applied to extract urban compositions from remote sensing imagery. However, the accuracy of these methods is always reliant on the quality of the training samples, and it is hard to be applied to a large geographic area [9]. Moreover, these methods are sometimes subjective [18,19].
The second category, SMA, assumes that the spectrum of one pixel is a linear or non-linear combination of the spectra of several typical homogeneous compositions, named endmembers [20,21,22]. Based on the vegetation-impervious surface-soil (V-I-S) model proposed by Ridd [23] for parameterizing the composition of urban environments, urban land covers (except water) can be regarded as the combination of the vegetation, impervious surface area, and soil. Although the SMA algorithms can acquire sub-pixel endmember fractions effectively, there are difficulties and challenges in endmember selection, inter-class variability quantification, and complicated implementation process when applied to map large areas [20,21,22].
The third category, spectral indices, has the advantages of effective implementation, and are considered promising methods due to their parameter-free and convenience in the applications of land surface information extractions [24]. At present, a number of indices have been proposed to quantify biophysical compositions of urban areas, as listed in Table 1.
Although spectral indices have been widely applied in mapping different land covers in urban areas, there still exist some challenges and limitations. First, most of the indices focus disproportionately on extracting one land cover type with less attention to other urban compositions. Although the combination of multiple indices can achieve the extraction of different urban compositions, it would introduce a decision problem in the overlapping areas of the results due to the limitations of different indices, which is not conducive to the long-term dynamic monitoring of the urban compositions. Furthermore, the indices mentioned above cannot separate impervious surface area (ISA) from the soil well, which would lead to low accuracy in the urban composition extraction. Second, though multi-composition indices have gradually been proposed (e.g., BCI, CBCI), new problems have emerged. BCI requires a tasselled cap (TC) transformation [34] first and needs to calculate the maximum and minimum values of the study areas for normalization, which makes the BCI cumbersome and not stable enough for dynamic monitoring of urban environments. BCI is based on the V-I-S model which can extract vegetation, soil, and ISA simultaneously, but the surface water is ignored. As a fundamental component of the urban environment, the surface water represents the interactions between urban form and issues (such as climate change, flood vulnerability), and should not be ignored. As for CBCI, it divides urban environments into four compositions (vegetation, soil, ISA, and water) while the separations between these four compositions and the extraction accuracy are not satisfactory. It is worth noting the lack of uniformity in the division of urban compositions. It seems like that either a simple urban to nonurban classification or a highly detailed representation of land cover limits the ability to analyze within-urban dynamics and to produce generalizable results [35]. Most studies routinely analyze the vegetation and soil separately, neglecting the increasing importance to represent the soil and vegetation continuum from urban environments [36]. The soil and vegetation continuum plays a critical role in shaping the ecological and social context of urban form, highlighting the ecosystem functions they can support, such as the potential to mitigate the urban heat island effect [37]. Recently, a new three-dimensional conceptualization model (water, human-constructed elements, and soil-plant continuum) was proposed [35], which is more suitable for mapping urban form in the future.
Therefore, in this study, we introduced a water-impervious surface-pervious surface (W-I-P) conception model based on Wentz’s works [35], which combines the soil and vegetation as the pervious surface area (PSA) and divides the urban environments into three fundamental compositions, namely the surface water (Water), ISA, and PSA. Based on the W-I-P model, we developed a novel and simple urban composition index (UCI) for urban composition mapping and explored the semi-empirical threshold of UCI. The remainder of this article is organized as follows: Section 2 introduces the study areas and data, then presents the methodology of UCI development, including spectral analysis, formula derivation, threshold selection, and comparative analysis. Results of comparative analysis with other indices, and applying UCI to Landsat-8 images are detailed in Section 3. Further, the discussion and conclusions are in Section 4 and Section 5.

2. Materials and Methods

2.1. Datasets

To develop a robust and universally applicable urban composition index, we applied a global land cover validation dataset (data.ess.tsinghua.edu.cn.) for spectral analysis. The dataset was collected by interpreting Landsat Thematic Mapper (TM) and Enhanced TM Plus (ETM+) images with the baseline period of 2009–2011, and it was designed for validating 30 m resolution global land-cover maps [38]. Based on the position information (latitude and longitude) provided by the dataset, we collected the spectral information of each land cover samples by looking up the Landsat-5 and Landsat-7 surface reflectance images (from 2009 to 2011) on the Google Earth Engine [39]. To ensure accuracy and purity, the samples were first clustered by using Model-based Clustering (MCLUST) software [40]. Then, only 50 percent of the samples that close to the cluster center were retained for each cluster. Furthermore, the average spectral of each cluster was compared with the United States Geological Survey (USGS) spectral library [41] and the Santa Barbara Urban Spectral Library [42,43], and those erroneous samples points whose spectral curves differed significantly from the spectral library were eliminated. The entire process is shown in Figure 1.
Considering the number of ISA samples from validation dataset is much less than others, we added some pure ISA samples from Landsat-8 images to the global spectral samples dataset by manually interpreting corresponding Google Earth images. Finally, we obtained 657 ISA (e.g., dark ISA, bright ISA, and others), 1491 soil (e.g., sandy areas, bare croplands, and other barren lands), 1106 water (e.g., snow, river, ocean, lake, and others), and 12261 vegetation samples (e.g., broadleaf forests, coniferous forests, croplands, grasslands, and others). The distribution of these global spectral samples is shown in Figure 2.
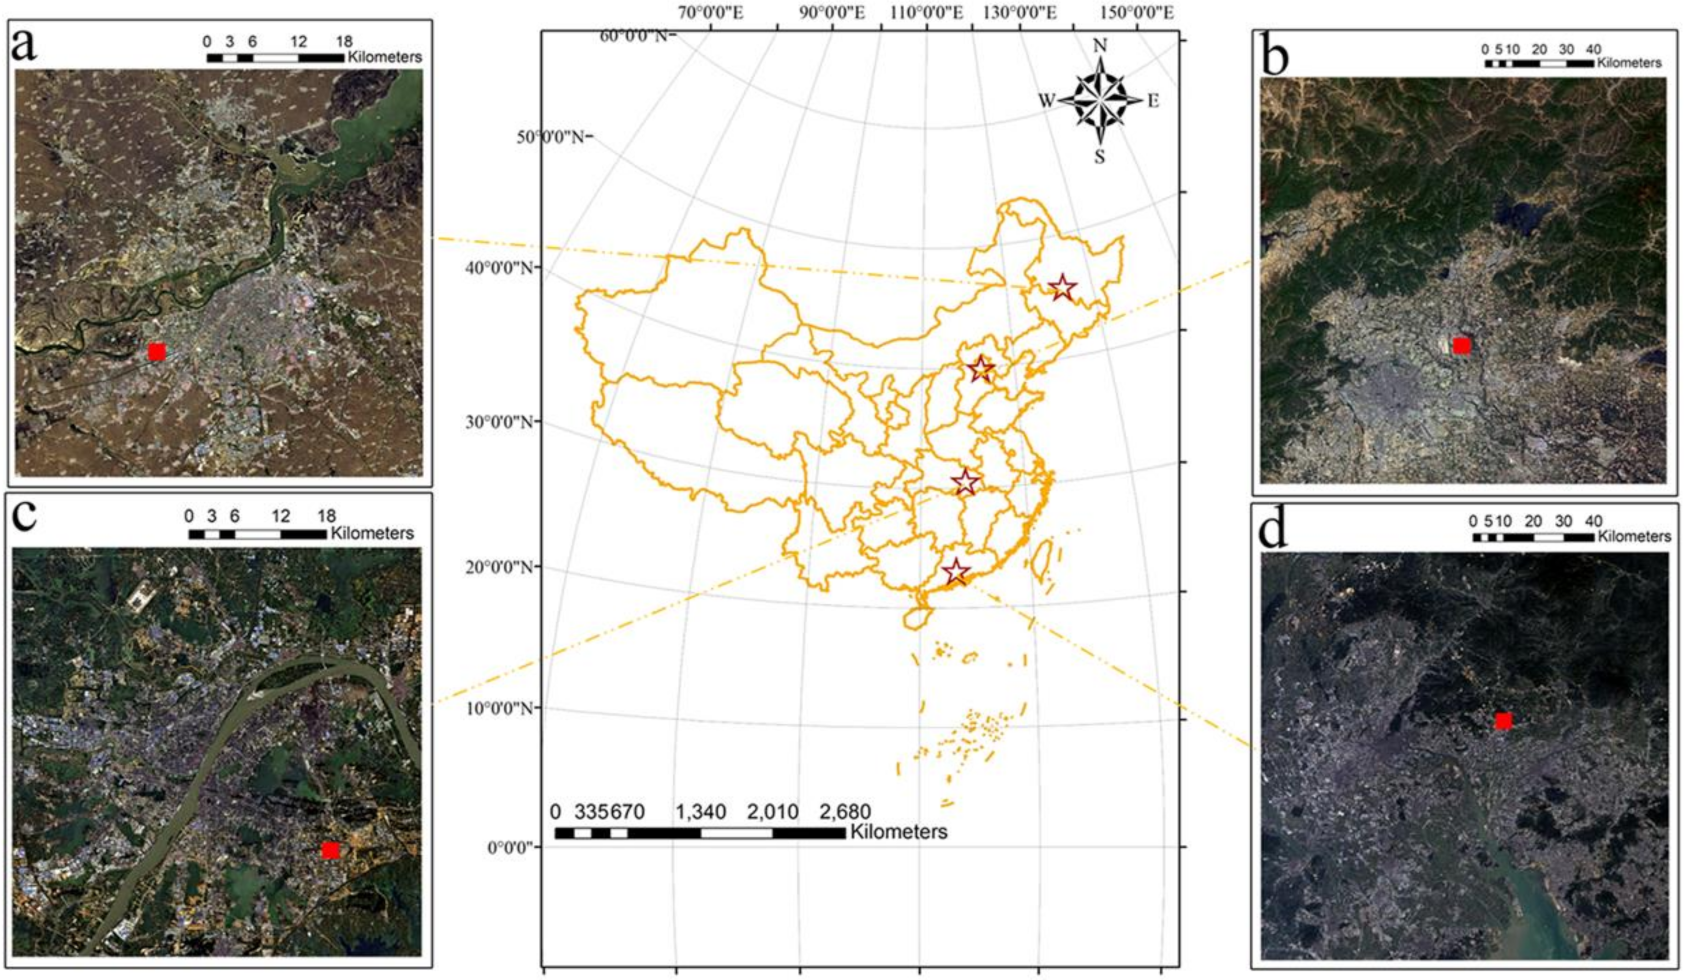
For comparative analysis, four cities (Harbin, Beijing, Wuhan, and Guangzhou) of China with different geographical environments are selected as study areas (Figure 3). Harbin (45°43′N, 126°38′E) is located in southern Heilongjiang, China, and there is an amount of farmland and bare soil around this city. Beijing (39°55′N, 116°22′E), the capital of China, is a highly developed city with very high impervious surface coverage. Wuhan (30° 33′N, 114°17′E), the center city of China, most of the area is plain and decorated with hills and a large number of lakes and ponds. Guangzhou (23° 06′N, 113°15′E), the center city in southern China with a high degree of urbanization, has a subtropical monsoon climate. Large areas of soil, water, and the urban regions are helpful for urban composition extraction analysis. Moreover, these four cities are located in different latitudes with varieties of land covers and different climates, making them suitable study sites for evaluating urban composition extraction methods. The Landsat-8 OLI images (earthexplorer.usgs.gov) that free of clouds were used in these four study areas at the spatial resolution of 30 m. All Landsat-8 images were calibrated to surface reflectance values by using the ENVI FLAASH module. Another four sub-scenes of the study areas (red rectangle in Figure 3) were selected for quantitative analysis. The high spatial resolution images (0.54 m) from Google Earth were used as the reference data. The acquisition dates of the reference data are close to that of Landsat-8 images, as shown in Table 2.

2.2. Urban Composition Index (UCI)

2.2.1. Principle and Development of UCI

The spectral curves of several typical urban composition samples are shown in Figure 4. From the blue to NIR bands, the reflectance of the ISA changes gently (slowly rising). In contrast, the changes in reflectance of soil and vegetation are relatively significant (continuously or sharply rising). Therefore, Tian et al. [31] select the blue and NIR as the feature bands to develop an index (PISI) for ISA mapping. Although PISI can extract ISA successfully with high accuracy, the water has a significant impact on the ISA extraction (red circle in Figure 5a), because some ISA and water have similar spectral characteristics in the visible and near-infrared region [44]. However, due to the strong absorption in the SWIR1 and SWIR2 bands, the reflectance of water decreases drastically. So the SWIR1 and SWIR2 bands can be selected to enhance water features and reduce interference with the ISA [26]. In fact, from NIR to the SWIR1 band, the reflectance of ISA still changes flat (slowly increase) while the change about the soil is more pronounced (sharply increase). However, from SWIR1 to the SWIR2 band, the reflectance of both ISA and soil starts to decrease, which is different from the previous pattern (from NIR to the SWIR1 band) and would reduce the differences between the ISA and soil. So, the blue and SWIR1 bands can be used to enhance the difference between the ISA and soil, as well as water (Figure 5b). However, the vegetation would be confused with dark ISA with only the blue and SWIR1 bands used (red circle in Figure 5b). Therefore, the NIR band is also selected as a feature band to enhance the vegetation characters.
Based on the spectral analysis above, we first define a virtual band ( F N I R , S W I R 1 ) which is a weighted sum of the NIR and SWIR1 bands, to enhance the features of the water and vegetation. Considering that the NIR band would attenuate the difference between the water and ISA, it is better to take the weight of the SWIR1 band higher than that of the NIR band for water. Since the high reflectance of vegetation in the NIR band, the characters of vegetation are still well enhanced with a lower weight of the NIR band. Therefore, we defined the weighted sum of the NIR and SWIR1 bands as follows:
F N I R , S W I R 1 = ρ N I R ρ S W I R 1 ρ N I R + ρ S W I R 1 + ρ S W I R 1 ρ N I R ρ N I R + ρ S W I R 1 = 2.0 ρ N I R ρ S W I R 1 ρ N I R + ρ S W I R 1
where ρ N I R is the reflectance of the NIR band and ρ S W I R 1 is the reflectance of the SWIR1 band. The weights of the NIR and SWIR1 bands are dynamically changed that avoids the setting of a fixed empirical parameter. Furthermore, the band with low reflectance has a larger weight than the higher one, which is very suitable for this study. Then, according to the distribution of different urban compositions in blue F N I R , S W I R 1 feature space (Figure 5c), we used the normalized difference form of the blue and virtual bands to construct the urban composition index:
U C I = ρ B l u e F N I R , S W I R 1 ρ B l u e + F N I R , S W I R 1
where ρ B l u e is the reflectance of blue band, F N I R , S W I R 1 is defined in Equation (1).

2.2.2. Threshold Analysis of UCI

In contrast to other single composition indices (e.g., NDVI, MNDWI, and NDBI), UCI is a multi-composition index that can separate the ISA, PSA, and water well (Figure 5c). So, once the extraction thresholds of each urban composition are determined, UCI can extract the three urban compositions (ISA, PSA, and water) simultaneously. Although some thresholding algorithms can be applied, such as OTSU [45], max entropy [46], minimum error [47], these algorithms are time-consuming, and the results are strongly related to the histogram distribution of samples. In this section, we tried to explore a semi-empirical threshold of UCI for urban compositions extraction. First, Equation (2) can be transformed as follows:
U C I = ρ B l u e / F N I R , S W I R 1 1.0 ρ B l u e / F N I R , S W I R 1 + 1.0
where F N I R , S W I R 1 is the function of the NIR and SWIR1 bands, defined in Equation (1). ρ B l u e is the reflectance of the blue band. In the blue F N I R , S W I R 1 feature space, when ρ B l u e / F N I R , S W I R 1 = tan θ , the Equation (3) can be simplified as follows:
U C I = t a n θ 1.0 t a n θ + 1.0   =   t a n θ π / 4
From the Figure 5c, we can approximately determine the distribution of PSA (vegetation and soil), ISA, and water in blue F N I R , S W I R 1 space (Figure 6). So, any given point P in blue F N I R , S W I R 1 feature space corresponds to a unique isoline, PO. If ∠POA = θ , U C I P O = t a n θ π / 4 . As shown in Figure 6, the PSA is close to the line OA, ISA is close to the line OB, the water is close to the line OC. Therefore, θ = π / 4 can be used to extract water in advance. Then, we use the bisector of ∠BOA to separate the ISA and PSA approximately, namely the line OD. Therefore, the upper threshold of UCI is:
t a n ( π / 4 π / 4 )   =   0.0
The lower threshold of UCI is:
t a n ( π / 8 π / 4 ) 0.414
Thus, samples falling in the interval (0.0, 1.0] can be discriminated as water, samples falling in the interval [−0.414, 0.0] can be discriminated as ISA, and samples falling in the interval [−1.0, −0.414) can be considered as PSA.

2.3. Comparative Analysis with Other Indices

To assess the performance of UCI in urban composition extraction, five indices, MNDWI, CBCI, PISI, BCI, and NDBI were selected for comparative analysis. It is worth noting that MNDWI, PISI, and NDBI are single composition indices that can only extract one urban composition (e.g., water or ISA), while BCI and CBCI are multi-composition indices that can extract multiple compositions of the urban. This comparative analysis was carried out at both the global scale and the urban scale. On the global scale, the selected global spectral samples (see Section 2.1) were used as the validation sets. On the urban scale, the validation sets were obtained by randomly selecting pure samples in the four experimental areas. Finally, we collected 1274 samples (ISA:436, PSA:406, Water:432) in Harbin, 1208 samples (ISA:436, PSA:535, Water:237) in Beijing, 1077 samples (ISA:433, PSA:492, Water:152) in Wuhan, and 1193 samples (ISA:478, PSA:501, Water:214) in Guangzhou.
By comparing to the single and multiple composition indices at different scales, it can provide a comprehensive analysis to UCI performance. The formulas of these indices are as follows:
M N D W I = ρ G r e e n ρ S W I R 1 ρ G r e e n + ρ S W I R 1
N D B I =   ρ S W I R 1 ρ N I R ρ S W I R 1 + ρ N I R
B C I =   H + L / 2 V H + L / 2 + V
P I S I = 0.8192 ρ B l u e 0.5735 ρ N I R + 0.0750
C B C I = A + 1 M B S I O S A V I + A
M B S I = 2.0 ρ R e d ρ G r e e n ρ R e d + ρ G r e e n 2.0
O S A V I = ρ N I R ρ R e d ρ N I R + ρ R e d + 0.16
where ρ B l u e , ρ G r e e n ,   ρ R e d ,   ρ N I R , and ρ S W I R 1 represent the reflectance of the blue, green, red, NIR, and SWIR1 bands, respectively. The H is the normalized TC1; L is the normalized TC3; V is the normalized TC2, where TC1, TC2, and TC3 are the first three Tasselled Cap transformation components. A is the correction factor, and 0.51 is selected as the optimal value for A [32].

2.3.1. Separability Analysis

To quantifying the separability between each urban composition among the different indices, the Jeffries–Matusita distance (J–M distance) [48] was used. The J–M distance with a greater value indicates higher separability between the two classes. Specifically, the J–M distance with a value less than 1.00 indicates poorly separable, and if the value is larger than 1.38, it indicates a high degree of separability [49]. The equations are as follows:
J M = 2 1 e B
B = 1 8 μ i μ j T [ ( C i + C j ) 2 ] 1 μ i μ j + 1 2 ln C i + C j 2 | C i | C j
where μ i and μ j are the mean vectors of two classes, C i and C j are the covariance matrix. μ i μ j T represents the transpose of the vector μ i μ j , C i 1 represents the inverse of the covariance matrix C i , | C i | represents the determination of the covariance matrix C i . In this study, the input data was single-band data, the covariance was replaced by variance.
For a comprehensive comparison, the JM values between the PSA and ISA ( J M P I ), ISA and water ( J M I W ), PSA and water ( J M P W ) in each index (UCI, PISI, CBCI, BCI, NDBI, and MNDWI) were calculated. On the global scale, since the number of the vegetation, soil, ISA and water samples are unbalanced, we randomly selected 250 samples from each of the four categories. So, there were 1000 samples in totals. Then, we repeated it 1000 times to calculate the mean JM values. On the urban scale, we adopted the pure samples selected from the study areas for analysis (see in Section 2.3).

2.3.2. Correlation Analysis with ISA Proportion

On the one hand, in the real urban environment, the mixing of ISA and PSA is predominantly the case and the mixing of water and other urban compositions only occurs at the boundary of surface water. On the other hand, one index cannot be linearly correlated with multiple (three or more) compositions at the same time. So, in this research, we restricted the application scene to a mixture of ISA and PSA and focused on the correlation analysis with ISA proportion.
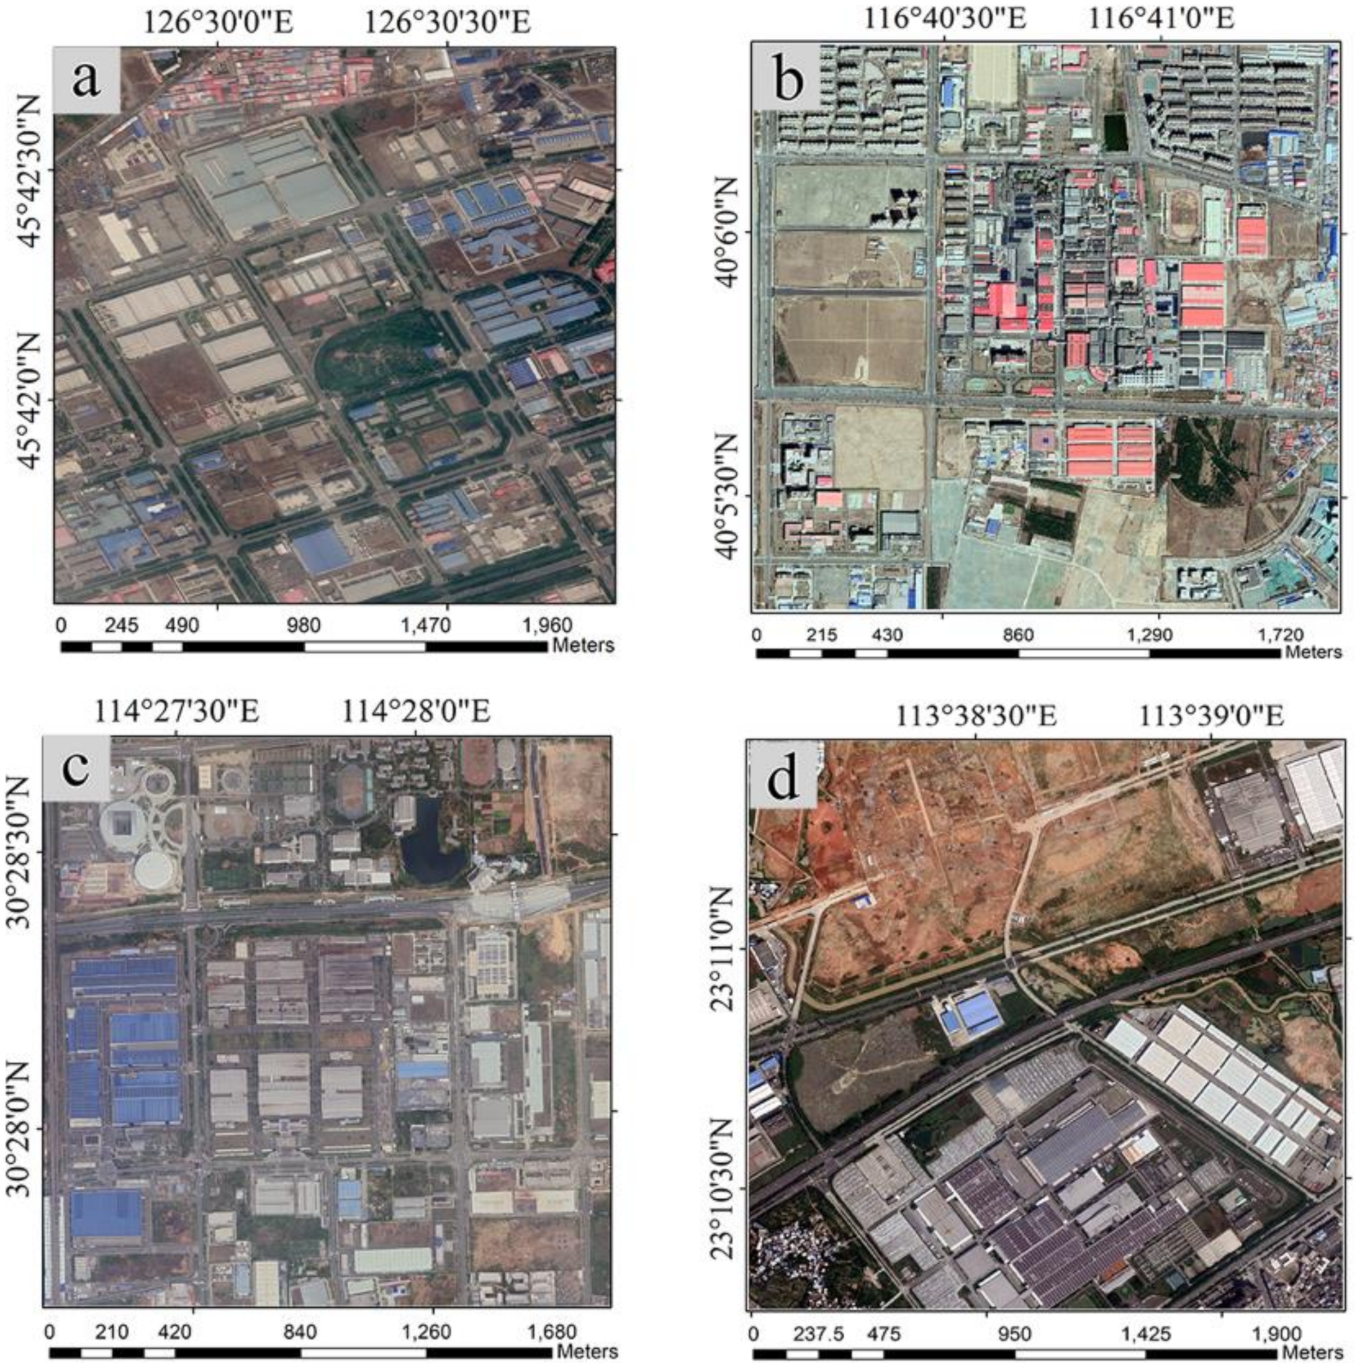
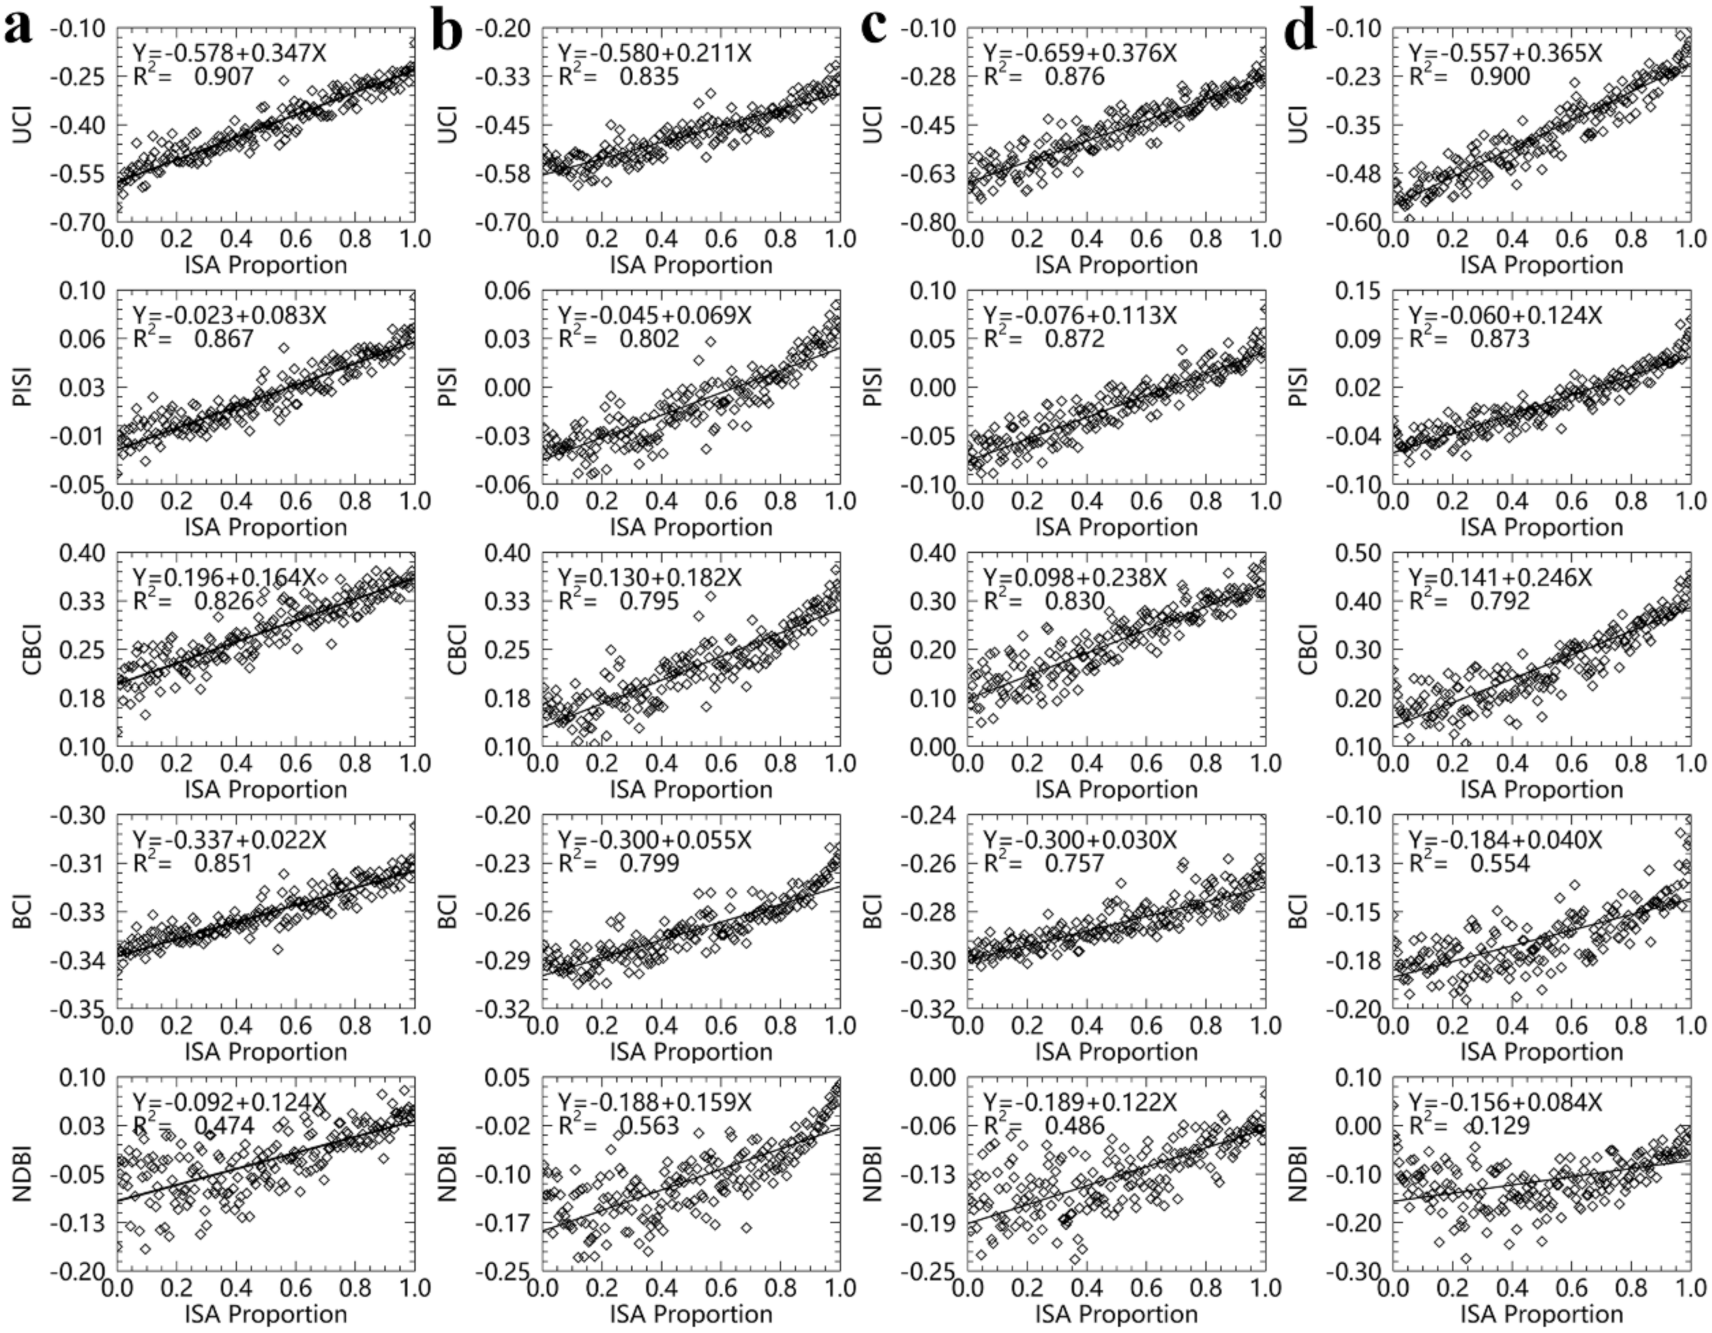
In this part, four sub-scenes of the study areas were selected to analyze the correlation between UCI and ISA abundance of the mixed pixels (red rectangle in Figure 3). Each sub-scene has different roofs (new, old, red, black, white, grey, etc.), which makes the correlation analysis more reliable (Figure 7). To analyze the correlation between UCI and ISA proportion, the corresponding Google Earth images with high resolution were used to determine the proportion of ISA in each pixel of Landsat-8 images in sub-scenes. By visual interpretation, the high-resolution images were classified into the water, PSA, and ISA, then the proportion of each land covers in the corresponding pixel of Landsat-8 images were calculated. To ensure the same number and uniform distribution of scatter points in each correlation plot, the continuous interval of ISA proportion (from 0 to 1.0) was divided into 200 units, then the mean index value in each unit was calculated. So, there are 200 points in each correlation plot.

2.3.3. Accuracy Assessment

Further comparisons were conducted by assessing the accuracy of urban compositions extraction. Considering that PISI and NDBI are proposed for ISA extraction while MNDWI is for water, we combined these single composition indices for urban compositions extraction. BCI can extract three urban compositions (vegetation, soil, and ISA), but the water is ignored. So, when applying the BCI for urban compositions extraction, the MNDWI was used to extract the water first. In this experiment, the proposed threshold [0.0126, 0.1462] of PISI was used for ISA extraction [31], and the value of MNDWI greater than 0 was considered to be water. Since NDBI, BCI, and CBCI do not have the suggested extraction threshold, the extraction thresholds of these indices were determined by iteration. For each threshold, the corresponding total errors were calculated. In detail, the total errors contain the errors that the target class is misclassified into other classes, and the other classes are misclassified into the target class. When the sum of the total errors was minimal, the optimal threshold was determined. To analyze the performance of the proposed semi-empirical thresholds for UCI, the overall accuracy (OA) and Kappa coefficient of the semi-empirical thresholds and iteration thresholds were all calculated.
Similarly, on the global scale, considering the unbalanced number of the vegetation, soil, ISA, and water samples, we randomly selected 250 samples from each of the four categories. So, there were 1000 samples in totals. Then, we repeated it 1000 times to calculate the mean values of the overall accuracy and Kappa coefficient. On the urban scale, we also adopted the pure samples selected from the study areas for analysis (see in Section 2.3).

3. Results

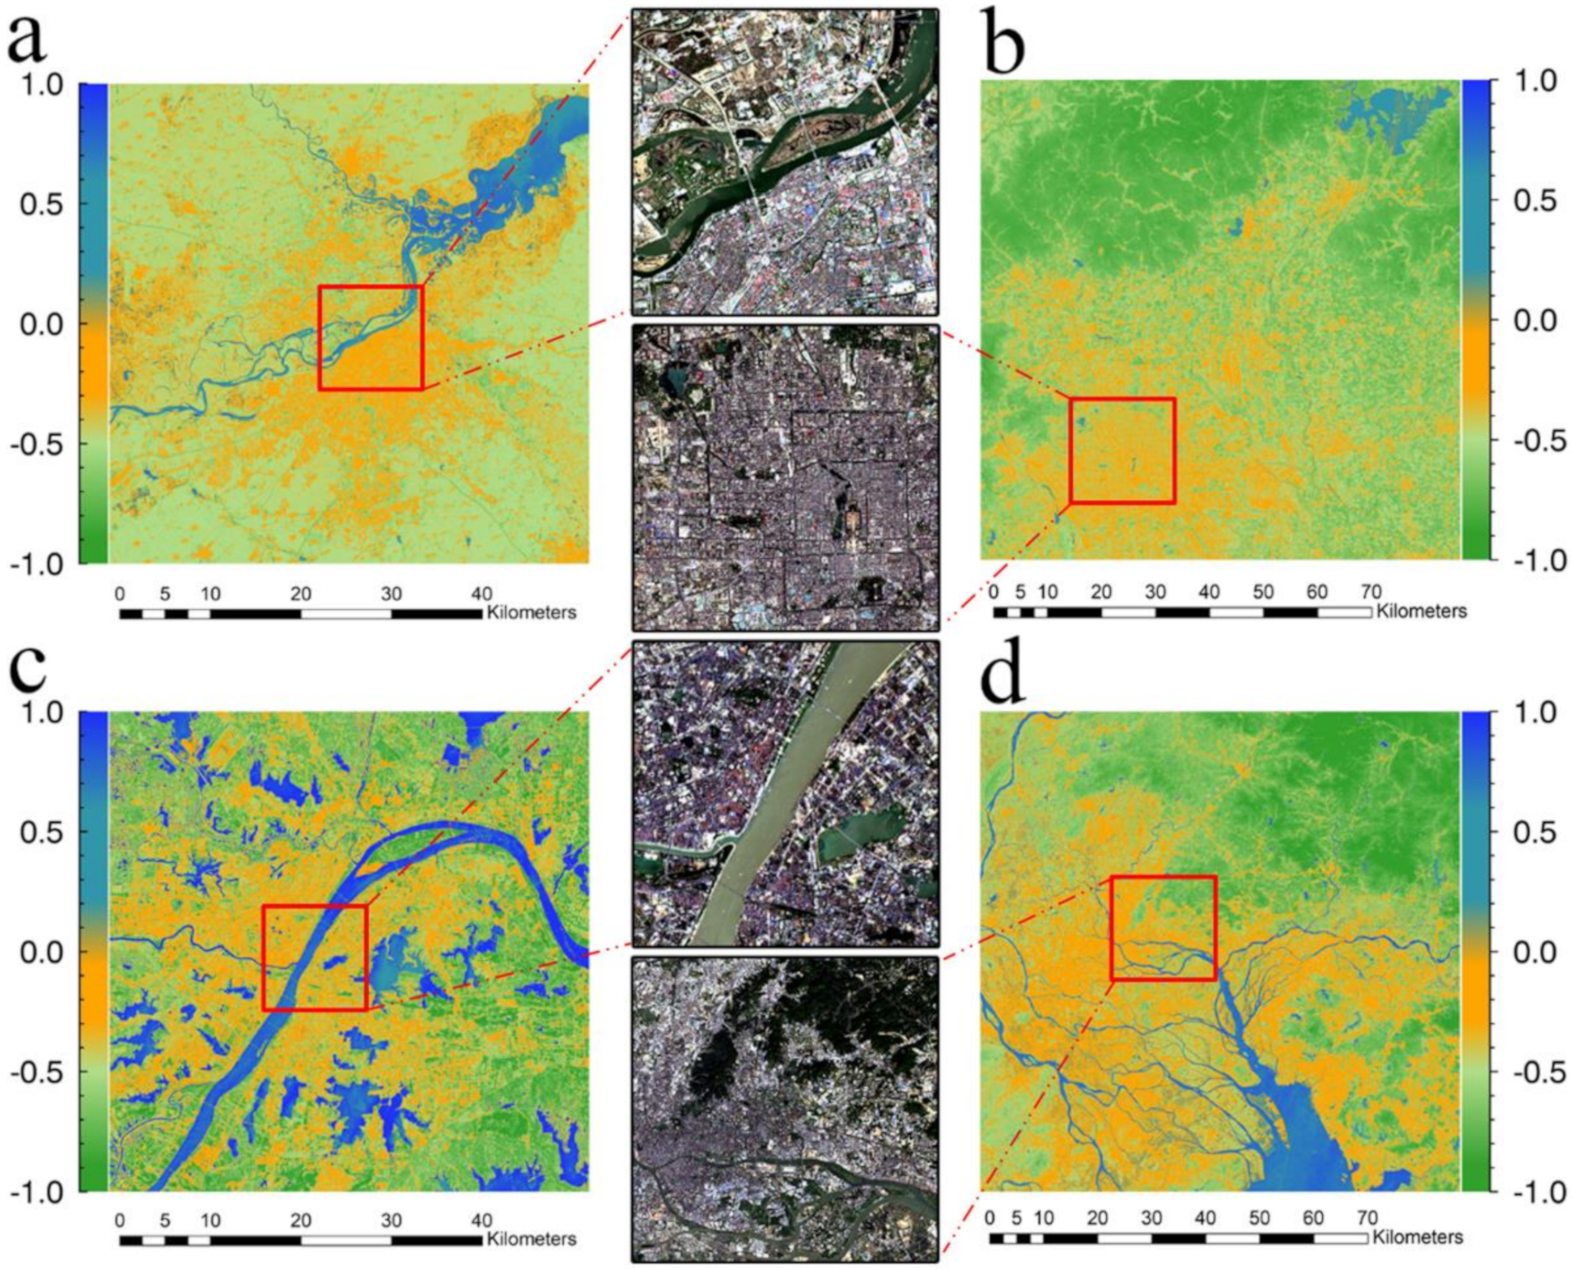
In order to analyze the performance of UCI in urban compositions extraction, we first mapped the Landsat-8 images with UCI (Figure 8). Then the comparative experiments were carried out on the global and urban scales, and the analyses of results were conducted from two aspects: comparison with multiple composition indices and comparison with single composition indices. To analyze the ability of each index in separating the urban compositions, the histograms of each urban composition in different indices were plotted in Figure 9, and the separation level was quantified by using JM distance (see Table 3, Table 4 and Table 5). In detail, the results of the separability between PSA and ISA were listed in Table 3, the results of the separability between ISA and water were listed in Table 4, and the results of the separability between PSA and water were listed in Table 5. The correlation with each index value and ISA proportion was shown in Figure 10. And the results of the accuracy assessment were listed in Table 6.

3.1. Applying UCI to Landsat-8 Images

UCI was applied to the Landsat-8 images of Harbin, Beijing, Wuhan, and Guangzhou cities of China by using Equation (2), and the results of the four cities are shown in Figure 8. For a better display, the results were rendered in different colors. The vegetation and soil areas are green (or light green) with a negative value, the water areas are blue (or light blue) with a positive value, and the ISA are orange with a negative value. For a simple verification, the true-color Landsat-8 images of the city center were displayed in Figure 8. Obviously, UCI can separate each urban composition well, and the UCI values of PSA, ISA, and water correspond to what has been analyzed in the threshold analysis (in Section 2.2.2).

3.2. Comparisons with Multiple Composition Indices

BCI and CBCI are recognized as multiple composition indices, which can extract multiple urban compositions simultaneously. However, the drawbacks of BCI and CBCI are also evident in the poor separability between each urban composition. As listed in Table 3, Table 4 and Table 5, the J M P I ,   J M I W , and J M P W values of BCI and CBCI are all less than UCI. In addition, BCI is based on the V-I-S model, so it cannot separate the water from other urban compositions which can be observed in Table 4 and Table 5, and Figure 9. Another worthy observation is that the distribution of each urban composition in BCI varies with the experimental areas (see the plots of BCI in Figure 9). It is because BCI needs to calculate the maximum and minimum values of the study areas for normalization, which makes the BCI less stable. Although CBCI can separate the water from other urban compositions, its overall accuracy and Kappa coefficient of urban compositions extraction on the urban and global scales are all lower than UCI (see Table 6). Compared to BCI and CBCI, UCI can extract multiple compositions with a higher degree of separation and has a higher correlation to ISA proportion (Figure 10). It is noteworthy that none of the BCI and CBCI are given thresholds for the urban composition extraction, which must be obtained in other ways. Though the optimal thresholds are obtained by iteration in this study, the overall accuracy and Kappa coefficients of BCI and CBCI on the urban and global scales are all lower than UCI, whether the semi-empirical threshold (except Wuhan) or iterative threshold is used for UCI. And from Table 6, it can be seen that the overall accuracies and Kappa coefficients of UCI by using the semi-empirical threshold are only slightly lower than using the iterative threshold. However, the iterative threshold is time-consuming and reliant on the quality of the training samples in practice. In addition, the iterative threshold is not feasible when there is no training sample. In this case, the semi-empirical threshold is more advantageous for practical applications. In a word, UCI is much better than BCI and CBCI no matter in urban compositions extraction or in the correlation with ISA proportion. And the semi-empirical threshold is reliable, which can be used as a reference in the real application.

3.3. Comparisons with Single Composition Indices

In this study, the NDBI, PISI, and MNDWI are recognized as single composition indices. NDBI is a classical ISA index, while PISI is an excellent ISA index proposed recently. However, NDBI cannot separate ISA and PSA well with significant overlap in the histograms of ISA and PSA in Figure 9. This observation is also supported by the lowest correlation coefficients in four cities (Figure 10) and the lower values of J M P I in Table 3 (all less than 1.0). So, even if an iterative threshold is used and using the MNDWI to extract the water first, the overall accuracy and Kappa coefficients of NDBI are low at both global and urban scales (Table 6). PISI has a higher correlation with ISA proportion than NDBI, but is a little lower than UCI, as shown in Figure 10. PISI can separate the ISA and PSA well in Beijing, Wuhan and Guangzhou with the J M P I values are greater than 1.0, but not well in Harbin and global spectral samples with the J M P I values are less than 1.0 (Table 3). Since PISI cannot separate the ISA and water well (see Figure 9), it must combine the MNDWI for urban compositions extraction. Furthermore, we find that the combination of PISI and MNDWI obtain a bad performance (OA: 67.11%, Kappa: 0.50) in Harbin (Table 6), which indicates that PISI is not applicable to the areas like Harbin, where there is much farmland. MNDWI is a famous water index, which can separate the water and other urban compositions well with the J M I W and J M P W values that are all closing to 2.0 (see Table 4 and Table 5). Because MNDWI focuses only on water extraction, it cannot separate ISA and PSA well with the J M P I values in Beijing, Wuhan, Guangzhou, and global spectral samples are all less than 1.0 (Table 3). UCI is better than PISI in separating ISA and PSA, with the highest J M P I values (Harbin: 1.60, Beijing: 1.37, Wuhan: 1.39, Guangzhou: 1.38, Global samples: 1.20) and highest correlation coefficients (Harbin: 0.907, Beijing: 0.835, Wuhan: 0.876, Guangzhou: 0.900). UCI is as good as MNDWI in water extraction, with the J M I W and J M P W values of UCI are all closing to 2.0 and just a little less than MNDWI (the differences are less than 0.1, see Table 4 and Table 5).
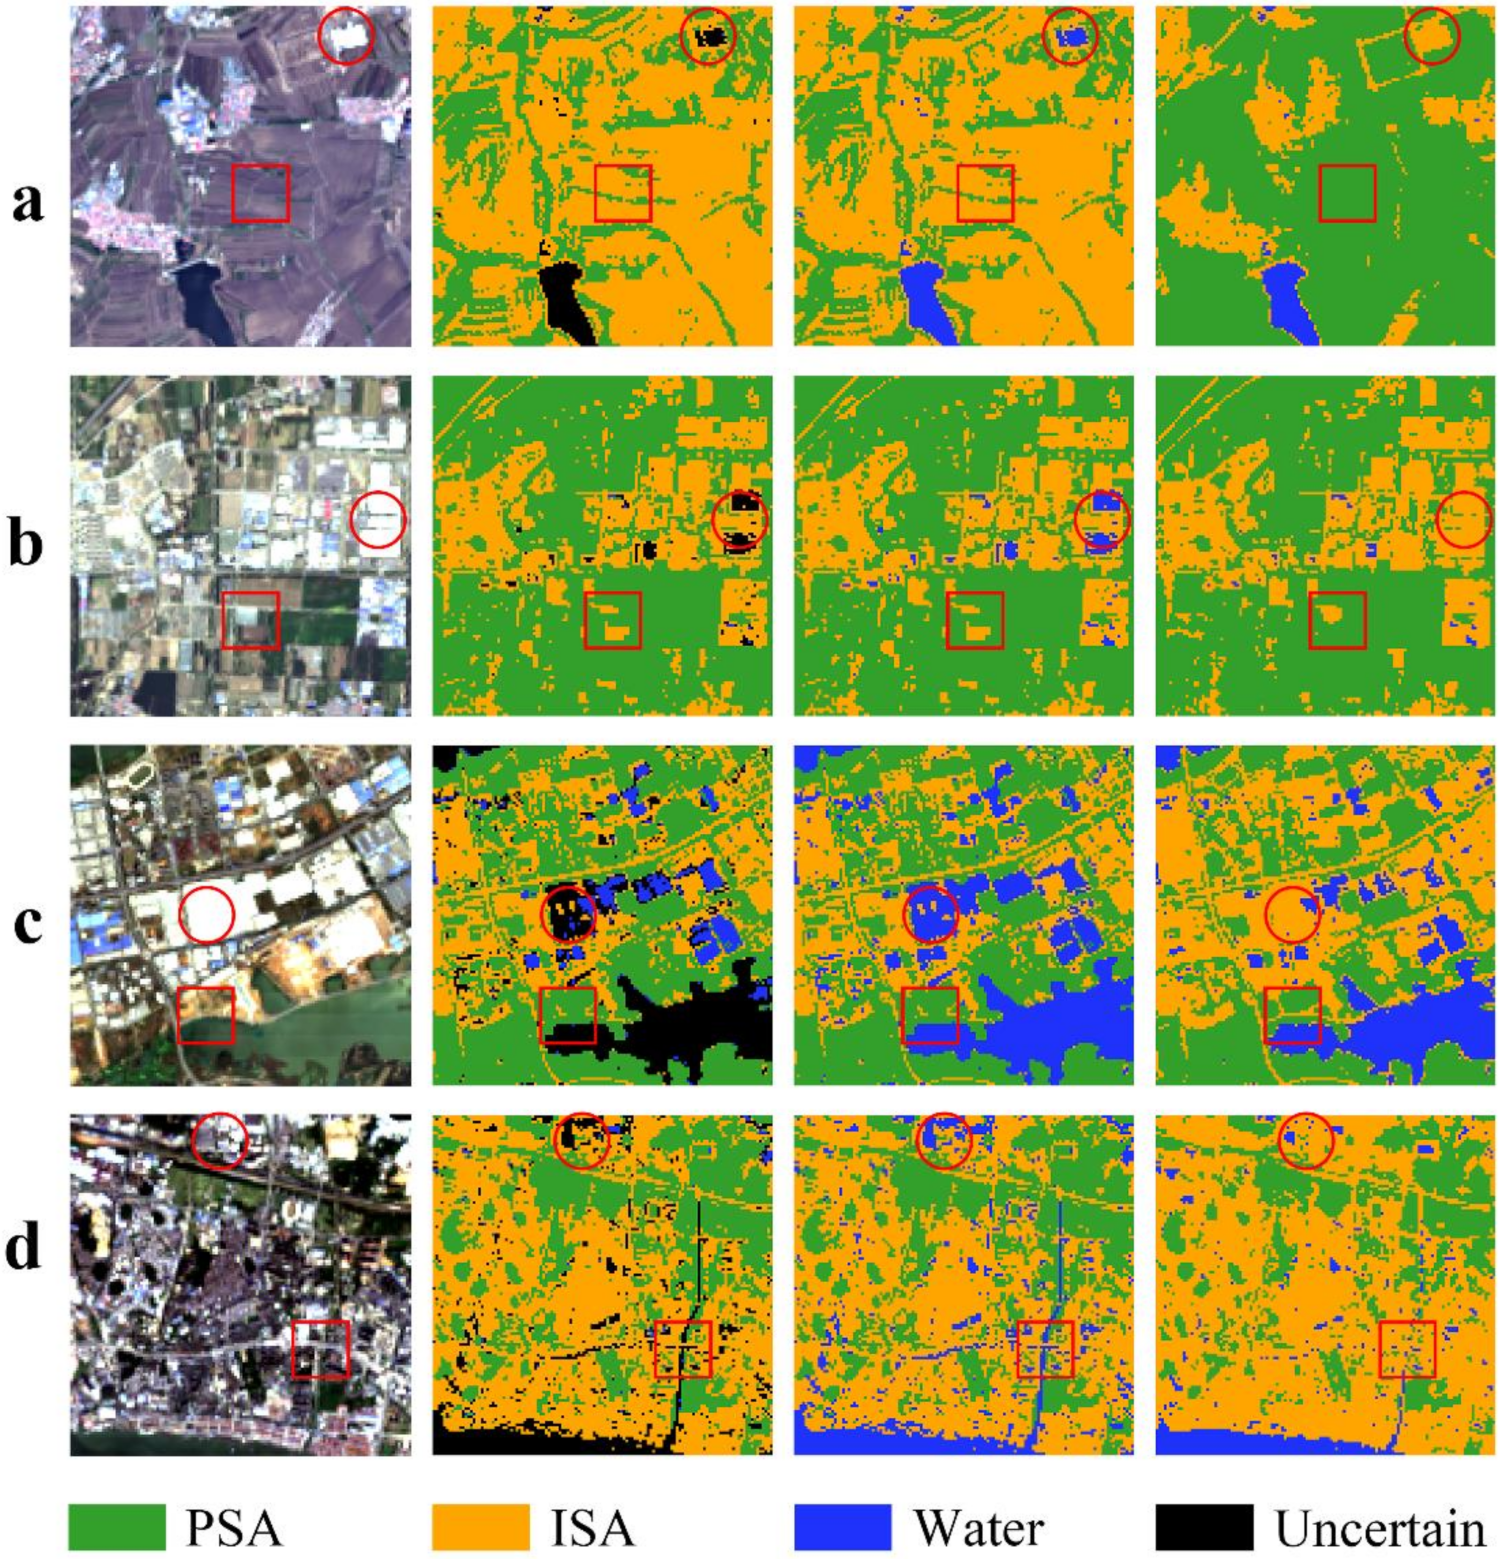
Though the combination of different indices may make up the defect that only one composition can be extracted from a single index, other problems are occurring. In this study, we carefully analyzed the extraction of urban compositions with the combination of PISI and MNDWI due to their good performance in ISA and water extraction. As shown in the second column of Figure 11, there are some overlapping regions in the extraction results of PISI and MNDWI, which makes it impossible to determine the category of these regions specifically (see the black regions). For further comparison analysis, the MNDWI extraction results were considered more credible than PISI in this study. Therefore, we extracted water with MNDWI firstly, then applied PISI to extract ISA, and the remaining region was considered as PSA. However, as shown in the third column of Figure 11 (red circle regions), MNDWI has limitations that some white roofs can be misclassified. As for PISI, it also has limitations in ISA extraction (red rectangle regions of Figure 11a–c). It indicates that the combination of the two indices does not guarantee the combination of their strengths, but weaknesses sometimes. For UCI, it has the advantages of these single composition indices and achieves better results in all four experimental areas shown in Figure 11. Although there are also cases of misclassification for UCI (some white roofs in Figure 11c and red circle and rectangle regions in Figure 11d), its total errors are much smaller than the combination of PISI and MNDWI. As listed in Table 6, even if the single composition indices are combined, they are still worse than UCI in urban compositions extraction.

4. Discussion

For better representation and monitoring of the urban environment, UCI was proposed based on the W-I-P model. The formulation of UCI was derived by analyzing the spectra of typical urban compositions and the distribution of ISA, soil, vegetation, and water in blue-NIR-SWIR1 feature space. Then, UCI was evaluated quantitatively compared with multiple and single composition index (PISI, NDBI, MNDWI, BCI, and CBCI) on the urban and global scales, respectively. The results indicated that UCI can extract three urban compositions (water, ISA, and PSA) with a higher degree of separability, overall accuracy, and Kappa coefficient. Additionally, UCI also had a higher correlation with ISA proportion, compared to PISI, NDBI, BCI, and CBCI. Obviously, UCI is an excellent index that has the advantages of those single and multiple composition indices, and provides a simple and efficient method for monitoring the dynamic change of land cover in urban environments. Furthermore, UCI was developed by analyzing the global spectral samples, which makes the UCI more robust. So, UCI can be used in various urban environments, not only in the four cities of China in our study. As shown in Figure 12, we also applied UCI to map four cities of America (New York, Saint Louis, Oklahoma, and Phoenix) and used the semi-empirical threshold to extract ISA. Besides, UCI can also serve as a convenient spectral enhancement method for urban land covers, which is helpful to other methods in land cover classification, endmember extraction, etc.
However, some aspects need to be clarified. First, the construction of the W-I-P model needs the support of Wentz’s work [35], we acknowledge the important insights from his work such as the deeper meaning of the W-I-P model which are illustrated in more details in his article. So, in this study, we focus our research and discussion on the index construction based on the W-I-P model. Second, due to the consideration of some experimental purposes and the consistency of acquisition date between Landsat-8 images and high-resolution images from Google Earth, the date of the Landsat-8 images in the four study areas are quite different. Therefore, the seasonal effect was not considered in our study, we just focused on the impact of different urban environments on urban compositions extraction. Third, the semi-empirical threshold proposed here should be used as the reference and need minor adjustments if you want to acquire the optimal precision in different urban scenes. Finally, UCI may not handle the mixed pixels with multiple compositions well, and it is more suitable in urban environments where the mixing of PSA and ISA is predominantly the case.
In this study, UCI was developed by analyzing the global spectral samples selected from Landsat imagery, and the experiments and threshold selection were all based on Landsat imagery. So, in future work, we will explore the application of UCI in other remote sensing imagery (e.g., Sentinel 2A/B imagery). In addition, UCI is based on the W-I-P model and divides the urban environments into three compositions (PSA, ISA, and water) which is closely related to the urban hydrological model and the urban water cycle [50,51,52,53]. So, we will not only explore the potential application of UCI in monitoring the dynamic change of urban composition but also in urban hydrological modeling and urban water cycle analysis.

5. Conclusions

With the increasing concern about urbanization issues, it is critical to develop a simple and excellent spectral index to extract urban compositions. In this study, based on the W-I-P model, we selected the blue, NIR, and SWIR1 bands as feature bands after analyzing the global spectral samples, and then we proposed an urban composition index (UCI) and suggested the semi-empirical threshold of UCI. The experimental results showed that UCI had the highest correlation with ISA proportion, and was of the optimal separability between each urban composition (ISA, PSA, and water), and could achieve the highest overall accuracy and Kappa coefficient in urban compositions extraction on the urban and global scale compared with either the single composition indices (PISI, NDBI, and MNDWI) or the multiple composition indices (BCI and CBCI). Furthermore, the proposed semi-empirical threshold was proved to be reliable and can be a reference for practical applications. In addition, UCI did not need other pre-treatments except atmospheric correction. So, we believed that UCI would have great potential for urban compositions mapping dynamically, or other applications like urban hydrological modeling, and urban water cycle analysis.

Author Contributions

Conceptualization, L.Z. and Y.T.; formal analysis, L.Z.; funding acquisition, Y.T.; methodology, L.Z. and Y.T.; resources, Y.T.; Validation, L.Z., Y.T. and Q.L.; writing—original draft, L.Z.; writing—review and editing, Y.T. and Q.L. All authors have read and agreed to the published version of the manuscript.

Funding

This research was funded by the Ministry of Science and Technology of the People’s Republic of China, grant number 2018YFB1004604.

Acknowledgments

This research was partially supported by the School of Geography and Information Engineering, China University of Geosciences, Wuhan, China. And we wish to thank the Finer Resolution Observation and Monitoring of Global Land Cover (FROM-GLC) for the global validation dataset support.

Conflicts of Interest

The authors declare no conflict of interest.

References

  1. Antrop, M. Landscape change and the urbanization process in Europe. Landsc. Urban Plan. 2004, 67, 9–26. [Google Scholar] [CrossRef]
  2. Harbor, J.M. A practical method for estimating the impact of land-use change on surface runoff, groundwater recharge and wetland hydrology. J. Am. Plan. Assoc. 1994, 60, 95–108. [Google Scholar] [CrossRef]
  3. Weng, Q. Remote sensing of impervious surfaces in the urban areas: Requirements, methods, and trends. Remote Sens. Environ. 2012, 117, 34–49. [Google Scholar] [CrossRef]
  4. Xian, G.; Crane, M. An analysis of urban thermal characteristics and associated land cover in Tampa Bay and Las Vegas using Landsat satellite data. Remote Sens. Environ. 2006, 104, 147–156. [Google Scholar] [CrossRef]
  5. Xu, H. Analysis of impervious surface and its impact on urban heat environment using the normalized difference impervious surface index (NDISI). Photogramm. Eng. Remote Sens. 2010, 76, 557–565. [Google Scholar] [CrossRef]
  6. Yan, Y.; Zhang, C.; Hu, Y.; Kuang, W. Urban land-cover change and its impact on the ecosystem carbon storage in a dryland city. Remote Sens. 2016, 8, 6. [Google Scholar] [CrossRef] [Green Version]
  7. Sexton, J.O.; Song, X.-P.; Huang, C.; Channan, S.; Baker, M.E.; Townshend, J.R. Urban growth of the Washington, DC—Baltimore, MD metropolitan region from 1984 to 2010 by annual, Landsat-based estimates of impervious cover. Remote Sens. Environ. 2013, 129, 42–53. [Google Scholar] [CrossRef]
  8. Song, X.-P.; Sexton, J.O.; Huang, C.; Channan, S.; Townshend, J.R. Characterizing the magnitude, timing and duration of urban growth from time series of Landsat-based estimates of impervious cover. Remote Sens. Environ. 2016, 175, 1–13. [Google Scholar] [CrossRef]
  9. Yu, S.; Sun, Z.; Guo, H.; Zhao, X.; Sun, L.; Wu, M. Monitoring and analyzing the spatial dynamics and patterns of megacities along the Maritime Silk Road. J. Remote Sens. 2017, 21, 169–181. [Google Scholar] [CrossRef]
  10. Zhang, L.; Weng, Q. Annual dynamics of impervious surface in the Pearl River Delta, China, from 1988 to 2013, using time series Landsat imagery. ISPRS J. Photogramm. Remote Sens. 2016, 113, 86–96. [Google Scholar] [CrossRef]
  11. Im, J.; Lu, Z.; Rhee, J.; Quackenbush, L.J. Impervious surface quantification using a synthesis of artificial immune networks and decision/regression trees from multi-sensor data. Remote Sens. Environ. 2012, 117, 102–113. [Google Scholar] [CrossRef]
  12. Lu, D.; Moran, E.; Hetrick, S. Detection of impervious surface change with multitemporal Landsat images in an urban-rural frontier. ISPRS J. Photogramm. Remote Sens. 2011, 66, 298–306. [Google Scholar] [CrossRef] [PubMed] [Green Version]
  13. Hu, X.; Weng, Q. Estimating impervious surfaces from medium spatial resolution imagery using the self-organizing map and multi-layer perceptron neural networks. Remote Sens. Environ. 2009, 113, 2089–2102. [Google Scholar] [CrossRef]
  14. Mohapatra, R.P.; Wu, C. High resolution impervious surface estimation. Photogramm. Eng. Remote Sens. 2010, 76, 1329–1341. [Google Scholar] [CrossRef] [Green Version]
  15. Bhaskaran, S.; Paramananda, S.; Ramnarayan, M. Per-pixel and object-oriented classification methods for mapping urban features using Ikonos satellite data. Appl. Geogr. 2010, 30, 650–665. [Google Scholar] [CrossRef]
  16. Richards, J.A.; Richards, J. Remote Sensing Digital Image Analysis; Springer: Berlin/Heidelberg, Germany, 1999; Volume 3. [Google Scholar]
  17. Turker, M.; Koc-San, D. Building extraction from high-resolution optical spaceborne images using the integration of support vector machine (SVM) classification, Hough transformation and perceptual grouping. Int. J. Appl. Earth Obs. Geoinf. 2015, 34, 58–69. [Google Scholar] [CrossRef]
  18. Sun, Z.; Guo, H.; Li, X.; Lu, L.; Du, X. Estimating urban impervious surfaces from Landsat-5 TM imagery using multilayer perceptron neural network and support vector machine. J. Appl. Remote Sens. 2011, 5, 053501. [Google Scholar] [CrossRef]
  19. Zhang, X.; Du, S. A linear dirichlet mixture model for decomposing scenes: Application to analyzing urban functional zonings. Remote Sens. Environ. 2015, 169, 37–49. [Google Scholar] [CrossRef]
  20. Franke, J.; Roberts, D.A.; Halligan, K.; Menz, G. Hierarchical multiple endmember spectral mixture analysis (MESMA) of hyperspectral imagery for urban environments. Remote Sens. Environ. 2009, 113, 1712–1723. [Google Scholar] [CrossRef]
  21. Powell, R.L.; Roberts, D.A.; Dennison, P.E.; Hess, L.L. Sub-pixel mapping of urban land cover using multiple endmember spectral mixture analysis: Manaus, Brazil. Remote Sens. Environ. 2007, 106, 253–267. [Google Scholar] [CrossRef]
  22. Roberts, D.A.; Gardner, M.; Church, R.; Ustin, S.; Scheer, G.; Green, R. Mapping chaparral in the Santa Monica Mountains using multiple endmember spectral mixture models. Remote Sens. Environ. 1998, 65, 267–279. [Google Scholar] [CrossRef]
  23. Ridd, M.K. Exploring a VIS (vegetation-impervious surface-soil) model for urban ecosystem analysis through remote sensing: Comparative anatomy for cities. Int. J. Remote Sens. 1995, 16, 2165–2185. [Google Scholar] [CrossRef]
  24. Estoque, R.C.; Murayama, Y. Classification and change detection of built-up lands from Landsat-7 ETM+ and Landsat-8 OLI/TIRS imageries: A comparative assessment of various spectral indices. Ecol. Indic. 2015, 56, 205–217. [Google Scholar] [CrossRef]
  25. McFeeters, S.K. The use of the Normalized Difference Water Index (NDWI) in the delineation of open water features. Int. J. Remote Sens. 1996, 17, 1425–1432. [Google Scholar] [CrossRef]
  26. Xu, H. Modification of normalised difference water index (NDWI) to enhance open water features in remotely sensed imagery. Int. J. Remote Sens. 2006, 27, 3025–3033. [Google Scholar] [CrossRef]
  27. Rouse, J.W., Jr.; Haas, R.; Schell, J.; Deering, D. Monitoring vegetation systems in the Great Plains with ERTS. NASA Spec. Publ. 1973, 351, 309. [Google Scholar]
  28. Zha, Y.; Gao, J.; Ni, S. Use of normalized difference built-up index in automatically mapping urban areas from TM imagery. Int. J. Remote Sens. 2003, 24, 583–594. [Google Scholar] [CrossRef]
  29. Deng, C.; Wu, C. BCI: A biophysical composition index for remote sensing of urban environments. Remote Sens. Environ. 2012, 127, 247–259. [Google Scholar] [CrossRef]
  30. Sun, Z.; Wang, C.; Guo, H.; Shang, R. A modified normalized difference impervious surface index (MNDISI) for automatic urban mapping from Landsat imagery. Remote Sens. 2017, 9, 942. [Google Scholar] [CrossRef] [Green Version]
  31. Tian, Y.; Chen, H.; Song, Q.; Zheng, K. A novel index for impervious surface area mapping: Development and validation. Remote Sens. 2018, 10, 1521. [Google Scholar] [CrossRef] [Green Version]
  32. Zhang, S.; Yang, K.; Li, M.; Ma, Y.; Sun, M. Combinational Biophysical Composition Index (CBCI) for Effective Mapping Biophysical Composition in Urban Areas. IEEE Access 2018, 6, 41224–41237. [Google Scholar] [CrossRef]
  33. Chen, J.; Yang, K.; Chen, S.; Yang, C.; Zhang, S.; He, L. Enhanced normalized difference index for impervious surface area estimation at the plateau basin scale. J. Appl. Remote Sens. 2019, 13, 016502. [Google Scholar] [CrossRef] [Green Version]
  34. Kauth, R.J.; Thomas, G. The tasselled cap—A graphic description of the spectral-temporal development of agricultural crops as seen by Landsat. In Proceedings of the LARS Symposia, Purdue University, West Lafayette, IN, USA, 29 June–1 July 1976; p. 159. [Google Scholar]
  35. Wentz, E.A.; York, A.M.; Alberti, M.; Conrow, L.; Fischer, H.; Inostroza, L.; Jantz, C.; Pickett, S.T.; Seto, K.C.; Taubenbock, H. Six fundamental aspects for conceptualizing multidimensional urban form: A spatial mapping perspective. Landsc. Urban Plan. 2018, 179, 55–62. [Google Scholar] [CrossRef]
  36. Zhou, W.; Pickett, S.T.A.; Cadenasso, M.L. Shifting concepts of urban spatial heterogeneity and their implications for sustainability. Landsc. Ecol. 2017, 32, 15–30. [Google Scholar] [CrossRef]
  37. Ng, E.; Chen, L.; Wang, Y.; Yuan, C. A study on the cooling effects of greening in a high-density city: An experience from Hong Kong. Build. Environ. 2012, 47, 256–271. [Google Scholar] [CrossRef]
  38. Zhao, Y.; Gong, P.; Yu, L.; Hu, L.; Li, X.; Li, C.; Zhang, H.; Zheng, Y.; Wang, J.; Zhao, Y.; et al. Towards a common validation sample set for global land-cover mapping. Int. J. Remote Sens. 2014, 35, 4795–4814. [Google Scholar] [CrossRef]
  39. Gorelick, N.; Hancher, M.; Dixon, M.; Ilyushchenko, S.; Thau, D.; Moore, R. Google Earth Engine: Planetary-scale geospatial analysis for everyone. Remote Sens. Environ. 2017, 202, 18–27. [Google Scholar] [CrossRef]
  40. Scrucca, L.; Fop, M.; Murphy, T.B.; Raftery, A.E. mclust 5: Clustering, Classification and Density Estimation Using Gaussian Finite Mixture Models. R J. 2016, 8, 289–317. [Google Scholar] [CrossRef] [Green Version]
  41. Kokaly, R.F.; Clark, R.N.; Swayze, G.A.; Livo, K.E.; Hoefen, T.M.; Pearson, N.C.; Wise, R.A.; Benzel, W.M.; Lowers, H.A.; Driscoll, R.L.; et al. USGS Spectral Library Version 7; No. 1035; US Geological Survey: Reston, VA, USA, 2017; p. 68.
  42. Herold, M.; Gardner, M.E.; Roberts, D.A. Spectral resolution requirements for mapping urban areas. IEEE Trans. Geosci. Remote Sens. 2003, 41, 1907–1919. [Google Scholar] [CrossRef] [Green Version]
  43. Herold, M.; Roberts, D.A.; Gardner, M.E.; Dennison, P.E. Spectrometry for urban area remote sensing—Development and analysis of a spectral library from 350 to 2400 nm. Remote Sens. Environ. 2004, 91, 304–319. [Google Scholar] [CrossRef]
  44. Ben-Dor, E.; Levin, N.; Saaroni, H. A spectral based recognition of the urban environment using the visible and near-infrared spectral region (0.4–1.1 µm). A case study over Tel-Aviv, Israel. Int. J. Remote Sens. 2001, 22, 2193–2218. [Google Scholar] [CrossRef]
  45. Otsu, N. A threshold selection method from gray-level histograms. IEEE Trans. Syst. ManCybern. 1979, 9, 62–66. [Google Scholar] [CrossRef] [Green Version]
  46. Kapur, J.N.; Sahoo, P.K.; Wong, A.K. A new method for gray-level picture thresholding using the entropy of the histogram. Comput. Vis. Graph. Image Process. 1985, 29, 273–285. [Google Scholar] [CrossRef]
  47. Kittler, J.; Illingworth, J. Minimum error thresholding. Pattern Recognit. 1986, 19, 41–47. [Google Scholar] [CrossRef]
  48. Swain, P.H.; Davis, S.M. Remote sensing: The quantitative approach. IEEE Trans. Pattern Anal. Mach. Intell. 1981, 10, 713–714. [Google Scholar] [CrossRef]
  49. Thomas, I.L.; Ching, N.P.; Benning, V.M.; D’Aguanno, J.A. Review Article A review of multi-channel indices of class separability. Int. J. Remote Sens. 1987, 8, 331–350. [Google Scholar] [CrossRef]
  50. Dams, J.; Dujardin, J.; Reggers, R.; Bashir, I.; Canters, F.; Batelaan, O. Mapping impervious surface change from remote sensing for hydrological modeling. J. Hydrol. 2013, 485, 84–95. [Google Scholar] [CrossRef]
  51. Eshtawi, T.; Evers, M.; Tischbein, B. Quantifying the impact of urban area expansion on groundwater recharge and surface runoff. Hydrol. Sci. J. 2016, 61, 826–843. [Google Scholar] [CrossRef]
  52. Li, C.; Sun, G.; Caldwell, P.V.; Cohen, E.; Fang, Y.; Zhang, Y.; Oudin, L.; Sanchez, G.M.; Meentemeyer, R.K. Impacts of Urbanization on Watershed Water Balances Across the Conterminous United States. Water Resour. Res. 2020, 56, 1–20. [Google Scholar] [CrossRef]
  53. Salvadore, E.; Bronders, J.; Batelaan, O. Hydrological modelling of urbanized catchments: A review and future directions. J. Hydrol. 2015, 529, 62–81. [Google Scholar] [CrossRef]
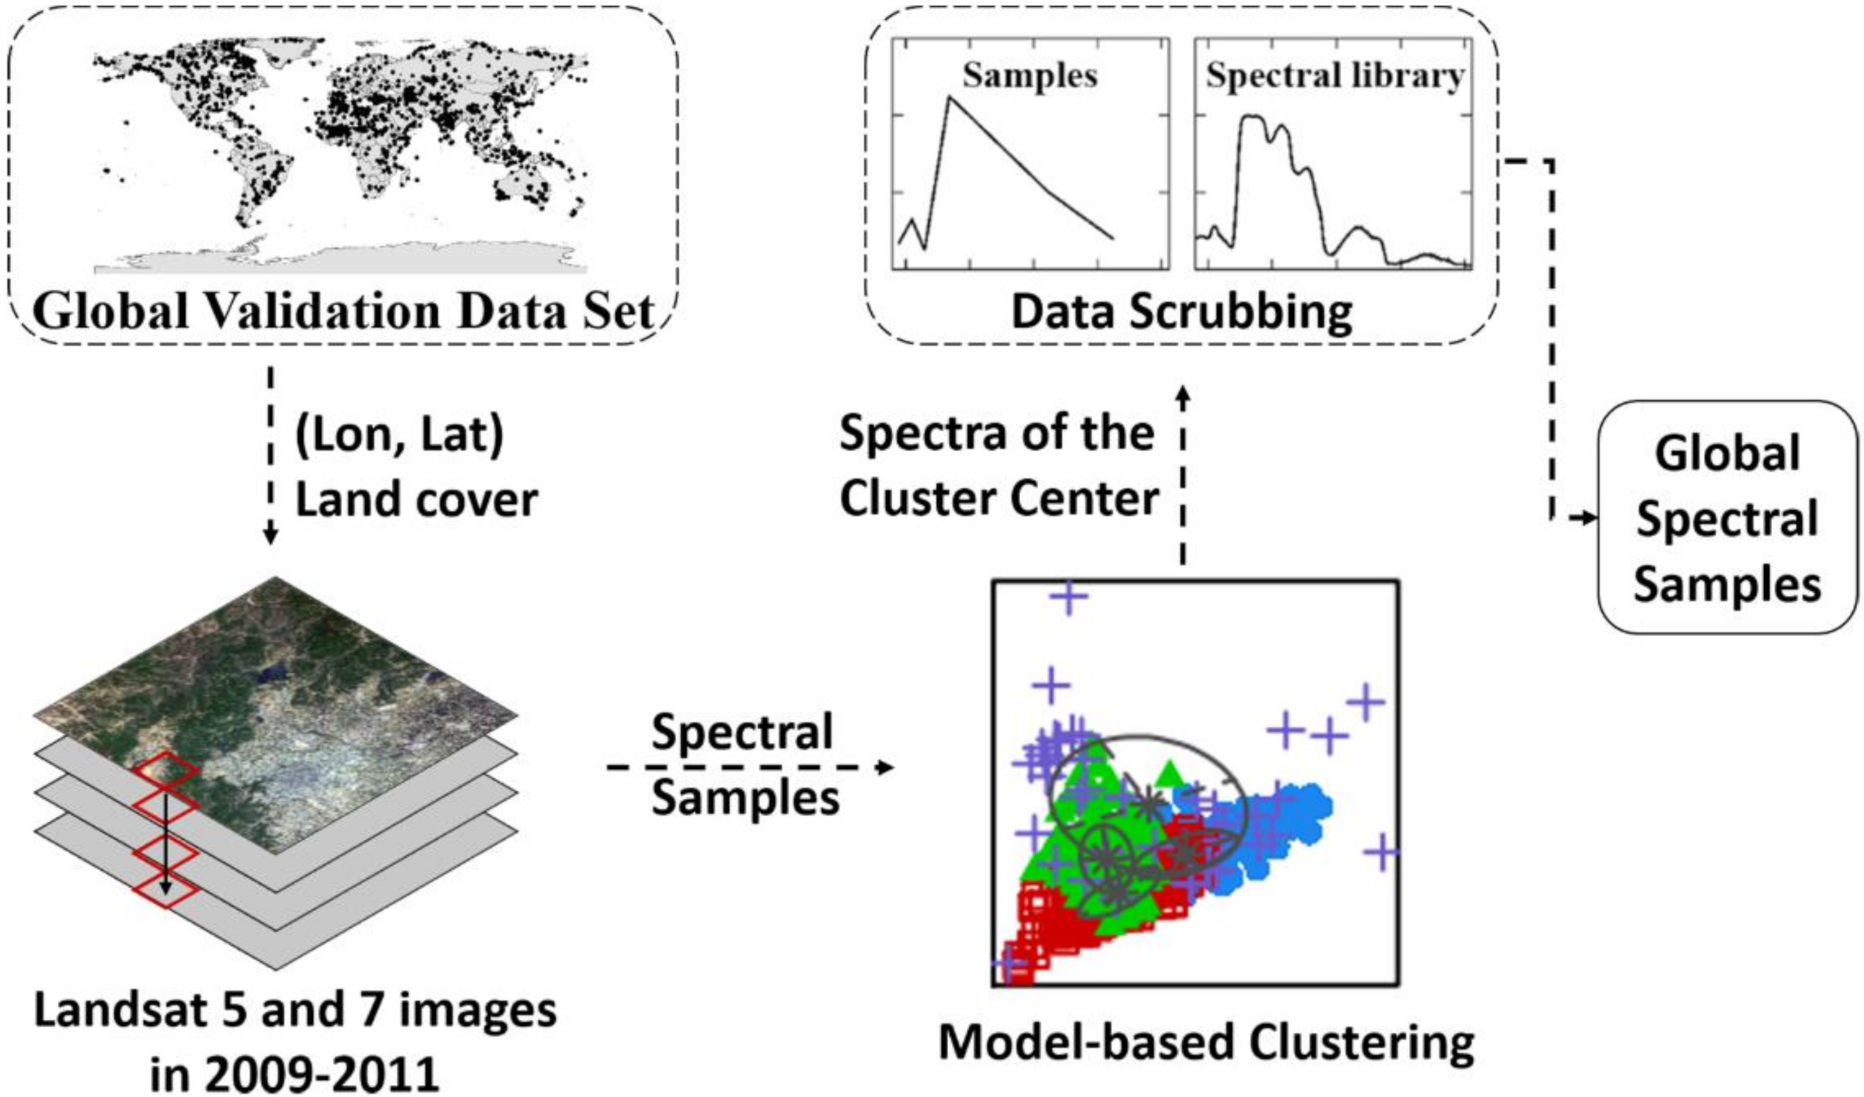
Figure 1. The process of generating the global spectral samples.
Remotesensing 13 00003 g001
Figure 2. The number and distribution of the global spectral samples.
Remotesensing 13 00003 g002
Figure 3. Four study areas: Harbin (a), Beijing (b), Wuhan (c), and Guangzhou (d). The red rectangle in each image was selected for the sub-scene analysis.
Remotesensing 13 00003 g003
Figure 4. Spectral curves of typical urban compositions. Different curves in each plot represent the different spectral of each urban composition in the global spectral samples. The true color images are the Google Earth images of the typical urban compositions in each plot.
Remotesensing 13 00003 g004
Figure 5. The spectral samples in three feature spaces: blue-NIR (a), blue-SWIR1 (b), and blue F N I R , S W I R 1 (c). The red dash lines are the diagonal of each plane.
Remotesensing 13 00003 g005
Figure 6. The conceptual graph about the distribution of PSA, ISA, and water in ρ B l u e F N I R , S W I R 1 feature space. The quadrilateral OABC is square. The red dash line OB is the diagonal of the plane, and the red dash line OD is the angle bisector of ∠BOA. P is an any given point in the space, and ∠POA = θ .
Remotesensing 13 00003 g006
Figure 7. High-resolution images of the sub-scenes. (ad) are the sub-scenes selected from Harbin, Beijing, Wuhan, and Guangzhou, respectively (red rectangle in Figure 3).
Remotesensing 13 00003 g007
Figure 8. Applying urban composition index (UCI) to Landsat-8 images of four cities: Harbin (a), Beijing (b), Wuhan (c), and Guangzhou (d). The true-color images are Landsat-8 images corresponding to the red rectangle areas in UCI images of four cities.
Remotesensing 13 00003 g008
Figure 9. The distribution of different land covers in UCI, PISI, CBCI, BCI, NDBI, and MNDWI: Harbin (a) Beijing (b), Wuhan (c), and Guangzhou (d).
Remotesensing 13 00003 g009
Figure 10. The correlation analysis of UCI, PISI, CBCI, BCI, and NDBI in four sub-scenes: Harbin (a), Beijing (b), Wuhan (c), and Guangzhou (d). There are 200 points in each plot, and the correlation coefficients ( R 2 ) are calculated, respectively.
Remotesensing 13 00003 g010
Figure 11. The visual comparison of UCI and the combination of PISI and MNDWI about urban compositions extraction in four cities: Harbin (a), Beijing (b), Wuhan (c), and Guangzhou (d). The first column is the true-color images of Landsat-8 images (size: 126 × 126 pixels). The second column is the result of the combination of PISI and MNDWI with the overlapping areas are identified as uncertain areas. The third column is the results of the combination of PISI and MNDWI, and the uncertain areas are identified as water by MNDWI. The last column is the results of UCI by using the semi-empirical threshold.
Remotesensing 13 00003 g011
Figure 12. Applying UCI to Landsat-8 images of four cities in America: New York (a), Saint Louis (b), Oklahoma (c), and Phoenix (d). The first column is the true-color images of Landsat-8 images, the second column is the UCI images rendered in different colors, and the last column is the ISA extraction results by using the semi-empirical threshold.
Remotesensing 13 00003 g012
Table 1. Some typical spectral indices used in urban compositions extraction.
IndexDescriptionUrban CompositionsReference
NDWINormalized difference water indexWater[25]
MNDWIModification normalized difference water indexWater[26]
NDVINormalized difference vegetation indexVegetation[27]
NDBINormalized difference built-up indexISA[28]
NDISINormalized difference impervious surface indexISA[5]
BCIBiophysical composition indexSoil, ISA and vegetation[29]
MNDISIModified normalized difference impervious surface indexISA[30]
PISIPerpendicular impervious surface indexISA[31]
CBCICombinational biophysical composition indexWater, soil, ISA and vegetation[32]
ENDISIEnhanced normalized difference impervious surfaces indexISA[33]
Table 2. Information of the Landsat-8 images and reference data.
Study AreasDate of Landsat-8 ImagesPath/Row
Landsat-8
Date of Google
Earth Images
Wavelength (μm) of
Landsat-8
Harbin7 May 2018118/2814 May 2018Band1 (Coastal): 0.435–0.451
Band2 (Blue): 0.452–0.512
Beijing13 May 2019123/3224 March 2019Band3 (Green): 0.533–0.590
Band4 (Red): 0.636–0.673
Wuhan15 September 2018123/3916 September 2018Band5 (NIR): 0.851–0.879
Band6 (SWIR1): 1.566–1.651
Guangzhou23 October 2017122/4417 September 2017Band7 (SWIR2): 2.107–2.294
Table 3. The J M P I values of six indices in four cities (Harbin, Beijing, Wuhan, and Guangzhou) and Global samples. J M P I denotes the separability between PSA and ISA. The results are reserved for two decimal places. The max value of each column is in bold.
IndexHarbinBeijingWuhanGuangzhouGlobal
UCI1.601.371.391.381.20
PISI0.911.051.321.330.85
CBCI0.820.821.041.310.91
BCI1.030.811.150.500.40
NDBI0.950.440.480.860.51
MNDWI1.340.630.320.710.98
Table 4. The J M I W values of six indices in four cities (Harbin, Beijing, Wuhan, and Guangzhou) and Global samples. J M I W denotes the separability between ISA and water. The results are reserved for two decimal places. The max value of each column is in bold.
IndexHarbinBeijingWuhanGuangzhouGlobal
UCI2.001.801.992.001.91
PISI1.061.180.380.900.63
CBCI1.871.511.351.820.73
BCI1.040.581.200.250.61
NDBI1.630.901.431.871.28
MNDWI2.001.892.002.001.93
Table 5. The J M P W values of six indices in four cities (Harbin, Beijing, Wuhan, and Guangzhou) and Global samples. J M P W denotes the separability between PSA and water. The results are reserved for two decimal places. The max value of each column is in bold.
IndexHarbinBeijingWuhanGuangzhouGlobal
UCI2.001.982.002.002.00
PISI2.001.831.881.911.26
CBCI2.001.771.911.971.27
BCI2.000.851.171.130.92
NDBI1.940.220.850.480.52
MNDWI2.001.992.002.002.00
Table 6. Overall accuracy (%) and Kappa coefficient of different methods for urban compositions extraction in four cities (Harbin, Beijing, Wuhan, and Guangzhou) and Global samples. The results are reserved for two decimal places. The max values of results for different cases (using the iteration threshold or not) are in bold.
IndexHarbinBeijingWuhanGuangzhouGlobal
OAKappaOAKappaOAKappaOAKappaOAKappa
UCI97.170.9693.130.8991.090.8593.130.8994.600.91
PISI +67.110.5092.220.8886.720.7990.610.8591.580.85
UCI *98.190.9797.680.9694.520.9195.390.9395.440.93
CBCI *87.440.8183.530.7489.970.8492.460.8887.470.77
BCI *+92.620.8990.230.8592.110.8785.410.7784.780.76
NDBI *+51.180.2673.840.6076.510.6284.240.7573.400.53
*: Using the iteration threshold. +: Applying MNDWI for water extraction.
Publisher’s Note: MDPI stays neutral with regard to jurisdictional claims in published maps and institutional affiliations.