Article

Estimation of Liquid Fraction of Wet Snow by Using 2-D Video Disdrometer and S-Band Weather Radar

1
Flight Safety Technology Division, NARO Space Center, Korea Aerospace Research Institute (KARI), Goheung-gun 59571, Korea
2
Atmospheric Environmental Research Institute (AERI), Pukyong National University (PKNU), Busan 48513, Korea
*
Author to whom correspondence should be addressed.
Remote Sens. 2021, 13(10), 1901; https://doi.org/10.3390/rs13101901
Submission received: 17 February 2021 / Revised: 23 April 2021 / Accepted: 11 May 2021 / Published: 13 May 2021
(This article belongs to the Special Issue Advance of Radar Meteorology and Hydrology)

Abstract

:
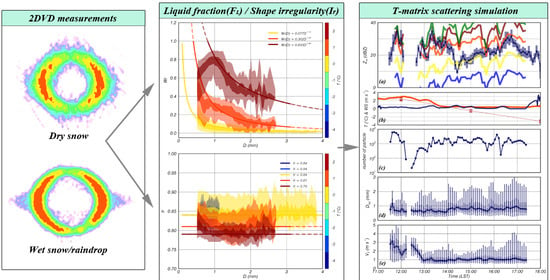
Wet snow may cause significant damage to humans and property, and thus, it is necessary to estimate the corresponding liquid fraction (FL). Consequently, the FL of wet snow was estimated using a novel technique; specifically, the particle shape irregularity (Ir) was estimated through the particle coordinate information obtained using 2-D video disdrometer (2DVD) measurements. Moreover, the possibility of quantitively estimating FL via Ir, based on the temperature (T), was examined. Eight snowfall cases from 2014 to 2016 were observed through a 2DVD installed in Jincheon, South Korea, to analyze the dominant properties of physical variables of snowflakes (i.e., the terminal velocity (VT), particle density (ρs), Ir, and FL) and the corresponding relationships according to the T ranges (−4.5 < T (°C) < 2.5) in which wet snow can occur. It was clarified that the volume-equivalent particle diameter (D)–FL and D–Ir relationships depended on T, and a relationship existed between Ir and FL. The analysis results were verified using the Yong-In Testbed (YIT) S-band weather radar and T-matrix scattering simulation. The D–FL relationship was implemented in the scattering simulation, and the results indicated that the simulated reflectivity (ZS) was highly correlated with the observed reflectivity (ZO) under all T classes. These features can provide a basis for radar analysis and quantitative snowfall estimation for wet snow with various FL values.

Graphical Abstract

1. Introduction

Snow occurs in many types and phases, such as the liquid, solid, and combination phases. Moreover, the physical variables of the corresponding particles, such as the shape, density (ρs, in g·cm−3), volume-equivalent particle diameter (D, in mm), and terminal velocity (VT, in m·s1) vary. Usually, wet snow does not exhibit wide variations in the liquid fractions (FL) for a specific type [1]. Nevertheless, many types of winter precipitation occur at temperatures near 0 °C, including freezing drizzle, ice pellets, snow pellets, and wet snow, alone or in combination. The generation of such different types of winter precipitation near 0 °C involves at least partial phase changes, although melting and freezing processes at such temperatures are difficult to quantify due to their complexity [2].
Moreover, such precipitation considerably influences humans and property. In fact, freezing rain likely has a more severe societal impact than snowfall or rainfall, given the same mass of precipitation [3]. A devastating wet snow event in Germany in 2005 notably impacted infrastructure and transportation frameworks [4]. In addition, the aviation industry is especially susceptible to the influence of winter precipitation types, for example, that of supercooled rain, freezing drizzle, or wet snow during flight [5] and that of hazardous icing and its combinations with the aforementioned precipitation types, such as ice pellets with freezing rain on the ground [6]. On 17 February 2014, wet snow caused the collapse of the Gyeongju Mauna Ocean Resort gymnasium in South Korea, killing nine students and one employee.
The 2-D video disdrometer (2DVD) is an advanced instrument that can yield the most accurate measurements of various types of precipitation microphysics [7,8,9,10]. Certain researchers [11] adopted a theoretical approach to examine the variables governing the fall velocity: vertical size, area of the perpendicularly circumscribed circle, and area ratio between the cross-sectional and circumscribed ellipse area. This study was conducted using a 2DVD, and the researchers suggested various VT–D relationships according to the snowflake type and degree of riming. Other researchers [12] used a 2DVD to investigate the physical attributes of the particle size distribution (PSD) for snowflakes and derived a density–snowflake size relationship specific to Colorado, US. Furthermore, a method was developed [13] to derive the radar reflectivity (Z)–snowfall rate (S) relationships based on 2DVD and radar measurements during the 2006–2007 winter season in Canada. In addition, several researchers [14] applied the methods reported in [15] to derive ρs–D and Z−S relationships by using a 2DVD over Järvenpää in Finland, considering snowfall events in 2010–2011.
Notably, the hydrometeor classification algorithms introduced in the existing studies are mainly implemented using dual-polarization (dual-pol) radar variables [16,17,18,19]. However, as explained in the previous paragraph, 2DVD measurements are extremely precise, and the data can be used for hydrometeor classification. For example, certain authors [20] developed a hydrometeor classification algorithm based on the support vector machine method.
The accuracy of radar-based snowfall estimations is mainly affected by the radar properties, weather conditions, and Z–S relationships, which depend on the physical variables of the snowflakes [21,22,23,24]. Based on the ρs–D relationship, the radar reflectivity can be calculated directly from the measured PSDs by implementing the Rayleigh-scattering approximation for low density and irregularly shaped dry snow particles [25].
In addition, snowflakes with various densities and shapes exhibit different VT values, which must be accurately determined to reliably estimate the number concentration (N(D), in mm−1·m−3). Density, which is the main variable affecting the fall velocity of snowfall, can be determined considering the particle shape and FL. Certain researchers [26] suggested that melting or riming processes were the main causes for an increase in the snowflake fall velocity and derived VT–D relationships according to different snowflake types. In another study, [27] snowfall events with FL of 20–40% in a storm over Newfoundland were measured. Other researchers [28] established VT–D relationships for various snowflake types according to the degree of riming, which is proportional to the coverage ratio of a droplet on a snowflake’s surface, by using a hydrometeor velocity and shape detector (HVSD). Furthermore, a sharp increase in the VT of a melting particle at the FL value of approximately 70% was observed [29], and this value was deemed to be a threshold for the collapse of wet snowflakes to generate another form. Furthermore, the standard deviation of the fall speed of wet snow was noted to be 120–230% larger than that of dry snow [30]. In this context, the reliable estimation of ground-based snowfall is difficult due to the wind-driven horizontal movement of snowflakes caused by the relatively lower snowflake density and large variability in the snowflake density as a function of the vertical structure of the atmospheric temperature (hereafter, “temperature,” T) and humidity [31,32].
Moreover, the FL value of snowflakes influences the formation of other precipitation types, whose presence can notably affect the remote sensing interpretations. The FL value for hydrometeors can be expressed in terms of the dielectric constant (|K|2), and it depends on the liquid water, ice, and air components. Liquid water and ice-phased hydrometeors correspond to different |K|2 values of 0.93 and 0.19, respectively, and these values also depend on the radar frequency and particle temperature. The radar signature of melting-phase hydrometeors is a notable parameter because the radar scattering of melting snow differs significantly from that of general dry snow [25]. Consequently, FL values are carefully incorporated in numerical modeling. For example, melting snow and hail are often modeled as two-layered frameworks, with dry snow or ice cores surrounded by water or a wet snow mixture, or as uniform air–ice–water or ice–water mixtures [33,34]. However, there remains a lack of quantitative analyses on the physical properties and features of radar variables for wet snow, which poses a significant risk to humans and infrastructure.
Considering these aspects, in this study, a quantitative analysis of the physical variables was performed for wet snow cases in Jincheon, South Korea from 2014 to 2016, based on observations from the Yong-in Testbed (YIT) weather radar and 2DVD operated by the Korea Meteorological Administration (KMA). In order to consider the measurement uncertainty of the disdrometer, analysis cases under stable ground wind conditions (<3 m·s−1) were selected. The details of the analyzed cases and weather conditions are presented in Table 1. Section 2 describes the adopted instruments and methods, as well as the physical variables of snowflakes. In particular, this section describes the novel techniques to calculate the particle shape irregularity by using the particle coordinate information obtained from 2DVD and to estimate the liquid fraction using the estimated particle density. Section 3 describes the relationship of FL and Ir with D with respect to T class. Subsequently, the analysis of the relationships to directly estimate FL from Ir is described. Section 4 describes the verification of the results implemented through scattering simulations and reanalysis data. Finally, Section 5 provides the concluding remarks.

2. Data and Methods

2.1. Observational Instruments

Three weather observation instruments (YIT, 2DVD, and Automatic Weather System (AWS)) were considered. The YIT and 2DVD had a horizontal distance of approximately 29 km (Figure 1), and the AWS was deployed in the same observation field near the 2DVD (Figure 2). The YIT, which was an S-band dual-pol weather radar system manufactured by Enterprise Electronics Corporation (EEC), was installed in Yong-in by the Weather Radar Center (WRC), KMA, in July 2014. The WRC has been operating the YIT with different scan strategies to analyze various precipitation cases using the dual-pol radar variables (i.e., radar reflectivity (Z, in dBZ), differential reflectivity (ZDR, in dB), specific phase shift (KDP, in °·km−1), and cross-correlation coefficient (ρHV)). In this study, the scan strategy for the analysis and verification cases consisted of 11 elevation angles with a 10 min update interval in 2016. Non-meteorological targets were removed from the radar data by using a fuzzy logic algorithm suggested by [35]. The specifications are summarized in Table 2.
The 2DVD was developed by Joanneum Research (Graz, Austria) to detect single raindrop particles [7] and was modified to consider the errors caused by turbulence effects [36]. The device can calculate the various physical variables of single particles from the information particle coordinates (i.e., D and axis ratio (γ)) and time differences (i.e., VT) observed by two orthogonal line-scan cameras, illuminated by two light sources. In particular, this device can record single particles regardless of the hydrometeor type. The advantages of the 2DVD differ from those of other disdrometers, such as the Joss–Waldvogel disdrometer (JWD), precipitation occurrence sensor system, and particle size and velocity (PARSIVEL). For instance, PARSIVEL considers fixed diameter and fall velocity channels and does not take into account the particle shape [37]. Conversely, when using the 2DVD, the particle is observed when it passes through a 100 cm2 observation area consisting of two light sources, reflecting mirrors, and two orthogonal cameras, one of which is set 6.2 mm above the other; moreover, data are acquired with a resolution of 630 pixels, resulting in a pixel size of 0.19 mm at 55 kHz. The detailed specifications can be found in Table 3.
The shape of the particles passing through the observation area is based on the projection of the particles created by the light sources, which allows the calculation of physical variables [38,39]. The following two quality control procedures were performed: (i) particle D > 0.5 mm was considered to indicate reliable data, (ii) to minimize the mathematical error and limitation of the spatiotemporal resolution of the 2DVD, the snowflakes were removed if the absolute difference between the observed major axis and that calculated based on data coordinates was higher than 10% [40]. The major axis was considered to be the larger value among the width and height of the snow observed from the 2DVD. After the QC procedures, 183,899 particles were acquired, and the relevant details are summarized in Table 4.

2.2. Physical Variables of Particle

The terminal velocity (VT) of a particle is a key variable related to external conditions (acceleration due to gravity (g), atmospheric density (ρg) and T) and physical properties (Reynolds number (Re), drag coefficient (CD), sphericity (Φ), ρs, and D), and these properties can be estimated using the following theoretical equation [41]:
V T = ( 4 ( ρ s ρ g ) g D 3 ρ g C D ) 0.5
Moreover, the particle density can be estimated using this equation. Certain researchers [40] demonstrated the reliability of estimating the volcanic ash particle density from Equation (1) and verified it considering the measured density. In addition, a new equation for CD was developed [42] using the function of circularity, and an advanced equation of CD was established [43] considering two types of sphericities (lengthwise (Φ||) and crosswise (Φ)). These variables can be expressed as follows:
C D = 8 R e 1 Φ | | + 16 R e 1 Φ + 3 R e 1 Φ 3 / 4 + 0.42 × 10 0.41 ( log ( Φ ) ) 0.2 1 Φ
Re is defined as follows:
R e = ρ g V T D μ
where μ is the dynamic viscosity (kg m−1·s−1). The three types of sphericities are defined as follows:
Φ = π D 2 S A
where the sphericity (Φ) quantitatively defines the overall shape of the particle, considering all the directions of interest. SA is the surface area of the particle (mm2). The lengthwise sphericity is defined as the ratio of the cross-sectional area of the volume-equivalent sphere to the difference between half the surface area and mean of the projected vertical cross-sectional area (AV) of the particle (Equation (5)):
Φ | | = π D 2 4 ( 0.5 × S A A V )
The crosswise sphericity is the same as the lengthwise sphericity, except for the denominator, which includes the projected horizontal cross-sectional area of the particle (AH), defined as follows:
Φ = π D 2 4 A H
The 2DVD observes particle heights from the front and side views, and thus, it is necessary to select a representative particle height to calculate the area or volume. Therefore, to consider the reliable particle height, the methods suggested by [14] were applied to the area-related equation (SA, AV).

2.3. Particle Shape Irregularity

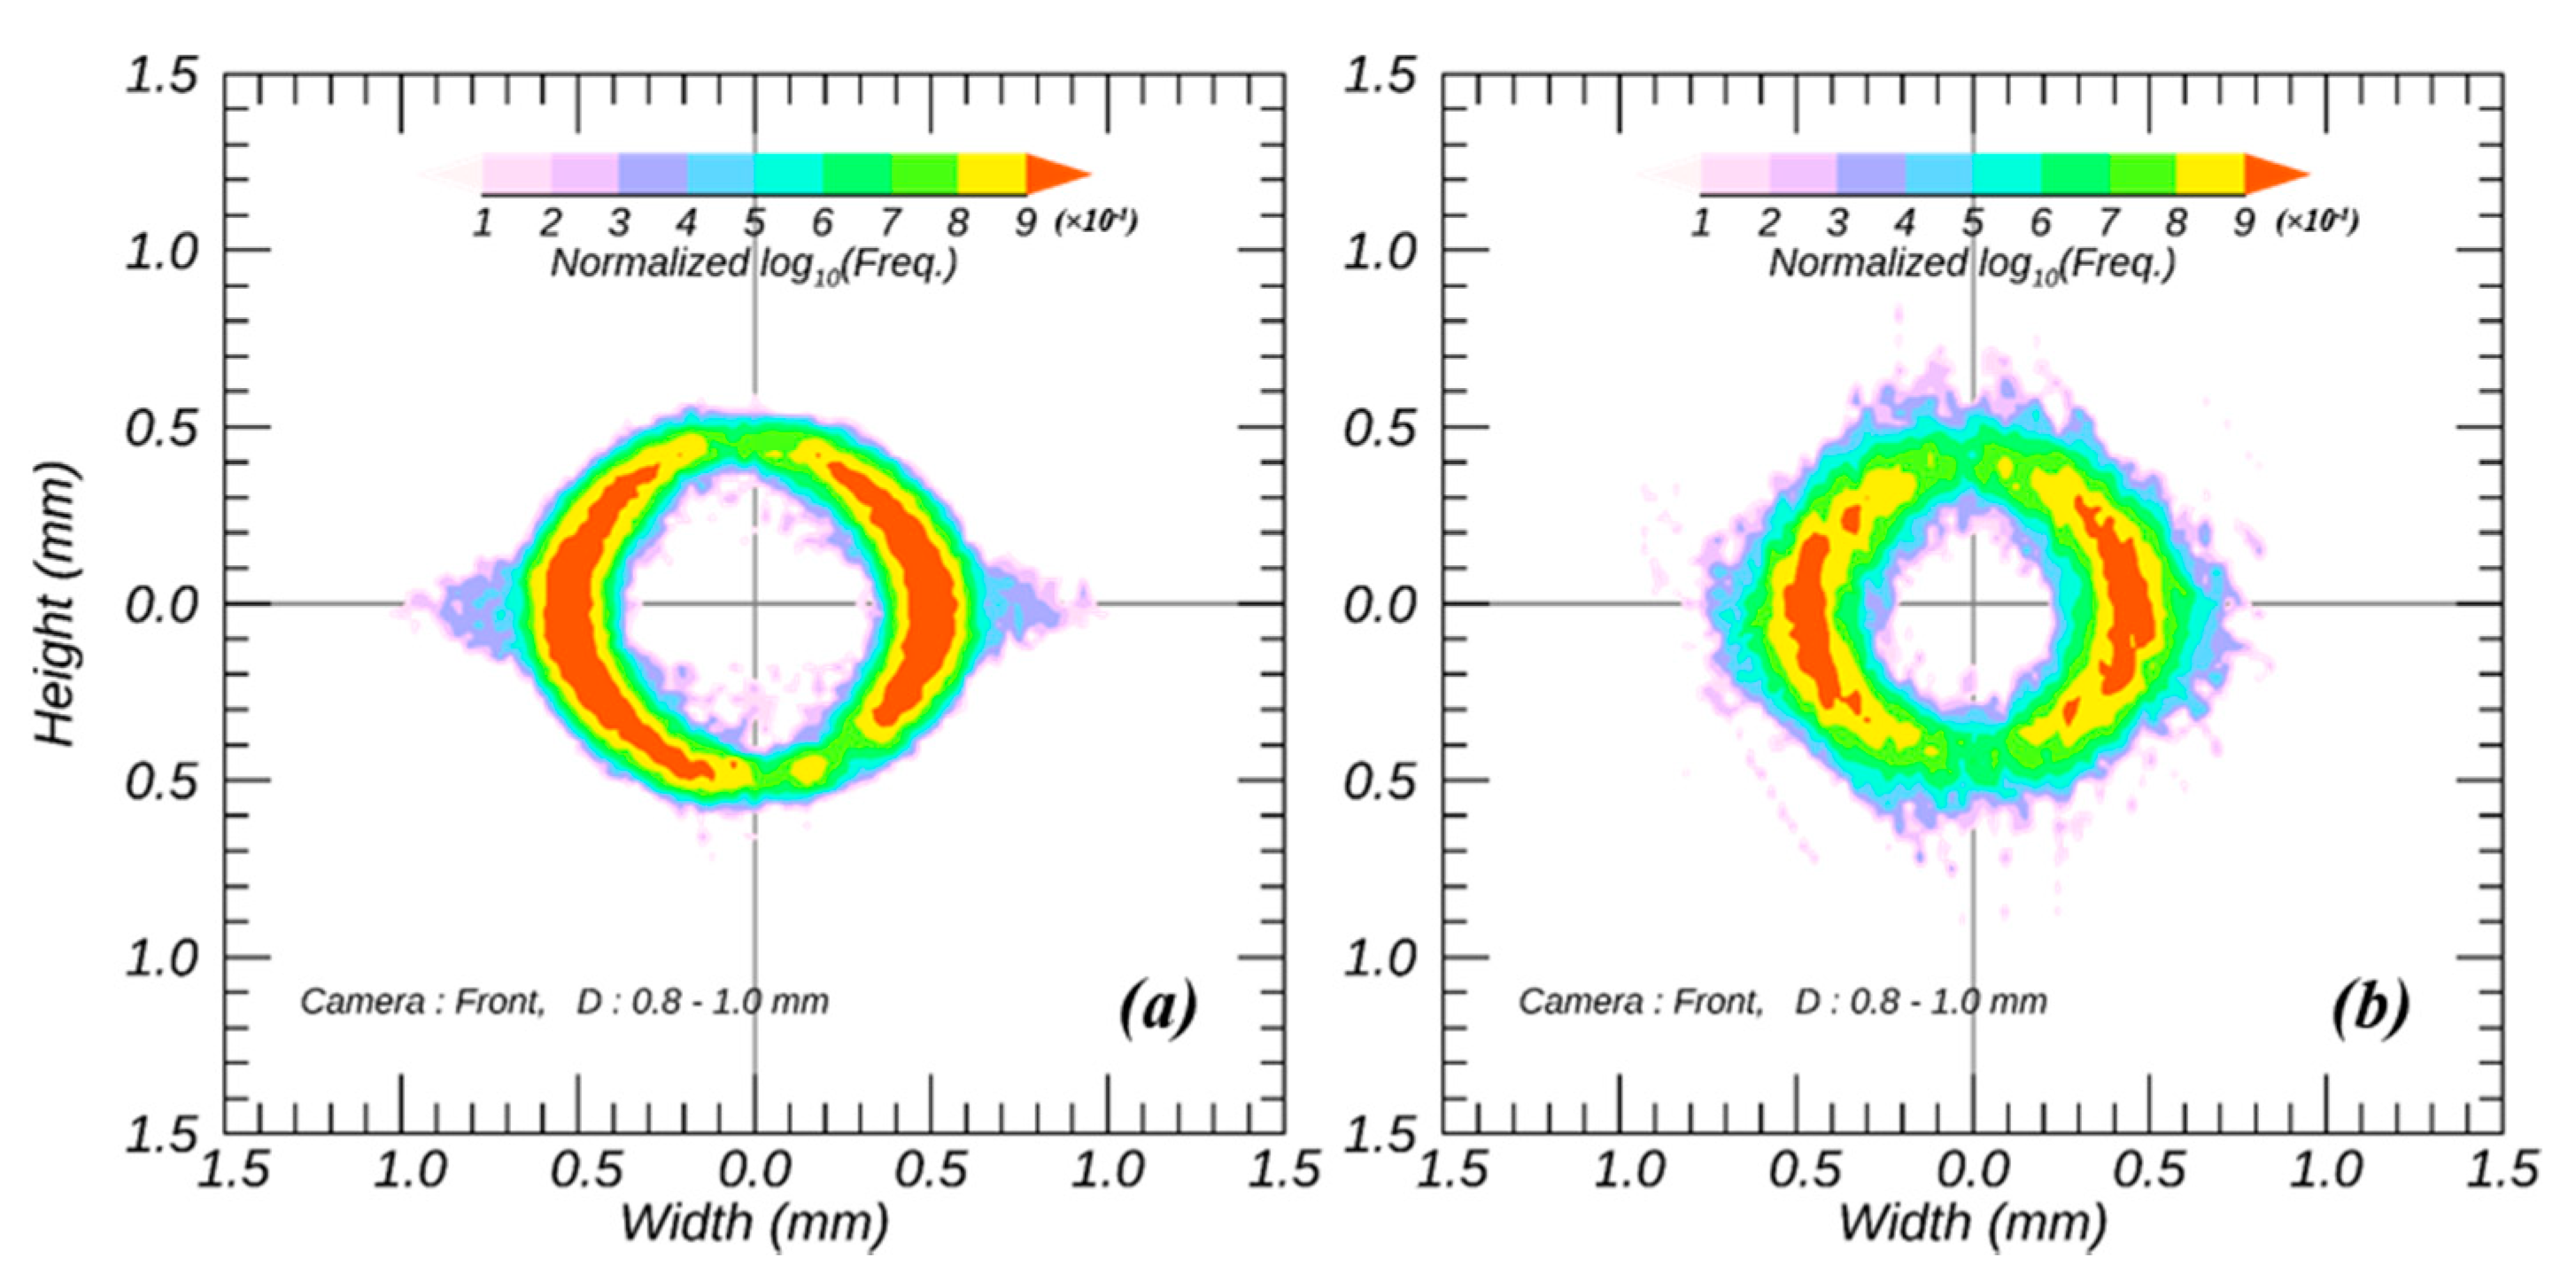
Raindrops have a smooth surface due to the surface tension of the fluid. However, snowflakes exhibit a wide variety of shapes (e.g., columns, plates, needles, dendrites) depending on the condensation/sublimation conditions, and thus, snowflakes have an irregular particle appearance (Figure 3). The axis ratio and sphericity are most commonly used to quantitatively present the shape of these particles in meteorology and volcanic petrology, respectively [42,43]. Although these parameters help express the approximate particle shape via a simple technique, the specific characteristics of the particle surface, such as the roughness and particle shape irregularity cannot be accurately reflected. In particular, the value of γ is highly sensitive to external forces, such as horizontal wind and eddies.
To compensate for this limitation, a detailed particle shape must be defined from various types of particle-related information. As a representative example, certain researchers [44] introduced various variables, such as the minimum caliper length (LMIN), maximum caliper length (LMAX), diameter of the largest inscribed circle (Di), and diameter of the smallest circumscribed circle (DC), by using laser scanning. In addition, the features of 2D shapes for minerals were evaluated [45] using morphological parameters. In general, 2DVD observations contain detailed coordinates of a single particle shape due to the high-spatiotemporal resolution (0.19 mm and 55 kHz). Given these advantages, in this study, the particle shape irregularity (Ir) was defined as follows (Figure 4).
Ir = i = 0 N P | Δ P i | N P D
where NP refers to the total number of coordinates of a single particle shape (P), which correspond to the blue dot on the particle outline in Figure 4. ΔPi indicates the distance from the ith coordinate for the snowflake observed from the 2DVD to that of the ellipsoid (CE,i) crossing the vertical direction, and it can be expressed as follows:
Δ P i = | C E ,   i P i |
CE is defined as follows:
C E = 0.25 π ( L M A X L M I N )
where LMAX and LMIN of the particle denote the major and minor axes, respectively. As this analysis method adopts an imaginary ellipsoid having the same major and minor axes as those of the observed particle, it is optimized for solid particles and not recommended for raindrops, which usually involve a morphology equation [46,47].

2.4. Liquid Fraction of a Snowflake

The density is a function of the mass and volume of the particle, and the mixed density is calculated as the sum of the densities for the volume ratios for two materials having different properties. Therefore, FL can be estimated from the volume ratio of the two materials to the mixed density, which can be calculated using the known density of a snowflake and liquid water, as follows:
F L = ρ s ρ r s ρ w ρ r s
where ρrs is the density relationship of a snowflake, ρs is the density of an observed snowflake, and ρw is the density of liquid water. In this study, the density of pure water was assumed to be 1 g·cm−3. Several previous studies have suggested the density relationships of a snowflake in terms of D and the median volume diameter (D0, in mm) by using various disdrometers, such as ρrs = 0.104 D−0.95 [48], using the ARM [49], and ρrs = 0.178 D0−0.922 [12]. These relationships were formulated considering the mass of snow observed through a weighing gauge and volume of snow observed using the 2DVD. Recently, the relationship ρrs = 0.144 D−1 was established [50] using a weighing pluviometer (OTT) and 2DVD observations, which pertains to the same approach employed by [12]. In particular, to establish the ρs–D relationship, the existing studies adopted the information of the particle mass observed by, for example, an OTT pluviometer. However, in this study, the particle density was estimated using the equation of theoretical VT (Equation (1)), which considers the physical variables and shape information of particles in the absence of the corresponding observational instrument.
In particular, because this method estimates the particle density using the observed VT as the input parameter to the equation of theoretical VT, it may be affected by the accuracy of the observation equipment and environment. In this study, the value was estimated from observational data obtained under calm weather conditions with an average ground wind speed of less than 3 m·s−1 (Table 1).

2.5. T-Matrix Scattering Simulation

Scattering simulations represent valuable tools to verify radar observations by using ground-based data. Notably, the T-matrix scattering simulation technique, developed by Dr. Chenxian Tang at Colorado State University, is a fast and accurate dual-pol radar model simulator for the arbitrary microphysics corresponding to hydrometeors. This simulator consists of the following packages: (i) An ensemble estimation package that adds up the incoherent contributions of all the scatters within the radar gate range by performing integration over the hydrometeor types, canting angles, and drop size distributions. (ii) A hydrometeor model package that specifies the microphysical properties of a single hydrometeor; the particle shape, canting angle, and dielectric constant are defined for each particle diameter channel. (iii) A scattering computation package for rotationally and equatorially symmetric dielectric particles, which computes the backward and forward scattering amplitudes at an arbitrary incidence. (iv) A utility package, in which all the integrals are computed using the Gaussian–Legendre quadrature algorithm. In this study, T-matrix scattering simulations were performed as a reasonable means to verify the results of FL estimations under specific T values.

3. Results

3.1. Temperature Dependence of Physical Features of Wet Snow

The terminal velocity of snowfall was classified using the ground T observed by AWS (Figure 5). Seven T classes from −4 °C to 2 °C were selected, and each T class corresponded to a range of ±0.5 °C. Specifically, the T class for 1 °C represented the T range from 0.5 °C to 1.5 °C.
Notably, the T classes of −2 °C and −1 °C could not be classified due to the absence of data. Under freezing conditions, the results were similar to the VT relationship for dry snow [50], especially to the data for sub-zero and 0 °C (D > 3 mm) conditions. The results for wet snow exhibited a higher correlation to the data for 2 °C (D > 1.5 mm). In general, the VT of snow did not increase with the particle diameter, and this feature was evident in the above-zero conditions. In the T classes of 1 °C and 2 °C, the inflection point appeared at approximately D = 1.3 mm and 1.5 mm, respectively. The relationship at D < 1.3 mm for the 2 °C class was similar to that for rainfall, and in the D > 1.3 mm section, the relationship was similar to that of wet snow [50]. This finding implies that the hydrometeor types were classified according to the particle size in the same T class. The VT–D scatterplot exhibited a concentrated narrow distribution for the smaller diameter range centering on each inflection point, although this trend was not observed in the larger diameter range. This finding indicates that the correlation between the phase of the hydrometeors with respect to the smaller and larger diameter range was high and low, respectively. In other words, the liquid fraction of wet snow depended on D and T.
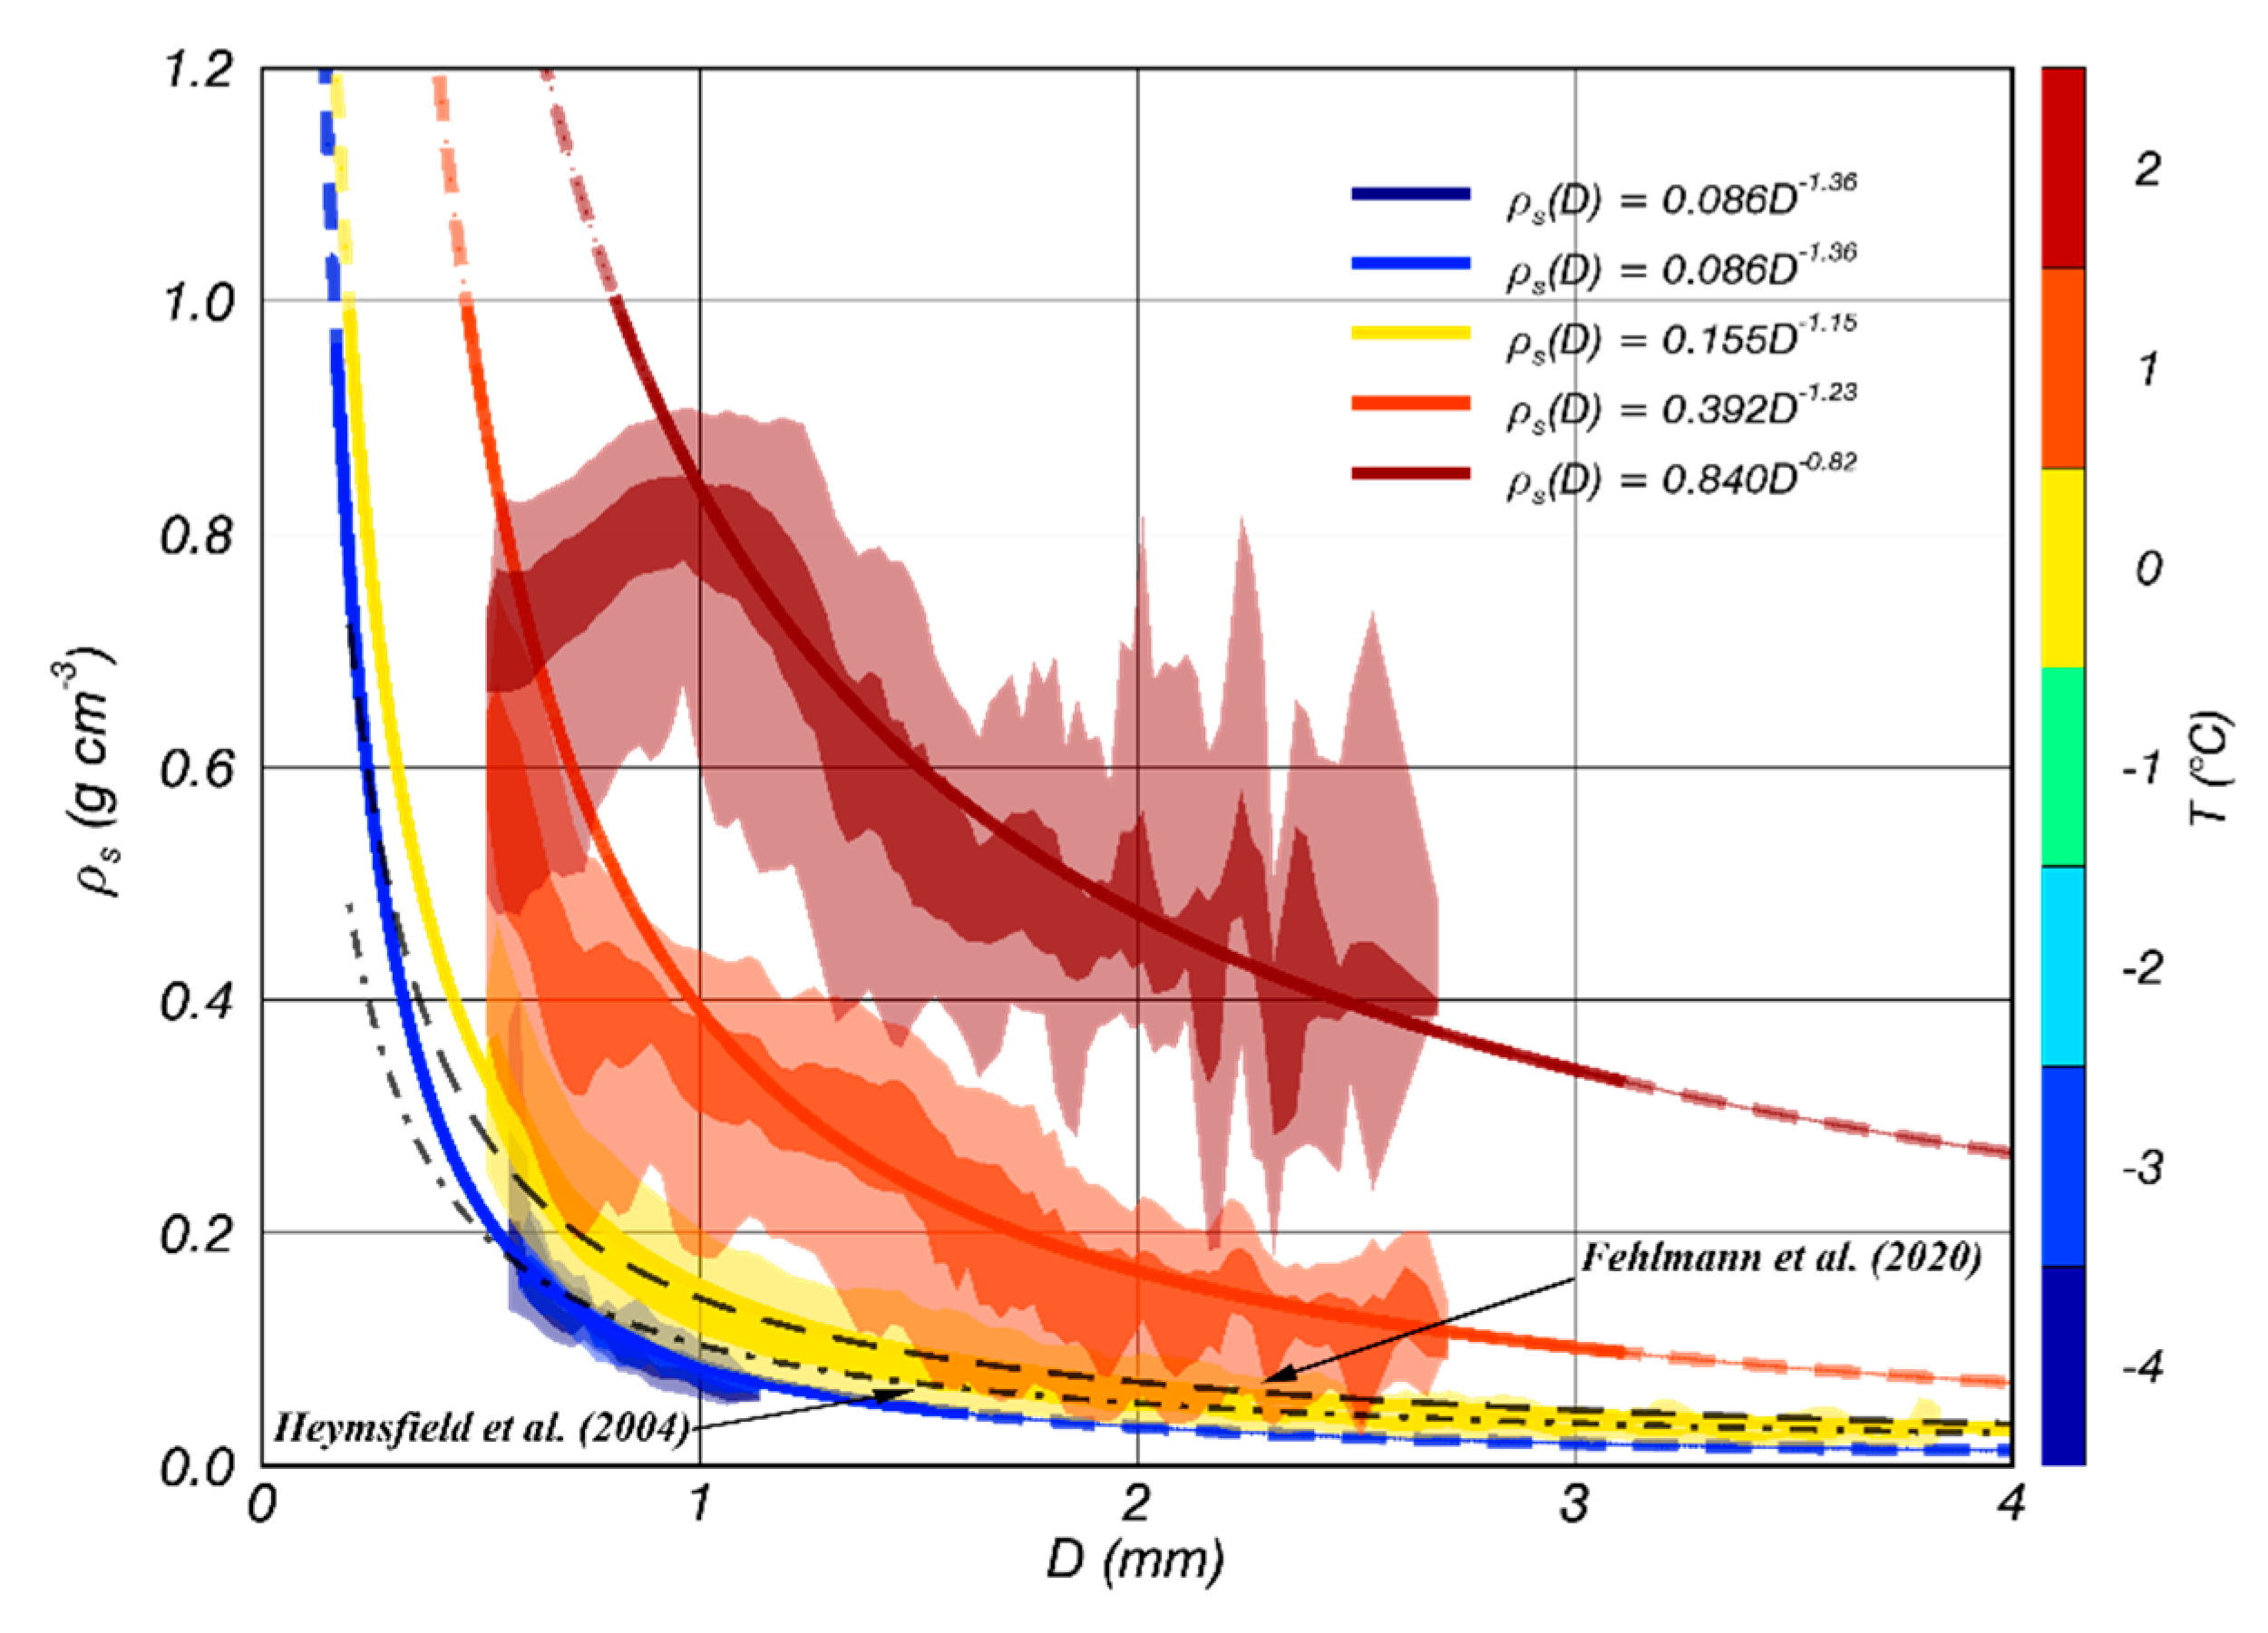
The density of particles according to D and T was estimated using the equation of theoretical VT (Figure 6). The correlation between the density–diameter (ρs–D) relationship for the sub-zero case and the relationship proposed by [48] was significant, whereas the relationship suggested by [50] exhibited a higher correlation with the results for the 0 °C class. It could be inferred that the correlation with the density for the 0 °C class estimated using Equation (1) was significant.
The particle density for D > 1 mm was selected to clearly identify the relationship between ρs and D while considering the biases likely to occur when observing small-diameter particles. Moreover, the importance of the larger particle diameter was considered, which more notably influences the radar estimation. The established ρs–D relationship for snow under the sub-zero condition estimated by Equation (1) was adopted as the standard for dry snow.
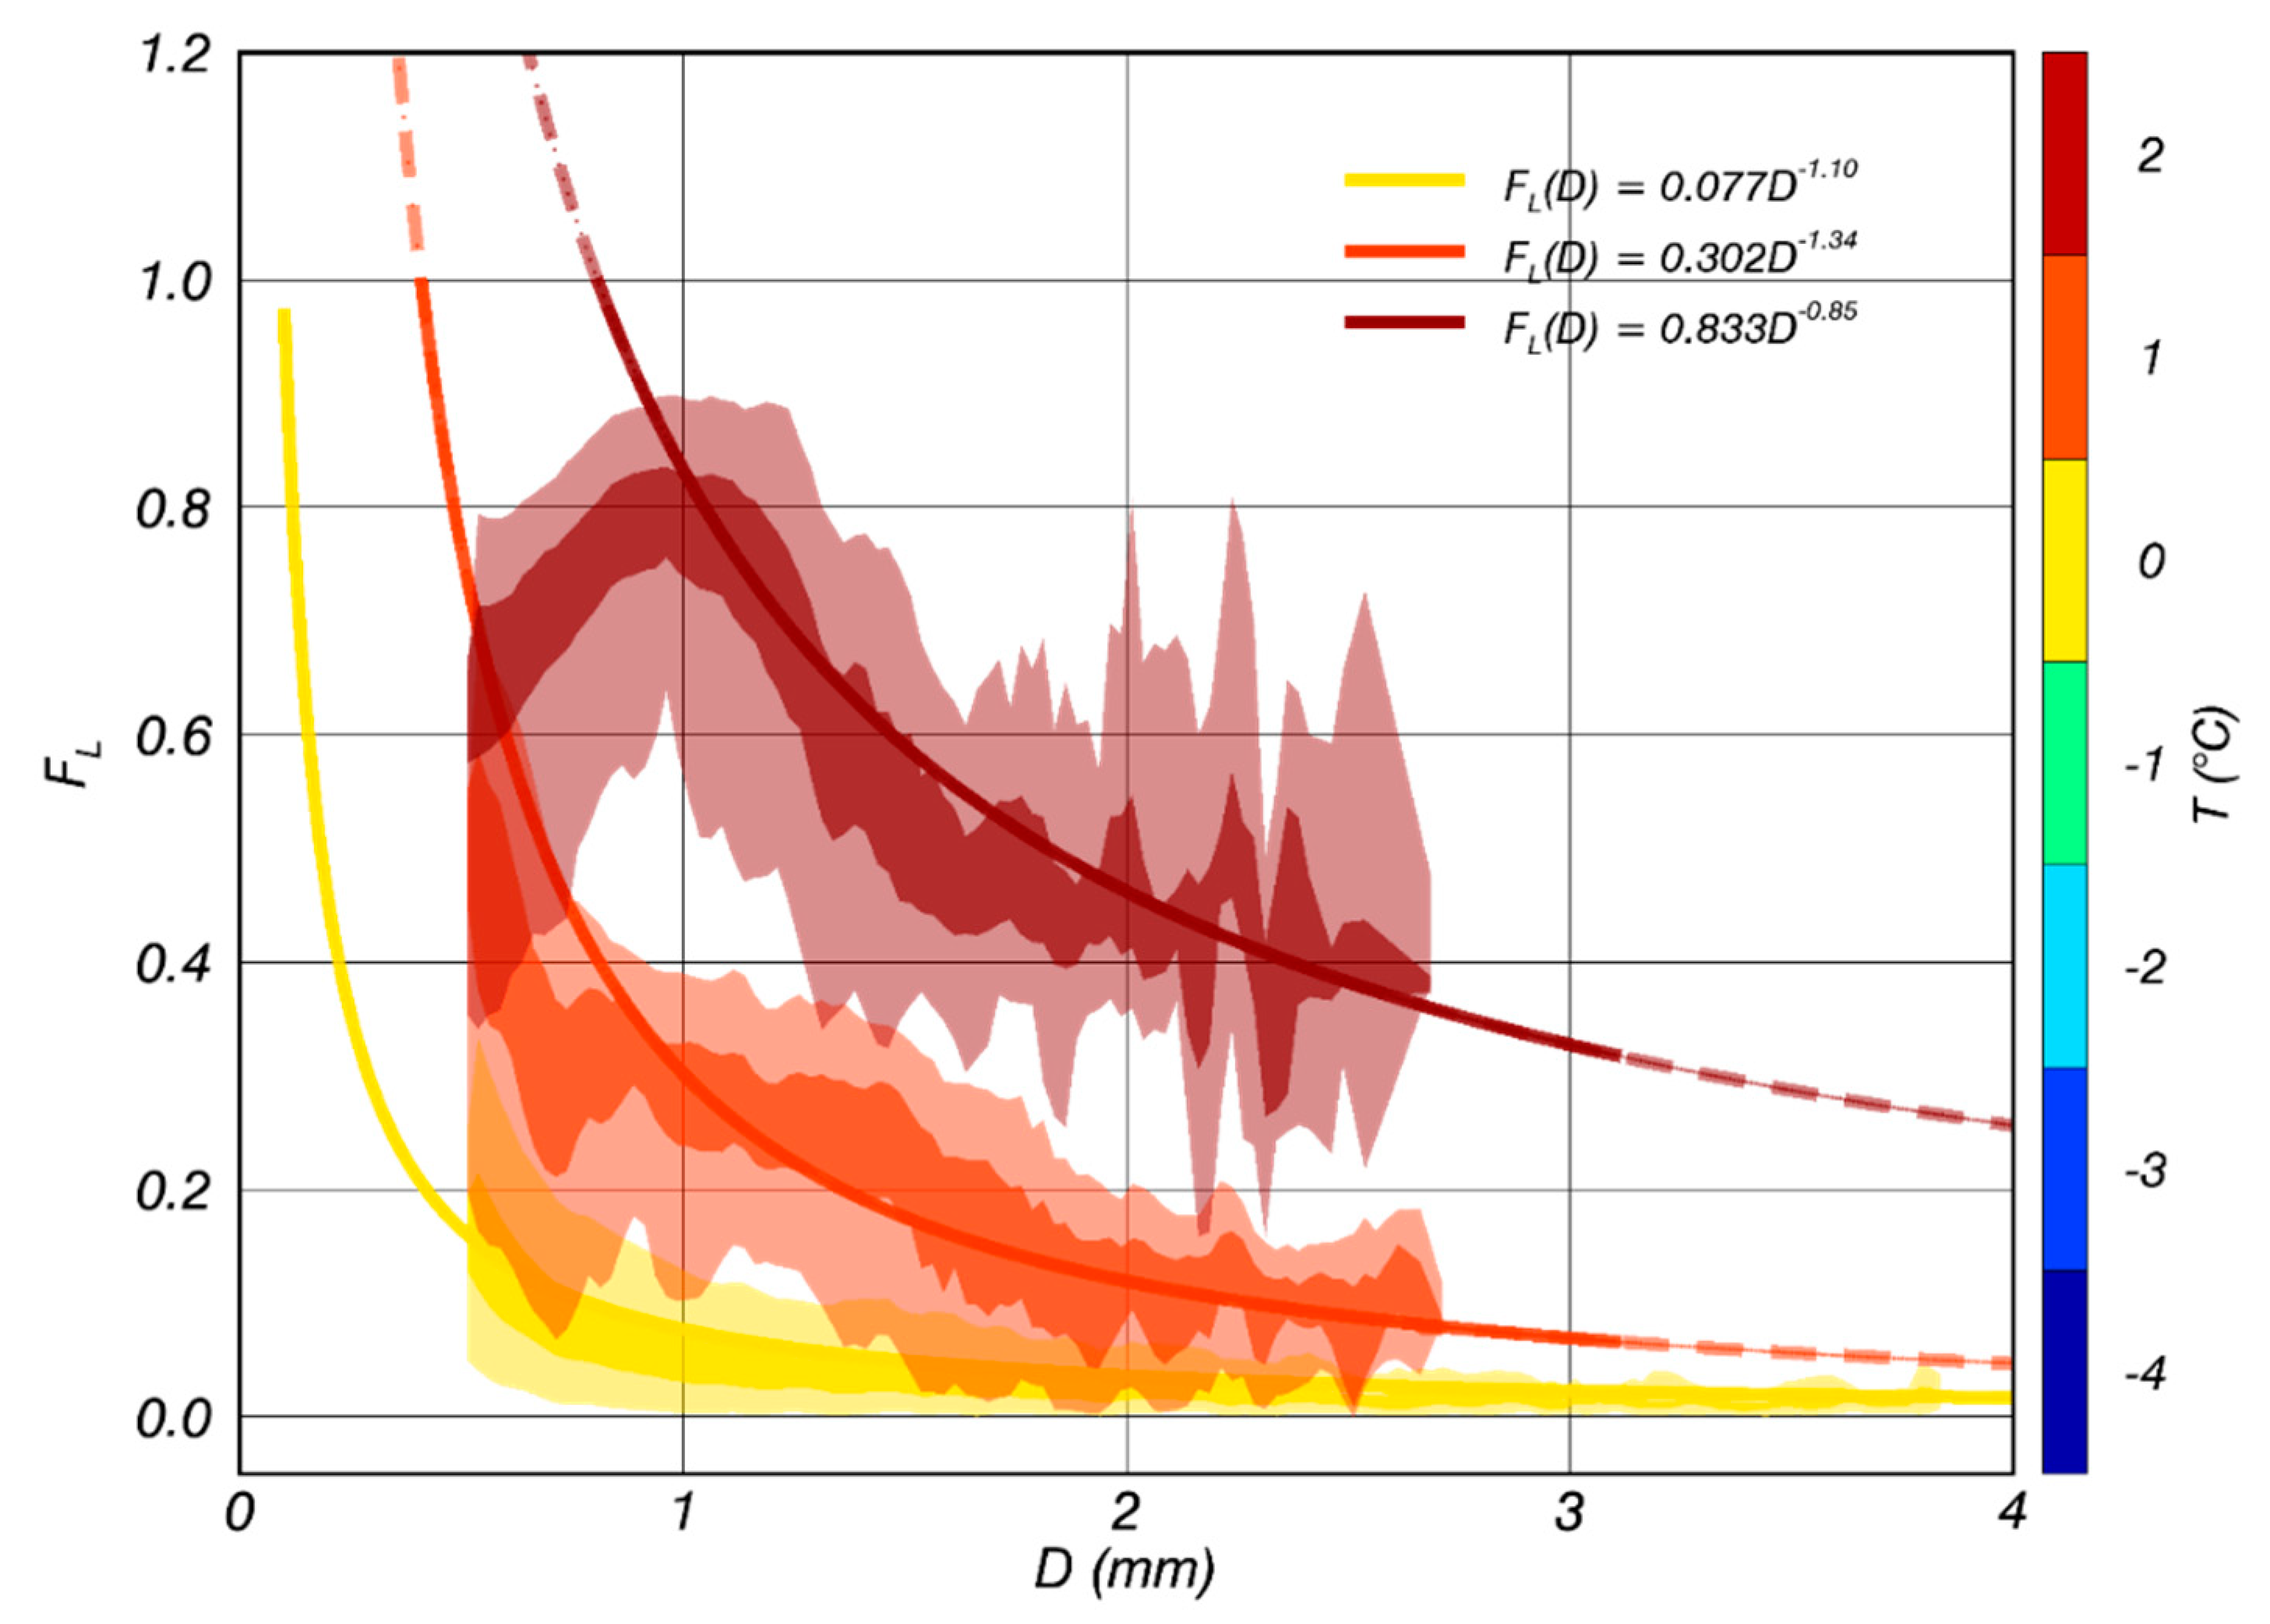
The relationship between FL and D for each T class could be defined using the estimated density for wet snow (Figure 7). As the density of water (g·cm−3) and maximum value of FL were set as 1, the scatterplot of FL–D was similar to that of ρs. If the analyzed particle was not considered to be a hydrometeor, the ρs–D and FL–D relationships were expected to be different from the present result due to the change in ρs. A negative relationship between FL and D was found in all T classes. It could be inferred that FL in the smaller diameter conditions was larger than that in the larger diameter conditions, even when the difference in the surface area of the particle was considered according to D. As in the case of snowfall, the FL for hail depended on D, and the two variables were negatively correlated [52]. According to the relationship proposed by [53], as the mass of a hailstone increased, FL of the total mass exponentially decreased. In addition, certain researchers [54] analyzed FL for different falling heights for a hailstone and reported an exponential relationship in which FL was inversely proportional to D within the analyzed altitude range. In general, as T increased, FL increased within all ranges of D, and the magnitude of these variations gradually increased. For example, FL for each T class from 0 °C to 2 °C at D = 2 mm was 0.04, 0.12, and 0.46. The relationships for ρs–D and FL–D are summarized in Table 4.

3.2. Dependence of Shape Irregularity of Wet Snow on Temperature and Liquid Fraction

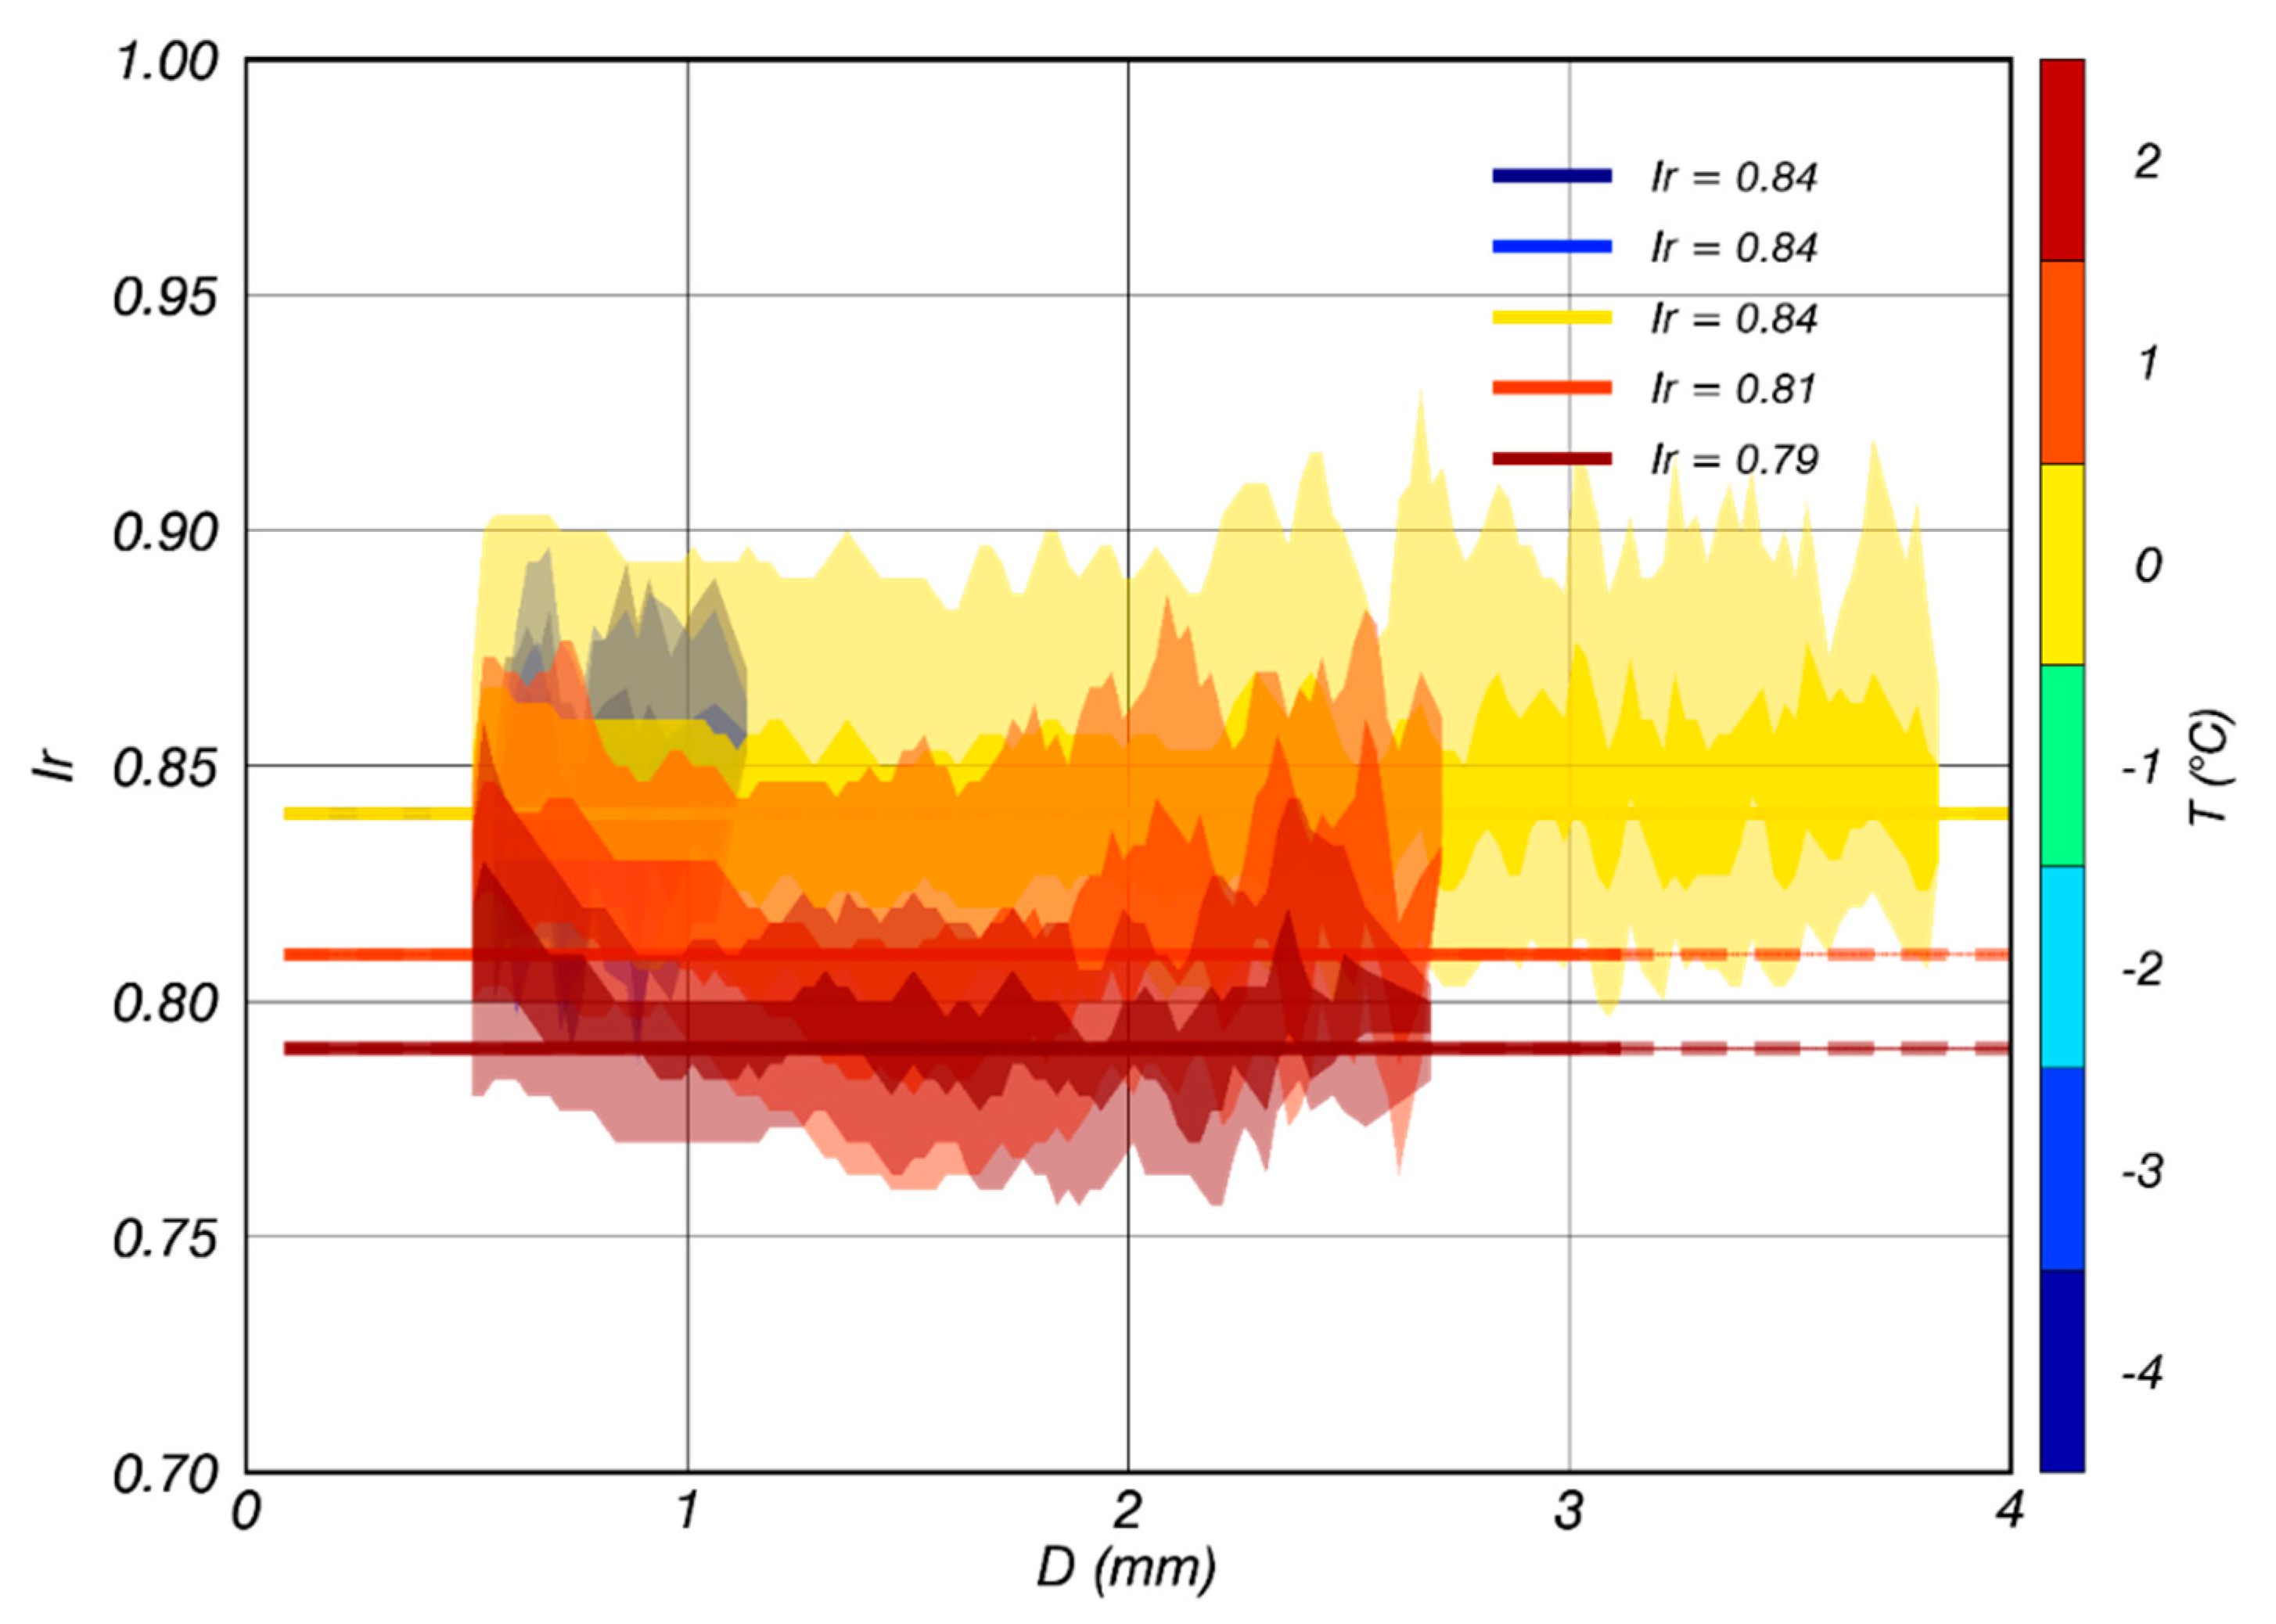
The particle shape irregularity, which quantitatively defines the irregularities of the particle surface, depends on T, similar to the other physical variables (Figure 8). The Ir–D scatterplots for the 0 °C class and sub-zero class were similar, and Ir gradually decreased as T increased. Notably, Ir exhibited a nearly constant value against D regardless of the T class. Unlike the aforementioned physical variables, the amount of change in Ir according to D was considered to be negligible, and thus, the representative values of Ir for each T class were considered to be averaged values. In the sub-zero class, the average values of Ir were nearly constant as 0.84; however, even a 1 °C change in the above-zero class led to a decrease in the average Ir. As T increased, the ±10% data range from the median value of Ir (dark contour) gradually decreased. The data ranges of the sub-zero class and 0 °C class were approximately 0.04, whereas those of the 1 °C and 2 °C classes were approximately 0.03 and 0.01, respectively. These findings implied that Ir is inversely correlated with T, and the liquid fraction of wet snow can be classified through Ir.
The liquid fraction is considered to be a key variable in radar observation, as it is highly related to the dielectric permittivity. As illustrated in Figure 8, Ir and FL for the hydrometeor were correlated as Ir exhibited a meaningful relationship with T regardless of D. Therefore, to estimate FL, which is critical in radar meteorology, from Ir, independent of the influence of external conditions, the Ir–FL relationship was analyzed (Figure 9).
Notably, the FL estimation from Ir for each T class for snowfall is useful in the absence of the information of the ground T and in the presence of horizontal wind that can affect the particle physical variables (i.e., VT and γ). The Ir–FL relationships for all T classes followed a Gaussian bell-shape centered around Ir = 0.75. The peak of FL appeared within the range 0.7 < Ir < 0.9, in which most of the data existed (Figure 8), and the peaks of FL at 0.1, 0.37, and 0.82 were observed under ground T values of 0, 1, and 2 °C, respectively. For Ir not in the range 0.7 < Ir < 0.9, FL for all T classes converged to zero. The relationships for Ir–D and Ir–FL are presented in Table 4.

4. Verifications

Case studies [27 February 2016 (C1), 28 February 2016 (C2)] with the observed surface T ranging from 0 °C and 3 °C were performed to validate the obtained results. The ground wind conditions for the selected case are very stable (<1 m·s−1) so that the uncertainty of the disdrometer that may arise from the wind effect could be negligible. Precipitation occurred continuously for more than 3 h, and both YIT and 2DVD observations were obtained simultaneously. The quasi-vertical profile (QVP) method, in the altitude versus time format, was implemented to analyze the characteristics of the internal structure of the system. The QVP can help calculate the vertical profile of radar variables through only one sweep and is particularly valuable in analyzing hydrometeor classifications [55]. In this study, the values were obtained in the form of azimuthally averaged radar variables for the elevation angle of 19°. In addition, meso-scale model (MSM) reanalysis data acquired by the Japan Meteorological Agency (JMA) [56] were selected to determine the vertical T profile. The JMA-MSM 39-h forecasts have been provided every 3 h, since May 2007.

4.1. Spatiotemporal Structure of Analyzed Cases

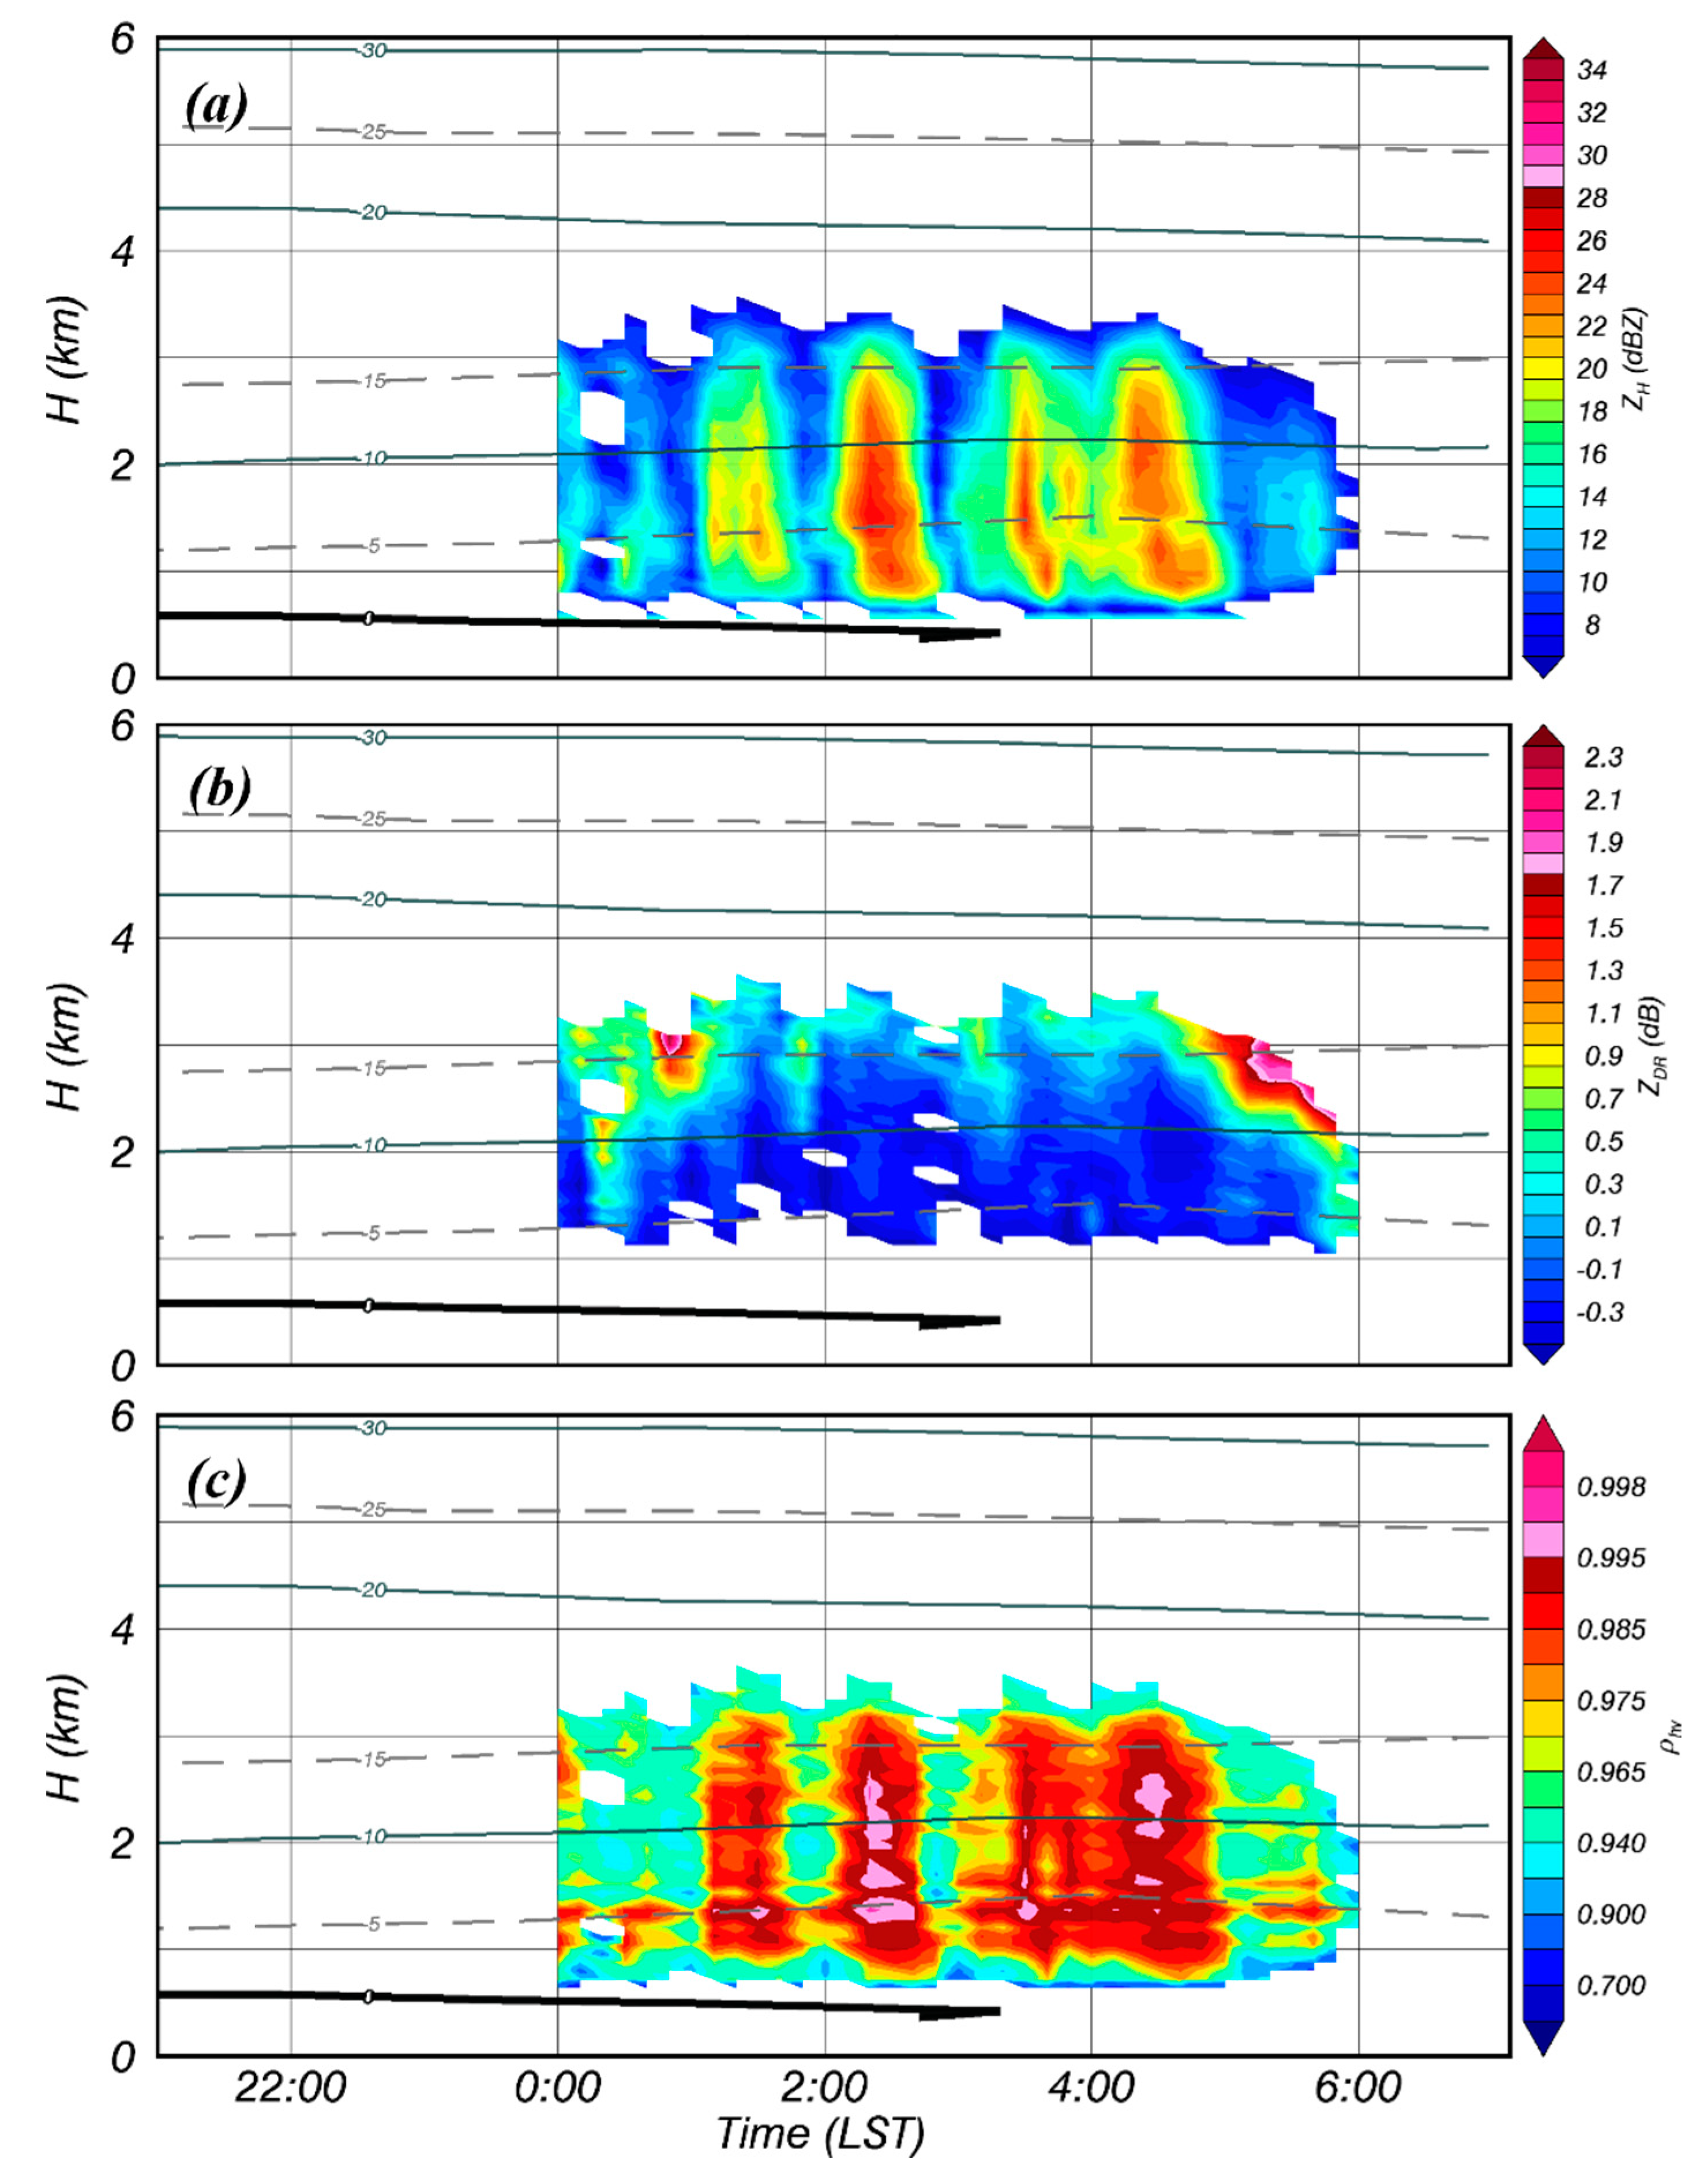
The temperature for C1 exhibited a gradually decreasing pattern with altitude, in which typical melting snow was formed at a height of less than 600 m (Figure 10). The absence of radar data for altitudes below 600 m is a result of the radar installation altitude (Table 2). The echo-top height was between 3 km and 3.5 km, which corresponded to a temperature between −15 °C and −20 °C. Four Z columns were observed, and the maximum reflectivity did not exceed 30 dBZ in the sub-zero area, indicating the reflectivity magnitude of a typical snowfall (Figure 10a). In the case of ZDR, no significant patterns with Z columns were observed (Figure 10b). Generally, ZDR is proportional to Z in rainfall cases; however, for snowfall, it is challenging to simply identify a relationship between Z and ZDR because the dual-pol radar variables are determined by the shape as well as the physical/chemical features of snowfall [57]. Notably, a wide range of γ is applicable, and a lower ZDR is observed in snowfall compared to rainfall for the same γ (e.g., [58]). According to several researchers [59], a hydrometeor with a higher Z and lower ZDR can be described as a characteristic that appears in all snowfall cases, including dry/wet snow. This phenomenon can be observed considering the characteristics of ZDR close to 0 dB, which appeared in the reflectivity column with Z > 26 dBZ.
Nevertheless, a high ZDR (over 1.5 dB) was observed at an altitude of −15 °C at 0040 LST and 0530 LST. ZDR evidently increased because T in the relevant area could be considered to correspond to a dendritic growth region [60,61]. The value of ρHV in the high ZDR region was approximately 0.96, which was low compared to that in the area in which the reflectivity column appeared (ρHV > 0.98) (Figure 10c).
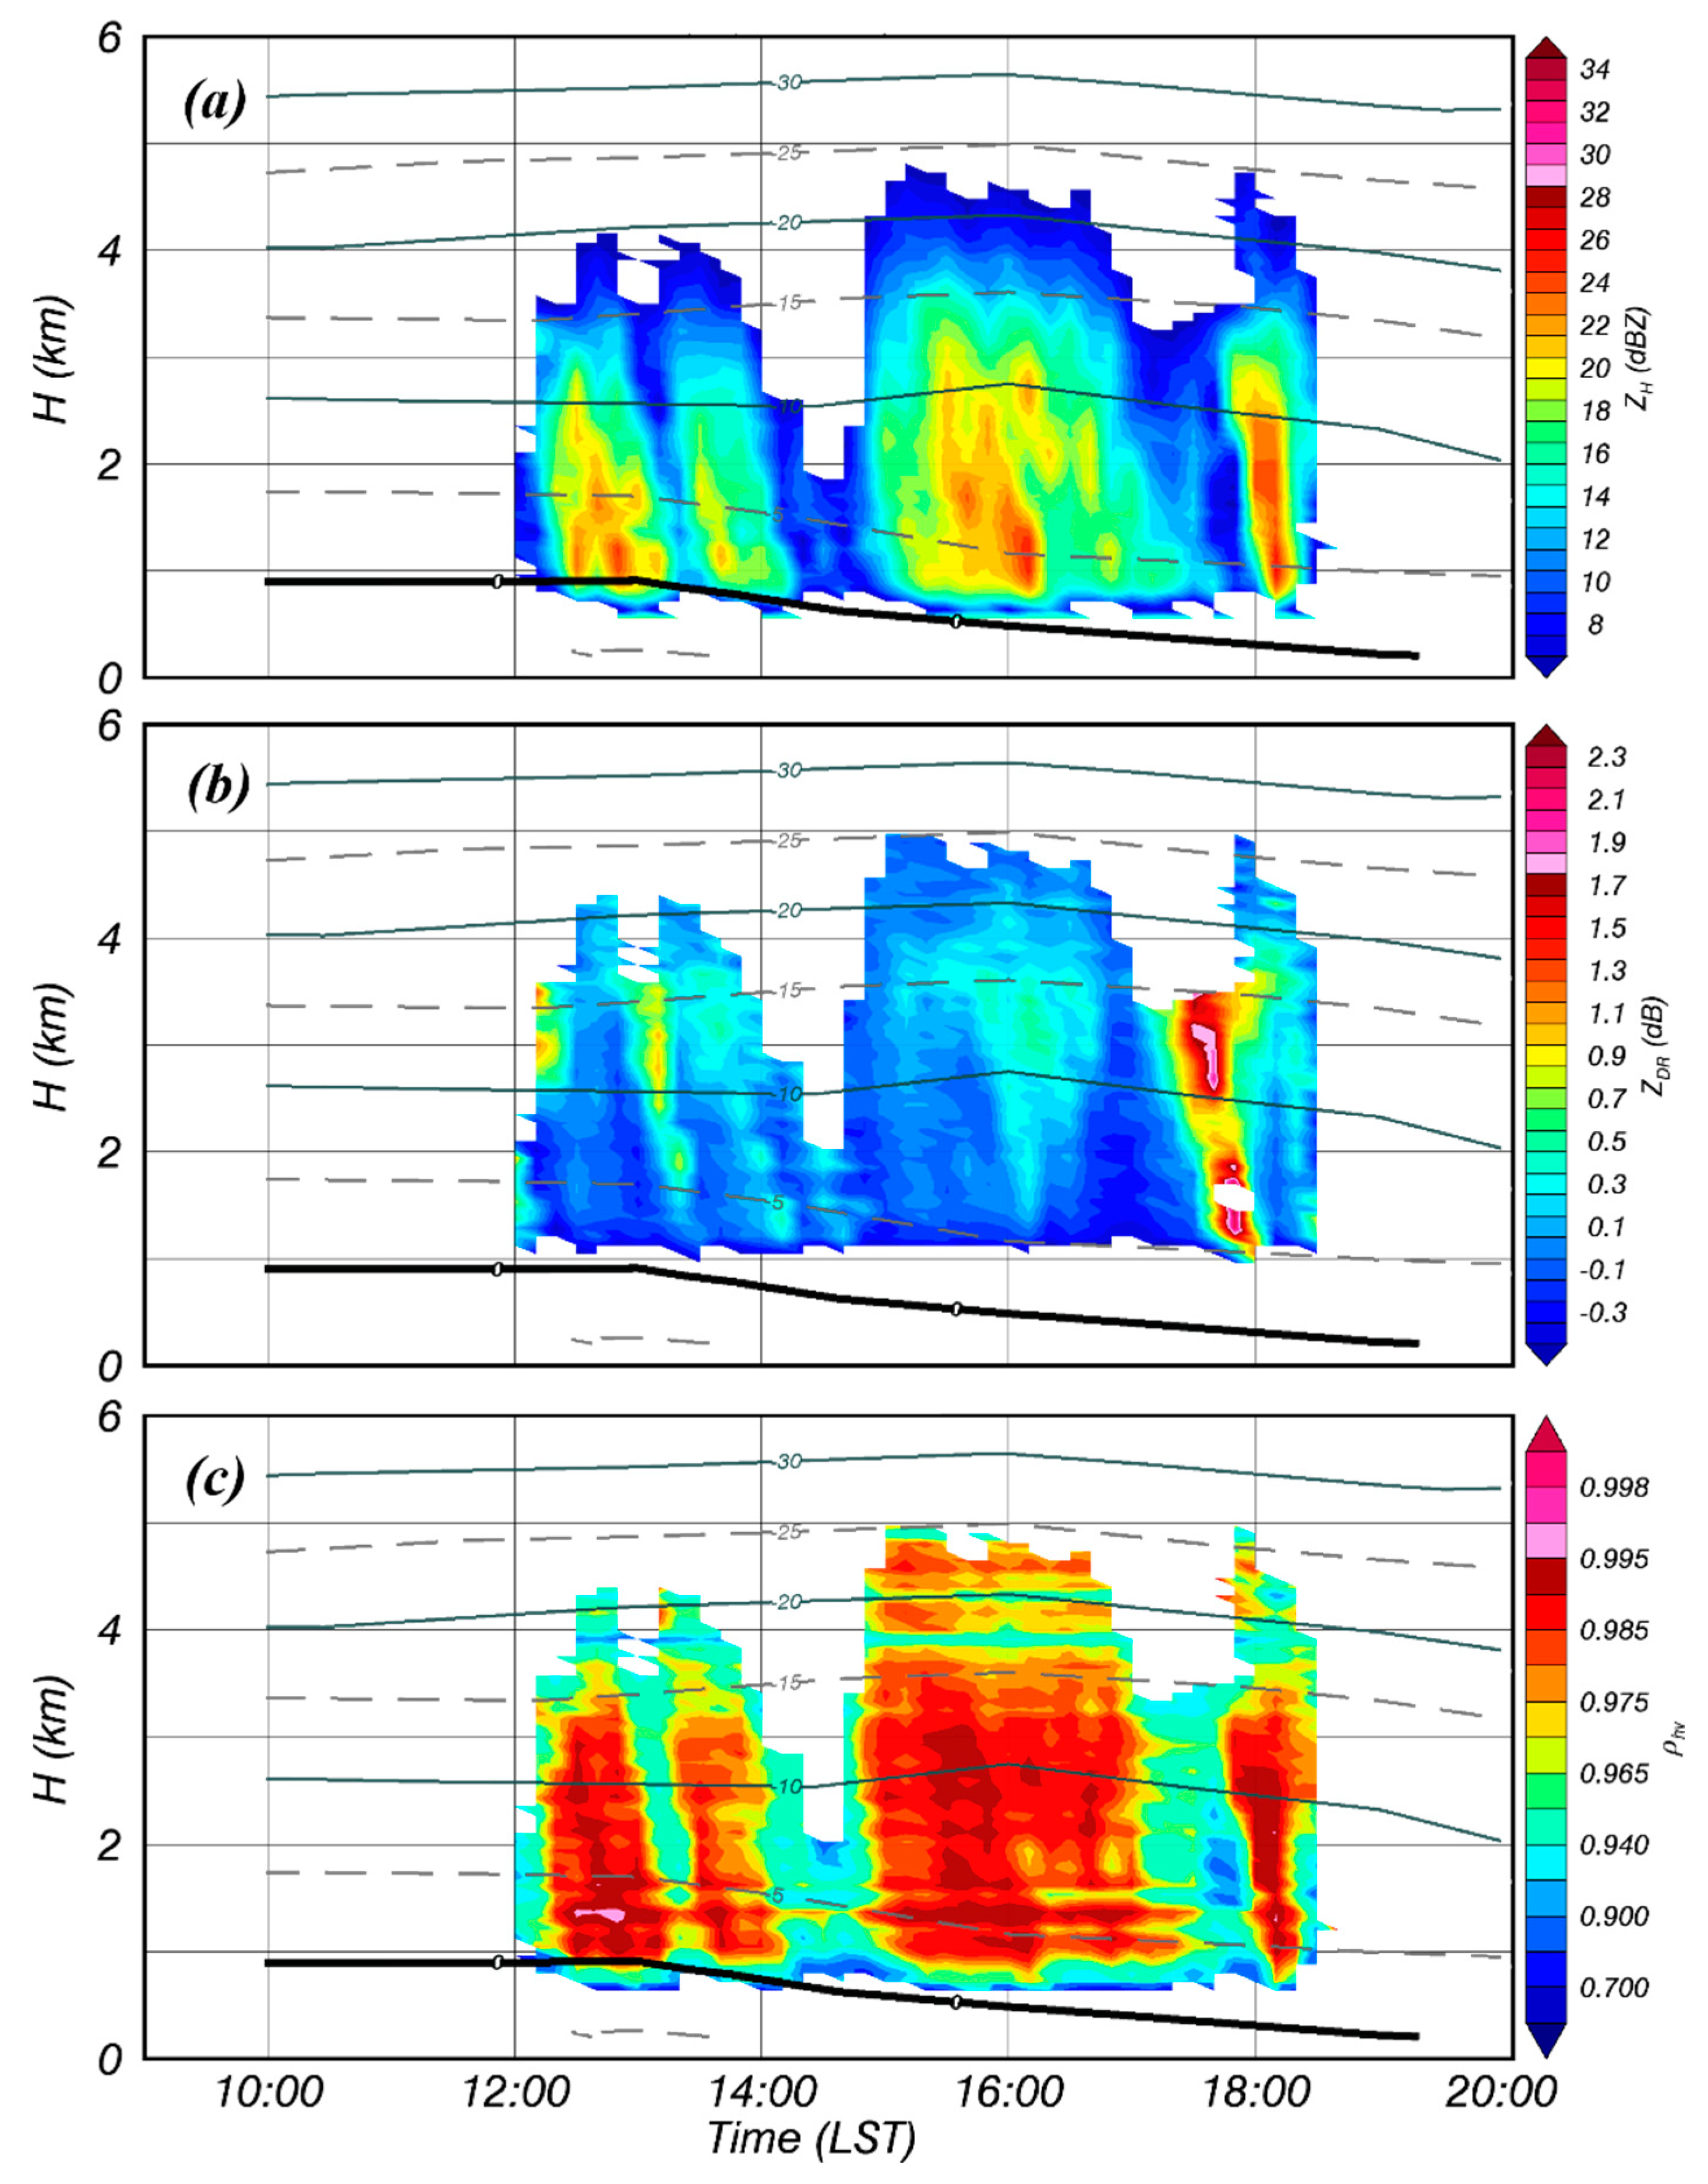
The vertical profile of T for C2 satisfied the conditions for generating melting snow, specifically, T continuously increased in the surface direction (Figure 11). Remarkably, the altitudes pertaining to 0 °C and −5 °C decreased continuously from approximately 1 and 1.8 km (1200 LST) to 0.4 and 1 km (1800 LST), respectively. QVP for C2 was generally similar to that of C1; however, the characteristics of the dual-pol radar variables were more prominent due to the height of the echo-top being up to 5 km (−25 °C). In the analysis period, four Z columns were observed, and the maximum Z was approximately 28 dBZ, similar to that of C1 (Figure 11a).
The features in the dendritic growth region for C1 were also observed in C2 (Figure 11b). These features appeared at 1230 LST, 1300 LST, and 1730 LST around the −15 °C region, which corresponded to the area in the ZDR streaks. In particular, for 1730 LST, a ZDR streak (~1.8 dB) was observed at an altitude between −15 °C and −5 °C, and Z and ρHV for the same period were approximately 10 dBZ and less than 0.96, respectively (Figure 11c). These features in C1 and C2 were in agreement with the results for the dendritic growth, presented by [62].

4.2. Verification of Simulated Radar Variables

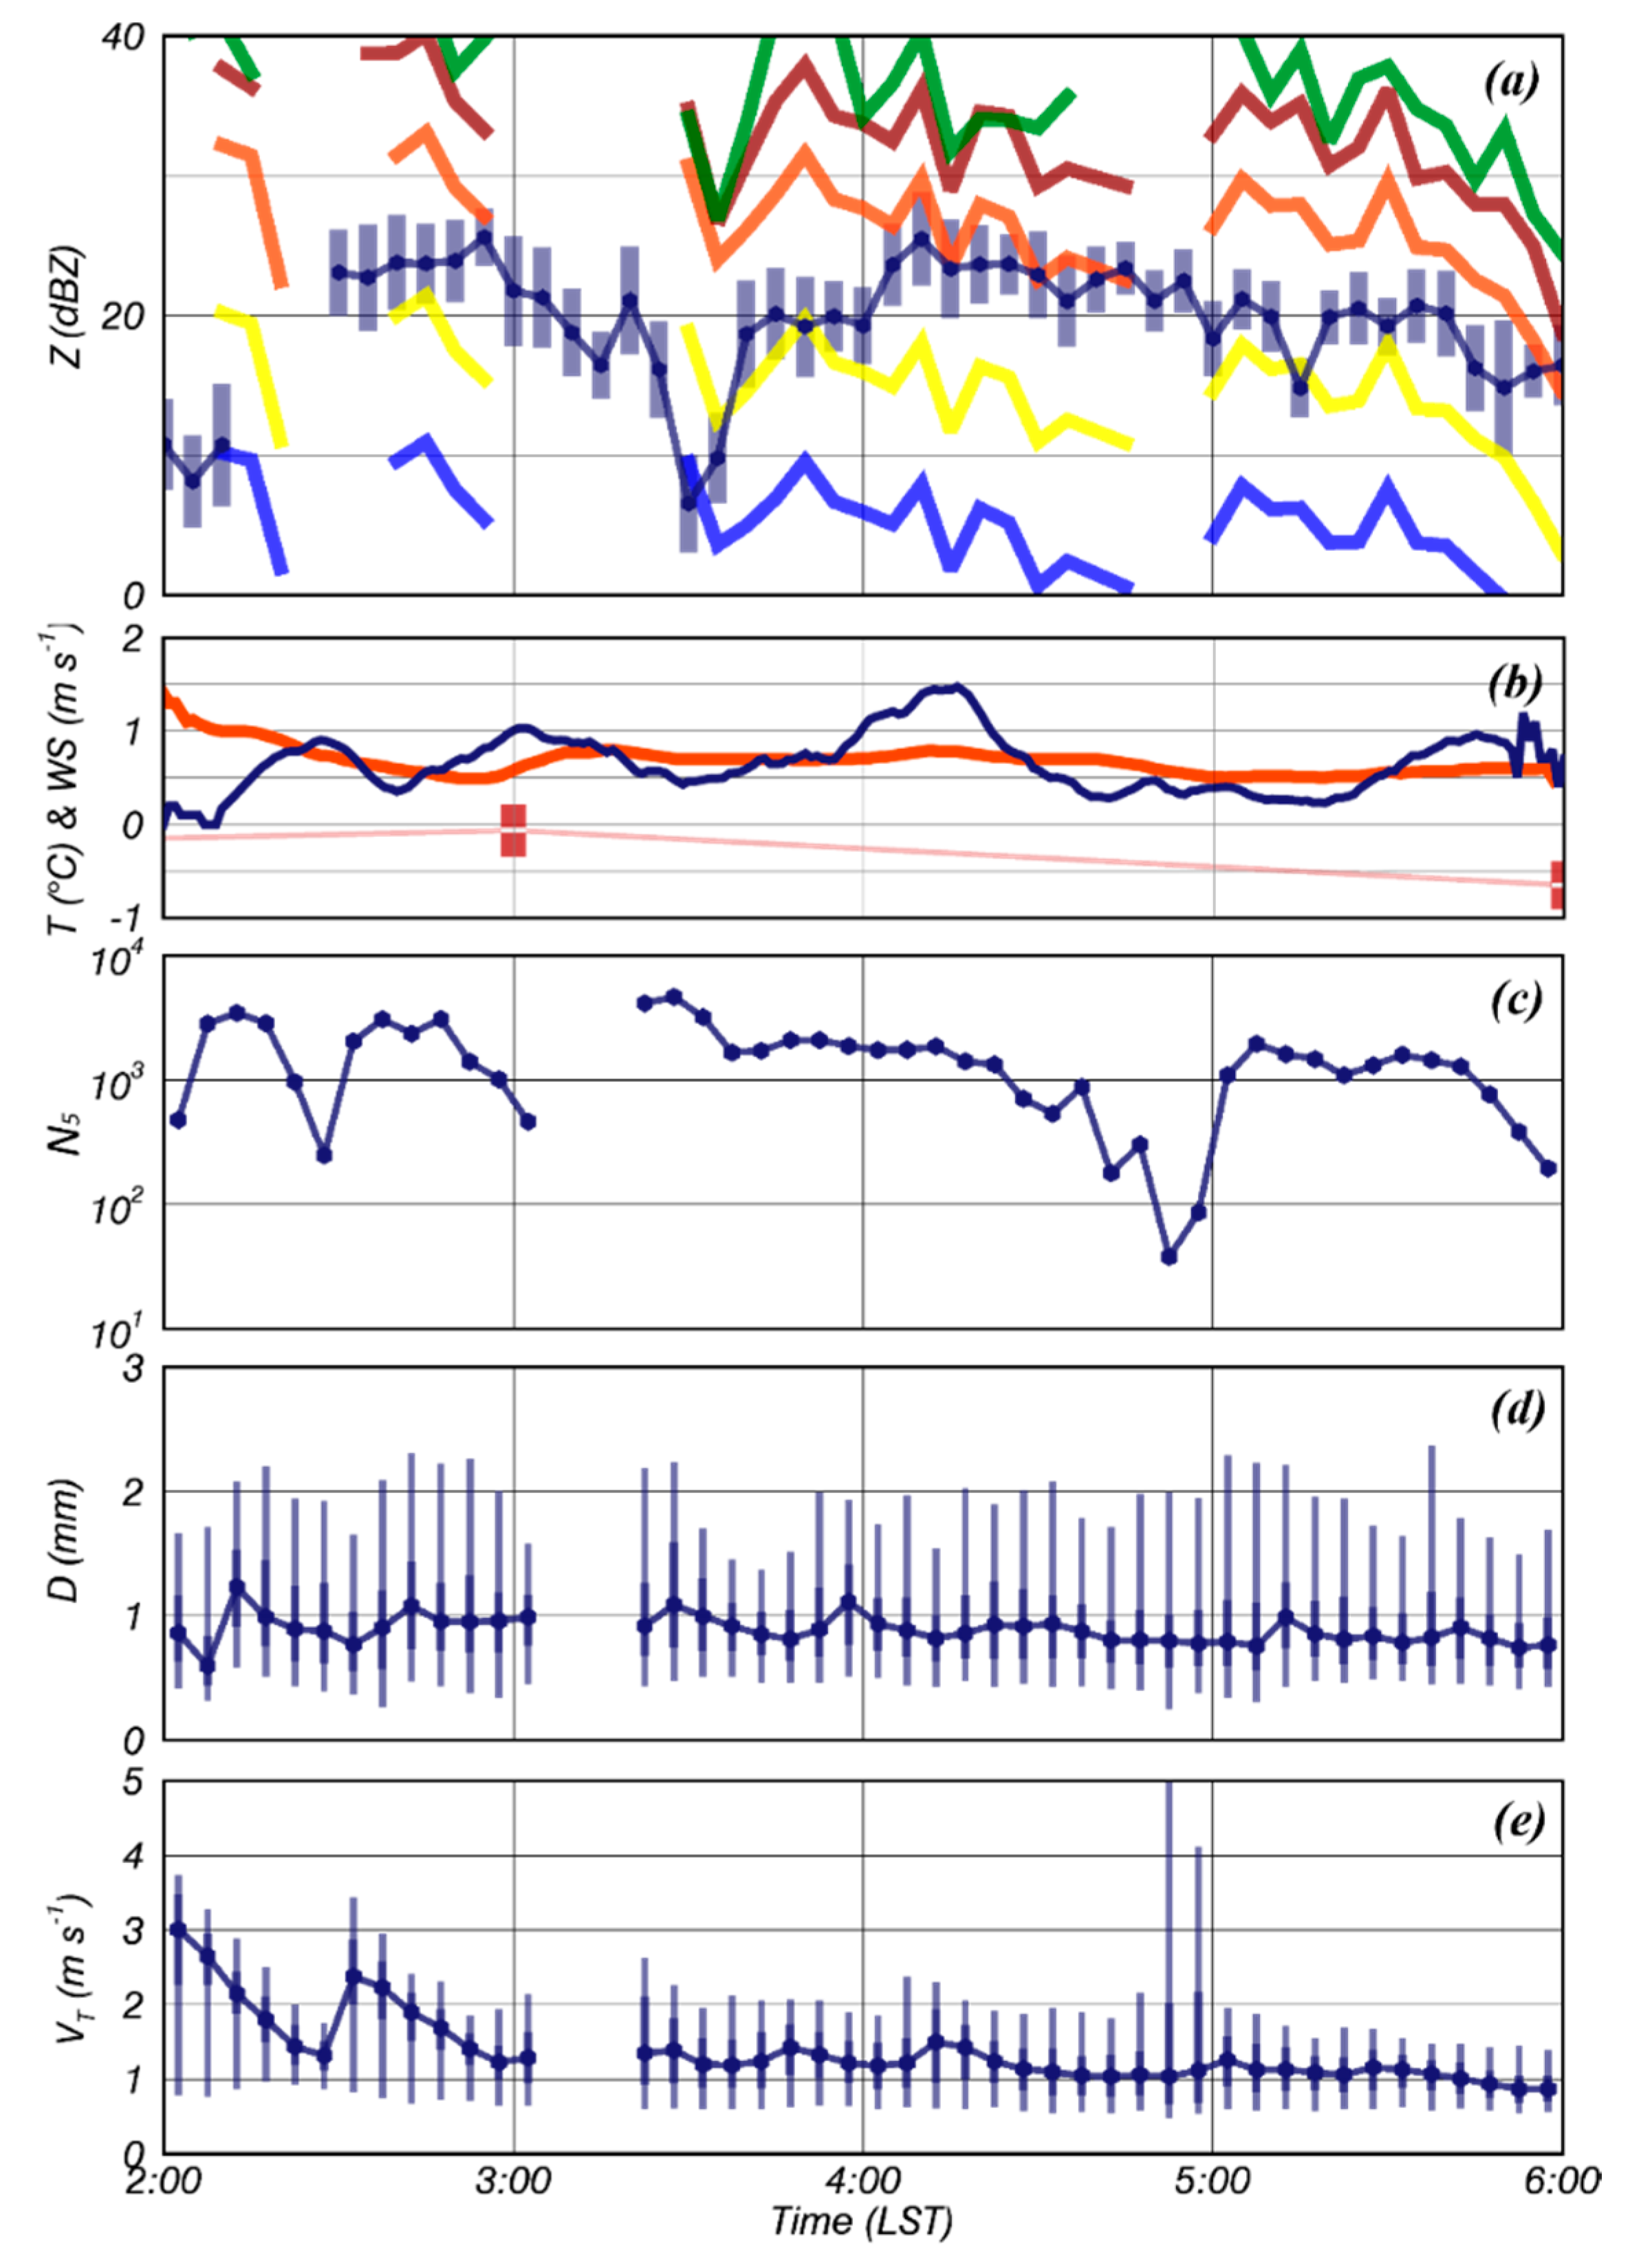
The observed N(D) and the relationships of ρs and FL suggested in this study were used as input information in the T-matrix scattering simulation. The simulated Z (ZS) for each T class was compared to the observed Z (ZO) cases. The observed Z was the averaged value for 15 data points (the five range gates by three azimuths) centered on the 2DVD site. The lowest radar elevation angle (0.2°) was selected to minimize the difference in the particle size distribution between the observation altitude and ground (~440 m). To confirm the ambient temperature for the observation altitude, a temperature of 600 m from the mean sea level using the MSM reanalysis data averaged 0.05° N × 0.05° E range centered on the 2DVD site was adopted (T6). This value is similar to the observation altitude from the mean sea level (~574 m). The observed Z in C1 lay within the range of ZS for the T class of from sub-zero to 1 °C, mostly in the range of 0 °C and 1 °C for ZS (Figure 12a,b). In this time, ZS emerged as a meaningful value, as T6 at 0300 LST was −0.06 °C.
The 10-m height wind speed (WS) during the analysis period had gentle conditions less than 1 m·s−1 except for 0420 LST (Figure 12b). When the number of particles for 5 min (N5) was insufficient (less than 103) or the surface observation conditions were unstable, variations in ZS appeared up to 9 dBZ (Figure 12c). Therefore, the corresponding data were judged to be unreliable and excluded from the analysis. For instance, there was a discrepancy of ZS with the observed values from 0540 LST because of the decrease in N5 being less than 103. Moreover, ZS decreased between 0450 and 0500 LST due to the unstable ground observation condition. In this period, the value of VT dramatically increased up to 5 m·s−1, and N5 decreased to approximately 50 from 4 × 10² for 5 min. As ZS at 0600 LST was simulated considering an insufficient number of particles (N5 < 103), ZS from 0530 LST decreased with N5, and the relationship with ZO could not be confirmed. Here, a phenomenon in which FL of wet snow changes as T decreases from about 1.5 °C to 0.5 °C at 0200–0300 LST can be confirmed indirectly in the time series of D (Figure 12d) and VT (Figure 12e). This is a feature corresponding to the results shown in Figure 6.
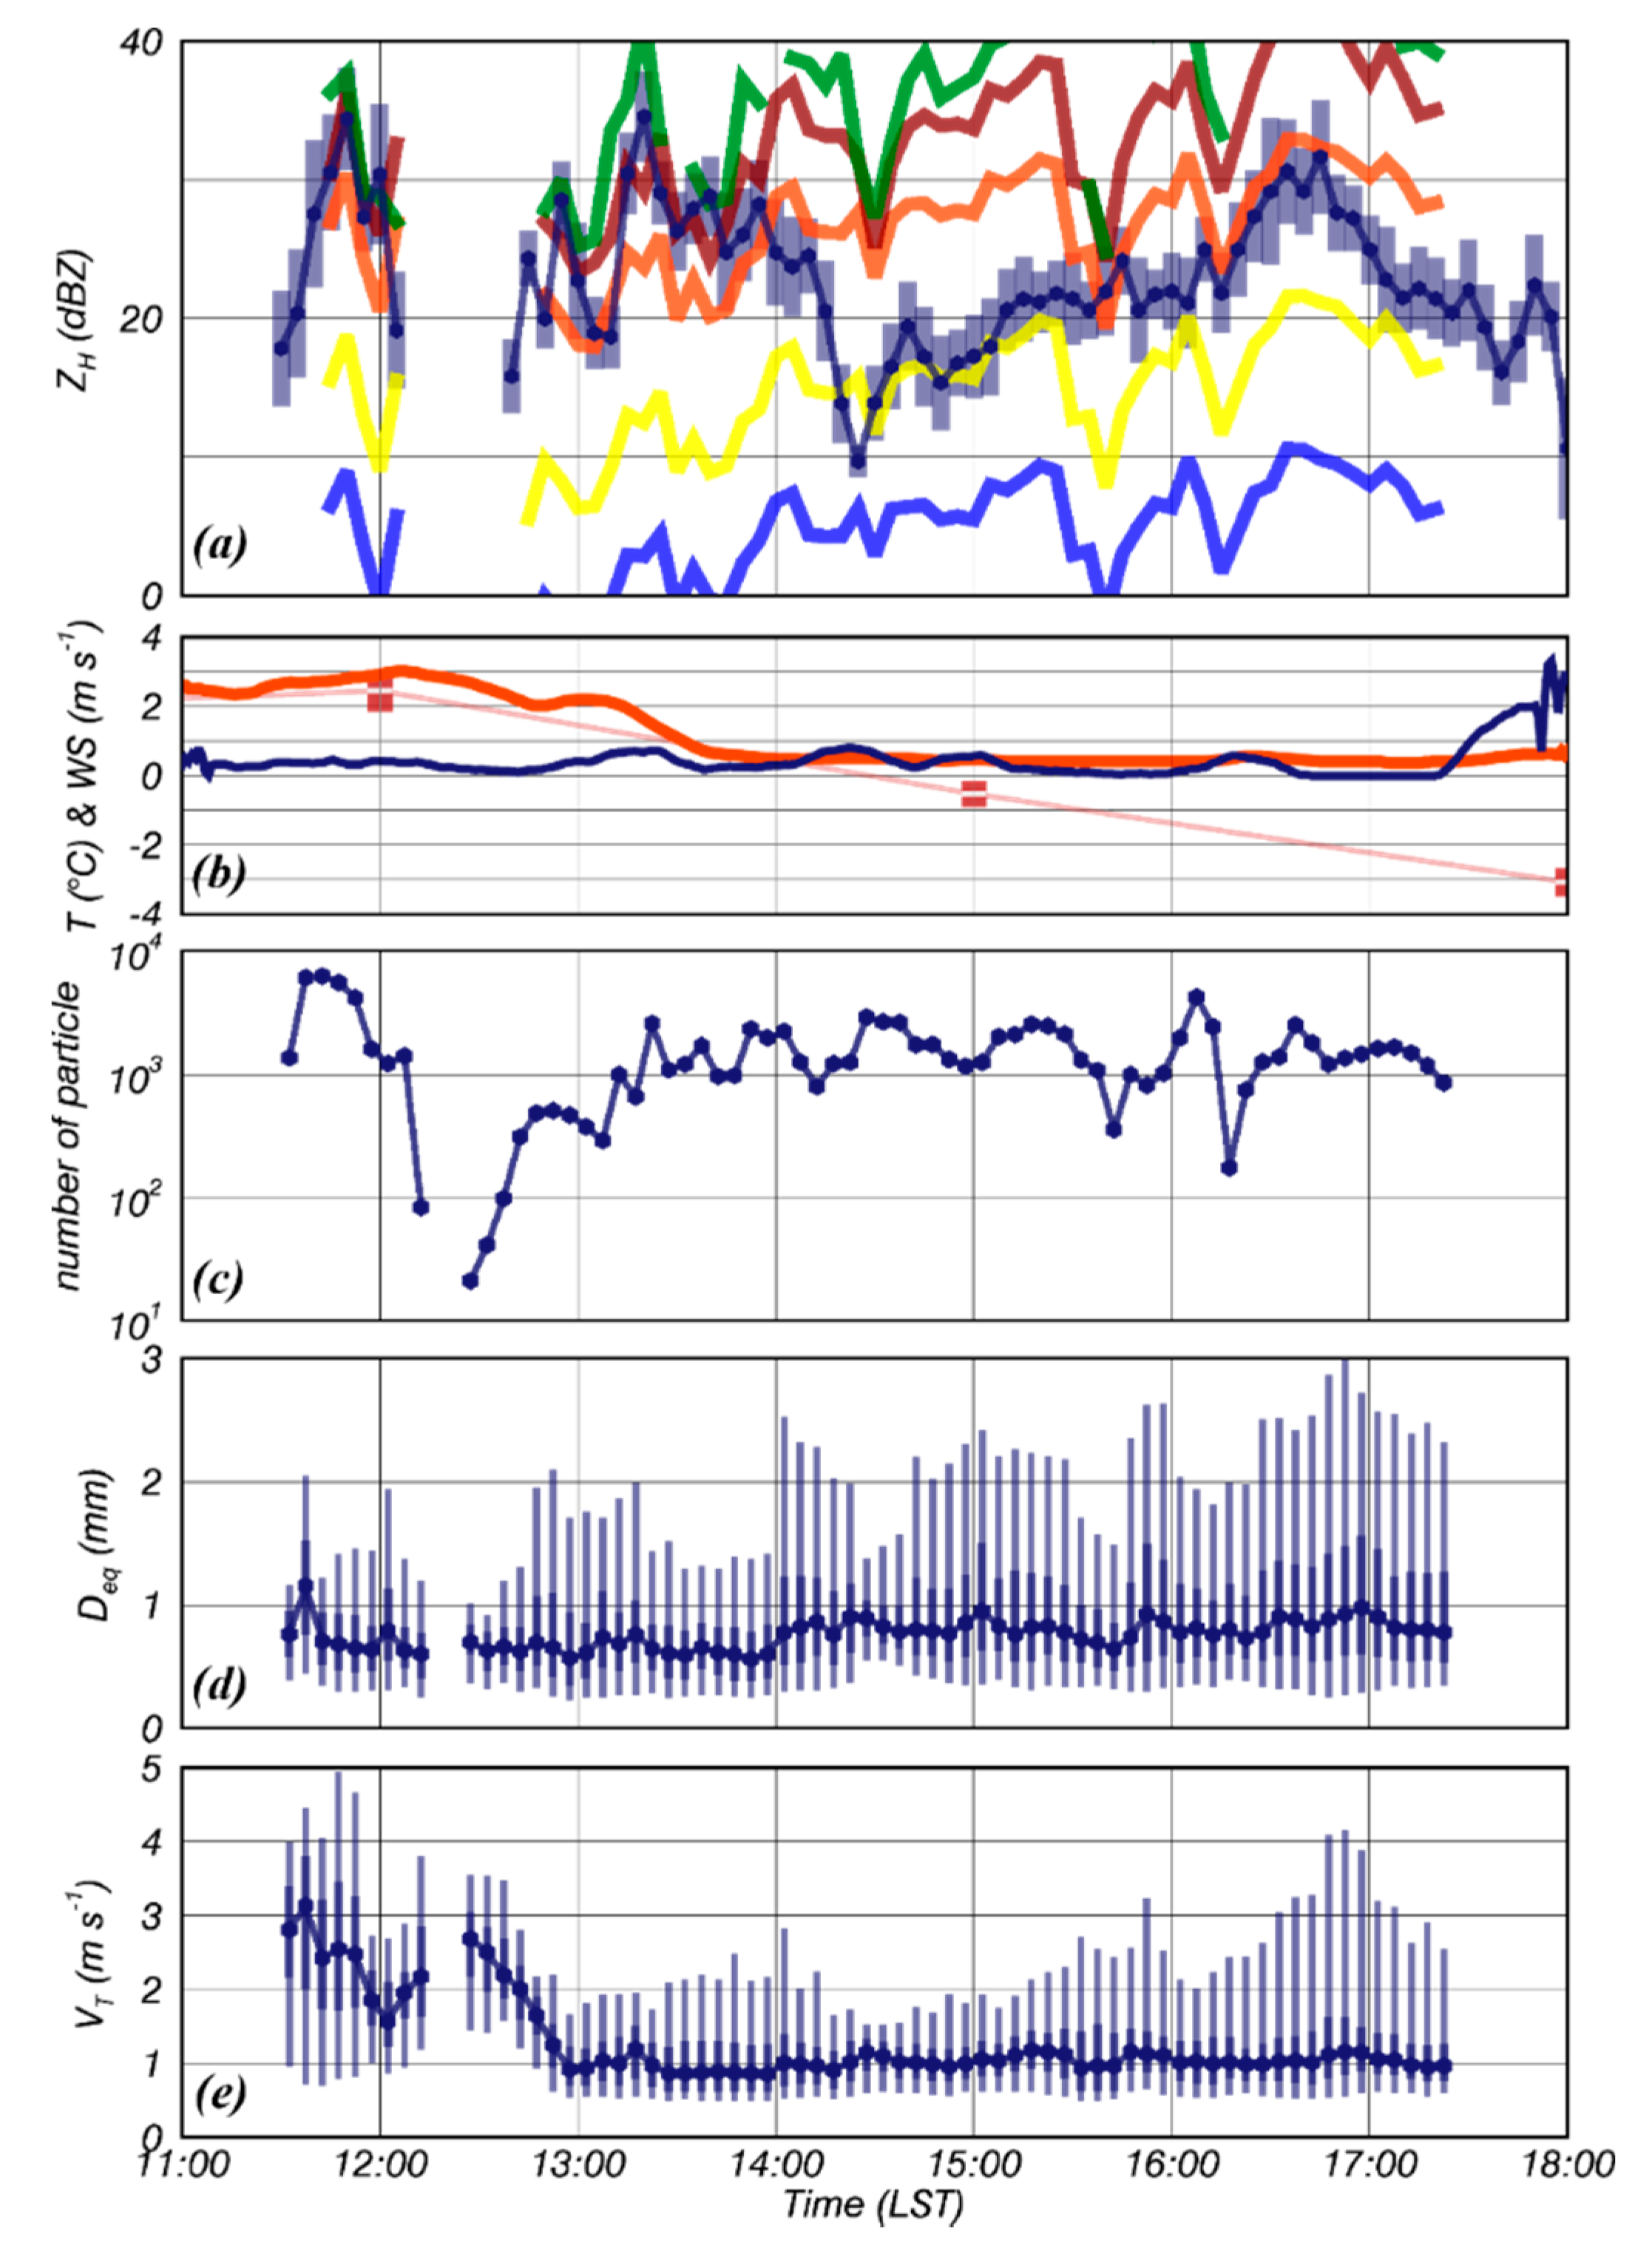
For C2 (28 March 2016), a total of three T6 values (1200, 1500, and 1800 LST) were included in the analysis period and the wind speed during the analysis period had gentle conditions less than 1 m·s−1 (Figure 13b). At 1200 LST and 1500 LST, T6 of 2.44 °C and −0.52 °C and standard deviations of 0.25 °C and 0.02 °C were observed, respectively. The feature that appears in the time series of D and VT during 1220–1300 LST can be explained by the decrease in T from 2.8 °C to 2 °C. At this time, Zo matched with ZS for 2 °C and 0 °C. Considering that the T class represented a range of ±0.5 °C around the reference value, the simulation performance for both the analysis periods could be considered to be satisfactory. In particular, as the average T was close to −0.5 °C at 1500 LST, ZS for 0 °C class exhibited a high correlation with Zo. The ZS at 1800 LST could not be simulated due to the absence of ground observation data. Considering all these features and the results of the scattering simulation for the verifications, the estimated FL values for wet snow obtained in the present study could be inferred to be reliable.

5. Discussions

Ground-based precipitation observation instruments are highly affected by the wind. The measurement errors of N(D) from Hurricane Ike (2008) observed by the PARSIVEL were confirmed to be due to the influence of strong wind [63]. However, these errors did not appear by tilting the PARSIVEL in a direction parallel to the wind. The measurement errors occurred when wind speed exceeded 20 m·s−1, although errors were also observed at as low as 10 m·s−1. Accordingly, it could be explained that the measurement errors appeared due to the influence of the strong wind that occurred near the ground.
Measurement errors for solid precipitation frequently range from 20–50% due to undercatch in windy conditions [6]. They found that the collection efficiency (y-axis) of solid precipitation measured by the Geonor sensor according to the wind speed (x-axis) follows the negative correlation (y = −0.09x + 0.94). Measurements from the Total Precipitation Sensor (TPS) observed at the Roundhouse (RND) weather station located 1.85 km above mean sea level is highly influenced by wind speed, resulting in errors of up to 100% in precipitation rates [64]. One of the reasons for the undercatch of precipitation results from the wind-induced updrafts at the gauge orifice. Depending on the existence of a windshield, the results of analyzing the catch efficiency by wind speed for the OTT Pluvio2 gauges, which are widely used for snowfall observation, showed a noticeable difference as the wind speed increased [65]. The average catch efficiencies of the seven cases with windshields showed a tendency to decrease from 0.95 to 0.6 from 1 m·s−1 to 5 m·s−1, and the catch efficiency was hardly decreased until the average wind speed was 2 m·s−1. However, the average catch efficiencies for the six cases without the windshield were relatively larger, ranging from 0.9 to 0.45. When the average wind speed was in the range of 1 m·s−1 and 2 m·s−1, it had a catch efficiency of about 0.8, which was about 0.15 lower than that of the windshield. The uncertainty in Geonor measurements can be about 44% when WS is between 0.5 and 3.5 m s−1, but when WS is more than 3.5 m·s−1, the Geonor could not measure any light snow [66]. During the cold seasons, bias with either wetting or evaporation can be about 15% and with undercatch, it can be more than 20% [67,68].
The third-generation 2DVD used in this study was designed to mitigate splashing and reduce wind-induced errors in response to [36], but like JWD, a windshield is still required for accurate measurements [69]. Most of the average wind speeds for snowfall cases analyzed in this study were less than 2 m·s−1. Therefore, it is difficult to explain the measurement errors caused by wind effects that may appear in the results of this study, which have a significant effect on the results of this study. However, as the data in this study were obtained in the outdoor field without a windshield, the measurement errors of the wind effect cannot be completely ignored. To resolve the issue of the wind effect, laboratory experiments free from the influence of wind e.g., [40] or additional research that could be conducted under conditions that minimize the influence of wind effects using a windshield should be considered.

6. Summary and Conclusions

This study was aimed at estimating FL through the surface shapes of snowflakes to enable quantitative snowfall estimation analyses. To this end, the characteristics of the physical variables and relationships according to each T class (for 1 °C intervals from −4.5 °C to 2.5 °C) were analyzed using FL and Ir of wet snow. To analyze the characteristics of the physical variables (VT, ρs, FL, and Ir) of wet snow according to T, statistical analysis was performed on eight snowfall cases under various conditions of surface T, as observed using the 2DVD in Jincheon, S. Korea.
According to the VT values, FL for wet snow was related to D as well as T. This phenomenon confirmed that FL estimated from ρs exhibited a negative power-law relationship with D, thereby demonstrating that FL depended on both T and D. Ir, which is independent of external forces such as wind and eddies near the surface, exhibited significant features in T regardless of D. The average values and related deviations of Ir were inversely proportional to T. In addition, because FL depended on both D and T, an FL relationship was proposed in terms of Ir, which could be directly identified via 2DVD measurements. In this scenario, the radar variables for wet snow can likely be estimated using only 2DVD without any T-related information.
The obtained features of FL for wet snow were verified by performing the T-matrix scattering simulation for two cases (C1, C2) simultaneously observed using 2DVD and YIT. The scattering simulation demonstrated that ZS exhibited a significant correlation with ZO in the two cases. In other words, the determined Ir and FL of wet snow by each T class, observed from the 2DVD, were reliable.
In particular, the Ir of wet snow calculated using the particle coordinate information included in 2DVD measurements could be adopted as a new indicator to estimate FL. However, the analyzed cases were limited in terms of the range of T considered. Insufficient measurements were obtained at −2 °C, −1 °C, and over 2 °C. Therefore, future work will be aimed at verifying the present results by considering multiple snowfall cases pertaining to various T classes to complement the presented analysis. In this manner, the quantitative snowfall estimation for wet snow considering FL can likely be realized. In addition, in future work, we intend to analyze the features of physical variables according to Ir for wet snow.

Author Contributions

S.-H.S., designed the study. S.-H.S. and C.-H.Y., collected the samples and performed the study. S.-H.S., H.-I.K. and E.-H.C., obtained the results and prepared the manuscript with contributions from all the coauthors. All the coauthors examined the results and checked the manuscript. All authors have read and agreed to the published version of the manuscript.

Funding

This research was supported by the Space Center Development Project (II) of the Ministry of Science and ICT (MSIT).

Institutional Review Board Statement

Not applicable.

Informed Consent Statement

Not applicable.

Data Availability Statement

The data obtained by 2DVD and YIT in this study are available on request from Korea Meteorological Administration (KMA).

Acknowledgments

We acknowledge the Weather Radar Center (WRC), KMA for providing the observational data.

Conflicts of Interest

The authors declare no conflict of interest.

References

  1. Stewart, R.; Crawford, R. Some characteristics of the precipitation formed within winter storms over eastern Newfoundland. Atmos. Res. 1995, 36, 17–37. [Google Scholar] [CrossRef]
  2. Knight, C.A. Observations of the morphology of melting snow. J. Atmos. Sci. 1979, 36, 1123–1130. [Google Scholar] [CrossRef]
  3. Houston, T.G.; Changnon, S.A. Freezing rain events: A major weather hazard in the conterminous US. Nat. Hazards 2006, 40, 485–494. [Google Scholar] [CrossRef]
  4. Frick, C.; Wernli, H. A Case Study of High-Impact Wet Snowfall in Northwest Germany (25–27 November 2005): Observations, Dynamics, and Forecast Performance. Weather. Forecast. 2012, 27, 1217–1234. [Google Scholar] [CrossRef]
  5. Cober, S.G.; Isaac, G.A.; Strapp, J.W. Characterizations of Aircraft Icing Environments that Include Supercooled Large Drops. J. Appl. Meteorol. 2001, 40, 1984–2002. [Google Scholar] [CrossRef]
  6. Rasmussen, R.M.; Baker, B.D.; Kochendorfer, J.; Meyers, T.; Landolt, S.; Fischer, A.P.; Black, J.; Thériault, J.M.; Kucera, P.; Gochis, D.J.; et al. How Well Are We Measuring Snow: The NOAA/FAA/NCAR Winter Precipitation Test Bed. Bull. Am. Meteorol. Soc. 2012, 93, 811–829. [Google Scholar] [CrossRef] [Green Version]
  7. Kruger, A.; Krajewski, W.F. Two-Dimensional Video Disdrometer: A Description. J. Atmos. Ocean. Technol. 2002, 19, 602–617. [Google Scholar] [CrossRef]
  8. Brandes, E.A.; Ikeda, K.; Zhang, G.; Schönhuber, M.; Rasmussen, R.M. A Statistical and Physical Description of Hydrometeor Distributions in Colorado Snowstorms Using a Video Disdrometer. J. Appl. Meteorol. Clim. 2007, 46, 634–650. [Google Scholar] [CrossRef]
  9. Zhang, G.; Xue, M.; Cao, Q.; Dawson, D. Diagnosing the Intercept Parameter for Exponential Raindrop Size Distribution Based on Video Disdrometer Observations: Model Development. J. Appl. Meteorol. Clim. 2008, 47, 2983–2992. [Google Scholar] [CrossRef] [Green Version]
  10. Wen, L.; Zhao, K.; Zhang, G.; Liu, S.; Chen, G. Impacts of Instrument Limitations on Estimated Raindrop Size Distribution, Radar Parameters, and Model Microphysics during Mei-Yu Season in East China. J. Atmos. Ocean. Technol. 2017, 34, 1021–1037. [Google Scholar] [CrossRef]
  11. Hansch, M. Fall Velocity and Shape of Snowflakes. Ph.D. Thesis, ETH Zürich, Zürich, Switzerland, 1999. [Google Scholar]
  12. Brandes, E.A.; Ikeda, K.; Thompson, G.; Schönhuber, M. Aggregate Terminal Velocity/Temperature Relations. J. Appl. Meteorol. Clim. 2008, 47, 2729–2736. [Google Scholar] [CrossRef] [Green Version]
  13. Huang, G.-J.; Bringi, V.N.; Cifelli, R.; Hudak, D.; Petersen, W.A. A Methodology to Derive Radar Reflectivity–Liquid Equivalent Snow Rate Relations Using C-Band Radar and a 2D Video Disdrometer. J. Atmos. Ocean. Technol. 2010, 27, 637–651. [Google Scholar] [CrossRef]
  14. Huang, G.-J.; Bringi, V.; Moisseev, D.; Petersen, W.; Bliven, L.; Hudak, D. Use of 2D-video disdrometer to derive mean density–size and Ze–SR relations: Four snow cases from the light precipitation validation experiment. Atmos. Res. 2015, 153, 34–48. [Google Scholar] [CrossRef]
  15. Böhm, H.P. A General Equation for the Terminal Fall Speed of Solid Hydrometeors. J. Atmos. Sci. 1989, 46, 2419–2427. [Google Scholar] [CrossRef]
  16. Vivekanandan, J.; Zrnic, D.S.; Ellis, S.M.; Oye, R.; Ryzhkov, A.V.; Straka, J. Cloud microphysics retrieval using S-band dual-polarization radar measurements. Bull. Am. Meteorol. Soc. 1999, 80, 381–388. [Google Scholar] [CrossRef]
  17. Liu, H.; Chandrasekar, V. Classification of Hydrometeors Based on Polarimetric Radar Measurements: Development of Fuzzy Logic and Neuro-Fuzzy Systems, and In Situ Verification. J. Atmos. Ocean. Technol. 2000, 17, 140–164. [Google Scholar] [CrossRef]
  18. Lim, S.; Chandrasekar, V.; Bringi, V. Hydrometeor classification system using dual-polarization radar measurements: Model improvements and in situ verification. IEEE Trans. Geosci. Remote. Sens. 2005, 43, 792–801. [Google Scholar] [CrossRef]
  19. Park, H.S.; Ryzhkov, A.V.; Zrnić, D.S.; Kim, K.-E. The Hydrometeor Classification Algorithm for the Polarimetric WSR-88D: Description and Application to an MCS. Weather. Forecast. 2009, 24, 730–748. [Google Scholar] [CrossRef]
  20. Grazioli, J.; Tuia, D.; Monhart, S.; Schneebeli, M.; Raupach, T.H.; Berne, A. Hydrometeor classification from two-dimensional video disdrometer data. Atmos. Meas. Tech. 2014, 7, 2869–2882. [Google Scholar] [CrossRef] [Green Version]
  21. Fujiyoshi, Y.; Endoh, T.; Yamada, T.; Tsuboki, K.; Tachibana, Y.; Wakahama, G. Determination of a Z-R relationship for snowfall using a radar and high sensitivity snow gauges. J. Appl. Meteorol. 1990, 29, 147–152. [Google Scholar] [CrossRef] [Green Version]
  22. Matrosov, S.Y. A Dual-Wavelength Radar Method to Measure Snowfall Rate. J. Appl. Meteorol. 1998, 37, 1510–1521. [Google Scholar] [CrossRef]
  23. Matrosov, S. Radar reflectivity in snowfall. IEEE Trans. Geosci. Remote. Sens. 1992, 30, 454–461. [Google Scholar] [CrossRef]
  24. Rasmussen, R.; Dixon, M.; Hage, F.; Cole, J.; Wade, C.; Tuttle, J.; Mcgettigan, S.; Carty, T.; Stevenson, L.; Fellner, W.; et al. Weather Support to Deicing Decision Making (WSDDM): A Winter Weather Nowcasting System. Bull. Am. Meteorol. Soc. 2001, 82, 579–595. [Google Scholar] [CrossRef] [Green Version]
  25. Atlas, D.; Srivastava, R.C.; Sekhon, R.S. Doppler radar characteristics of precipitation at vertical incidence. Rev. Geophys. 1973, 11, 1–35. [Google Scholar] [CrossRef]
  26. Langleben, M. The terminal velocity of snowflakes. QJR Meteorol. Soc. 1954, 80, 174–184. [Google Scholar] [CrossRef]
  27. Stewart, R.E.; Thériault, J.M.; Henson, W. On the Characteristics of and Processes Producing Winter Precipitation Types near 0 °C. Bull. Am. Meteorol. Soc. 2015, 96, 623–639. [Google Scholar] [CrossRef] [Green Version]
  28. Barthazy, E.; Schefold, R. Fall velocity of snowflakes of different riming degree and crystal types. Atmos. Res. 2006, 82, 391–398. [Google Scholar] [CrossRef]
  29. Mitra, S.K.; Vohl, O.; Ahr, M.; Pruppacher, H.R. A Wind Tunnel and Theoretical Study of the Melting Behavior of Atmos. Ice Particles. IV: Experiment and Theory for Snow Flakes. J. Atmos. Sci. 1990, 47, 584–591. [Google Scholar] [CrossRef] [Green Version]
  30. Yuter, S.E.; Kingsmill, D.E.; Nance, L.B.; Löffler-Mang, M. Observations of Precipitation Size and Fall Speed Characteristics within Coexisting Rain and Wet Snow. J. Appl. Meteorol. Clim. 2006, 45, 1450–1464. [Google Scholar] [CrossRef] [Green Version]
  31. Roebber, P.J.; Bruening, S.L.; Schultz, D.M.; Cortinas, J.V., Jr. Improving snowfall forecasting by diagnosing snow density. Weather Forecast. 2003, 18, 264–287. [Google Scholar] [CrossRef] [Green Version]
  32. Rasmussen, R.; Dixon, M.; Vasiloff, S.; Hage, F.; Knight, S.; Vivekanandan, J.; Xu, M. Snow Nowcasting Using a Real-Time Correlation of Radar Reflectivity with Snow Gauge Accumulation. J. Appl. Meteorol. 2003, 42, 20–36. [Google Scholar] [CrossRef] [Green Version]
  33. Smith, P.L. Equivalent Radar Reflectivity Factors for Snow and Ice Particles. J. Clim. Appl. Meteorol. 1984, 23, 1258–1260. [Google Scholar] [CrossRef] [Green Version]
  34. Sihvola, A.H. Electromagnetic Mixing Formulas and Applications; Institution of Engineering and Technology: London, UK, 1999; p. 47. [Google Scholar]
  35. Gourley, J.J.; Tabary, P.; Du Chatelet, J.P. A Fuzzy Logic Algorithm for the Separation of Precipitating from Nonprecipitating Echoes Using Polarimetric Radar Observations. J. Atmos. Ocean. Technol. 2007, 24, 1439–1451. [Google Scholar] [CrossRef]
  36. Nešpor, V.; Krajewski, W.F.; Kruger, A. Wind-Induced Error of Raindrop Size Distribution Measurement Using a Two-Dimensional Video Disdrometer. J. Atmos. Ocean. Technol. 2000, 17, 1483–1492. [Google Scholar] [CrossRef]
  37. Tokay, A.; Wolff, D.B.; Petersen, W.A. Evaluation of the New Version of the Laser-Optical Disdrometer, OTT Parsivel2. J. Atmos. Ocean. Technol. 2014, 31, 1276–1288. [Google Scholar] [CrossRef]
  38. Thurai, M.; Bringi, V.N. Drop Axis Ratios from a 2D Video Disdrometer. J. Atmos. Ocean. Technol. 2005, 22, 966–978. [Google Scholar] [CrossRef]
  39. Thurai, M.; Bringi, V.N.; Szakáll, M.; Mitra, S.K.; Beard, K.V.; Borrmann, S. Drop Shapes and Axis Ratio Distributions: Comparison between 2D Video Disdrometer and Wind-Tunnel Measurements. J. Atmos. Ocean. Technol. 2009, 26, 1427–1432. [Google Scholar] [CrossRef]
  40. Suh, S.-H.; Maki, M.; Iguchi, M.; Lee, D.-I.; Yamaji, A.; Momotani, T. Free-fall experiments of volcanic ash particles using a 2-D video disdrometer. Atmos. Meas. Tech. 2019, 12, 5363–5379. [Google Scholar] [CrossRef] [Green Version]
  41. Kunii, D.; Levenspiel, O. Fluidization Engineering; John Wiley: Hoboken, NJ, USA, 1969; Volume 8, pp. 44–45. [Google Scholar]
  42. Tran-Cong, S.; Gay, M.; Michaelides, E.E. Drag coefficients of irregularly shaped particles. Powder Technol. 2004, 139, 21–32. [Google Scholar] [CrossRef]
  43. Hölzer, A.; Sommerfeld, M. New simple correlation formula for the drag coefficient of non-spherical particles. Powder Technol. 2008, 184, 361–365. [Google Scholar] [CrossRef]
  44. Bagheri, G.; Bonadonna, C.; Manzella, I.; Vonlanthen, P. On the characterization of size and shape of irregular particles. Powder Technol. 2015, 270, 141–153. [Google Scholar] [CrossRef]
  45. Berrezueta, E.; Cuervas-Mons, J.; Rodríguez-Rey, Á.; Ordóñez-Casado, B. Representativity of 2D Shape Parameters for Mineral Particles in Quantitative Petrography. Minerals 2019, 9, 768. [Google Scholar] [CrossRef] [Green Version]
  46. Beard, K.V.; Chuang, C. A New Model for the Equilibrium Shape of Raindrops. J. Atmos. Sci. 1987, 44, 1509–1524. [Google Scholar] [CrossRef]
  47. Thurai, M.; Huang, G.; Bringi, V.N.; Randeu, W.L.; Schonhuber, M. Drop Shapes, Model Comparisons, and Calculations of Polarimetric Radar Parameters in Rain. J. Atmos. Ocean. Technol. 2007, 24, 1019–1032. [Google Scholar] [CrossRef]
  48. Heymsfield, A.J.; Bansemer, A.; Schmitt, C.; Twohy, C.; Poellot, M.R. Effective Ice Particle Densities Derived from Aircraft Data. J. Atmos. Sci. 2004, 61, 982–1003. [Google Scholar] [CrossRef]
  49. Heymsfield, A.J.; Lewis, S.; Bansemer, A.; Iaquinta, J.; Miloshevich, L.M.; Kajikawa, M.; Twohy, C.; Poellot, M.R. A General Approach for Deriving the Properties of Cirrus and Stratiform Ice Cloud Particles. J. Atmos. Sci. 2002, 59, 3–29. [Google Scholar] [CrossRef]
  50. Fehlmann, M.; Rohrer, M.; Von Lerber, A.; Stoffel, M. Automated precipitation monitoring with the Thies disdrometer: Biases and ways for improvement. Atmos. Meas. Tech. 2020, 13, 4683–4698. [Google Scholar] [CrossRef]
  51. Atlas, D.; Kerker, M.; Hitschfeld, W. Scattering and attenuation by non-spherical atmospheric particles. J. Atmos. Terr. Phys. 1953, 3, 108–119. [Google Scholar] [CrossRef]
  52. Wang, Y. The Application of Spectral Analysis and Artificial Intelligence Methods to Weather Radar. Ph.D. Thesis, University of Oklahoma, Norman, OK, USA, 2010. [Google Scholar]
  53. Rasmussen, R.M.; Heymsfield, A.J. Melting and Shedding of Graupel and Hail. Part I: Model Physics. J. Atmos. Sci. 1987, 44, 2754–2763. [Google Scholar] [CrossRef] [Green Version]
  54. Ryzhkov, A.V.; Schuur, T.J.; Burgess, D.W.; Heinselman, P.L.; Giangrande, S.E.; Zrnic, D.S. The Joint Polarization Experiment: Polarimetric Rainfall Measurements and Hydrometeor Classification. Bull. Am. Meteorol. Soc. 2005, 86, 809–824. [Google Scholar] [CrossRef] [Green Version]
  55. Ryzhkov, A.; Zhang, P.; Reeves, H.; Kumjian, M.; Tschallener, T.; Troemel, S.; Simmer, C. Quasi-Vertical Profiles—A New Way to Look at Polarimetric Radar Data. J. Atmos. Ocean. Technol. 2016, 33, 551–562. [Google Scholar] [CrossRef]
  56. Saito, K.; Fujita, T.; Yamada, Y.; Ishida, J.-I.; Kumagai, Y.; Aranami, K.; Ohmori, S.; Nagasawa, R.; Kumagai, S.; Muroi, C.; et al. The Operational JMA Nonhydrostatic Mesoscale Model. Mon. Weather. Rev. 2006, 134, 1266–1298. [Google Scholar] [CrossRef]
  57. Schuur, T.; Ryzhkov, A.; Heinselman, P.; Zrnic, D.; Burgess, D.; Scharfenberg, K. Observations and Classification of Echoes with the Polarimetric WSR-88D Radar; Report of the National Severe Storms Laboratory; National Severe Storms Laboratory: Norman, OK, USA, 2003; Volume 46, p. 73069. [Google Scholar]
  58. Herzegh, P.H.; Jameson, A.R. Observing Precipitation through Dual-Polarization Radar Measurements. Bull. Am. Meteorol. Soc. 1992, 73, 1365–1374. [Google Scholar] [CrossRef] [Green Version]
  59. Ryzhkov, A.V.; Ganson, S.; Khain, A.; Pinsky, M.; Pokrovsky, A. Polarimetric characteristics of melting hail at S and C bands. In Proceedings of the 34th Conference on Radar Meteorology, Williamsburg, VA, USA, 5–9 October 2009; American Meteorology Society: Boston, MA, USA, 2009; p. 4. Available online: https://ams.confex.com/ams/34Radar/techprogram/paper_155571.htm (accessed on 11 May 2021).
  60. Ukichiro, N. Snow Crystals, Natural and Artificial; Harvard University Press: Cambridge, MA, USA, 1954. [Google Scholar]
  61. Libbrecht, K.; Rasmussen, P. The Snowflake: Winter’s Secret Beauty. In Stillwater; Voyageur Press: Minneapolis, MN, USA, 2003. [Google Scholar]
  62. Ryzhkov, A.; Reeves, H.; Schuur, T.; Kumjian, M.; Zrnic, D. Investigations of polarimetric radar signatures in winter storms and their relation to aircraft icing and freezing rain. In Proceedings of the 35th Conference on Radar Meteorology American Meteorological Society, Pittsburgh, PA, USA, 26–30 September 2011. [Google Scholar]
  63. Friedrich, K.; Higgins, S.; Masters, F.J.; Lopez, C.R. Articulating and Stationary PARSIVEL Disdrometer Measurements in Conditions with Strong Winds and Heavy Rainfall. J. Atmos. Ocean. Technol. 2013, 30, 2063–2080. [Google Scholar] [CrossRef]
  64. Gultepe, I.; Isaac, G.A.; Joe, P.; Kucera, P.A.; Thériault, J.M.; Fisico, T. Roundhouse (RND) Mountain Top Research Site: Measurements and Uncertainties for Winter Alpine Weather Conditions. Pure Appl. Geophys. PAGEOPH 2012, 171, 59–85. [Google Scholar] [CrossRef]
  65. Nitu, R.; Roulet, Y.-A.; Wolff, M.; Earle, M.; Reverdin, A.; Smith, C.; Kochendorfer, J.; Morin, S.; Rasmussen, R.; Wong, K.; et al. WMO Solid Precipitation Intercomparison Experiment (SPICE) (2012–2015); World Meteorological Organization: Geneva, Switzerald, 2019; Available online: https://repositorio.aemet.es/handle/20.500.11765/10839 (accessed on 11 May 2021).
  66. Zhang, L.; Zhao, L.; Xie, C.; Liu, G.; Gao, L.; Xiao, Y.; Shi, J.; Qiao, Y. Intercomparison of Solid Precipitation Derived from the Weighting Rain Gauge and Optical Instruments in the Interior Qinghai-Tibetan Plateau. Adv. Meteorol. 2015, 2015, 1–11. [Google Scholar] [CrossRef] [Green Version]
  67. Gultepe, I.; Rabin, R.; Ware, R.; Pavolonis, M. Light snow precipitation and effects on weather and climate. Adv. Geophys. 2016, 57, 47–210. [Google Scholar] [CrossRef]
  68. Zhang, Y.; Ohata, T.; Yang, D.; Davaa, G. Bias correction of daily precipitation measurements for Mongolia. Hydrol. Process. 2004, 18, 2991–3005. [Google Scholar] [CrossRef]
  69. Tokay, A.; Petersen, W.A.; Gatlin, P.; Wingo, M. Comparison of Raindrop Size Distribution Measurements by Collocated Disdrometers. J. Atmos. Ocean. Technol. 2013, 30, 1672–1690. [Google Scholar] [CrossRef]
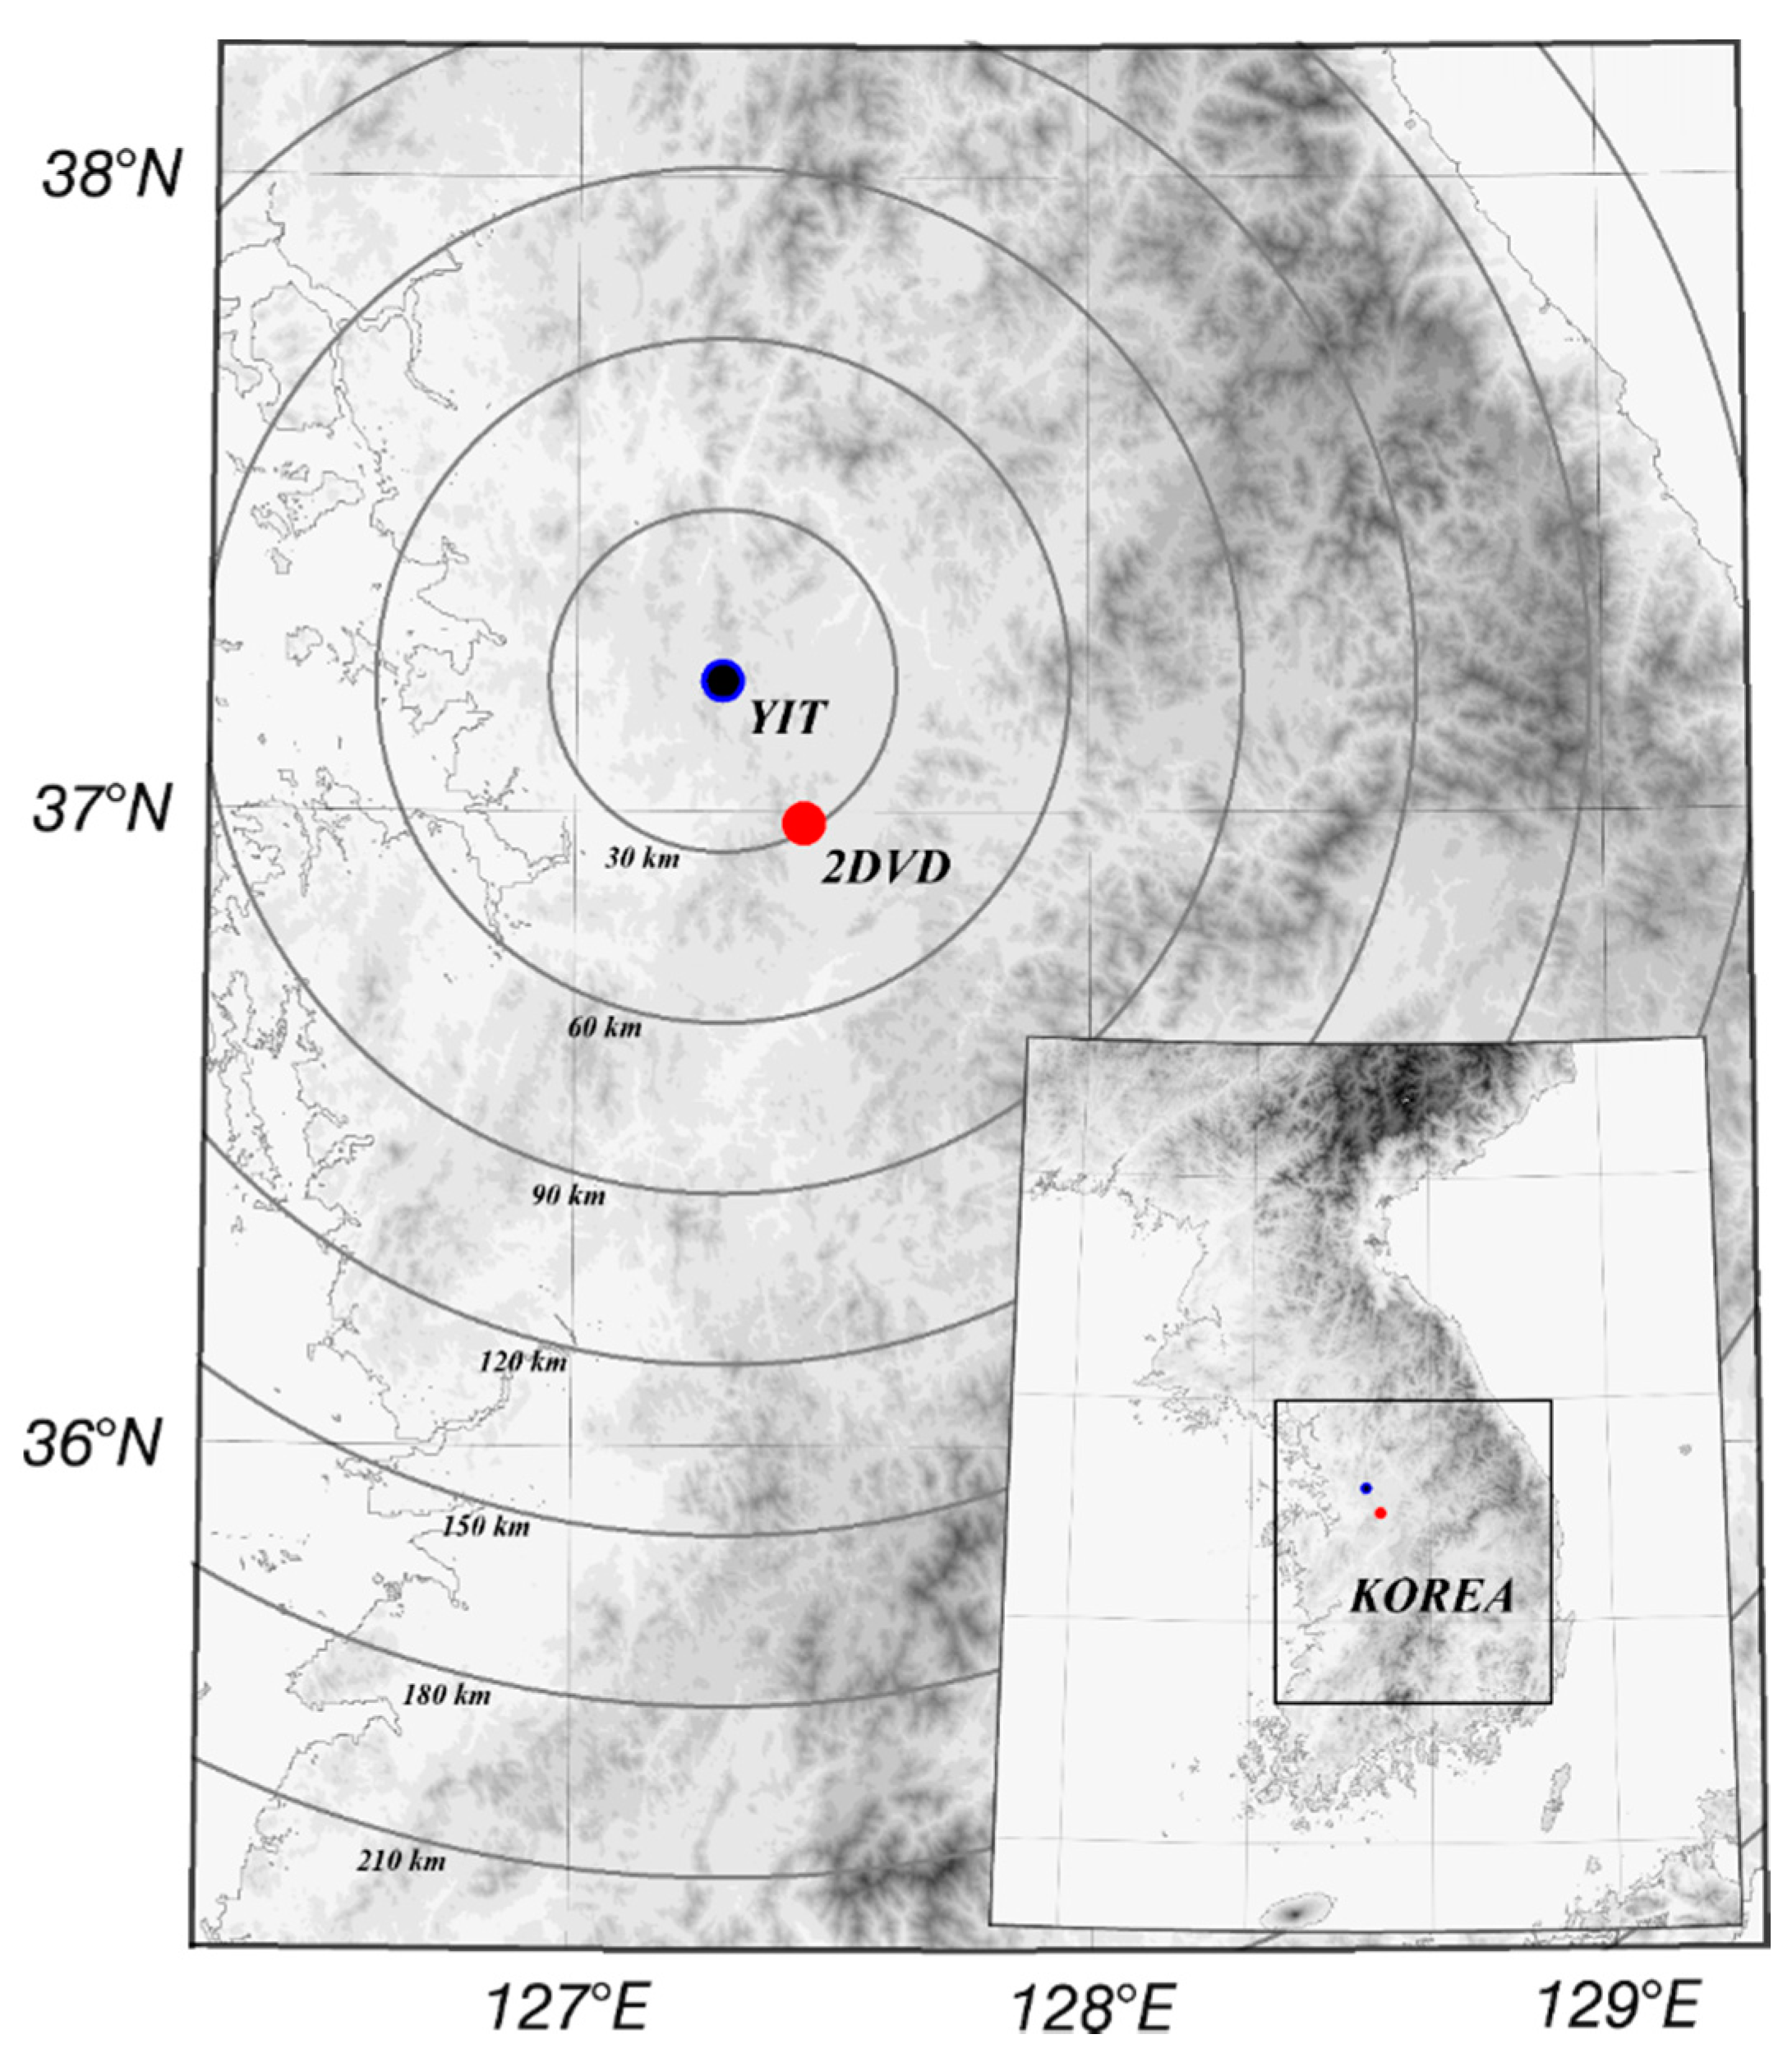
Figure 1. Locations of 2DVD (red bullet) and YIT dual-pol weather radar (blue bullet) deployed in South Korea.
Remotesensing 13 01901 g001
Figure 2. (a) Observation field managed by KMA and (b) the 2DVD deployed in the field.
Remotesensing 13 01901 g002
Figure 3. Frequency contours in the normalized logarithmic scale (0–1) indicated in color for D = 0.8–1.0 mm of (a) rainfall and (b) snowfall detected by the front-view camera of the 2DVD. The frequencies were obtained through a grid with a resolution of 0.03 mm × 0.03 mm and normalized with respect to the maximum value of log frequency in the whole grid.
Remotesensing 13 01901 g003
Figure 4. Schematic of 2D-projected snow particles detected using 2DVD. A is the projected area of the particle, and LMIN and LMAX are the minimum and maximum caliper lengths, respectively. CMIN and CMAX are circles with diameters of LMIN and LMAX, respectively. CE is an ellipsoid with LMIN and LMAX as the minor and major axes, respectively. P represents the projected outline coordinates of the particle, and ΔPi is the distance of the vertical coordinate between Pi and CE,i.
Remotesensing 13 01901 g004
Figure 5. Color−shaded 2D histogram plots of VT versus D for each T class. The color shades correspond to the data range of ±10% and ±25% from the median value. The black long− and dot−dashed lines denote the VT values for snow and melted snow, respectively [50]. The black solid line represents VT, as suggested in [51].
Remotesensing 13 01901 g005
Figure 6. Color−shaded 2D histogram plots of ρs versus D for each T class. The color shades correspond to the data range of ±10% and ±25% from the median value. The black long− and dot−dashed lines denote the relationships of ρs versus D for dry snow, as suggested in [48,50], respectively.
Remotesensing 13 01901 g006
Figure 7. Color−shaded 2D histogram plots of FL versus D for each T class. The color shades correspond to the data range of ±10% and ±25% from the median value.
Remotesensing 13 01901 g007
Figure 8. Color−shaded 2D histogram plots of Ir versus D for each T class. The color shades correspond to the data range of ±10% and ±25% from the median value.
Remotesensing 13 01901 g008
Figure 9. Color−shaded 2D histogram plots of Ir versus FL for each T class. The color shades correspond to the data range of ±10% and ±25% from the median value.
Remotesensing 13 01901 g009
Figure 10. Time series of the QVP of the dual-pol radar variables for C1 (27 February 2016): (a) Z, (b) ZDR, and (c) ρHV. The lines in the background of the figure are the vertical temperature profiles obtained using the MSM reanalysis data.
Remotesensing 13 01901 g010
Figure 11. Time series of the QVP of the dual-pol radar variables for C2 (28 February 2016): (a) Z, (b) ZDR, and (c) ρHV. The lines in the background of the figure are the vertical temperature profiles obtained using the MSM reanalysis data.
Remotesensing 13 01901 g011
Figure 12. Time series of (a) Z, (b) T, WS, and T6, and physical variables in 5 min intervals observed using the 2DVD: (c) N5, (d) quartiles of D, and (e) quartiles of VT for C1 (27 February 2016). The thin solid dark blue line in Figure 12a indicates the 3 ray-5 gate averaged ZO and its standard deviation. The blue, yellow, orange, and brick colored solid lines correspond to ZS under T values of −4 °C, 0 °C, 1 °C, and 2 °C, respectively. The green solid line in Figure 12a denotes ZS for the condition of a totally melted snowflake. The solid orange and blue lines in Figure 12b correspond to T and WS, respectively. The red solid line and vertical bar plot mean the average and standard deviation of T6, respectively.
Remotesensing 13 01901 g012
Figure 13. Time series of (a) Z, (b) T, WS, and T6, and physical variables in 5 min intervals observed using the 2DVD: (c) N5, (d) quartiles of D, and (e) quartiles of VT for C2 (28 February 2016). The thin solid dark blue line in Figure 13a indicates the 3 ray-5 gate averaged ZO and its standard deviation. The blue, yellow, orange, and brick colored solid lines correspond to ZS under T values of −4 °C, 0 °C, 1 °C, and 2 °C, respectively. The green solid line in Figure 13a denotes ZS for the condition of a totally melted snowflake. The solid orange and blue lines in Figure 13b correspond to T and WS, respectively. The red solid line and vertical bar plot mean the average and standard deviation of T6, respectively.
Remotesensing 13 01901 g013
Table 1. Information of the analyzed cases. T0 and WS0 denote the averaged T and wind speed (WS) for each analysis period, respectively.
YearMonDayObs. Time (LST)T0WS0YIT
201412300171721−4.70.5O
803260431−2.80.4
1216122058−1.3-
201511104450523−0.11.8
2016114210221350.12.2
18034215300.7-
227002706181.00.6O
28113121552.60.9O
Table 2. Specifications of YIT.
SpecificationsDetails
ModelDWSR-8501 S/K-SDP
Manufacturer EEC (US)
Transmitting tubeKlystron
Antenna diameter8.5 m
Transmitting frequency2.88 GHz
Peak power850 KW
Effective observational range240 km
Beam/Pulse width0.94°/2 μs
Wavelength10.41 cm
Range gate size250 m
Elev. height473 m
Long./Lat.127.2852 °E/37.2063 °N
Elev. angle (°)0.2, 0.6, 1.1, 1.8, 2.8, 4.2, 6.2, 9.1, 13.2, 19, 80
Obs. interval10 min
Table 3. Specifications of the 2DVD.
SpecificationsDetails
Resolution (horizontal)Higher than 0.19 mm
Resolution (vertical)Higher than 0.19 mm for fall velocities less than 10 m·s−1
Vertical velocity accuracyHigher than 4% for velocities less than 10 m·s−1
Sampling area/rate100 × 100 mm2/55 kHz
Rain rate compared to tipping bucketDifferences typically less than 10%
Main voltage100–240 V at 50/60 Hz
Power consumptionApproximately 500 W
Long./Lat. 127.4445 °E/36.9823 °N
Table 4. Relationships of the physical variables with the temperature. N denotes the number of snow particles.
T (°C)Sub-Zero012
Var.
N966136,96917,34428,620
ρs(D)0.086 D−1.360.155 D−1.150.392 D−1.230.840 D−0.82
FL(D) 0.077 D−1.100.302 D−1.340.833 D−0.85
Ir(D)0.840.840.810.79
FL(Ir) 0.12exp[−0.5(0.09−1(Ir-0.75))2]0.37exp[−0.5(0.08−1(Ir-0.78))2]0.77exp[−0.5(0.1−1(Ir-0.77))2]
Publisher’s Note: MDPI stays neutral with regard to jurisdictional claims in published maps and institutional affiliations.