
Characteristics of Rain-Induced Attenuation over Signal Links at Frequency Ranges of 25 and 38 GHz Observed in Beijing

 , , , ,
Abstract
:
1. Introduction
2. Materials and Methods
2.1. Rainfall Measurement Equipment
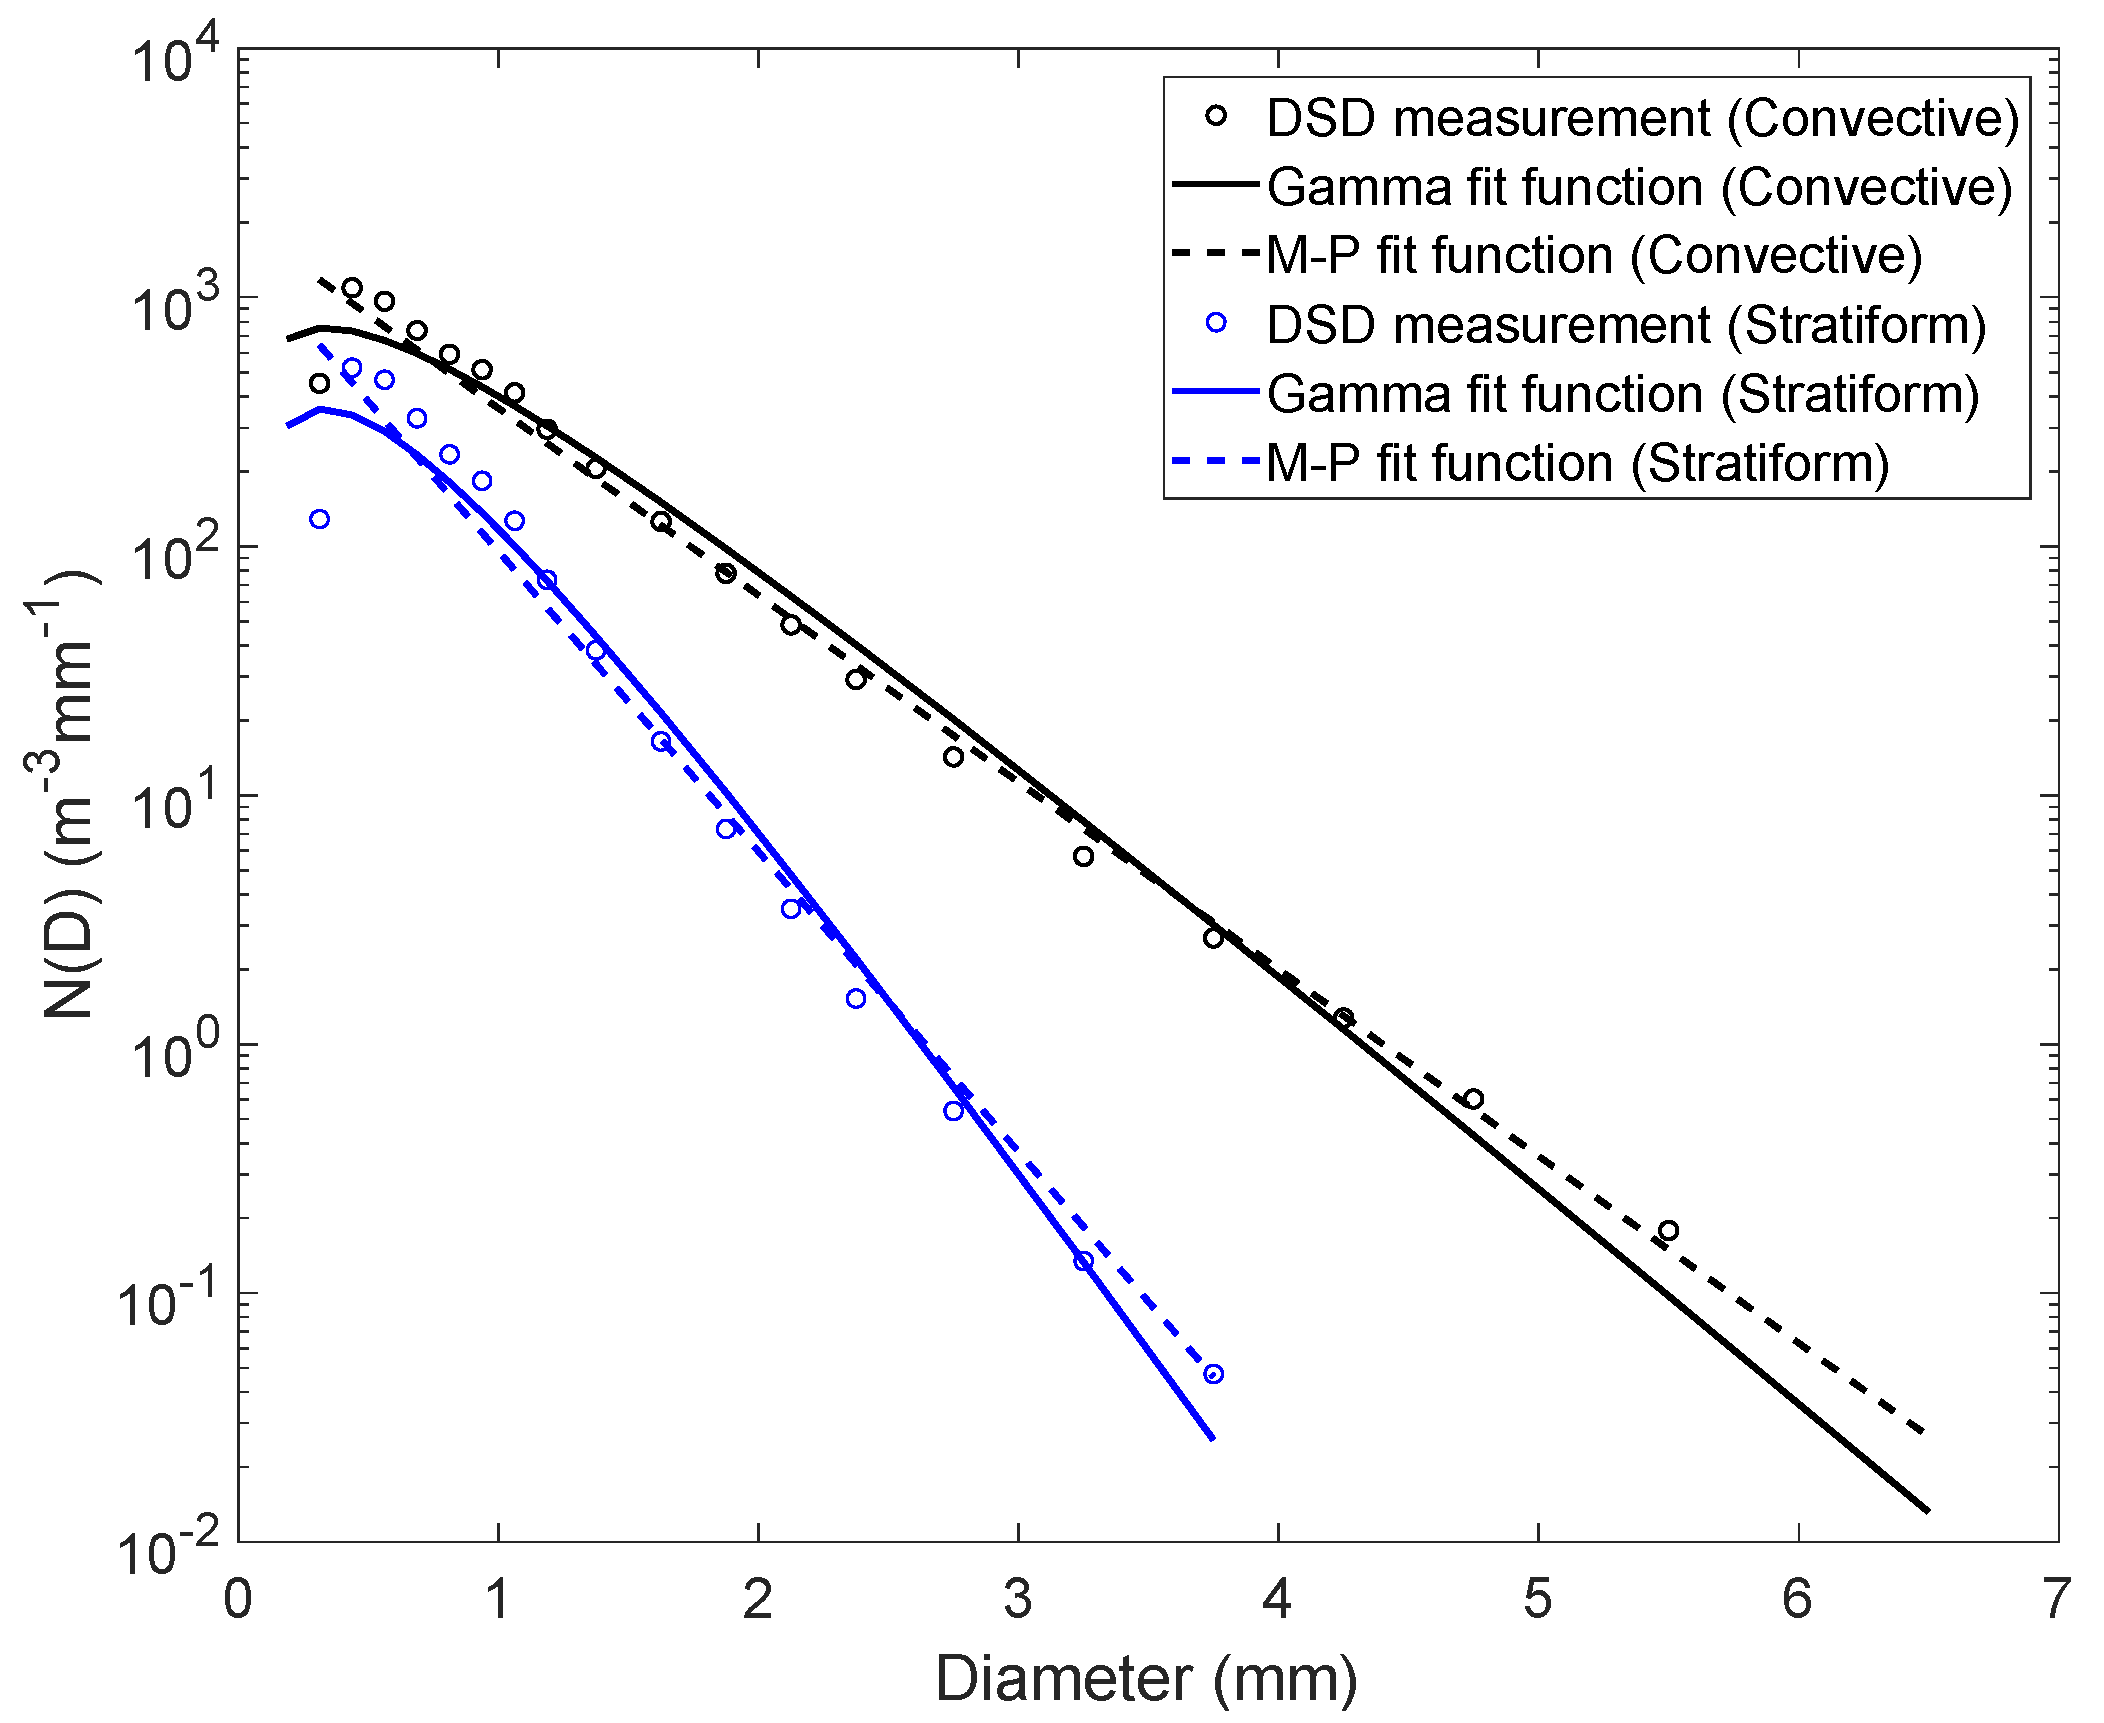
2.2. Particle Size Distribution and Rainfall Rate
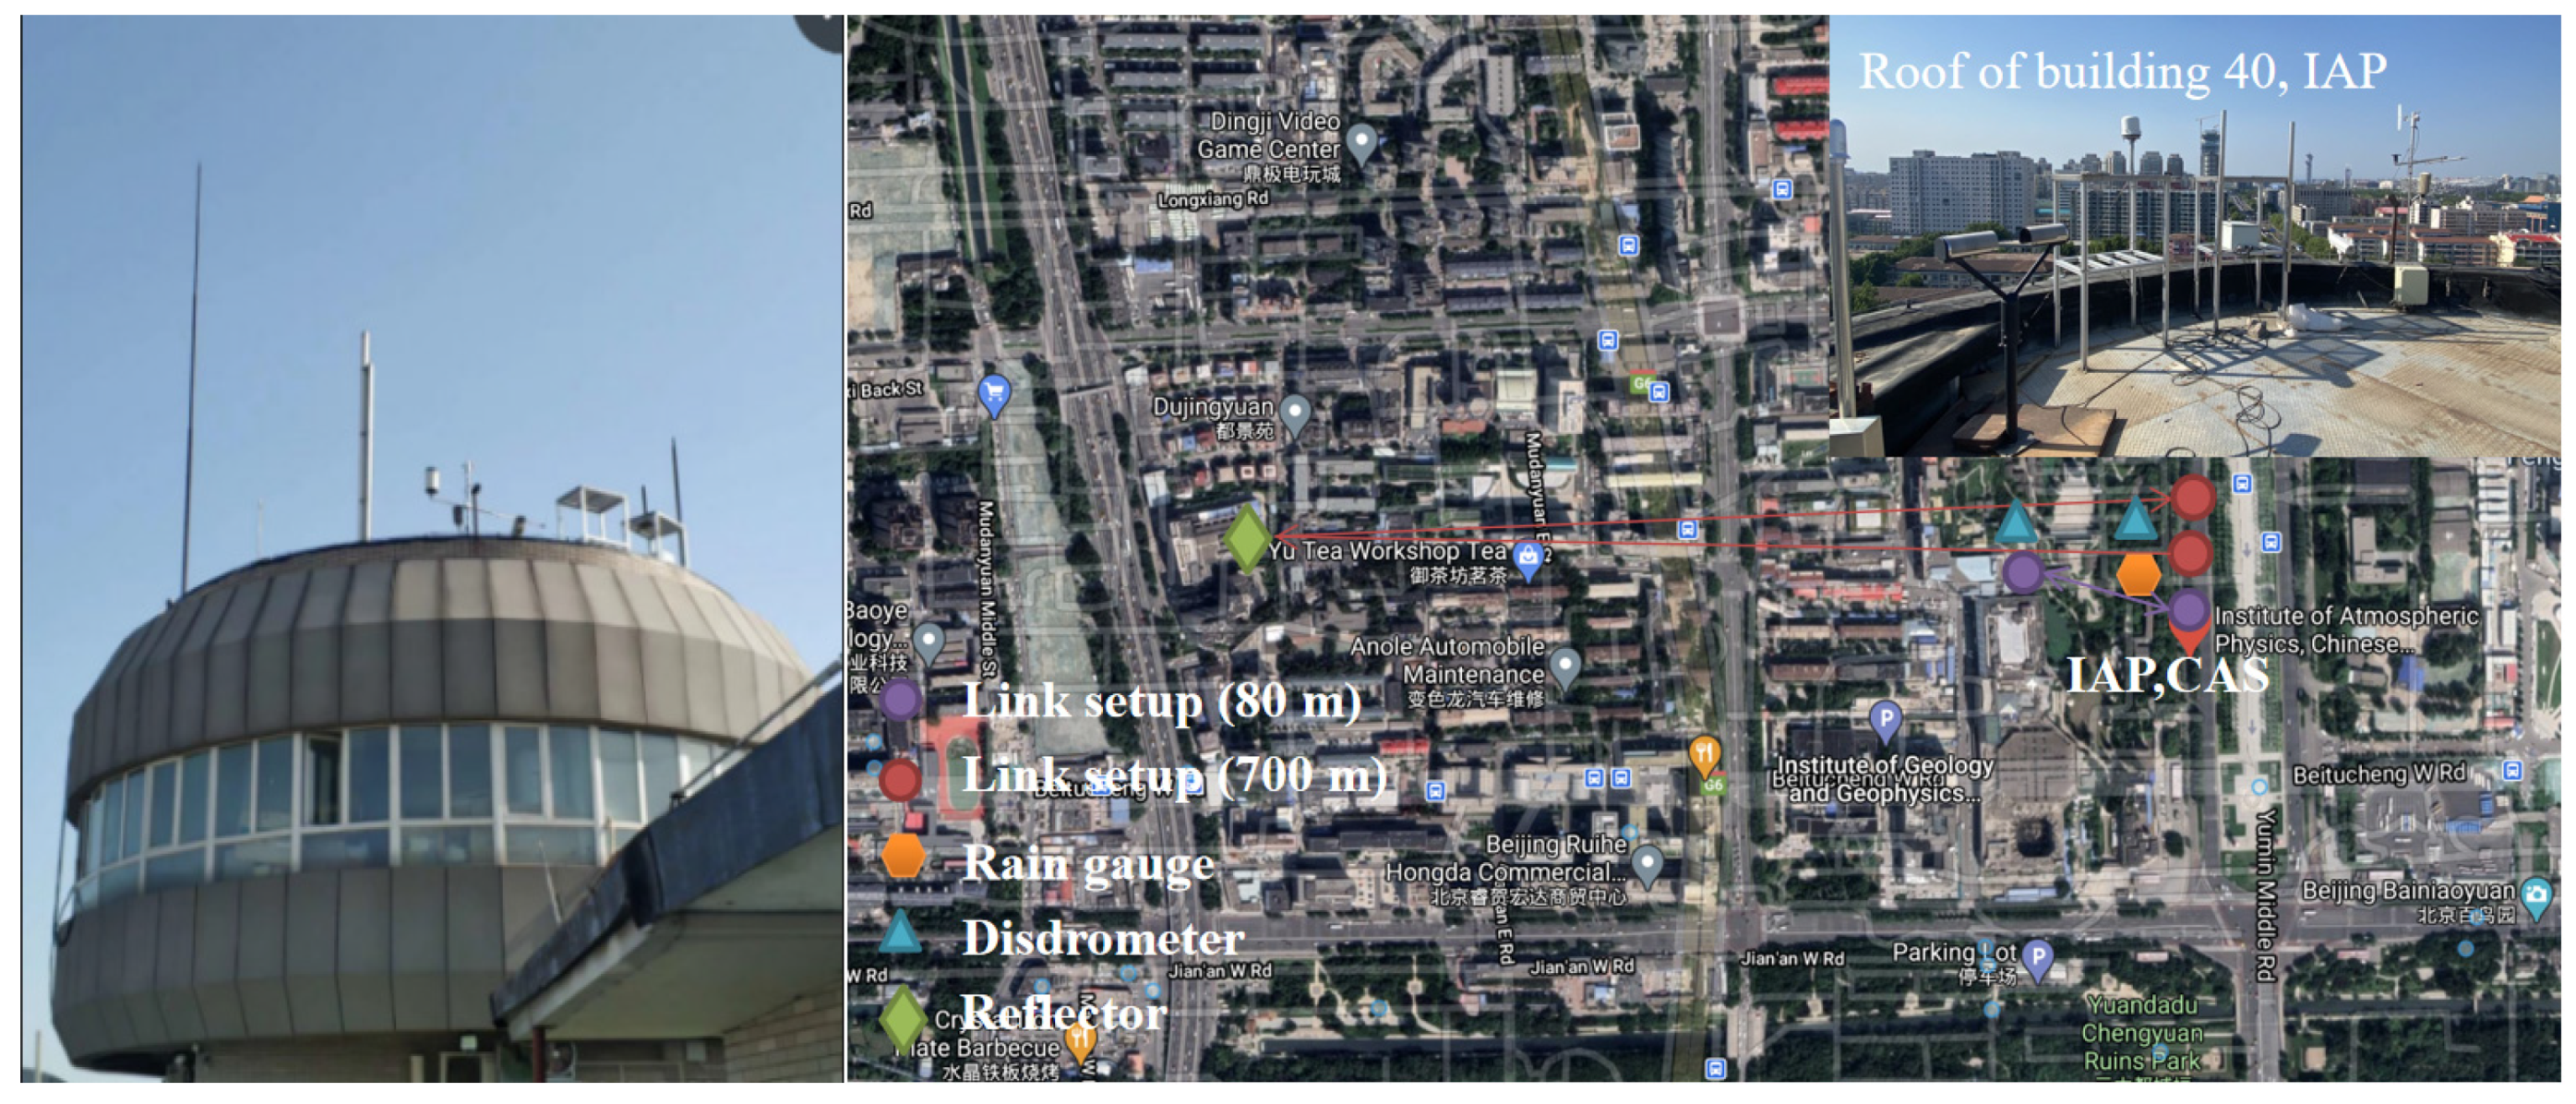
2.3. Outdoor Field Millimeter-Wave Measurement
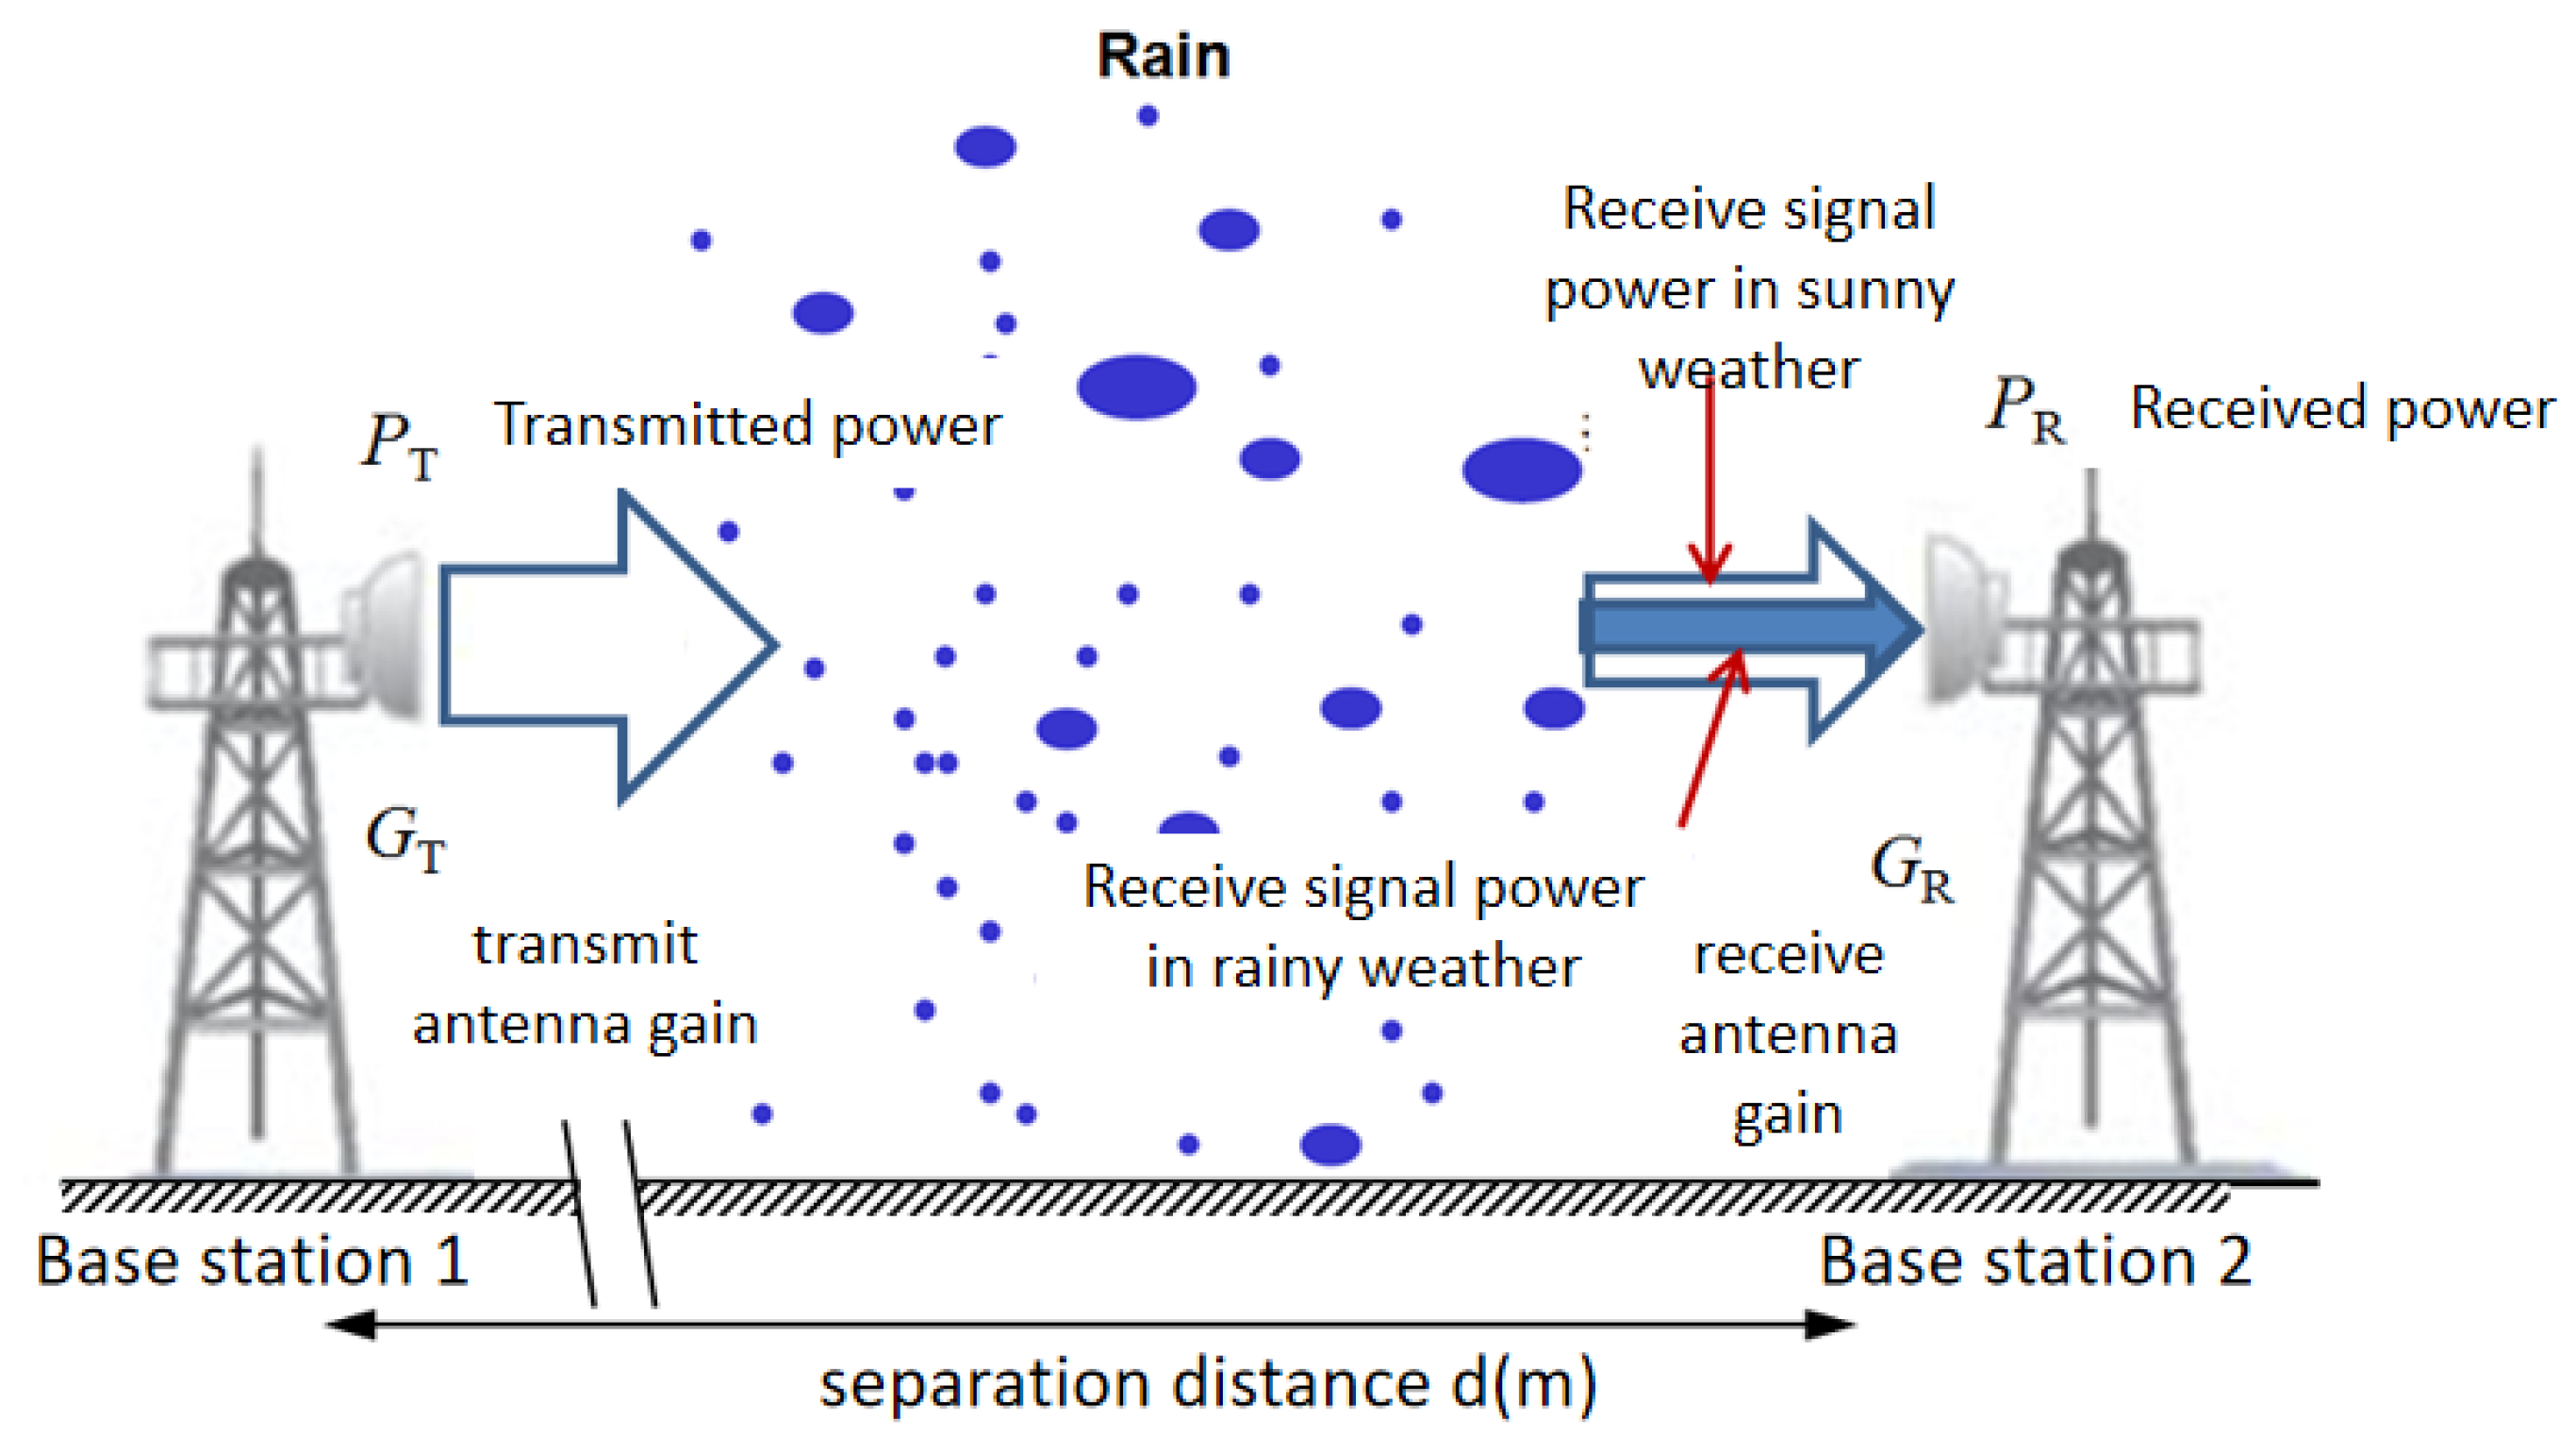
2.4. Estimation of Rain-Induced Attenuation Over Millimeter-Wave Links
2.5. Estimation of Rainfall Rate Using Millimeter-Wave Link
3. Results and Discussion
3.1. Rainfall Statistics
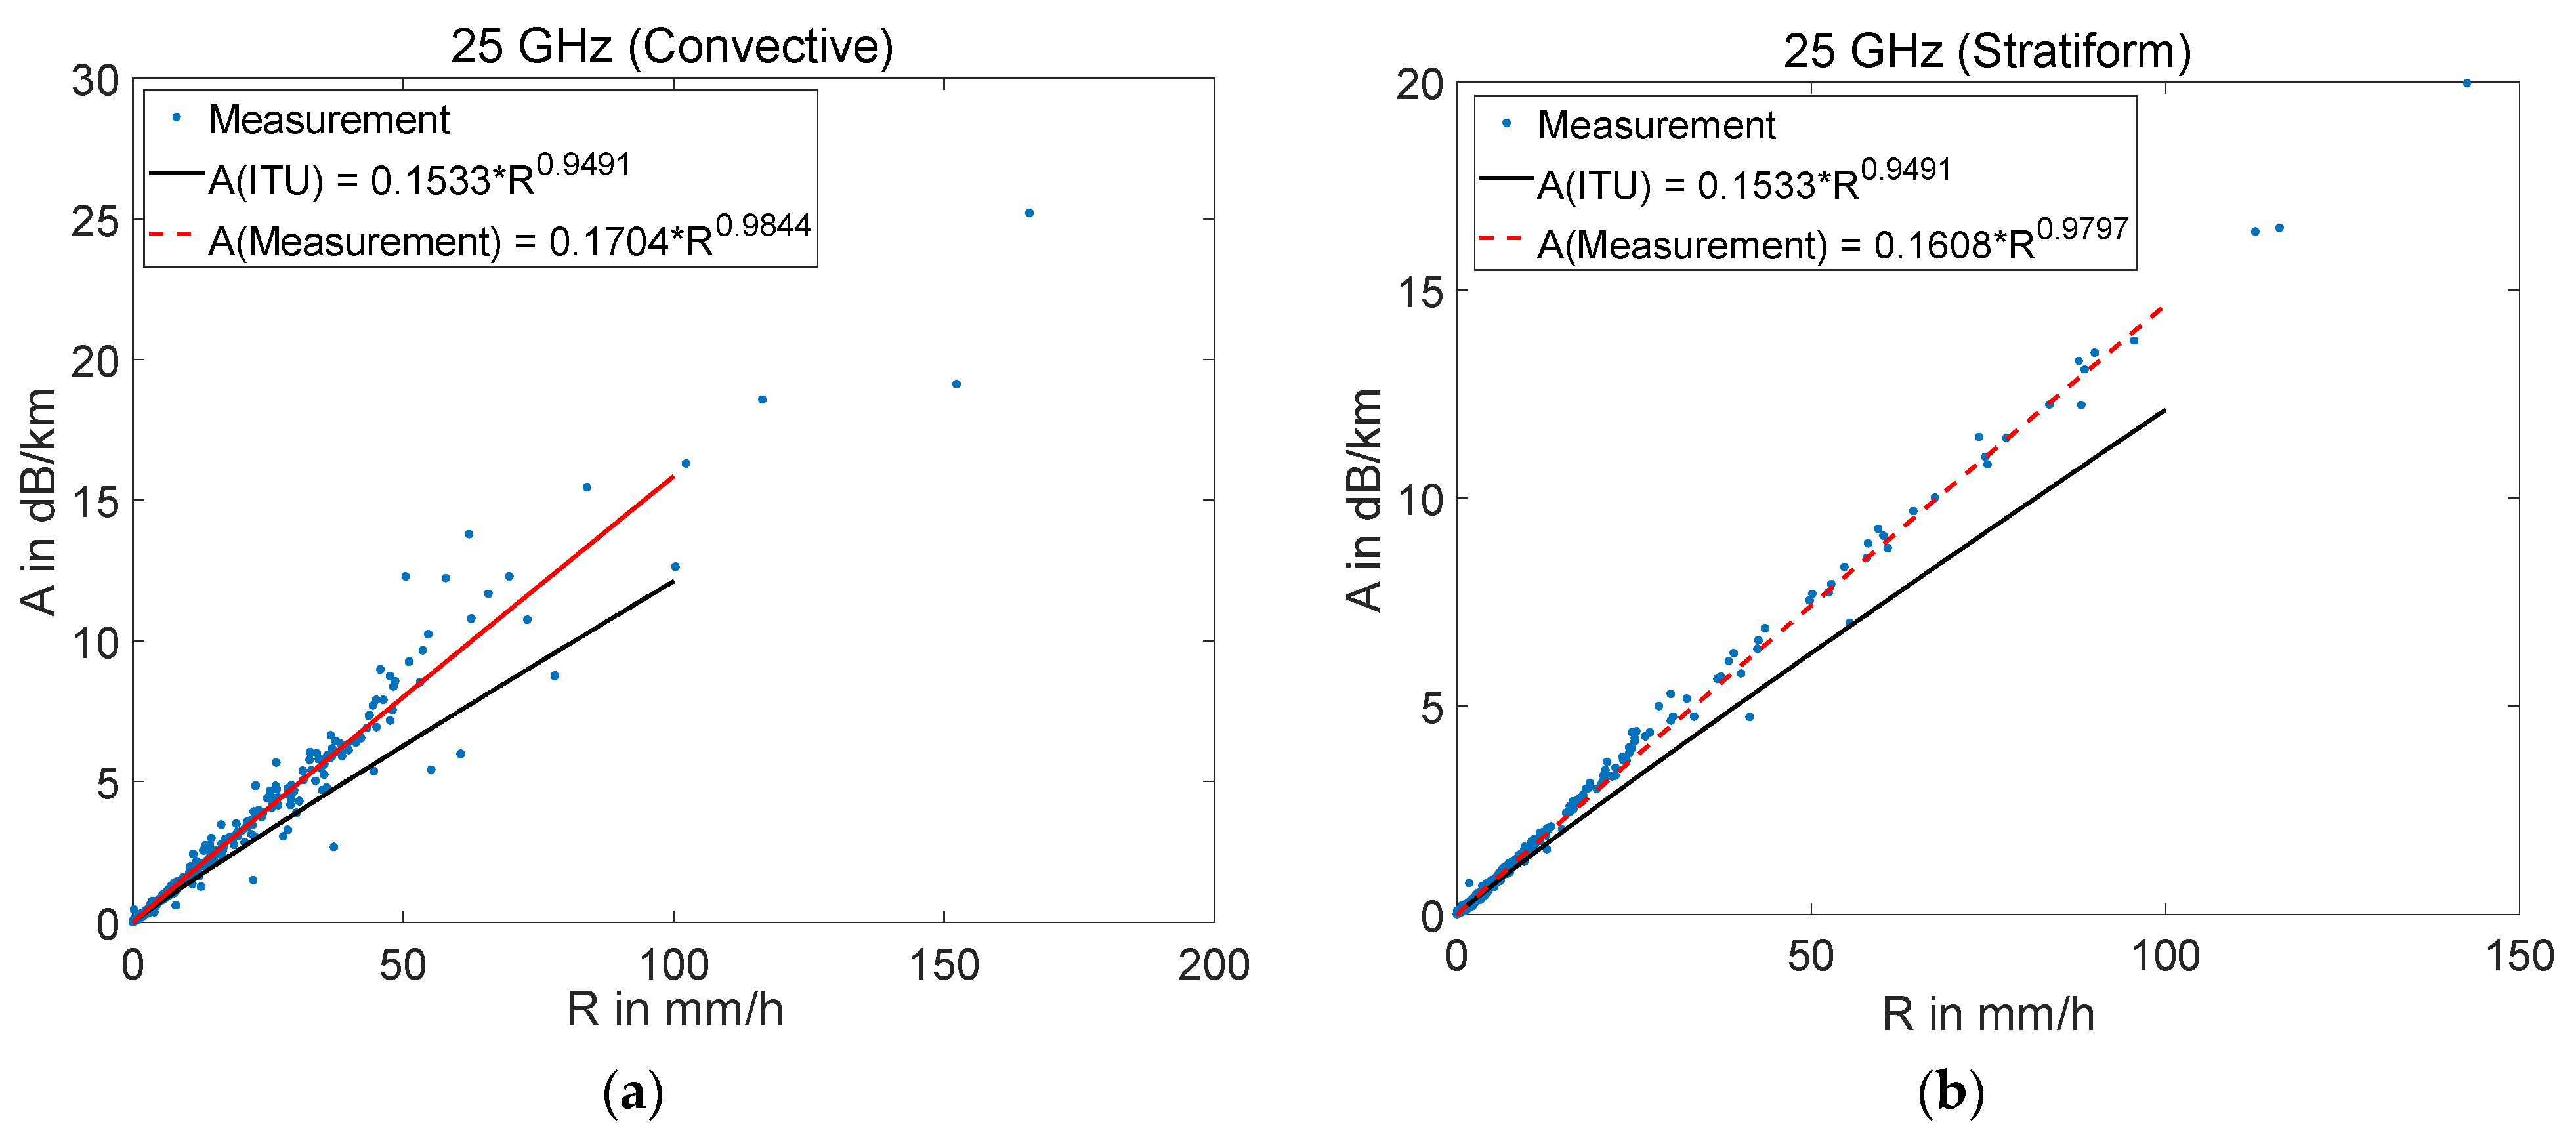
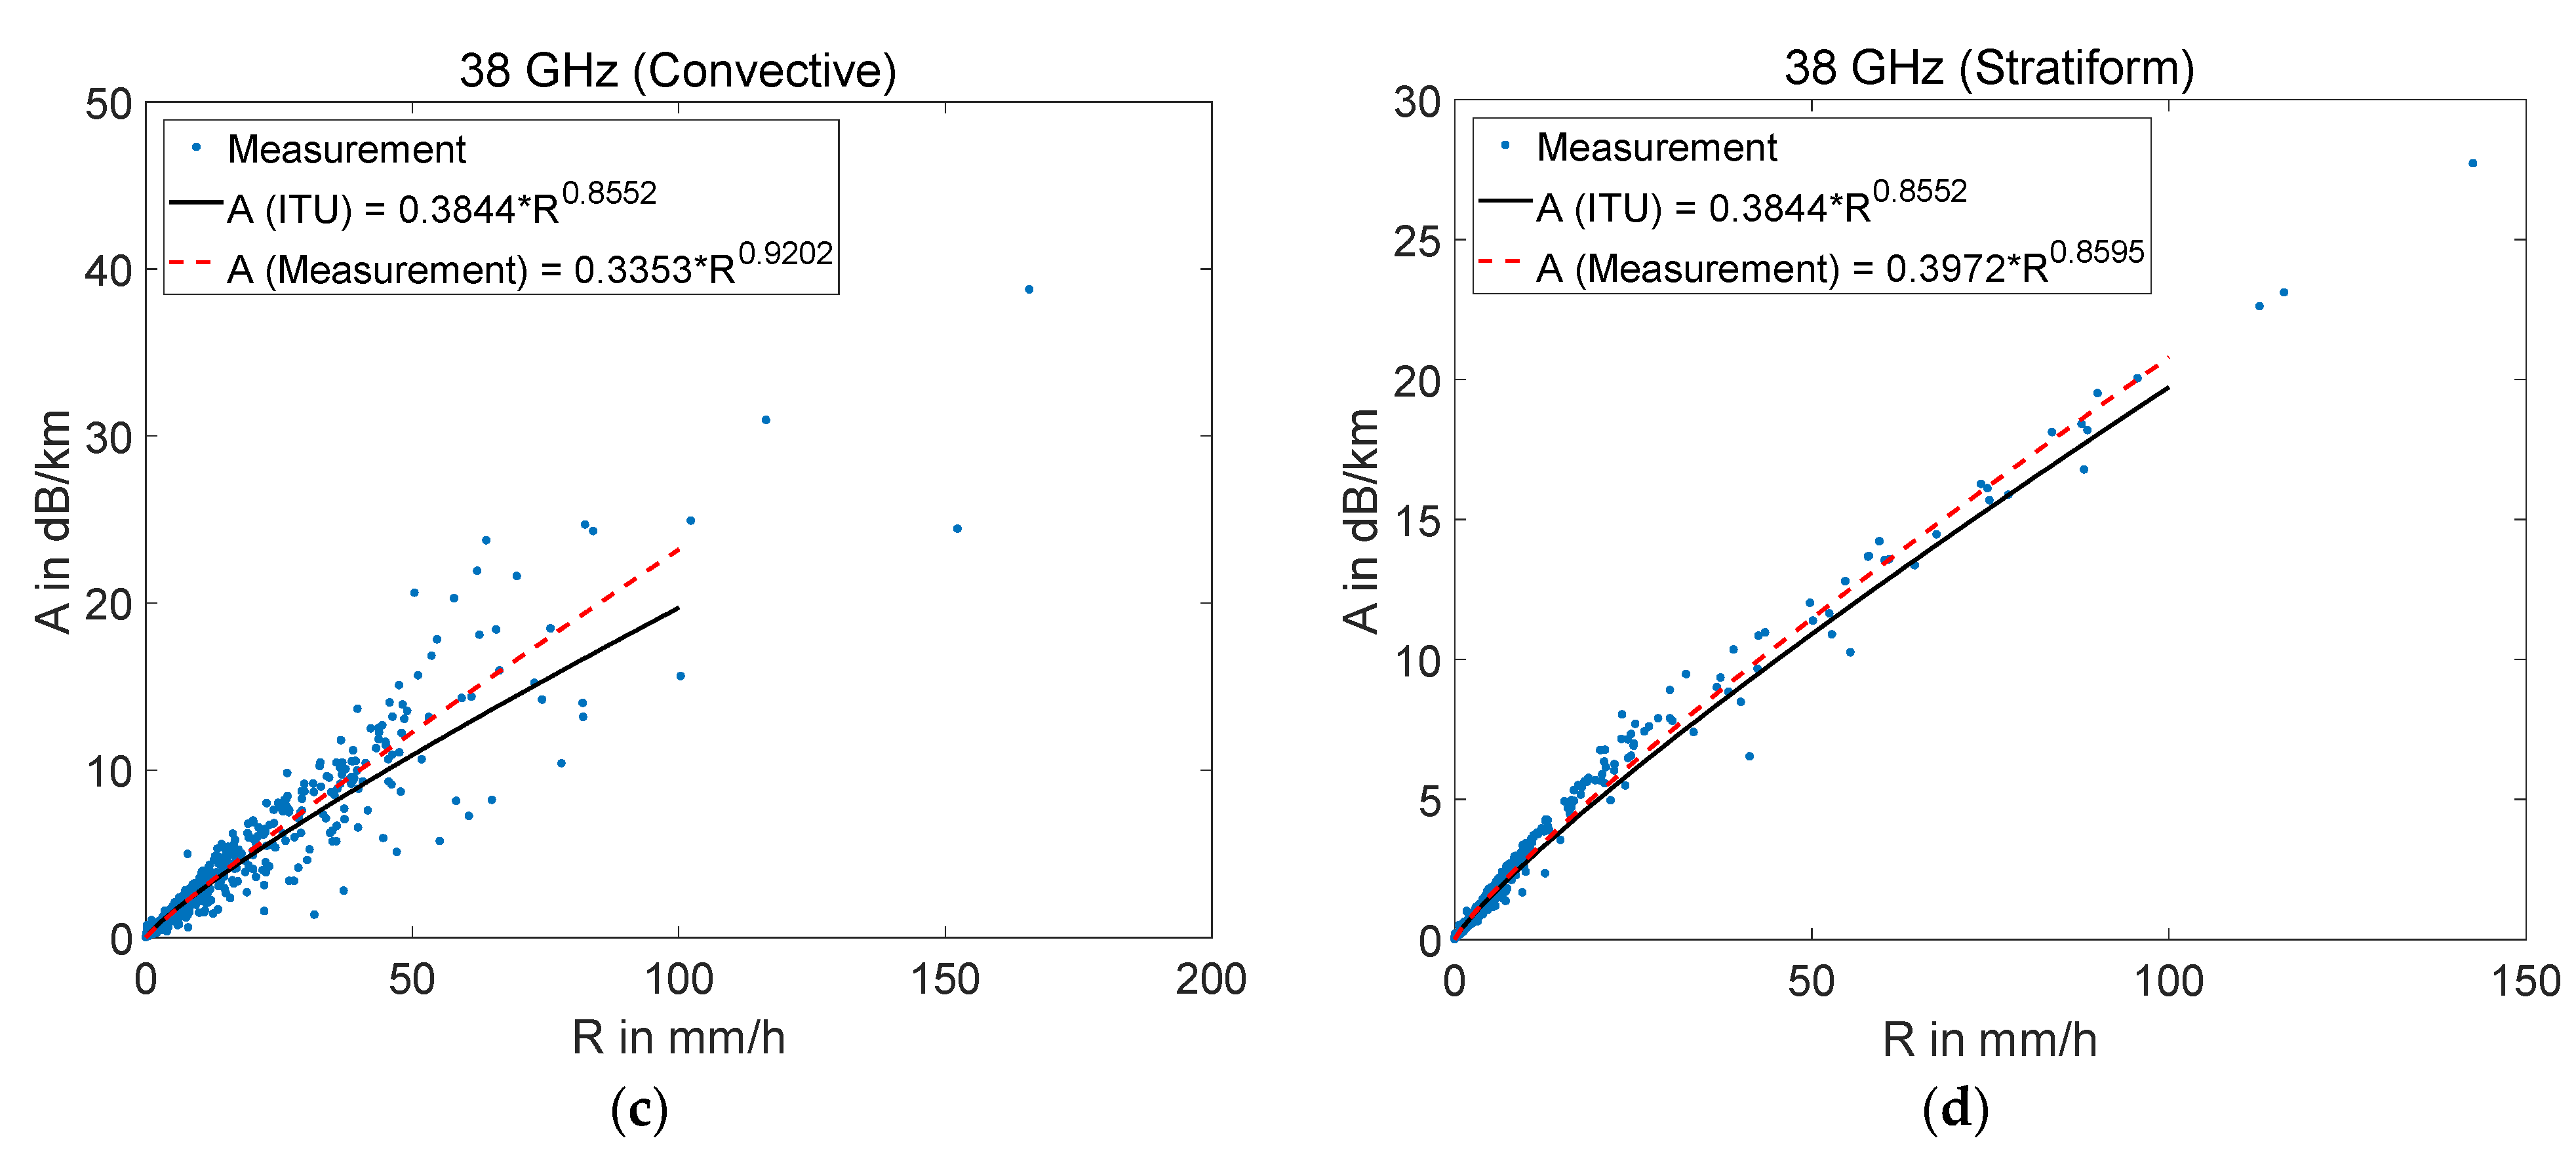
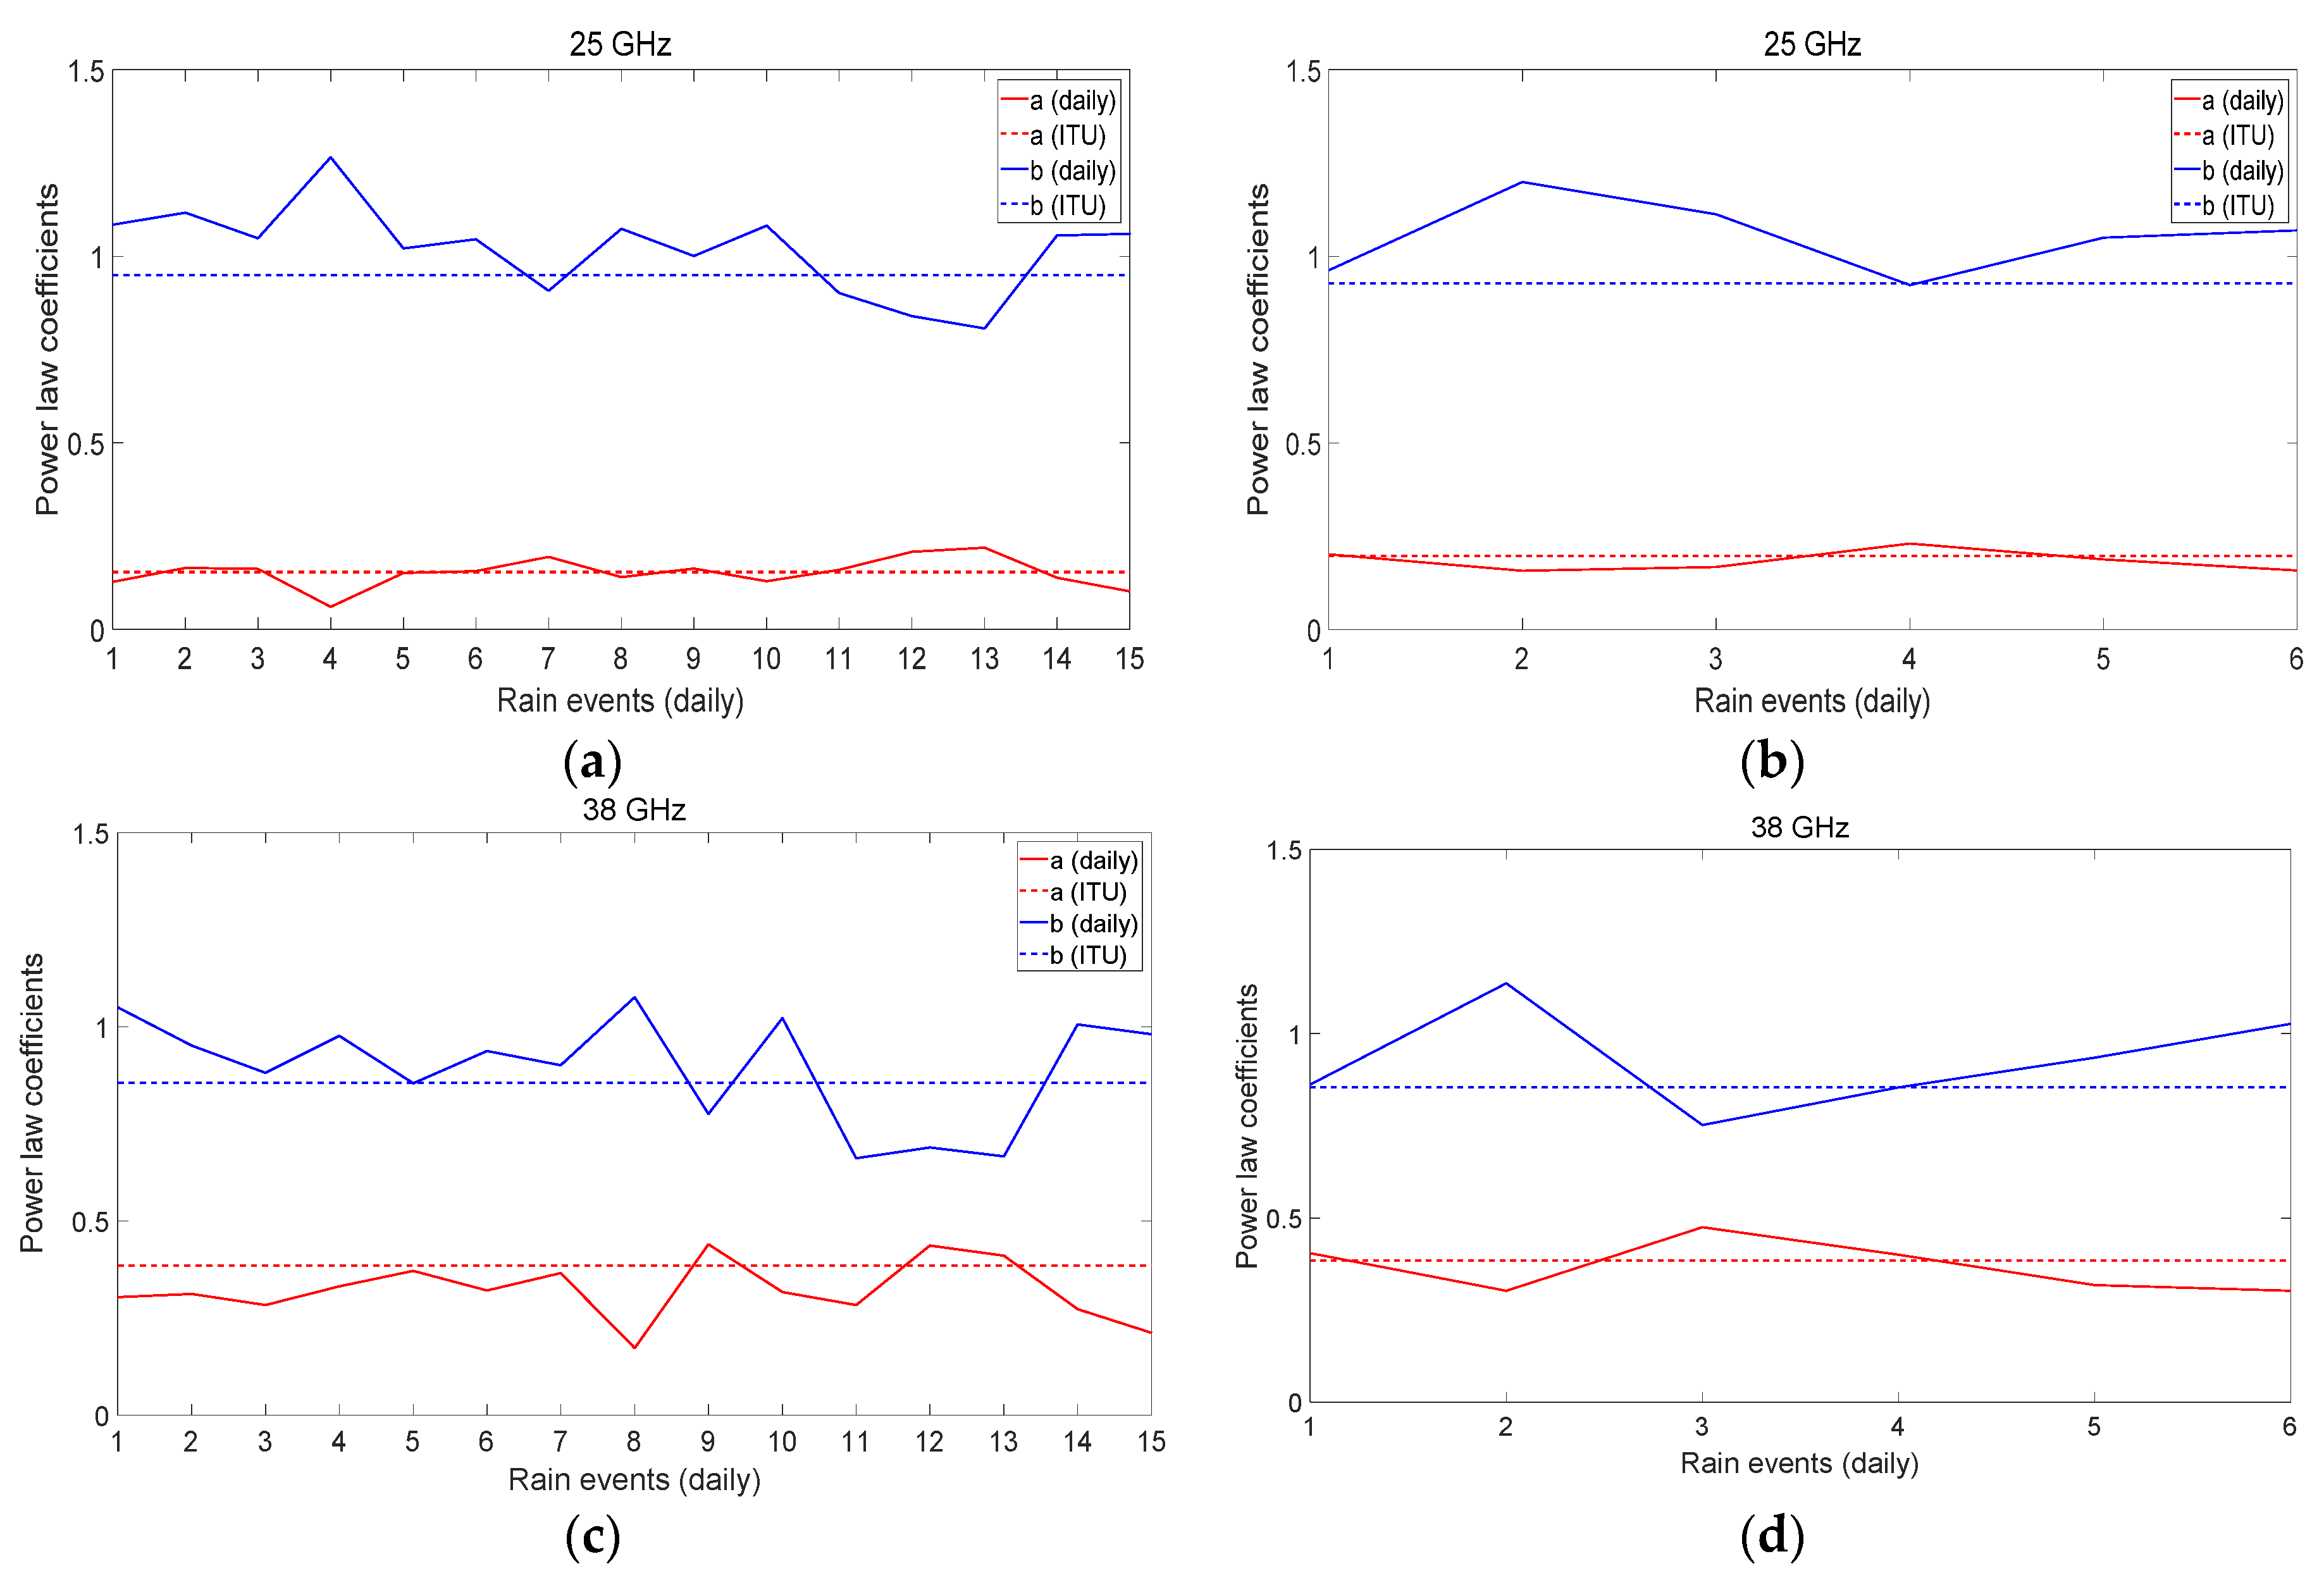
3.2. Rain-Induced Attenuation Over Millimeter-Wave Links and Power Law Coefficients Based on Local DSD Measurement
3.3. Estimated Rainfall Rate Using Millimeter-Wave Link
4. Discussion
5. Conclusions
Author Contributions
Funding
Institutional Review Board Statement
Informed Consent Statement
Data Availability Statement
Conflicts of Interest
References
- Daniels, R.C.; Heath, R.W.; Murdock, J.N.; Rappaport, T.S. Millimeter Wave Wireless Communications; Pearson: Upper Saddle River, NJ, USA, 2014; ISBN 978-0-13-217228-8. [Google Scholar]
- Han, C.; Huo, J.; Gao, Q.; Su, G.; Wang, H. Rainfall monitoring based on next-generation millimeter-wave backhaul technologies in a dense urban environment. Remote Sens. 2020, 12, 1045. [Google Scholar] [CrossRef] [Green Version]
- Zhang, G.; Han, C.; Ji, B.; Shi, C.; Xie, P.; Yang, L. A new multiple-symbol differential detection strategy for error-floor elimination of IEEE 802.15.4 BPSK receivers impaired by carrier frequency offset. Wirel. Commun. Mob. Comput. 2019, 2019, 1–26. [Google Scholar] [CrossRef]
- Lin, T.; John, G. WRC-19 Revamps ITU Radio Regulations to Accommodate Emerging Communications Technologies. Available online: https://www.hlregulation.com/2019/12/20/wrc-19-revamps-itu-radio-regulations-to-accommodate-emerging-communications-technologies/ (accessed on 20 December 2019).
- Liebe, H.J.; Hufford, G.A.; Cotton, M.G. Propagation modeling of moist air and suspended water/ice particles at frequencies below 1000GHz, Electromagnetic Wave Propagation Panel Symposium. In Proceedings of the AGARD Conference Proceedings, Palma De Mallorca, Spain, 17–20 May 1993. [Google Scholar]
- Atlas, D.; Ulbrich, C.W. Path- and area-integrated rainfall measurement by microwave attenuation in the 1–3 cm band. J. Appl. Meteorol. 1977, 16, 1322–1331. [Google Scholar] [CrossRef] [Green Version]
- Medhurst, R.G. Rainfall attenuation of centimeter waves: Comparison of theory and measurement. IEEE Trans. Antennas Propag. 1965, 13, 550–564. [Google Scholar] [CrossRef]
- Olsen, R.L.; Rogers, D.V.; Hodge, D.B. The aRb relation in calculation of rain attenuation. IEEE Trans. Antennas Propag. 1978, 26, 319–329. [Google Scholar] [CrossRef]
- ITU-R P. 838-3 (International Telecommunication Union Radiocommunication Bureau Propagation Recommendation), Specific Attenuation Model for Rain for Use in Prediction Methods, 03/2005. Available online: https://www.itu.int/rec/R-REC-P.838-3-200503-I/en (accessed on 30 January 2021).
- Wang, W.-C. Rainy Season at Beijing and Shanghai Since 1736. J. Meteorol. Soc. Jpn. 2008, 86, 827–834. [Google Scholar] [CrossRef] [Green Version]
- Messer, H.; Zinevich, A.; Alpert, P. Environmental monitoring by wireless communication networks. Science 2006, 312, 713. [Google Scholar] [CrossRef] [Green Version]
- Messer, H. Capitalizing on Cellular Technology—Opportunities and Challenges for Near Ground Weather Monitoring. Environ. Sci. Technol. 2018, 5, 73. [Google Scholar] [CrossRef] [Green Version]
- Chwala, C.; Kunstmann, H. Commercial Microwave Link Networks for Rainfall Observation: Assessment of the Current Status and Future Challenges. Wiley Interdiscip. Rev. Water 2018, 6, 2018. [Google Scholar] [CrossRef] [Green Version]
- Uijlenhoet, R.; Overeem, A.; Leijnse, H. Opportunistic remote sensing of rainfall using microwave links from cellular communication networks. Wiley Interdiscip. Rev. Water 2018, 5, e1289. [Google Scholar] [CrossRef] [Green Version]
- Tokay, A.; Short, D.A. Evidence from tropical raindrop spectra of the origin of rain from stratiform versus convective clouds. J. Appl. Meteorol. 1996, 35, 355–371. [Google Scholar] [CrossRef] [Green Version]
- Available online: https://www.ott.com/products/meteorological-sensors-26/ott-parsivel2-laser-weather-sensor-2392/ (accessed on 30 January 2021).
- Park, S.G.; Kim, H.L.; Ham, Y.W.; Jung, S.H. Comparative Evaluation of the OTT PARSIVEL2 Using a Collocated Two-Dimensional Video Disdrometer. J. Atmos. Ocean. Technol. 2017, 34, 2059–2082. [Google Scholar] [CrossRef]
- Atlas, D.; Ulbrich, C.W.; Marks, F.D., Jr.; Black, R.A.; Amitai, E.; Willis, P.T.; Samsury, C.E. Partitioning tropical oceanic and stratiform rains by draft strength. J. Geophys. Res. 2020, 105, 2259–2267. [Google Scholar] [CrossRef]
- Atlas, D.; Ulbrich, C.W. Drop size spectra and integral remote sensing parameters in the transition from convective to stratiform rain. Geophys. Res. Lett. 2006, 33, L16803. [Google Scholar] [CrossRef]
- Tokay, A. Comparison of drop size distribution measurements by impact and optical disdrometers. J. Appl. Meteorol. 2001, 40, 2083–2097. [Google Scholar] [CrossRef]
- Wu, Z.; Zhang, Y.; Zhang, L.; Lei, H.; Xie, Y.; Wen, L.; Yang, J. Characteristics of summer season raindrop size distribution in three typical regions of western pacific. Geophys. Res. Atmos. 2019, 124, 4054–4073. [Google Scholar] [CrossRef] [Green Version]
- Wen, G.; Xiao, H.; Yang, H.; Bi, Y.; Xu, W. Characteristics of summer and winter precipitation over northern China. Atmos. Res. 2017, 197, 390–406. [Google Scholar] [CrossRef]
- Tang, Q.; Xiao, H.; Guo, C.; Feng, L. Characteristics of raindrop size distributions and their retrieved polarimetric radar parameters in northern and southern China. Atmos. Res. 2014, 135–136, 59–75. [Google Scholar] [CrossRef]
- Chen, B.; Hu, W.; Pu, J. Characteristics of the raindrop size distribution for freezing precipitation observed in southern China. J. Geophys. Res. Space Phys. 2011, 116, D06201. [Google Scholar] [CrossRef]
- Raupach, T.H.; Berne, A. Correction of raindrop size distributions measured by Parsivel disdrometers, using a two-dimensional video disdrometer as a reference. Atmos. Meas. Tech. 2014, 7, 8521–8579. [Google Scholar] [CrossRef]
- Fielding, M.D.; Chiu, J.C.; Hogan, R.J.; Feingold, G.; Eloranta, E.; O’Connor, E.J.; Cadeddu, M.P. Joint retrievals of cloud and drizzle in marine boundary layer clouds using ground-based radar, lidar and zenith radiances. Meas. Tech. Discuss. 2015, 8, 1833–1889. [Google Scholar]
- Hugh, M.; Wojciech, G. Comparison of bulk and bin warm-rain microphysics models using a kinematic framework. AMS J. Atmos. Sci. 2007, 64, 2839–2861. [Google Scholar]
- Miles, N.L.; Verlinde, J.; Clothiaux, E. Cloud droplet size distributions in low-level stratiform clouds. J. Atmos. Sci. AMS 2000, 57, 295–311. [Google Scholar] [CrossRef]
- Marshall, J.S.; Palmer, W.M.K. The distribution of rain drops with size. J. Meterol. 1945, 5, 165–166. [Google Scholar] [CrossRef]
- Levin, L.M. The coagulation of charged cloud-droplets size distribution function for cloud droplets and rain drops. Dokl. Akad. Nauk SSSR 1954, 94, 1045–1053. [Google Scholar]
- Ulbrich, C.W. Natural variations in the analytical form of the raindrop size distribution. J. Appl. Meteorol. 1983, 22, 1764–1775. [Google Scholar] [CrossRef] [Green Version]
- Cao, Q.; Zhang, G.; Brandes, E.A.; Schuur, T.J. Polarimetric radar rain estimation through retrieval of drop size distribution using a bayesian approach. J. Appl. Meteorol. Clim. 2010, 49, 973–990. [Google Scholar] [CrossRef]
- Huo, J.; Tian, Y.; Wu, X.; Han, C.; Liu, B.; Bi, Y.; Duan, S.; Lyu, D. Properties of ice cloud over Beijing from surface Ka-band radar observations during 2014–2017. Atmos. Phys. Chem. 2020, 20, 14377–14392. [Google Scholar] [CrossRef]
- Huo, J.; Li, J.; Duan, M.; Lv, D.; Han, C.; Bi, Y. Measurement of cloud top height: Comparison of MODIS and ground-based millimeter radar. Remote Sens. 2020, 12, 1616. [Google Scholar] [CrossRef]
- Matrosov, S.Y. Synergetic use of millimeter- and centimeter-wavelength radars for retrievals of cloud and rainfall parameters. Atmos. Chem. Phys. 2010, 10, 3321–3331. [Google Scholar]
- Protat, A.; Klepp, C.; Louf, V.; Petersen, W.A.; Alexander, S.P.; Barros, A.; Leinonen, J.; Mace, G.G. The Latitudinal variability of oceanic rainfall properties and its implication for satellite retrievals: 2. The relationships between radar observables and drop size distribution parameters. J. Geophys. Res. Atmos. 2019, 124, 13312–13324. [Google Scholar] [CrossRef]
- Zhou, L.; Dong, X.; Fu, Z.; Wang, B.; Leng, L.; Xi, B.; Cui, C. Vertical distribution of raindrops and Z-R relationships using microrain radar and 2-D video disdrometer measurements during the integrative monsoon frontal rainfall experiment (IMFRE). J. Geophys. Res. Atmos. 2020, 125, e2019JD031108. [Google Scholar] [CrossRef] [Green Version]
- Lam, H.Y.; Luini, L.; Din, J.; Capsoni, C.; Panagopoulos, A.D. Investigation of rain attenuation in equatorial Kuala Lumpur. IEEE Antennas Wirel. Propag. Lett. 2012, 11, 1002–1005. [Google Scholar] [CrossRef]
- Van Leth, T.C.; Overeem, A.; Leijnse, H.; Uijlenhoet, R. A measurement campaign to assess sources of error in microwave link rainfall estimation. Atmos. Meas. Tech. 2018, 11, 4645–4669. [Google Scholar] [CrossRef] [Green Version]
- Leijnse, H.; Uijlenhoet, R. The effect of reported high-velocity small raindrops on inferred drop size distributions and derived power laws. Atmos. Chem. Phys. 2010, 10, 6807–6818. [Google Scholar] [CrossRef] [Green Version]
- Murata, F.; Terao, T.; Chakravarty, K.; Syiemlieh, H.; Cajee, L. Characteristics of orographic rain drop-size distribution at Cherrapunji, Northeast India. Atmosphere 2020, 11, 777. [Google Scholar] [CrossRef]
- Guyot, A.; Pudashine, J.; Protat, A.; Uijlenhoet, R.; Pauwels, V.R.N.; Seed, A.; Walker, J.P. Effect of disdrometer type on rain drop size distribution characterisation: A new dataset for south-eastern Australia. Hydrol. Earth Syst. Sci. 2019, 23, 4737–4761. [Google Scholar] [CrossRef] [Green Version]
- Atlas, D.; Srivastava, R.C.; Sekhon, R.S. Doppler radar characteristics of precipitation at vertical incidence. Rev. Geophys. 1973, 11, 1–35. [Google Scholar] [CrossRef]
- Chen, B.; Yang, J.; Pu, J. Statistical characteristics of raindrop size distribution in Meiyu season observed in Eastern China. J. Meteorol. Soc. Jpn. 2013, 91, 215–227. [Google Scholar] [CrossRef] [Green Version]
- Bringi, V.N.; Chandrasekar, V.; Hubbert, J.; Gorgucci, E.; Randeu, W.L.; Schoenhuber, M. Raindrop size distribution in different climatic regimes from disdrometer and dual-polarized radar analysis. J. Atmos. Sci. 2003, 60, 354–365. [Google Scholar] [CrossRef]
- Fu, Z.; Dong, X.; Zhou, L.; Cui, W.; Wang, J.; Wan, R. Statistical characteristics of raindrop size distributions and parameters in Central China during the Meiyu seasons. J. Geophys. Res. Atmos. 2020, 125, 1–15. [Google Scholar] [CrossRef]
- Luini, L.; Roveda, G.; Zaffaroni, M.; Costa, M.; Riva, C.G. The impact of rain on short E-band radio links for 5G mobile systems: Experimental results and prediction models. IEEE Trans. Antennas Propag. 2020, 68, 3124–3134. [Google Scholar] [CrossRef]
- Han, C.; Bi, Y.; Duan, S.; Lu, G. Rain rate retrieval test from 25 GHz, 28 GHz, and 38 GHz millimeter-wave link measurement in Beijing. IEEE J. Sel. Top. Appl. Earth Obs. Remote Sens. 2019, 12, 2835–2847. [Google Scholar] [CrossRef]
- de Vos, L.W.; Raupach, T.H.; Leijnse, H.; Overeem, A.; Berne, A.; Uijlenhoet, R. High-resolution simulation study exploring the potential of radars, crowdsourced personal weather stations, and commercial microwave links to monitori small-scale urban rainfall. Water Resour. Res. 2018, 54, 10293–10312. [Google Scholar]

| Parameter | Value |
|---|---|
| Centre frequency | 25 GHz/38 GHz |
| Transmit power | 7 dBm |
| Transmitter instrument | Anritsu MG369XB signal generator |
| Receiver instrument | Agilent N9030A PXA signal analyzer |
| Antenna type | Horn antenna |
| Transmitter-Receiver (Tx-Rx) distance | 80 m/700 m |
| Sampling interval | 15 s |
| Tx antenna gain | 23.8 dBi (25 GHz)/25.6 dBi (38 GHz) |
| Rx antenna gain | 23.8 dBi (25 GHz)/25.6 dBi (38 GHz) |
| Polarization | Vertically polarized |
| Cable loss | 2 m (−2.2 dB), 3 m (−5.0 dB) |
| Tx and Rx azimuth half-power beamwidth | 11° (25 GHz)/8.4° (38 GHz) |
| Tx and Rx elevation half-power beamwidth | 10° (25 GHz)/7.4° (38 GHz) |
| Date (yyyy.mm.dd) | Rain Time (minutes) | Peak Rain Rate (mm/h) | Date (yyyy.mm.dd) | Rain Time (minutes) | Peak Rain Rate (mm/h) |
|---|---|---|---|---|---|
| 2017.06.22 | 1111 | 17.9 | 2018.06.09 | 99 | 17.1 |
| 2017.06.23 | 522 | 129 | 2018.06.12 | 58 | 32.6 |
| 2017.08.02 | 260 | 27.3 | 2018.06.13 | 42 | 14.3 |
| 2017.08.03 | 65 | 20.8 | 2018.06.17 | 275 | 150.9 |
| 2017.08.09 | 31 | 1.0 | 2018.06.25 | 47 | 2.5 |
| 2017.08.11 | 77 | 53.3 | 2018.07.11 | 770 | 21.8 |
| 2017.08.12 | 234 | 123.5 | 2018.07.12 | 179 | 4.1 |
| 2017.08.13 | 112 | 20.1 | 2018.07.16 | 230 | 121.4 |
| 2017.08.18 | 153 | 87.4 | 2018.07.17 | 535 | 168.2 |
| 2017.08.19 | 132 | 7.1 | 2018.07.24 | 292 | 22.4 |
| 2017.08.22 | 577 | 40.5 | 2018.08.11 | 68 | 113.5 |
| 2017.08.23 | 413 | 153.4 | 2018.08.13 | 62 | 37.5 |
| 2017.10.09 | 861 | 11.0 | 2018.08.18 | 284 | 56.4 |
| 2018.06.07 | 62 | 2.1 | 2018.08.19 | 33 | 1.5 |
| Date (yyyy.mm.dd) | Frequency | RITU | RIAP | ||
|---|---|---|---|---|---|
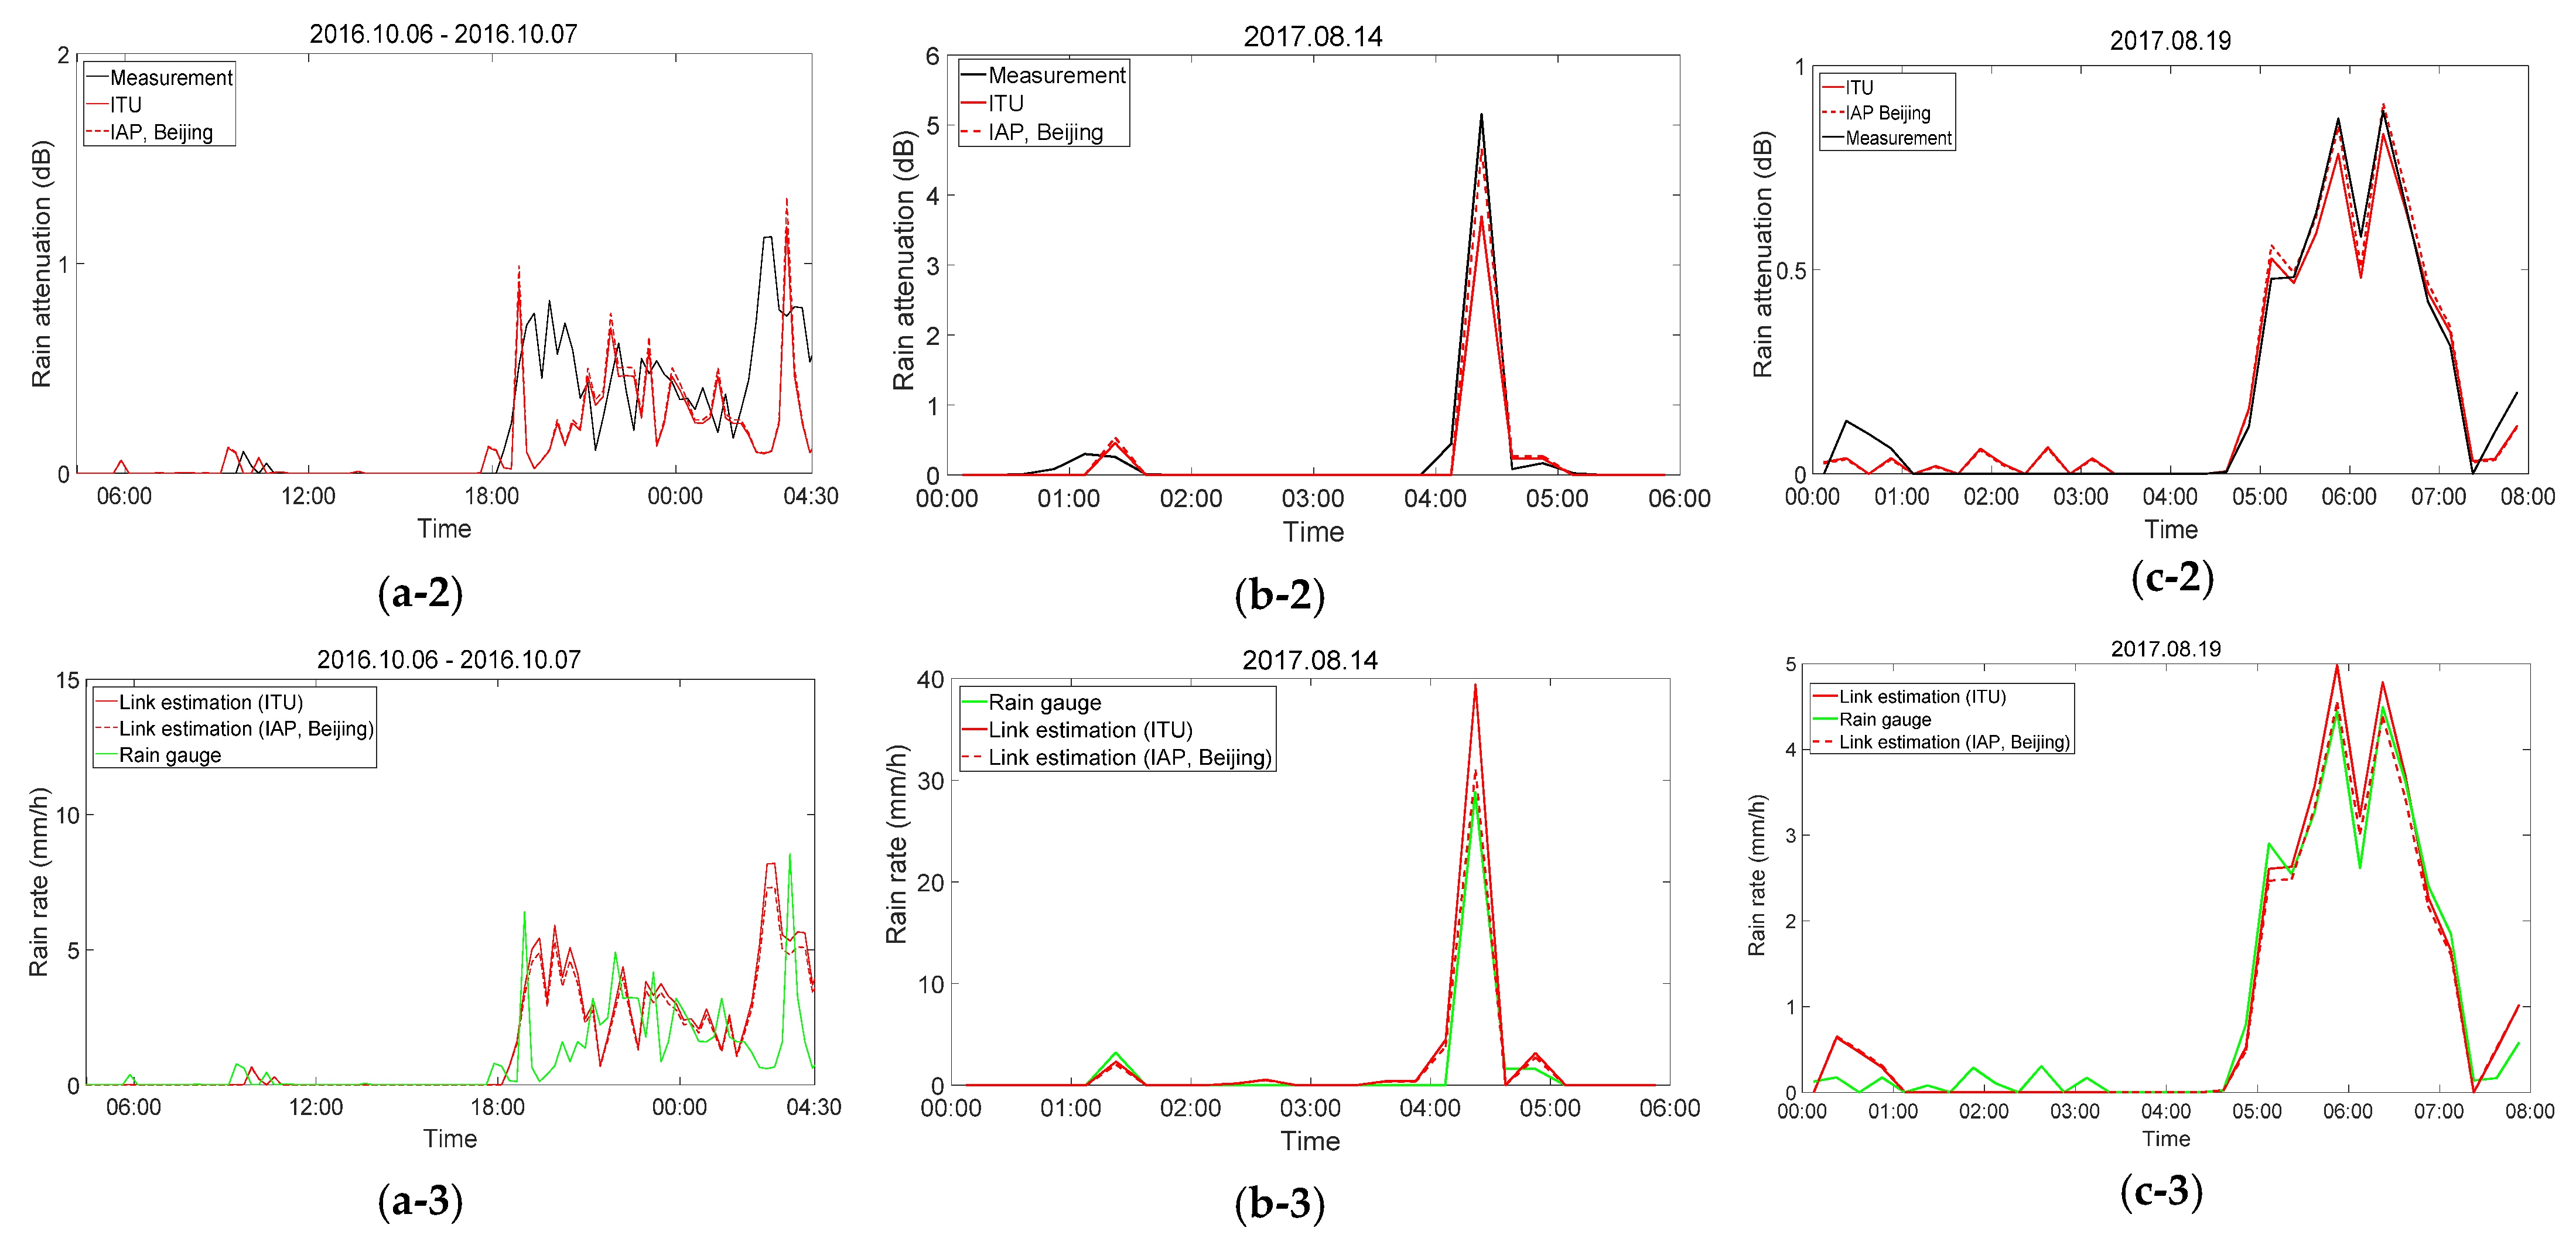
| 2016.10.06–07 | 25 GHz | 0.63 | 6.48 | 0.64 | 6.21 |
| 2017.08.14 | 25 GHz | 0.98 | 0.54 | 0.98 | 0.38 |
| 2017.08.19 | 38 GHz | 0.98 | 0.50 | 0.98 | 0.49 |
Publisher’s Note: MDPI stays neutral with regard to jurisdictional claims in published maps and institutional affiliations. |
© 2021 by the authors. Licensee MDPI, Basel, Switzerland. This article is an open access article distributed under the terms and conditions of the Creative Commons Attribution (CC BY) license (https://creativecommons.org/licenses/by/4.0/).
Share and Cite
Han, C.; Feng, L.; Huo, J.; Deng, Z.; Zhang, G.; Ji, B.; Zhou, Y.; Bi, Y.; Duan, S.; Yuan, R. Characteristics of Rain-Induced Attenuation over Signal Links at Frequency Ranges of 25 and 38 GHz Observed in Beijing. Remote Sens. 2021, 13, 2156. https://doi.org/10.3390/rs13112156
Han C, Feng L, Huo J, Deng Z, Zhang G, Ji B, Zhou Y, Bi Y, Duan S, Yuan R. Characteristics of Rain-Induced Attenuation over Signal Links at Frequency Ranges of 25 and 38 GHz Observed in Beijing. Remote Sensing. 2021; 13(11):2156. https://doi.org/10.3390/rs13112156
Chicago/Turabian StyleHan, Congzheng, Liang Feng, Juan Huo, Zhaoze Deng, Gaoyuan Zhang, Baofeng Ji, Yushu Zhou, Yongheng Bi, Shu Duan, and Renmin Yuan. 2021. "Characteristics of Rain-Induced Attenuation over Signal Links at Frequency Ranges of 25 and 38 GHz Observed in Beijing" Remote Sensing 13, no. 11: 2156. https://doi.org/10.3390/rs13112156
APA StyleHan, C., Feng, L., Huo, J., Deng, Z., Zhang, G., Ji, B., Zhou, Y., Bi, Y., Duan, S., & Yuan, R. (2021). Characteristics of Rain-Induced Attenuation over Signal Links at Frequency Ranges of 25 and 38 GHz Observed in Beijing. Remote Sensing, 13(11), 2156. https://doi.org/10.3390/rs13112156