Article

3D SAR Speckle Offset Tracking Potential for Monitoring Landfast Ice Growth and Displacement

1
Canada Centre for Mapping and Earth Observation (CCMEO), Natural Resources Canada, Ottawa, ON K1S 5K2, Canada
2
Jet Propulsion Laboratory, California Institute of Technology, Pasadena, CA 91109, USA
*
Author to whom correspondence should be addressed.
Remote Sens. 2021, 13(11), 2168; https://doi.org/10.3390/rs13112168
Submission received: 9 April 2021 / Revised: 19 May 2021 / Accepted: 27 May 2021 / Published: 1 June 2021

Abstract

:
This study investigates the growth and displacement of landfast ice along the shoreline of the Mackenzie Delta in Northwest Territories, Canada, by synthetic aperture radar (SAR) speckle offset tracking (SPO). Three-dimensional (3D) offsets were reconstructed from Sentinel-1 ascending and descending SAR images acquired on the same dates during the November 2017–April 2018 and October 2018–May 2019 annual cycles. The analysis revealed both horizontal and vertical offsets. The annual horizontal offsets of up to ~8 m are interpreted as landfast ice displacements caused by wind and ocean currents. The annual vertical offsets of approximately −1 to −2 m were observed from landfast ice, which are likely due to longer radar penetration up to the ice–water interface with increasing landfast ice thickness. Numerical ice thickness model estimates supported the conclusion that the cumulative vertical negative offsets correspond to the growth of freshwater ice. Time-series analysis showed that the significant growth and displacement of landfast ice in the Mackenzie Delta occurred between November and January during the 2017–2018 and 2018–2019 cycles.

Graphical Abstract

1. Introduction

Recent climate change reports highlight the rapidly decreasing sea ice extent and thickness with record high temperatures in the Arctic [1,2,3,4]. Its decreasing maximum extent and shorter annual cycle with later freezeup and earlier breakup indicate rapid climate change in the Arctic [5]. Landfast ice is a type of sea ice formed on the land or extended from the land, which can be classified into bottomfast ice, stabilized floating ice, and non-stabilized floating ice extensions [6]. The annual maximum extent of Arctic landfast ice is ~1.8 M km2, which is about 12% of the Northern Hemisphere sea ice extent [7]. The landfast ice thickness in the Canadian Arctic Archipelago (e.g., Cambridge Bay, Eureka, Alert) has decreased at ~4 cm per decade with changes in snow depth [8]. Landfast ice plays important roles for coastal sediment and hydrological dynamics [9,10], marine mammal habitats [11], and traffic and hunting activities of northern coastal communities [12]. It also serves as a nearshore platform for oil and gas exploration in the Arctic [13]. Thus, spatial and temporal monitoring of landfast ice is critical for accessing climate change impacts and natural hazards in the Arctic.
The Mackenzie Delta located in Northwest Territories, Canada, is the second largest delta of ~13,000 km2 in the Arctic (Figure 1). The terrain is underlain by arctic permafrost of ~100 to 500 m thickness [14]. The Mackenzie River and surrounding channels discharge freshwater of ~284 km3 annually [15]. In the Mackenzie Shelf along the Beaufort Sea coast, landfast ice recurrently forms from fall or early winter and melts away by early summer. The shallow bathymetry of the Mackenzie Estuary plays an important role in the formation and pattern of bottomfast and landfast ice [16,17]. Landfast ice and drift sea ice are mainly affected by winds and ocean currents (e.g., the Beaufort Gyre specifically in this region), but they are also impacted by heat transports from ocean mixing and river discharges [17,18].
Optical sensors were used to map sea ice type and extent, but it is very limited to acquire optical imagery not obscured by cloud and atmosphere in the Arctic with the polar night of ~6 months during the winter. SAR, on the other hand, has a great advantage of all-weather and day and night imaging capability, so it has been extensively used to monitor sea and landfast ice [19]. SAR backscattering can characterize ice types (e.g., multi-year vs. first-year ice), and roughness [20,21,22]. SAR penetration depth is very sensitive to the salinity of ice [23]. In the case of landfast ice affected by significant freshwater inflow, such as the Mackenzie Delta and the Lena Delta, it has very low, close to zero salinity [24,25]. In the Mackenzie shelf near the mouth of the Mackenzie River, freshwater landfast ice forms by incorporating river discharges spreading along the coast [24]. Macdonald et al. (1995) confirmed the different freshwater proportion and salinity within the Mackenzie Delta landfast ice zone by analyzing ice core samples [24]. They observed that the ice core samples from the shallow nearshore are mostly composed of freshwater (e.g., freshwater ice/total ice = 1.71 m/1.72 m from the GI-1 station). Stevens (2011) also confirmed that the pore water salinity of sediments below ice surface in the Mackenzie Delta is close to zero up to ~5 m depth [26]. This allows C-band radar with a penetration depth of several meters for dry snow and freshwater ice to reach into the ice–water interface [16,27], unlike saline sea ice with a very short penetration depth of tens of centimeters [23,28]. Well-established InSAR techniques have been used to study glacier and sea ice motion and dynamics in the Arctic and Antarctica [29,30,31,32]. Yue et al. (2013) delineated bottomfast ice from floating landfast ice in the Mackenzie Delta by combining InSAR coherence with polarimetric SAR classification [16]. Recently, Dammann et al. (2019) classified landfast ice in the pan-Arctic including the Makenzie Delta depending on the InSAR fringe patterns observed at the most stable ice growing end stage (Figure 1b). While no fringes are observed from bottomfast ice, distinct fringes start to appear from stabilized floating ice and much denser fringes are observed from non-stabilized floating ice extensions (i.e., the denser interferometric fringes appear, the more the magnitude of ice motion increases) [6].
Similarly to [6], we observed distinct InSAR fringe patterns relating to landfast ice displacements with an ascending pair of 20170319–20170331, which were confirmed by Landsat 8 true color composites showing landfast ice breakups occurred during the overlapping time period (Figure 2a,b). Compared to the bottomfast ice, where radar signals penetrating into grounded ice are mostly absorbed into ground (i.e., very weak backscattering) [16], much stronger VV backscattering responses were observed from the stabilized floating landfast ice adjacent to the coastline (Figure 2c,d). Ground penetrating radar measurements in this region revealed the high contrast of backscattering signals between the ice–ground interface (i.e., bottomfast ice) and the ice–water interface (i.e., floating ice) [33]. The similar radar backscattering contrast observed at C-band suggests that part of the stabilized floating landfast ice in Figure 1b is mostly composed of freshwater ice that allows C-band SAR to penetrate to the ice–water interface [16,34,35]. Beyond the outer edge of the floating landfast ice showing strong backscattering signals, distinctly dark backscattering features are observed, which are interpreted to be specular reflection from very smooth and thin ice (or intermittent opening of flaw leads). InSAR fringes were observed from the outer stabilized floating landfast ice and much denser fringes appeared from the non-stabilized floating ice (Figure 2e). On the other hand, the inner stabilized floating landfast ice was masked out with very low coherence. In addition, InSAR analysis showed a limitation in phase unwrapping to estimate the quantitative displacement from the 2π-modulated interferometric phase. Different plates and cracks within landfast ice and abrupt transitions in the boundaries between land and ice showed significant discontinuities in the unwrapped phase, resulting in inaccurate displacement estimation (Figure 2f). Speckle offset tracking (SPO), on the other hand, uses SAR amplitudes, which does not require the phase unwrapping process. SPO has been extensively used for monitoring relatively large deformations at the scale of 10 s cm to 10 s m, such as glacier motion [36,37,38,39] and landslides [40,41]. Surface displacements have been reconstructed in 3D by combining 3 line-of-sight (LOS) InSAR measurements [42], 2 InSAR measurements with 1 azimuth offset [43], or 2 LOS InSAR measurements with a DEM-derived surface parallel component [44].
In this work, we investigate the vertical and horizontal changes of landfast ice in the Mackenzie Delta using a total of 4 SPO measurements from ascending and descending Sentinel-1 SAR data acquired within the same day (i.e., minimizing an assumption for temporal gaps). We propose a novel 3D SAR SPO technique for monitoring the growth and displacement of landfast ice of sub-meter precision without the uncertainty of phase unwrapping. The time-series 3D SPO results are compared with climate and environmental factors contributing to landfast ice changes. We demonstrate that the vertical changes observed from 3D SPO measurements have a very strong link with the growth of landfast ice.

2. Materials and Methods

2.1. Sentinel-1 SAR and Supporting Data

A total of 18 ascending (path: 108, frame: 226) and 18 descending (path: 116, frame: 360) Sentinel-1 Terrain Observation with Progressive Scan (TOPS) SAR images of VV polarization were collected for two annual cycles of November 2017–April 2018 and October 2018–May 2019 (Table 1, Figure 3). Sentinel-1 TOPS SAR single look complex (SLC) data were acquired at a spatial resolution of ~2 m by ~14 m in range and azimuth, respectively, at incidence angles of ~30°–45°. The Sentinel-1 TOPS SAR interferometric wide (IW) mode with a ~250 km swath can acquire an overlapping spatial coverage from ascending and descending flights at high latitudes less than 1-day apart [45]. The Polar Pathfinder daily 25 km EASE-Grid sea ice motion data (produced from multiple sensor observations and buoy and wind measurements) provided by the National Snow and Ice Data Center (NSDIC) were compared with the SPO measurements. Daily air temperature and wind statistics (from the Pelly Island station at 69.63° N, 135.44° W), snow depth (from the Inuvik station at 68.32° N, 133.52° W), freshwater level (from the Mackenzie River Reindeer channel (10MC011) at 69° 01′ N, 135° 30′ W), and hourly tide records (from the Tuktoyaktuk station at 69.44° N, 132.99° W) provided by the Environment and Climate Change Canada (ECCC) and Fisheries and Oceans Canada (DFO) were also analyzed.

2.2. 3-Dimensional SAR Speckle Offset Tracking

SAR SPO estimates the offsets in LOS and azimuth directions on the order of 1/20th of a pixel [36]. The SPO algorithm computes the cross-correlation of two SAR amplitude subset patches by shifting a subset patch within a larger search window to find a nearly identical feature. The signal-to-noise ratio (SNR) is calculated by the peak value relative to the average of the cross-correlation function for noise removal, and the offsets are determined by the local maxima over a given threshold of SNR [36]. SPO has a great advantage in detecting large deformation gradients at the scale of 10 s cm to 10 s m depending on the resolution of SAR, the size of a subset patch (i.e., enough to maximize SNR), and the size of a search window (i.e., enough to include the distance of movement), while InSAR is limited to relatively small deformation gradients at the scale of cm [40,46] (Figure 4).
Figure 3. Perpendicular and temporal baseline plots of Sentinel-1 SAR datasets in Table 1 (left: 2017–2018 cycle, right: 2018–2019 cycle). The filled markers represent the master images.
Remotesensing 13 02168 g003
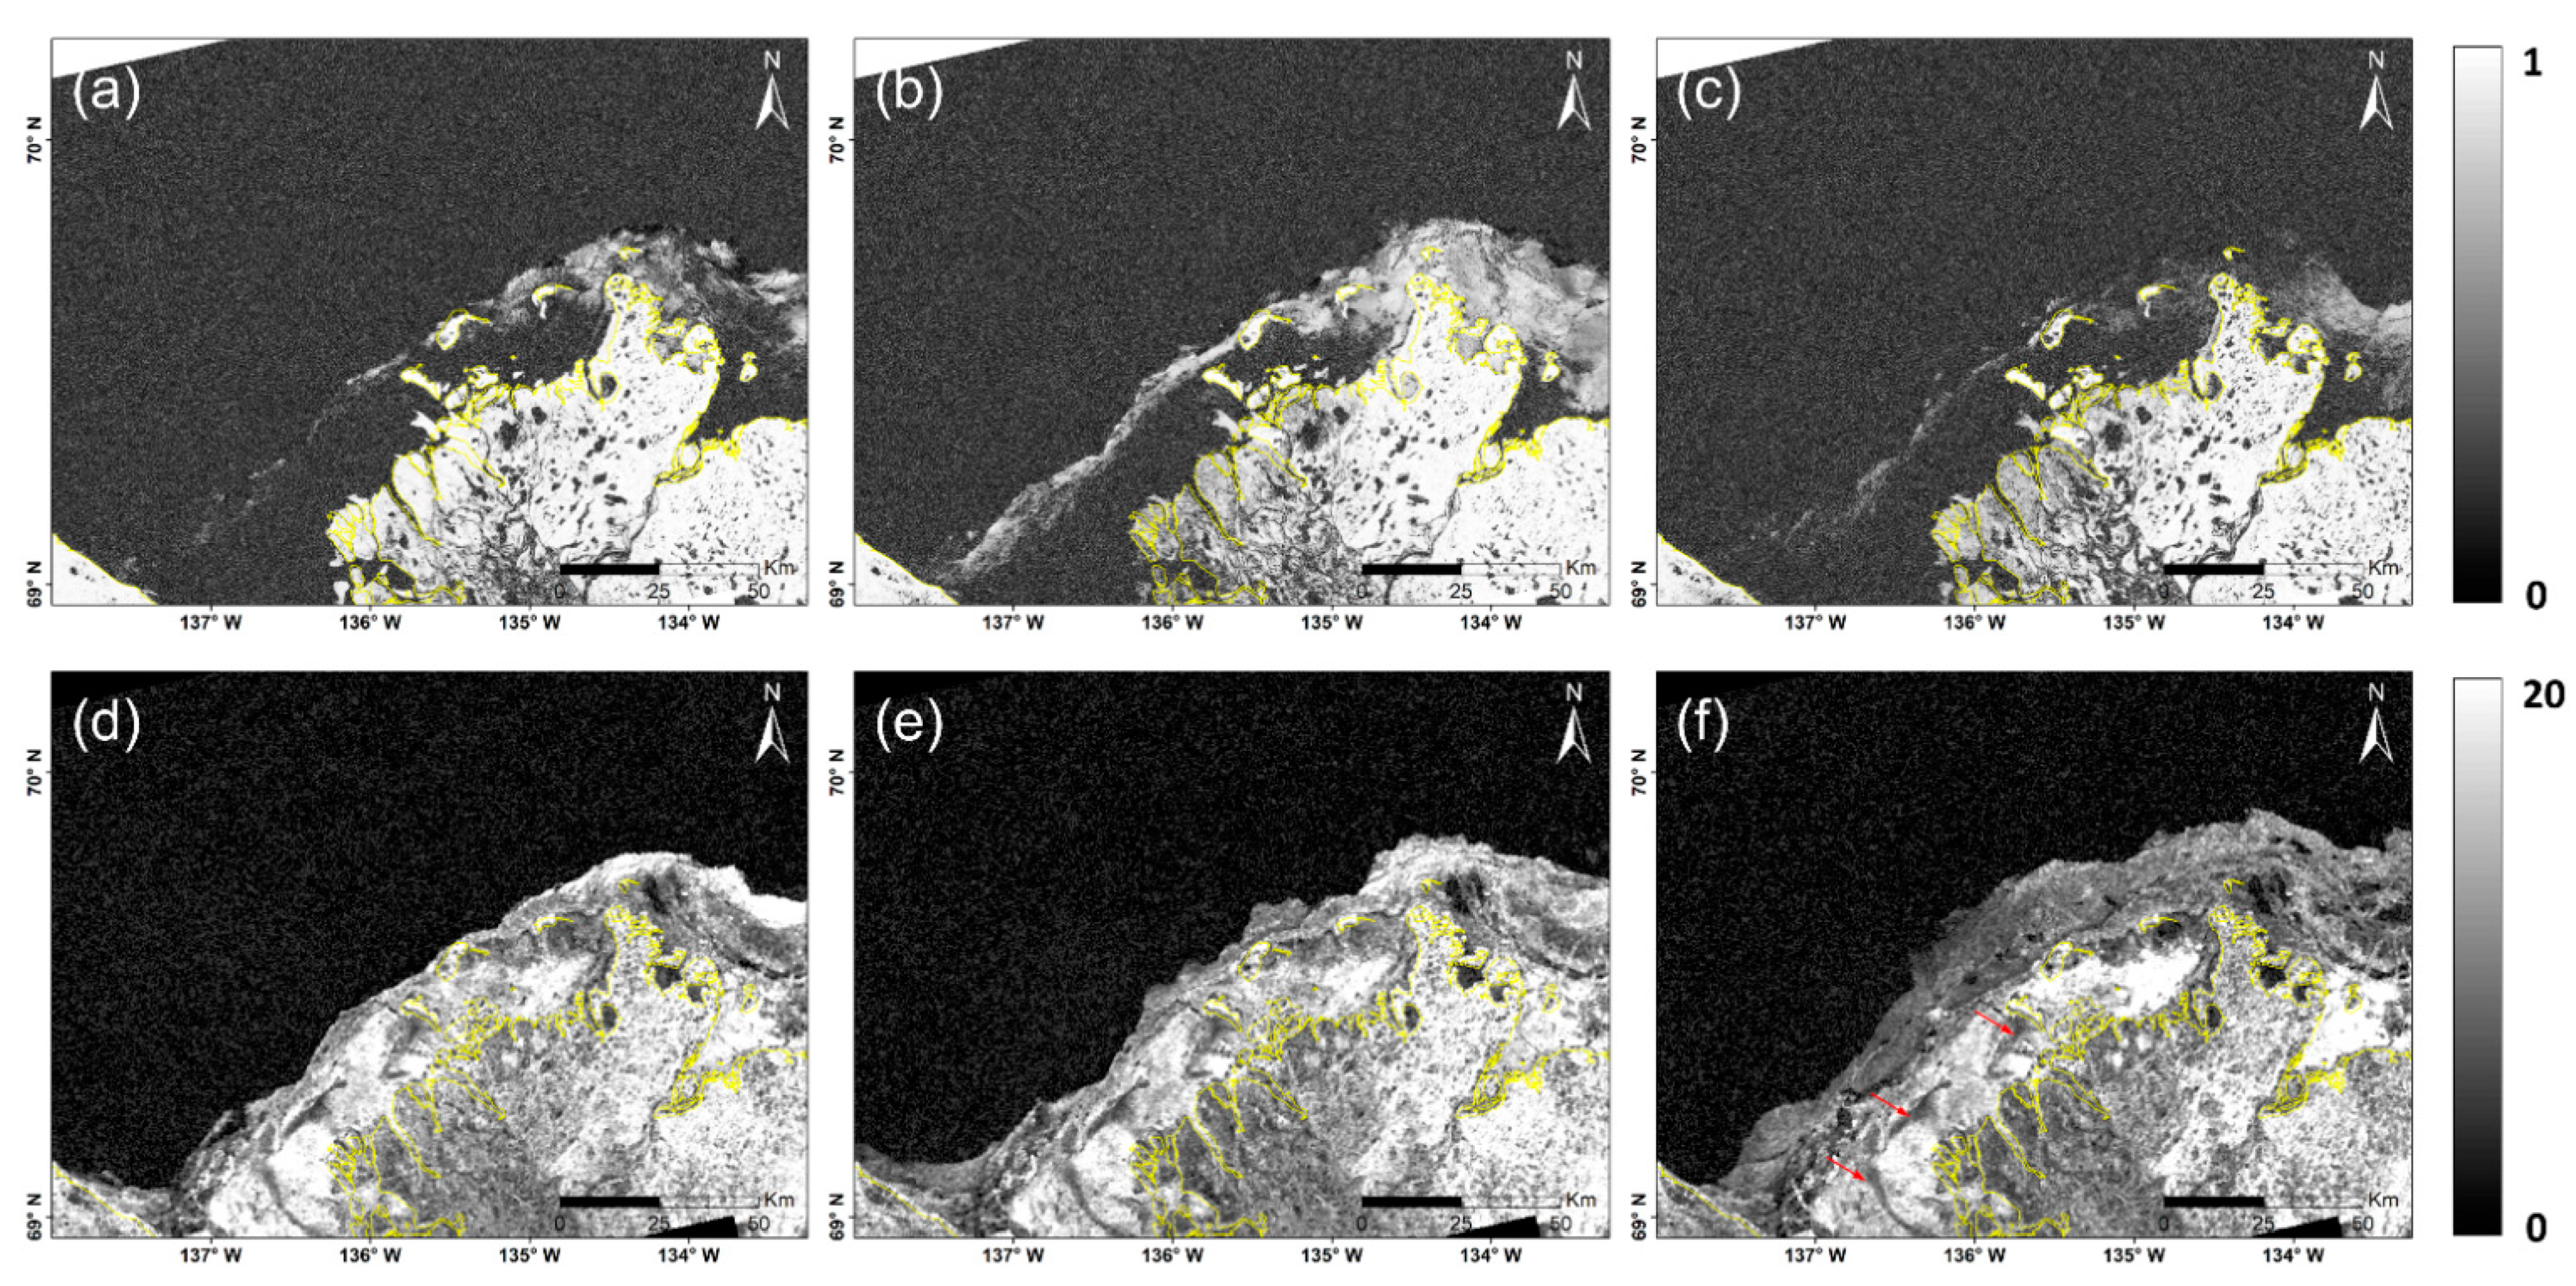
Figure 4. Comparison between InSAR coherence (a: 20180113–20180125, b: 20180125–20180206, c: 20180206–20180302) and SNR (d: 20180113–20180125, e: 20180125–20180206, f: 20180206–20180302). InSAR coherence was processed with a 5 by 5 window for multilooked data (16 by 4 pixels in range and azimuth) and the adaptive filter was applied with a Fast Fourier Transform (FFT) window of 32. The red arrows in Figure 4f indicate relatively low SNR in the inner floating landfast ice for comparison with Figure 9d. The coastline is shown in yellow.
Remotesensing 13 02168 g004
The LOS and azimuth offsets, calculated from each of ascending and descending pairs ( L O S i and A Z I i ; i = asc, dsc, four product sets in total), are used to reconstruct the 3D offsets ( D j ; j = N, E, U) for each acquisition epoch by inverting the following Equation (1), written in a matrix form [43]:
( L O S a s c L O S d s c A Z I a s c A Z I d s c ) = ( sin φ a s c sin θ a s c sin φ d s c sin θ d s c cos φ a s c cos φ d s c cos φ a s c sin θ a s c cos φ d s c sin θ d s c sin φ a s c sin φ d s c cos θ a s c cos θ d s c 0 0 ) ( D N D E D U )
where φ i and θ i (i = asc, dsc) are the azimuth and incidence angles of ascending and descending pairs, respectively. Here, for the purpose of modeling, we assume that each pair of ascending and descending data were acquired at the same time, although there is a difference of several hours. The SPO processing was performed with the GAMMA software [47]. A subset patch of 64 by 16 pixels spacing in range and azimuth (i.e., ~149 m by 222 m in range and azimuth) and a search window of 256 by 64 pixels in range and azimuth (i.e., ~596 m by 888 m in range and azimuth, ~0.5 km2) were applied. A threshold of SNR = 5 and the median filter with a window of 11 by 11 pixels in range and azimuth were applied to remove noise and to smooth the results (Figure 4). The precision of the SPO estimates was calculated by the standard deviations of the cumulative offset estimates from ~4400 pixels in the land, which are ~0.4, ~0.3, and ~0.2 m for north–south, east–west, and up–down components, respectively. Time series analysis was performed for each of 2017–2018 and 2018–2019 annual cycles by applying the Small Baseline Subset (SBAS) technique using MSBAS software [48].

3. Results

3.1. 3D SPO and Time Series Analysis
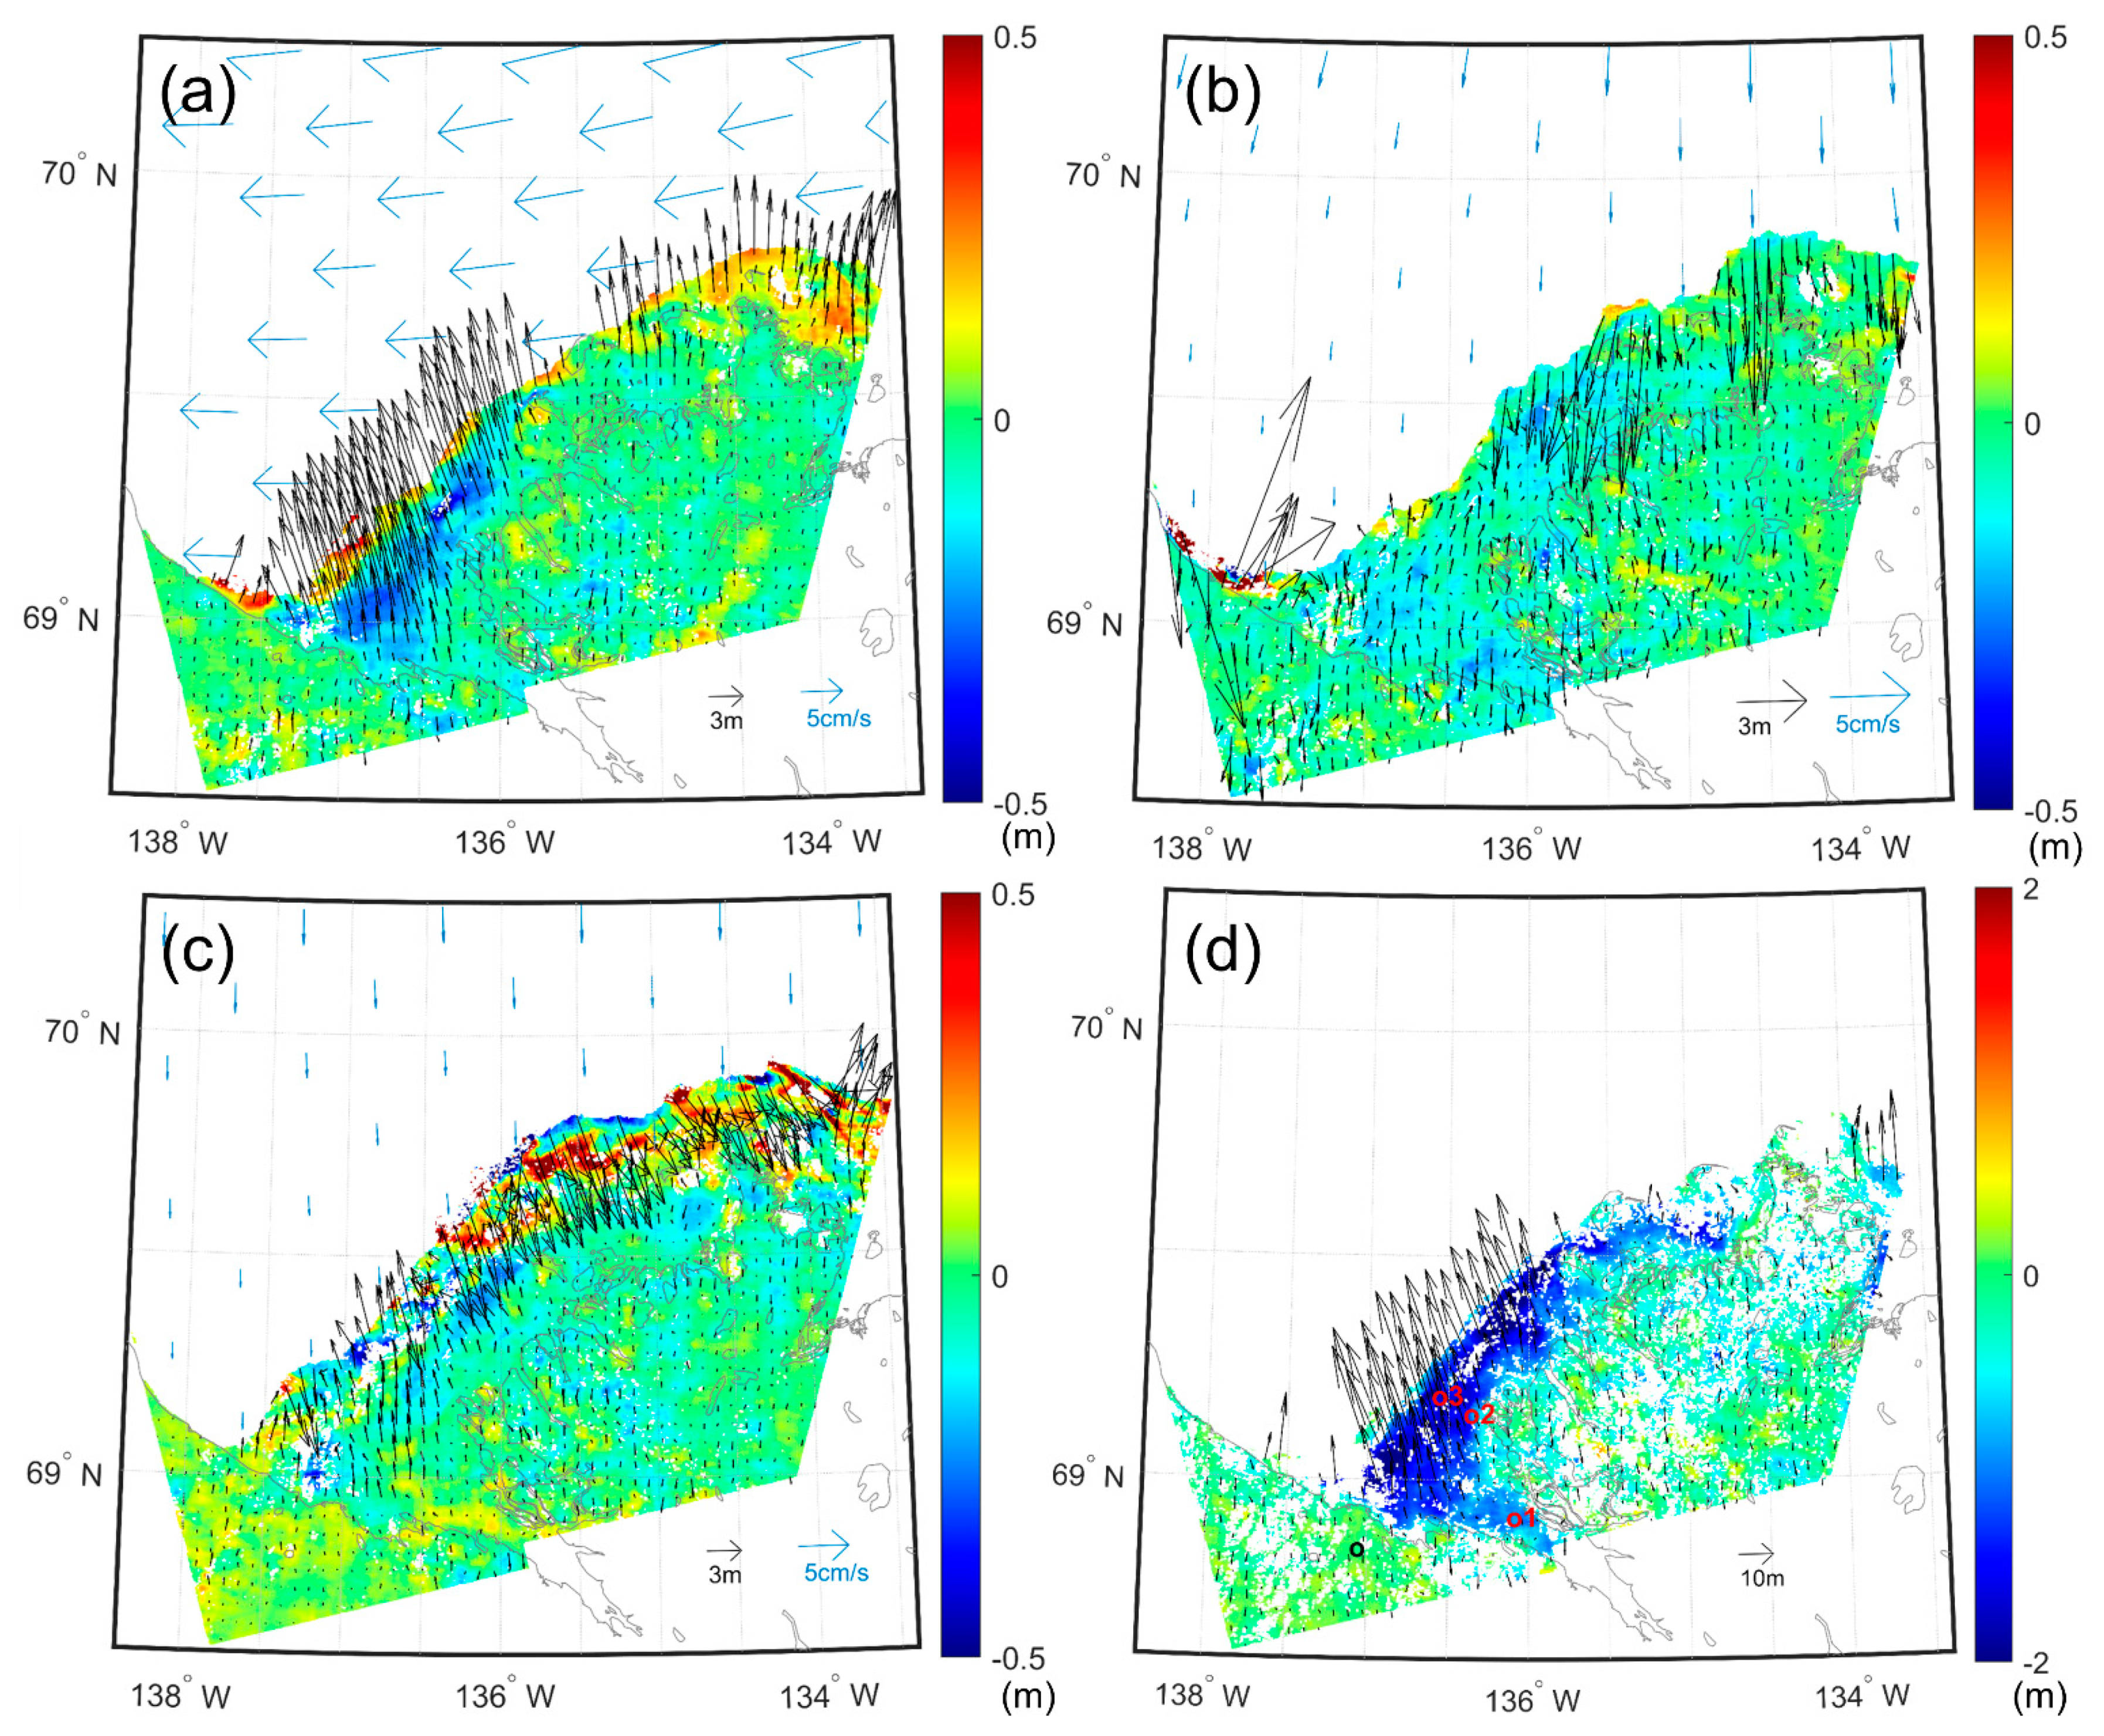
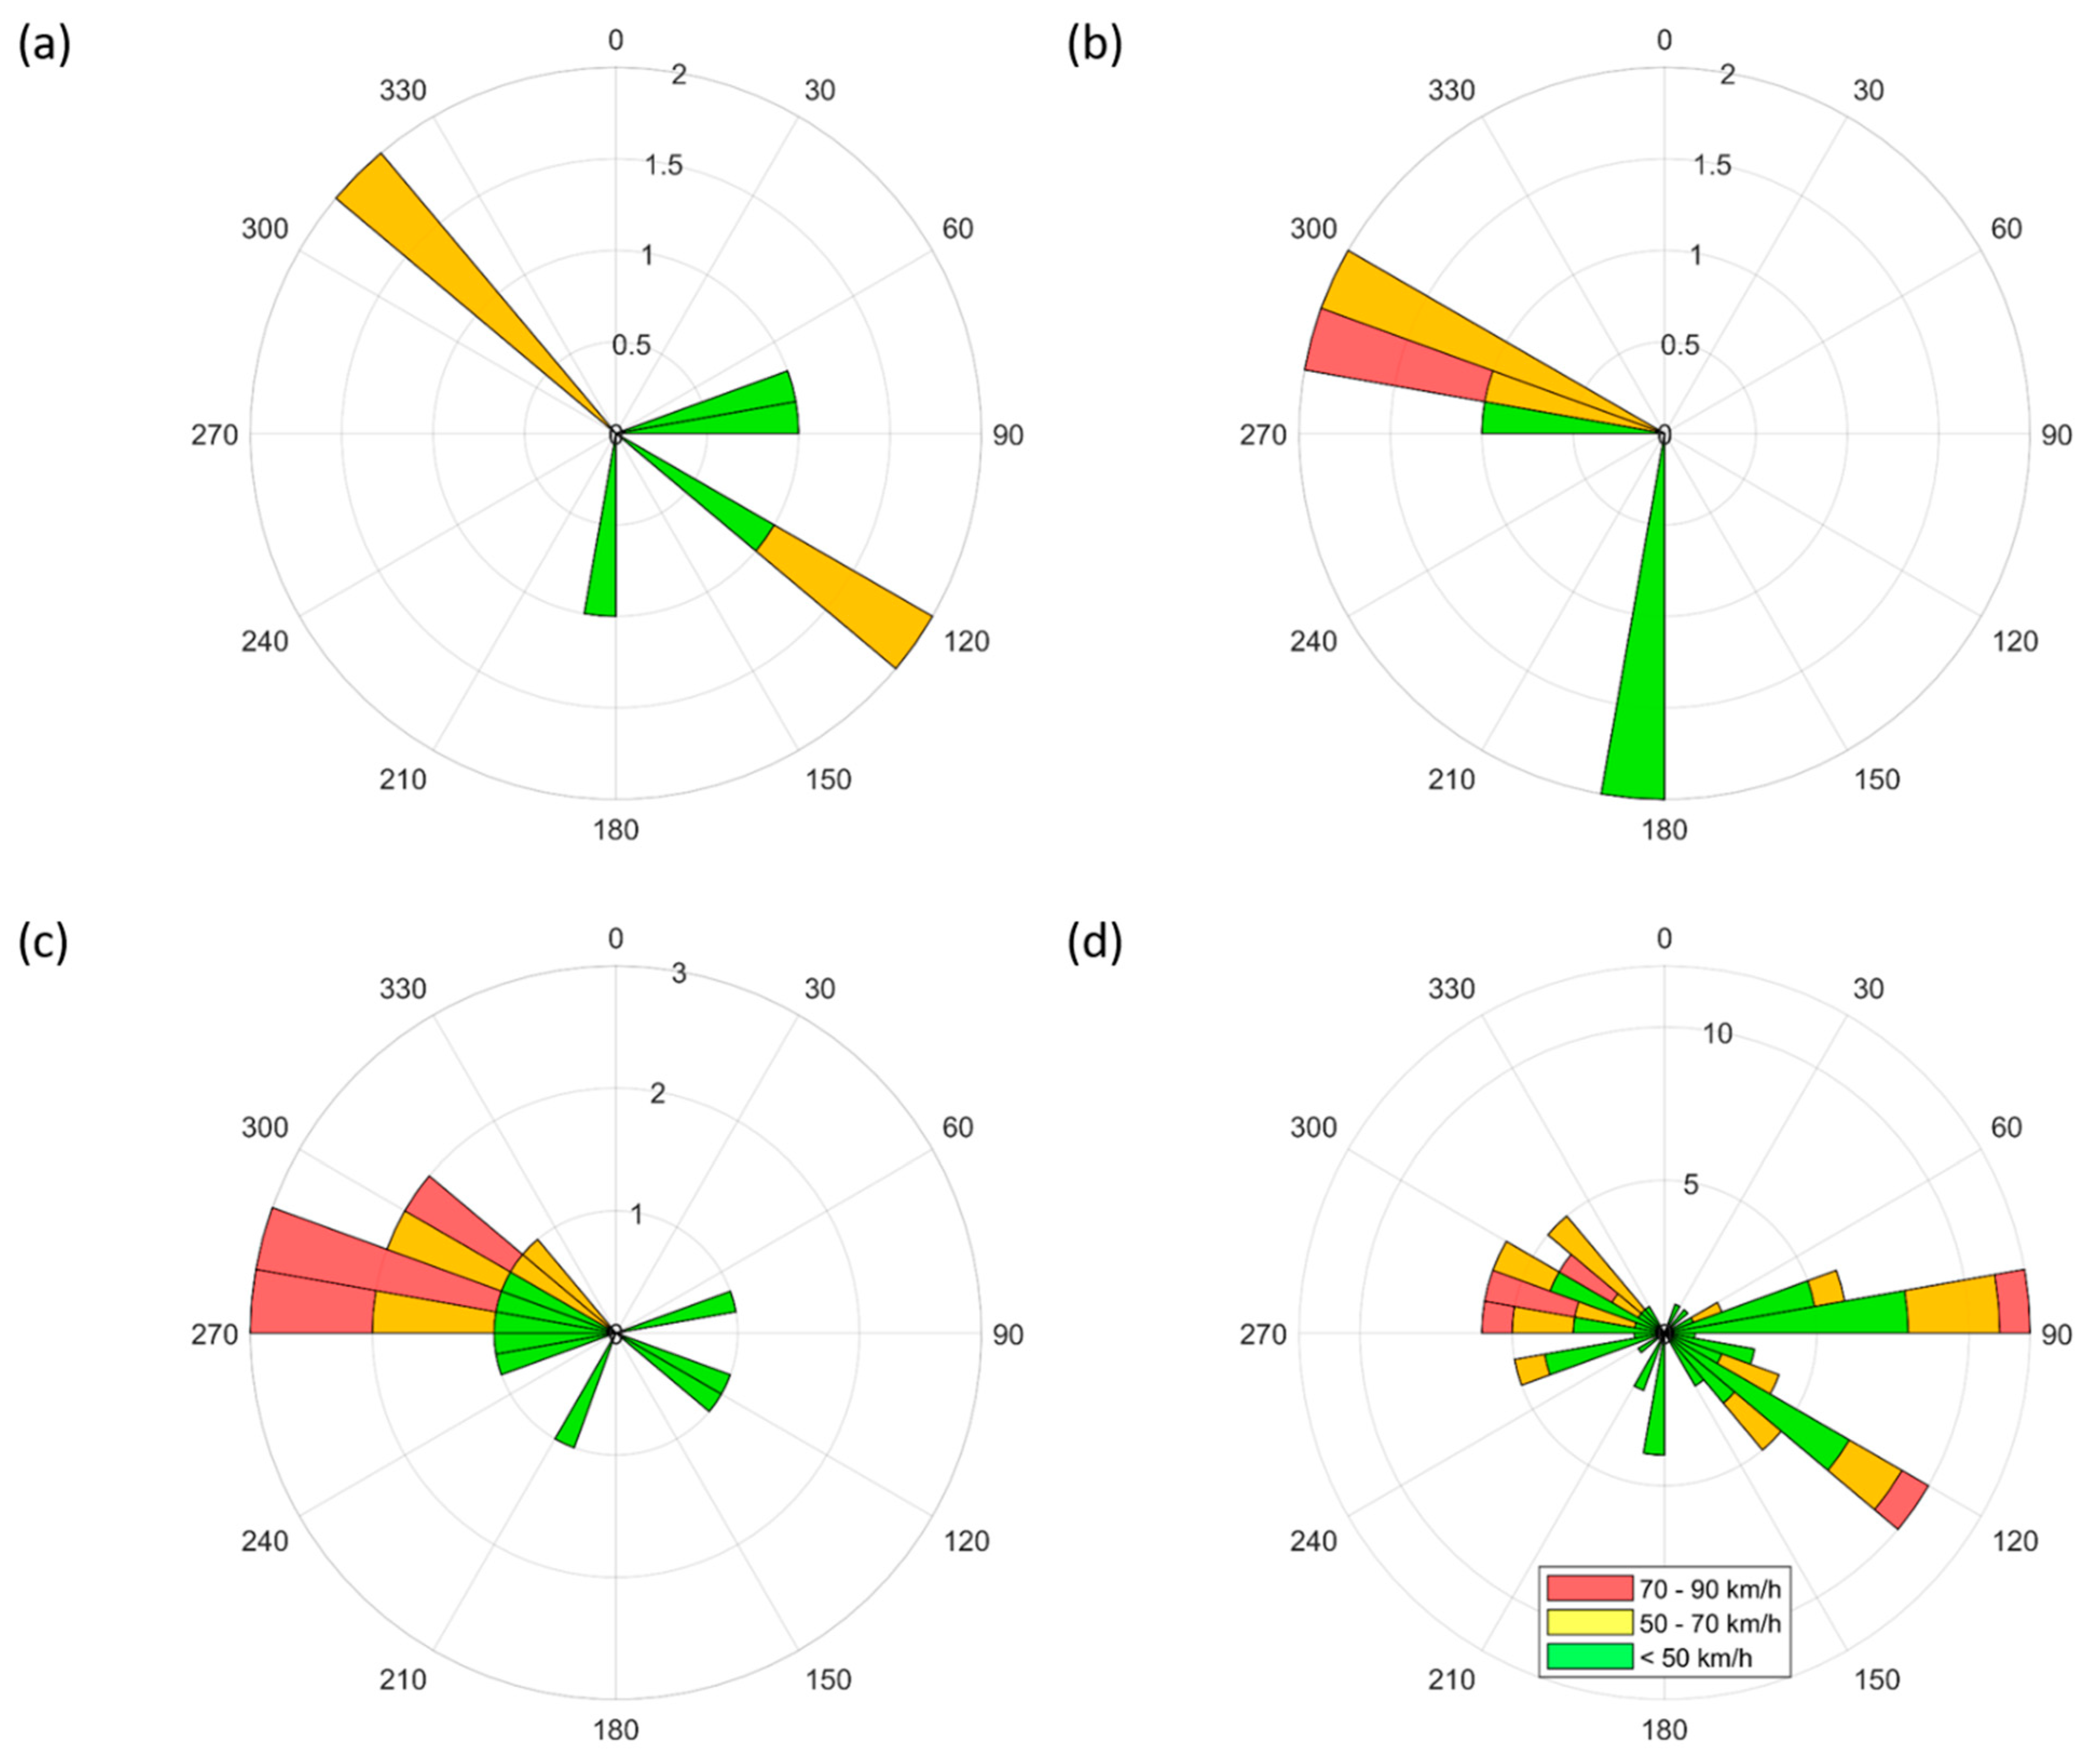
Figure 5 shows the 3D SPO results for landfast ice during the 2017–2018 cycle compared to the average drift sea ice daily motions during the same time period. The stabilized floating landfast ice characterized by distinct interferometric fringe patterns (i.e., outer stabilized floating ice) and strong backscattering (i.e., inner stabilized floating ice) in Figure 2 showed significant horizontal and vertical offsets. In January 2018, the floating landfast ice showed horizontal offsets towards northwest, which correspond to the drift sea ice motions heading to west along the coastline (Figure 5a) and the SE wind (Figure 6a). Negative vertical offsets of <0.5 m were observed along the Beaufort Sea around the Mackenzie River mouth. On the other hand, positive vertical offsets were observed along the seaward edges. These edges correspond to where flaw leads occur with recursive ice freezing and breakup, and SPO was not applicable beyond the edges due to faster motions (i.e., non-stabilized floating ice, masked out by the threshold of SNR). In late January to early March 2018, sudden positive vertical offsets of >0.5 m were observed at the edge of the inner floating landfast ice during the 12- and 24-day intervals (Figure 5b,c). The horizontal displacements from 20180125–20180206 (Figure 5b) and 20180206–20180302 (Figure 5c) correspond to the strong W, NW, and S winds (Figure 6b,c) during the periods. Overall, the floating landfast ice changes for the 2017–2018 cycle are characterized by the horizontal offsets heading to the northwest and the negative vertical offsets along the Beaufort Sea coasts out of the Mackenzie River mouth (Figure 5d). Based on the wind statistics during the same periods (Figure 6), we confirmed the distinct horizontal displacements towards the northwest are largely affected by the strong SE wind. For example, the average direction of the northwest displacements from 20171126–20180407 (Figure 5d) is calculated at about −40° (or 320°, North is 0°), which corresponds to the SE winds of 120° to 150° (Figure 6d). Similar patterns of landfast ice changes were observed from the 2018–2019 cycle.
Figure 5. 3D SPO results. (a) 20180113–20180125. (b) 20180125–20180206. (c) 20180206–20180302. (d) Total cumulative offsets between 20171126 and 20180407. The color bars represent vertical offsets and the black arrows represent horizontal offsets reconstructed from east-west and north-south offsets. The pale blue arrows represent the averaged drift sea ice motions during the same period. Note that the sizes of the arrow scale bars vary relative to the changes for each period. The black (land) and red (landfast ice; LFI 1–3) circles represent the spots for time-series analysis in Figure 7.
Remotesensing 13 02168 g005
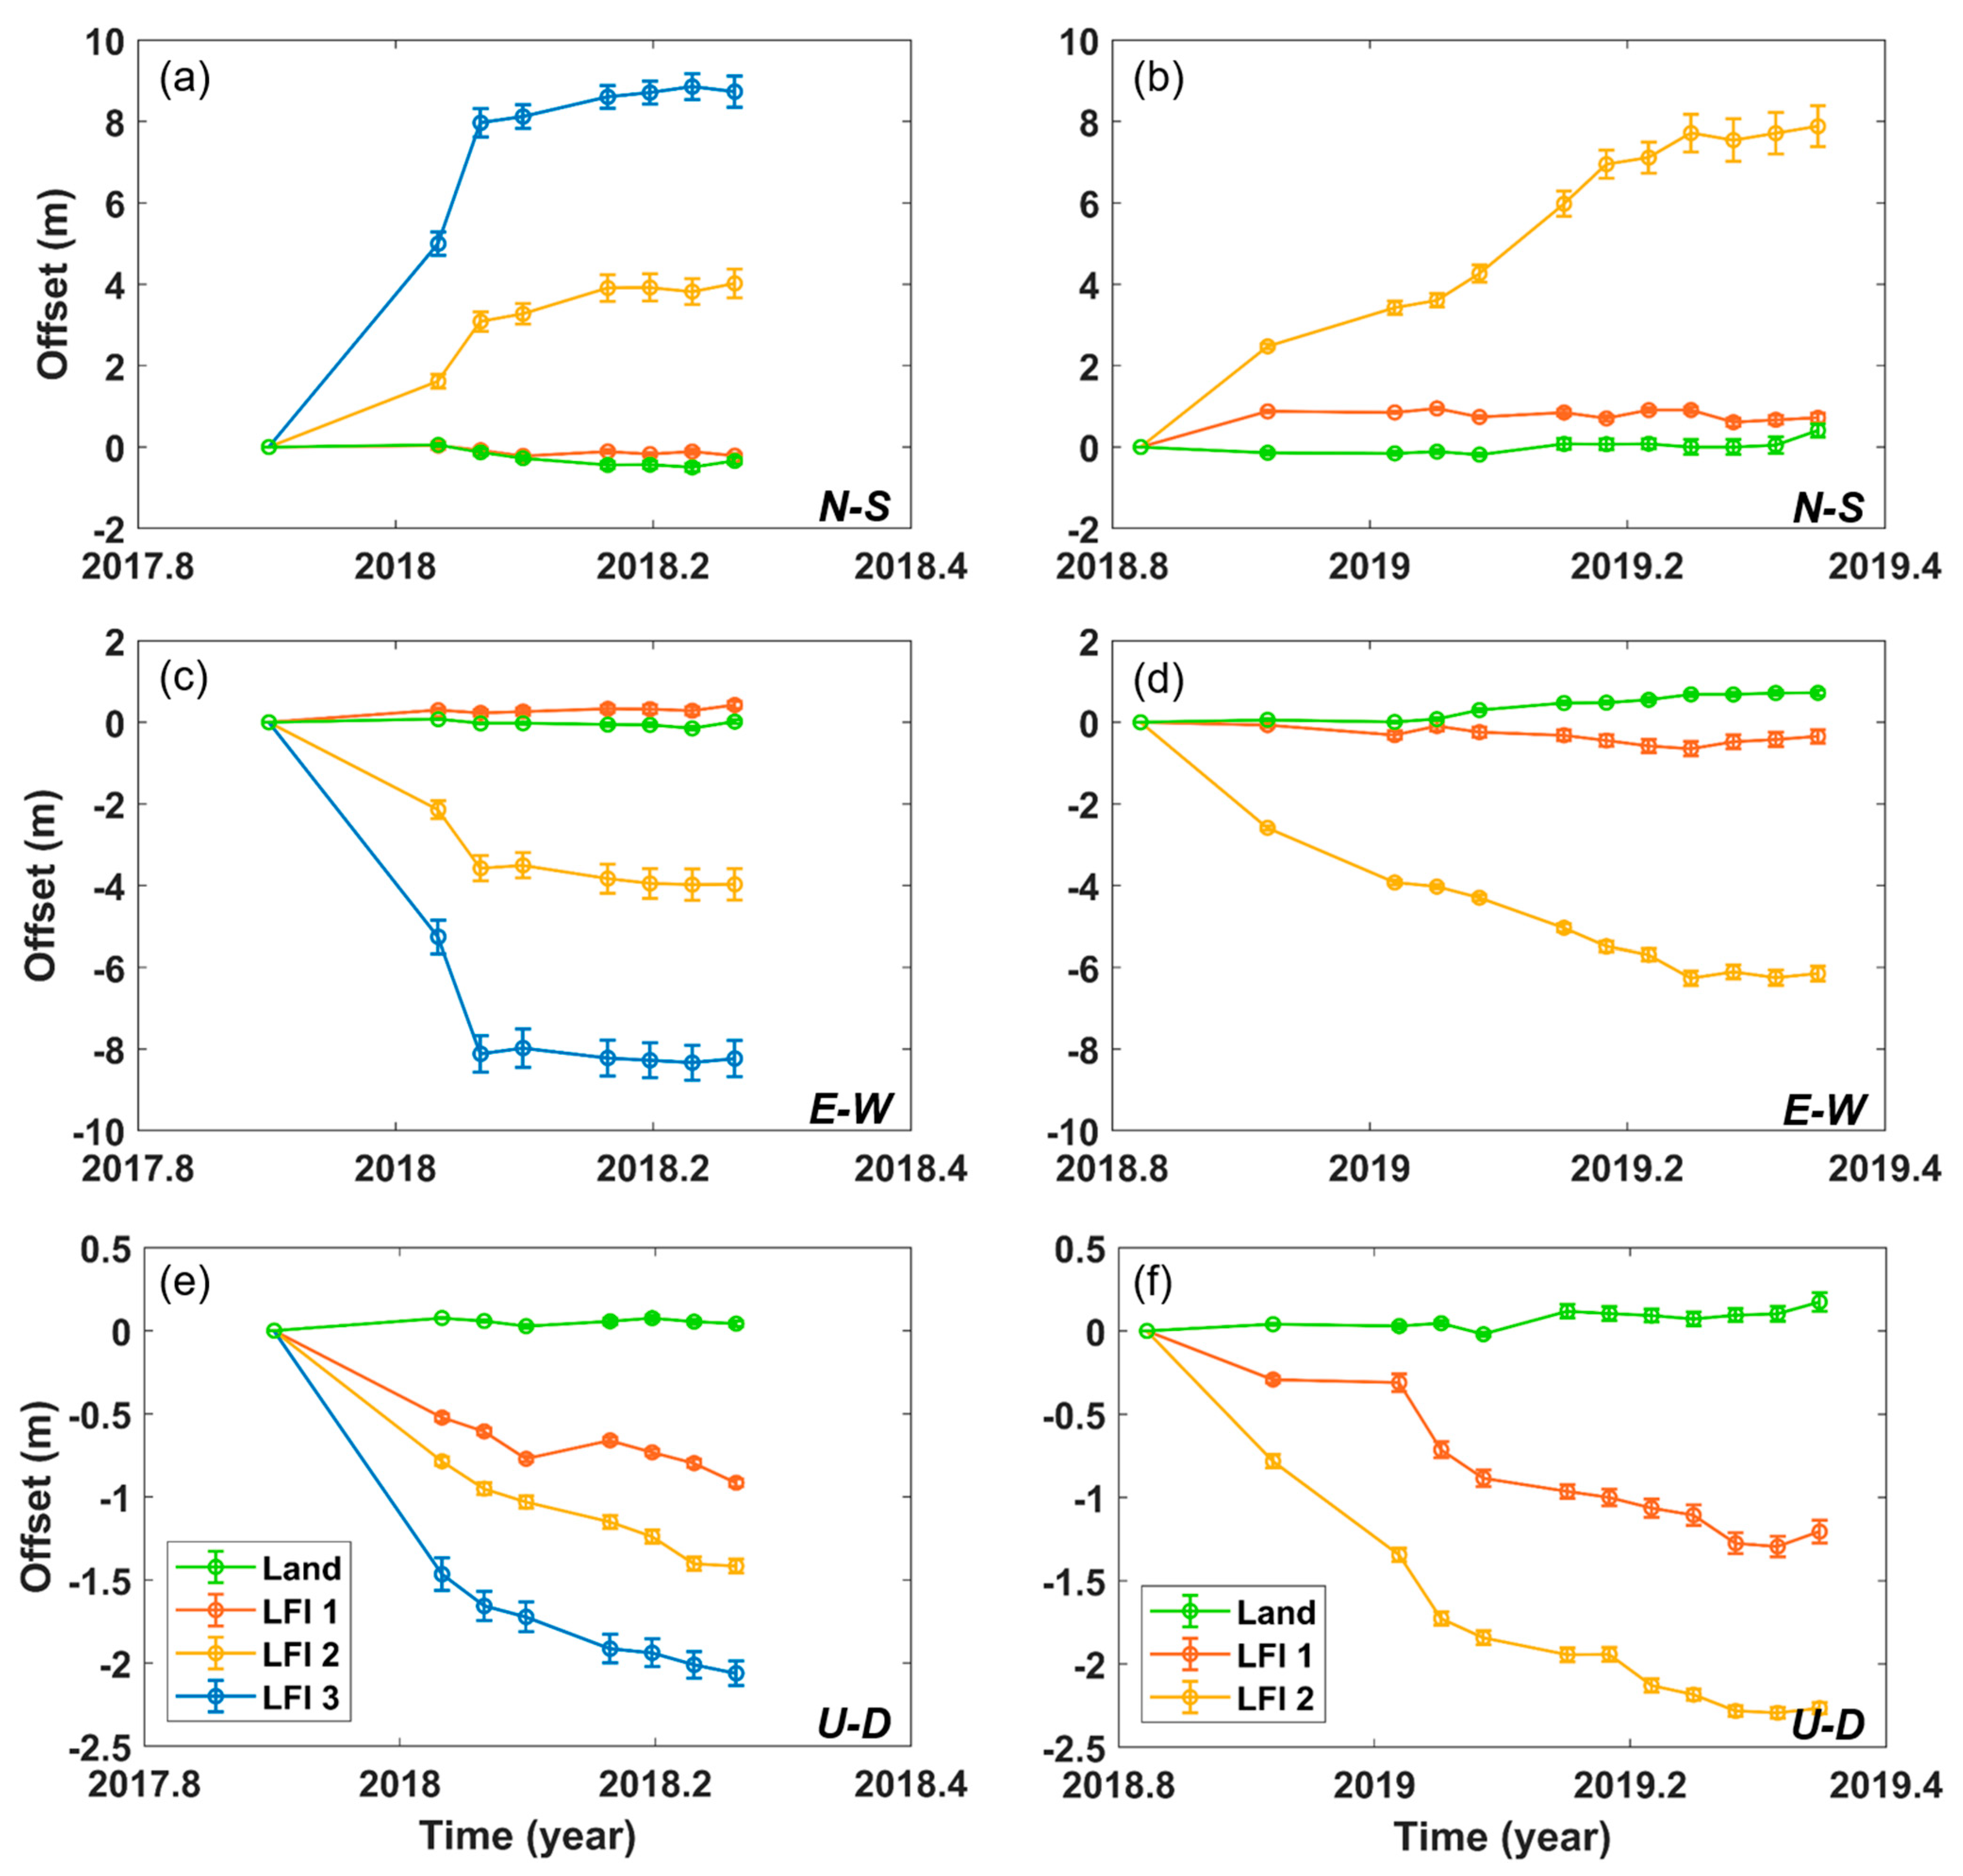
The 3D time-series analysis confirmed the cumulative horizontal offsets up to ~8 m towards the northwest and the cumulative vertical offsets of up to ~−2.3 m from the floating landfast ice (Figure 7). Three points from the floating landfast ice showing different fringe patterns according to the distance from the shore were analyzed with a reference point at the land. The horizontal offsets increase approaching the seaward edge. LFI 1 formed close to the land showed little variation in north-south and east-west offsets similarly to the land, but only vertical offsets of ~−1 m (Figure 7). LFI 3 close to the seaward edge showing the largest changes could not be estimated in the 2018–2019 cycle, which is probably due to faster movements (i.e., low SNR). The horizontal and vertical changes were predominant between November and January and were more significant in the 2018–2019 cycle.

3.2. Comparison with Numerical Ice Thickness Modeling
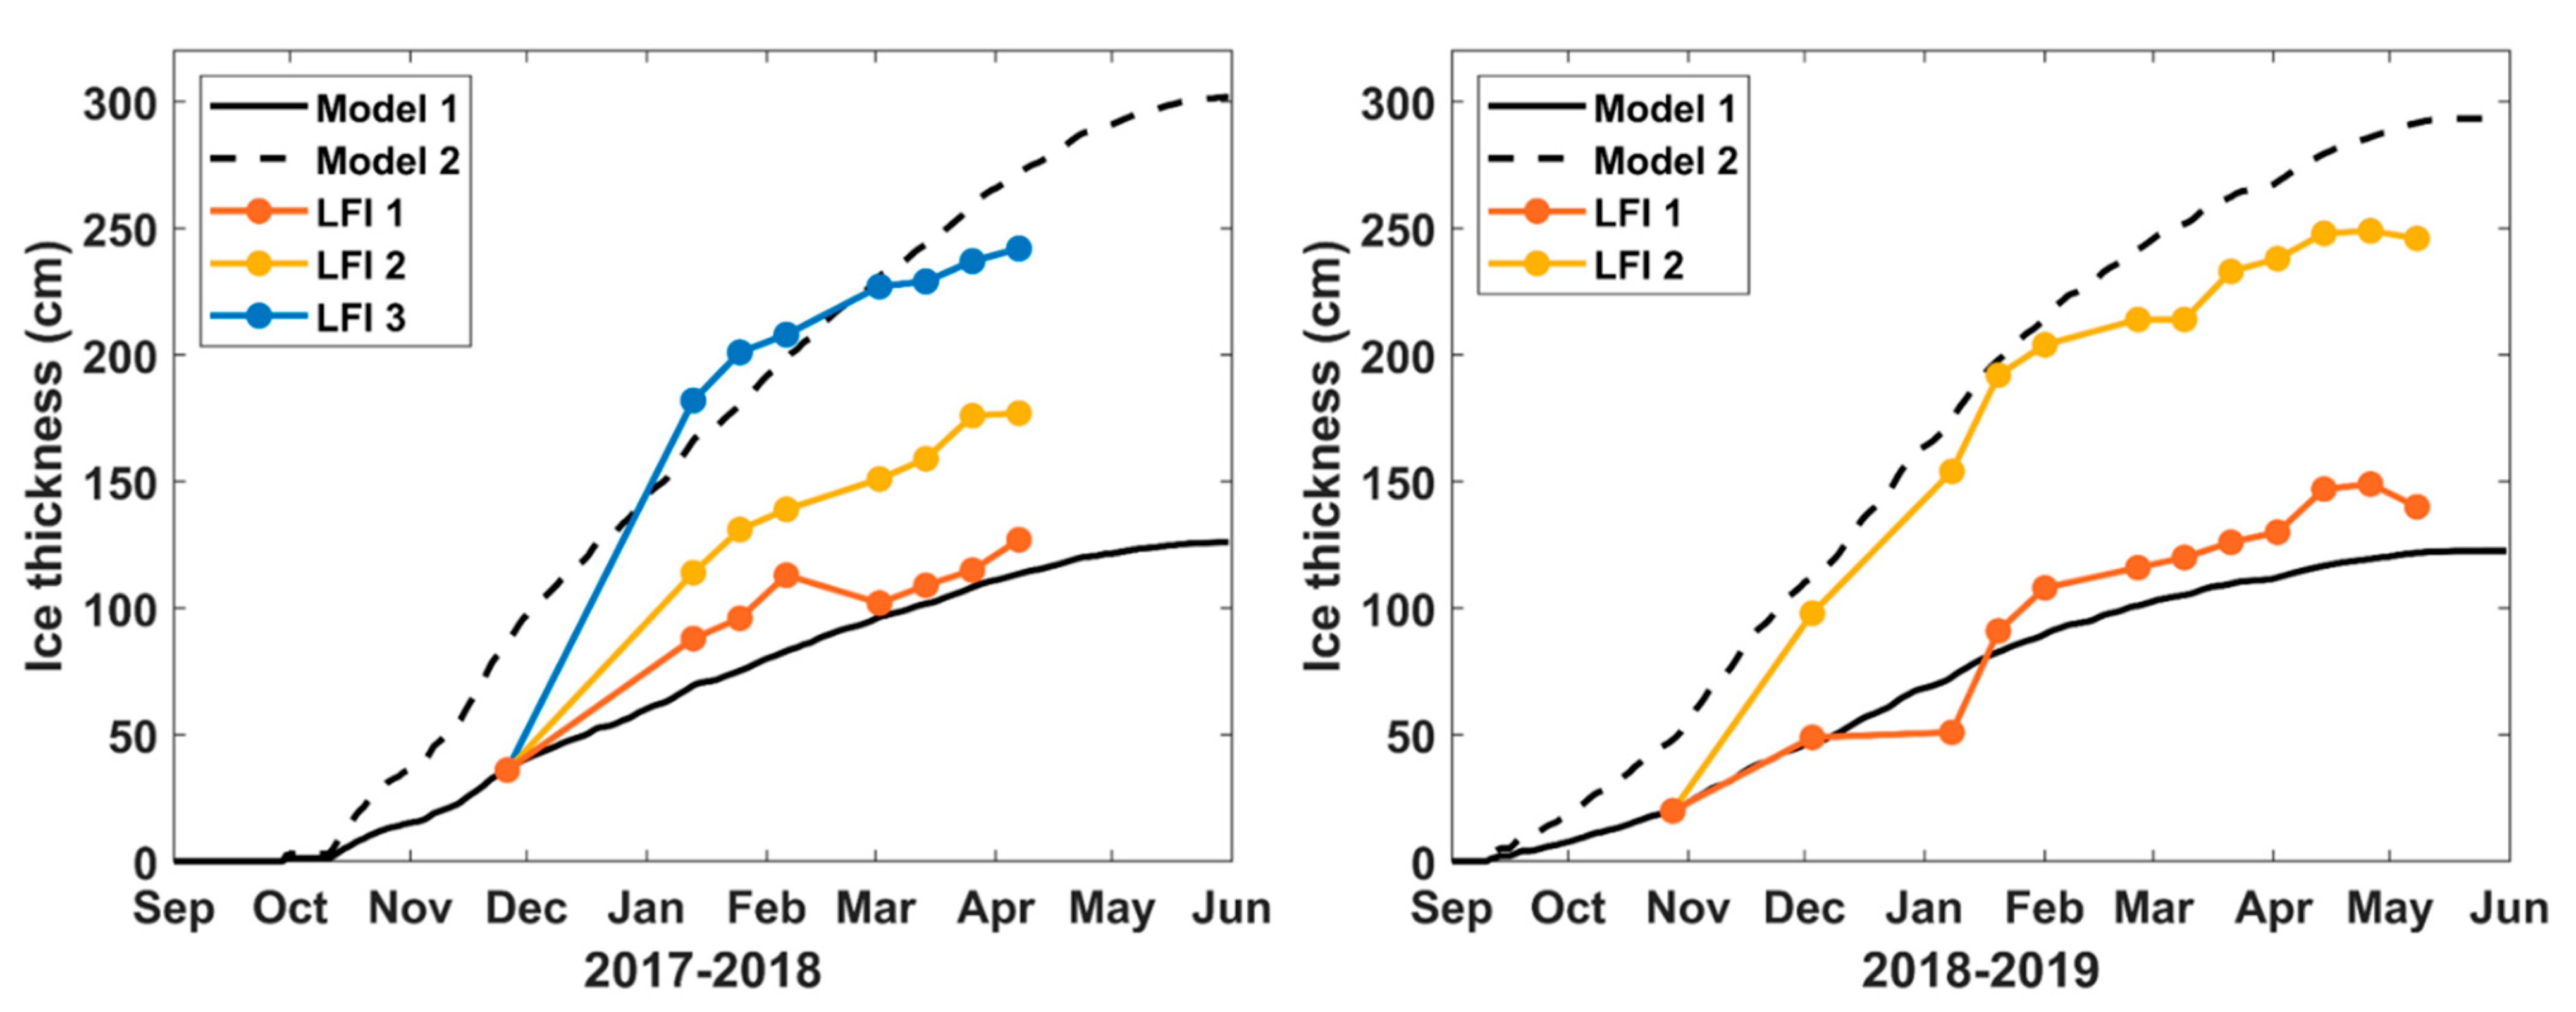
The amount of the cumulative vertical offsets is comparable to the ice thickness measured at ~1 to 2 m with a ground penetrating radar in the region [33,49]. The reversed cumulative vertical offsets correspond to the growth patterns of landfast ice thickness observed in the Canadian Arctic Archipelago [8]. Thus, we converted the cumulative vertical negative offsets into the relative growth of ice thickness (i.e., reversing a negative vertical offset to a positive growth of ice thickness), and compared them to ice thickness model estimates (Figure 8). We applied a sea ice thickness model based on accumulated freezing degree days (AFDD) developed by [50], Equation (2):
h i = β ×   [ ( T f T a ) d t ] γ ,
where hi is the ice thickness, and Tf and Ta are the freezing point temperature and the air temperature, respectively [51]. β and γ are empirical coefficients varying depending on the target environments such as average snow depth, and β ranging from 1.7–2.4 and γ ranging from 0.5–0.6 have been tested at different sea and lake ice sites [52]. We calculated AFDD with the daily mean air temperature and Tf = 0 °C assuming freshwater. We used β = 0.94 and γ = 0.6 optimized for estimating freshwater lake ice thickness (Model 1) [52]. The growth of LFI 1 close to the land matched well with Model 1 estimates. LFI 2 and LFI 3 close to the seaward edge showed faster growth, particularly in November to January, and reached up to ~2.5 m matching with optimized β = 2.25 and γ = 0.6 (Model 2).
Figure 6. Wind rose diagrams from the Pelly Island station during 20180113–20180125 (a), 20180125–20180206 (b), 20180206–20180302 (c), and 20171126–20180407 (d). North is 0°.
Remotesensing 13 02168 g006
Figure 7. 3D time-series analysis of 2017–2018 ((a) north–south, (c) east–west, (e) up–down) and 2018–2019 ((b) north–south, (d) east–west, (f) up–down) cycles. The green, orange, yellow, blue lines represent the offsets observed from the land and landfast ice (LFI 1–3) spots marked in Figure 5d, respectively. The vertical error bars represent the standard deviation in 5 by 5 pixels window.
Remotesensing 13 02168 g007

4. Discussion

While InSAR coherence is very low (i.e., less than ~0.3) over most of the floating landfast ice, the 3D SAR SPO measurements showed a great potential for monitoring landfast ice during its growth season. The question remains why high SNR values are observed in the areas with low InSAR coherence. Firstly, a possible explanation is that a significantly larger window is applied to calculate for SNR than for InSAR coherence. Large deformation gradients can produce low coherence at the spatial scale of m to 10 s m, but can produce high SNR at the spatial scale of 100 s m. In this case, the ice–water interface may change heterogeneously within neighboring pixels with ice growth, but the ice thickness may have certain oriented facets at the scale of 100 s m. SPO may be able to track such a broader spatial pattern. Secondly, Jeffries et al. (1994) reported that the ice–water interface and the tubular bubble layer at the ice bottom combine to produce strong backscattering from floating freshwater lake ice, and the maximum backscattering is saturated from early January until late April, not increasing as much as the tubular bubble layers thicken [53]. Although the ice bottom can significantly change with its growth, the backscattering signals could be saturated and also returned from the tubular bubble layers, not directly from the ice–water interface. The SPO measurement based on SAR backscattering intensities could obtain relatively coherent signals at such a large window, but this can lead to an underestimation of SPO measurements. Probably both reasons are valid, but follow-up studies need to further assess the possible errors of SPO measurements with in situ measurements of ice thickness.
Figure 8. Comparison between ice thickness model estimates and vertical offsets observed from SAR SPO (left: 2017–2018, right: 2018–2019). The black solid and dashed lines are the estimates by Model 1 and Model 2, respectively. The orange, yellow, and blue markers represent the relative ice thickness reversed from the vertical offsets of LFI1, LFI2, and LFI3 in Figure 5, respectively. The SPO starting points are referenced to the Model 1 estimates of the first SAR acquisition dates.
Remotesensing 13 02168 g008
For the vertical offsets relating to ice growth, SPO is only applicable to nearly freshwater landfast ice. As shown in Figure 2c,d, the inner stabilized floating landfast ice is differentiated by high contrast in VV backscattering between the bottomfast ice and the outer smooth and thin ice with possible opening of flaw leads. This indicates the inner stabilized floating landfast ice is freshwater-driven ice. The strong scattering is dominantly from single-bounce off the ice–water interface [54]. However, the contributions from tubular bubble and brine inclusions also need to be considered. Based on the polarimetric SAR composite showing the relative strength of VH backscattering to VV backscatter (Figure 9), the inner floating landfast ice is also characterized by higher VH backscattering, while the bottomfast ice and the outer floating ice show little VH backscattering. This could be due to strong volume scattering from tubular bubble and brine inclusions in the ice. Given the little VH backscattering from the bottomfast ice, the roughness effect from the snow–ice interface can be negligible. In addition, it is possible that there are salinity transition zones within the inner floating landfast ice, which are observed by relatively low volume scattering (Figure 9). These areas also show lower SNR values (Figure 4d–f). Thus, the penetration into the ice–water interface can be limited by tubular bubble and brine inclusions, which could lead to SPO measurement errors.
Figure 9. Polarimetric SAR backscatter composite (red: VV, green: VH, blue: VV). (a) 20180113. (b) 20180125. (c) 20180206. (d) 20180302. The backscattering coefficients (sigma naught) were linearly stretched between −25 and −10 dB for the VV channel and between −28 and −18 dB for the VH channel. The red arrows in Figure 8d indicate bright white areas in LFI showing higher VV and VH signals. The coastline is shown in yellow.
Remotesensing 13 02168 g009
The horizontal offsets are interpreted to be lateral displacements of the floating landfast ice, which are mainly driven by wind and drift sea ice motions. The wind statistics showed the main source is the strong SE wind from the Mackenzie River region. The Beaufort Gyre forces sea ice motions moving from east to west along the Beaufort Sea coast and creates coastal flaw leads [55], which largely affects the horizontal displacements towards the west. Large horizontal offsets and positive vertical offsets are sporadically observed along the outer edge of freshwater-driven landfast ice (Figure 5b,c). The outer boundaries are very dynamic zones where thin ice forms and flaw leads (i.e., open water) recursively occur by drift sea ice motions and salinity can be variable. Spedding (1981) reported that pressure ridges frequently occur at the outer edges of landfast ice [56]. Given the drift sea ice motions towards the land from the north during the same periods, it is possible that the displacements are from deformed ice and pressure ridges formed by the collision between landfast ice and drifting sea ice. However, any distinct features to characterize deformed ice and pressure ridges (i.e., very strong backscattering from rough structures relative to the surroundings) were not confirmed. The sporadic large offset values would rather be due to SPO measurement errors caused by salinity transition along the edge, as they are observed from where backscattering signals and SNR are low.
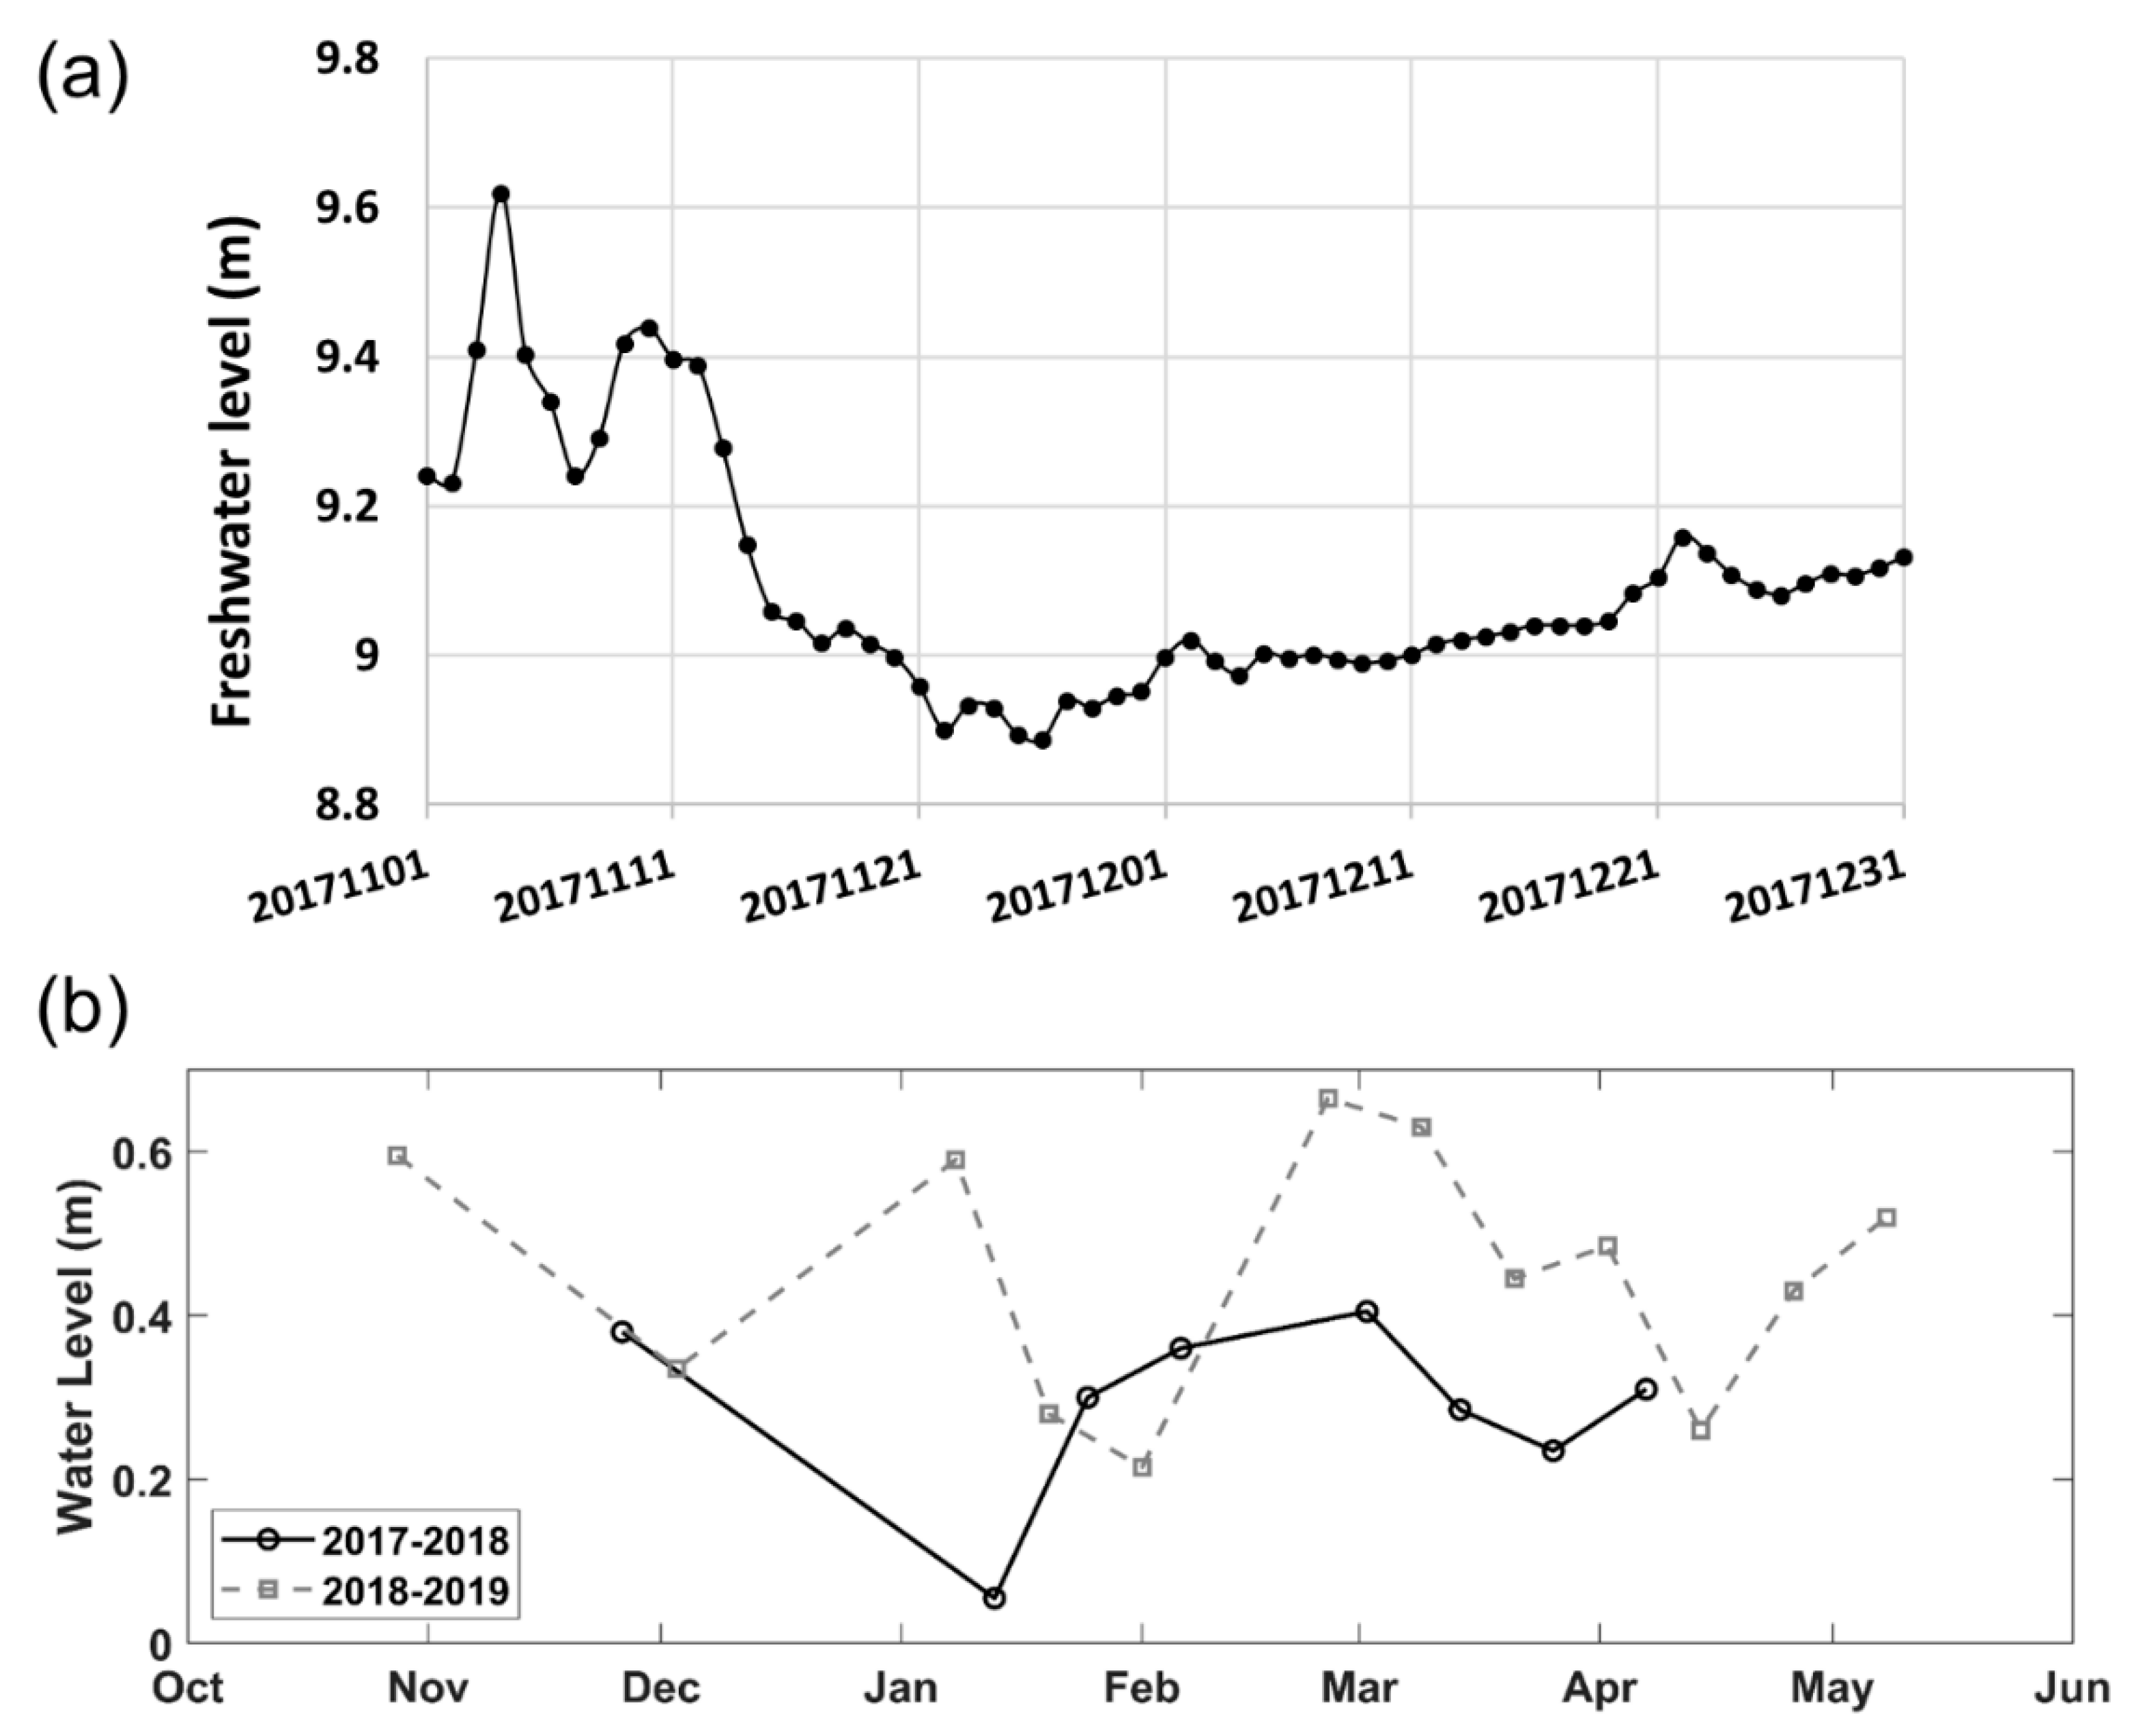
The negative vertical offsets can have a strong link to freshwater-driven landfast ice thickness, as radar penetration is longer into the lowering ice–water interface with ice growth. The time-series analysis revealed that the most significant growth of landfast ice occurs between November and January and then the growth slows down, which corresponds to the air temperature records rapidly decreased from November and reached to the minimum in January and the ice thickness model estimates. The snow depth has steadily increased reaching ~0.6 m until late April. The snow layer in cold and dry conditions over the winter are transparent to C-band SAR (see Figure 2c,d). Thus, this does not largely affect the negative vertical offsets, but it is possible to induce downward motion of cm-scale by the cumulative snowfall weight. The local freshwater level in the Mackenzie Delta decreases until late November and then has little variation from early December (Figure 10a). For example, compared to the large vertical negative offsets up to ~1.5 m observed from 20171126–20180113 (Figure 7e), the local freshwater level rather increased more than 0.2 m. It is not certain how much tide can impact the SPO measurements, hourly tide records from the closest station showed very small fluctuations between ±0.3 m during the SAR acquisition periods (Figure 10b). Thus, both freshwater and seawater level changes have little impact on the consistent vertical negative offsets. However, if in situ water level measurements at the same time of SAR acquisition are available, the variation of accurate water levels can compensate for an overestimation or underestimation of SPO vertical measurements.

5. Conclusions

We developed a methodology for monitoring landfast ice displacement and, in some cases, ice thickness change. Ice thickness change can be measured only for low salinity ice that allows SAR to penetrate to the ice–water interface, which is dependent on SAR frequencies [23]. Horizontal offsets are largely affected by wind directions and drift sea ice motions. The cumulative downward vertical offsets can indicate the growth of freshwater-driven landfast ice thickness except for the early freezing stage and the late melting stage of very rapid changes and when water overlays the ice. Further works need to address the SPO measurement errors with in situ measurements of ice thickness, salinity, and local water level. If the SPO measurement errors are compensated, the proposed methodology would have a great potential for monitoring the thickness change of freshwater ice, such as landfast, lake, and river ice. With the C-band Sentinel-1 SAR and the new trio of RADARSAT Constellation Mission (RCM) SAR satellites with a 4-day revisit cycle, the forthcoming NASA-ISRO SAR (NISAR) with S- and L-band dual frequencies can be used to define better in synergy with a longer penetration depth. Higher spatial and temporal resolution SAR with a capability to acquire at the same time from ascending and descending orbits can greatly improve the precision of SPO measurement.

Author Contributions

Conceptualization, B.-H.C. and S.S.; methodology, B.-H.C. and S.S.; software, B.-H.C. and S.S.; validation, B.-H.C. and S.S.; formal analysis, B.-H.C. and S.S.; investigation, B.-H.C., S.S. and J.J.; resources, S.S.; data curation, B.-H.C.; writing—original draft preparation, B.-H.C.; writing—review and editing, B.-H.C., S.S. and J.J.; visualization, B.-H.C.; supervision, S.S.; project administration, S.S.; funding acquisition, S.S. All authors have read and agreed to the published version of the manuscript.

Funding

This work was funded by the Canadian Space Agency (CSA) through the Data Utilization and Application Plan (DUAP) program.

Data Availability Statement

The Sentinel-1 archives are available at https://search.asf.alaska.edu (accessed on 9 April 2021). The Polar Pathfinder daily 25 km EASE-Grid sea ice motion data is available at https://nsidc.org/data/nsidc-0116 (accessed on 9 April 2021). The daily air temperature, wind statistics, and snow depth data are available at http://climate.weather.gc.ca (accessed on 9 April 2021). The freshwater level records are available at http://wateroffice.ec.gc.ca (accessed on 9 April 2021). The hourly tide records are available at https://tides.gc.ca (accessed on 9 April 2021).

Acknowledgments

The research was partly carried out at the Jet Propulsion Laboratory (JPL), California Institute of Technology (Caltech), under a contract (80NM0018D0004) with the National Aeronautics and Space Administration (NASA). Sentinel-1 data were provided by the European Space Agency (ESA), and drift sea ice daily motion data were provided by the U.S. National Snow and Ice Data Center (NSDIC). Air temperature, snow depth, tide, and freshwater discharge and level records were provided by the Environment and Climate Change Canada (ECCC) and Fisheries and Oceans Canada (DFO).

Conflicts of Interest

The authors declare no conflict of interest.

References

  1. Kwok, R. Arctic sea ice thickness, volume, and multiyear ice coverage: Losses and coupled variability (1958–2018). Environ. Res. Lett. 2018, 13, 105005. [Google Scholar] [CrossRef]
  2. Lang, A.; Yang, S.; Kaas, E. Sea ice thickness and recent Arctic warming. Geophys. Res. Lett. 2017, 44, 409–418. [Google Scholar] [CrossRef]
  3. Parkinson, C.L.; DiGirolamo, N.E. New visualizations highlight new information on the contrasting Arctic and Antarctic sea-ice trends since the late 1970s. Remote Sens. Environ. 2016, 183, 198–204. [Google Scholar] [CrossRef] [Green Version]
  4. Simmonds, I. Comparing and contrasting the behaviour of Arctic and Antarctic sea ice over the 35 year period 1979–2013. Ann. Glaciol. 2015, 56, 18–28. [Google Scholar] [CrossRef] [Green Version]
  5. Parkinson, C.L. Spatially mapped reductions in the length of the Arctic sea ice season. Geophys. Res. Lett. 2014, 41, 4316–4322. [Google Scholar] [CrossRef] [Green Version]
  6. Dammann, D.O.; Eriksson, L.E.B.; Mahoney, A.R.; Eicken, H.; Meyer, F.J. Mapping pan-Arctic landfast sea ice stability using Sentinel-1 interferometry. Cryosphere 2019, 13, 557–577. [Google Scholar] [CrossRef] [Green Version]
  7. Yu, Y.; Stern, H.; Fowler, C.; Fetterer, F.; Maslanik, J. Interannual variability of arctic landfast ice between 1976 and 2007. J. Clim. 2014, 27, 227–243. [Google Scholar] [CrossRef]
  8. Howell, S.E.L.; Laliberté, F.; Kwok, R.; Derksen, C.; King, J. Landfast ice thickness in the Canadian Arctic Archipelago from observations and models. Cryosphere 2016, 10, 1463–1475. [Google Scholar] [CrossRef] [Green Version]
  9. Eicken, H.; Gradinger, R.; Gaylord, A.; Mahoney, A.; Rigor, I.; Melling, H. Sediment transport by sea ice in the Chukchi and Beaufort Seas: Increasing importance due to changing ice conditions? Deep Sea Res. Part II Top. Stud. Oceanogr. 2005, 52, 3281–3302. [Google Scholar] [CrossRef]
  10. Itkin, P.; Losch, M.; Gerdes, R. Landfast ice affects the stability of the Arctic halocline: Evidence from a numerical model. J. Geophys. Res. Ocean. 2015, 120, 2622–2635. [Google Scholar] [CrossRef] [Green Version]
  11. Lovvorn, J.R.; Rocha, A.R.; Mahoney, A.H.; Jewett, S.C. Sustaining ecological and subsistence functions in conservation areas: Eider habitat and access by Native hunters along landfast ice. Environ. Conserv. 2018, 45, 361–369. [Google Scholar] [CrossRef]
  12. Laidler, G.J.; Ford, J.D.; Gough, W.A.; Ikummaq, T.; Gagnon, A.S.; Kowal, S.; Qrunnut, K.; Irngaut, C. Travelling and hunting in a changing Arctic: Assessing Inuit vulnerability to sea ice change in Igloolik, Nunavut. Clim. Chang. 2009, 94, 363–397. [Google Scholar] [CrossRef]
  13. Masterson, D.M. State of the art of ice bearing capacity and ice construction. Cold Reg. Sci. Technol. 2009, 58, 99–112. [Google Scholar] [CrossRef]
  14. Burn, C.R.; Kokelj, S.V. The environment and permafrost of the Mackenzie Delta area. Permafr. Periglac. Process. 2009, 20, 83–105. [Google Scholar] [CrossRef]
  15. Emmerton, C.A.; Lesack, L.F.W.; Marsh, P. Lake abundance, potential water storage, and habitat distribution in the Mackenzie River Delta, western Canadian Arctic. Water Resour. Res. 2007, 43, 159–180. [Google Scholar] [CrossRef]
  16. Yue, B.; Chamberland, J.; Mulvie, J. Bottom-fast ice delineation with PolSAR and InSAR techniques in the Mackenzie Delta region, Northwest Territories, Canada. Can. J. Remote Sens. 2013, 39, 341–353. [Google Scholar] [CrossRef]
  17. Nghiem, S.V.; Hall, D.K.; Rigor, I.G.; Li, P.; Neumann, G. Effects of Mackenzie River discharge and bathymetry on sea ice in the Beaufort Sea. Geophys. Res. Lett. 2014, 41, 873–879. [Google Scholar] [CrossRef] [Green Version]
  18. Zhang, J.; Lindsay, R.; Schweiger, A.; Steele, M. The impact of an intense summer cyclone on 2012 Arctic sea ice retreat. Geophys. Res. Lett. 2013, 40, 720–726. [Google Scholar] [CrossRef]
  19. Onstott, R.G. SAR and Scatterometer Signatures of Sea Ice. In Microwave Remote Sensing of Sea Ice; American Geophysical Union: Washington, DC, USA, 2011; pp. 73–104. [Google Scholar]
  20. Lyden, J.D.; Burns, B.A.; Maffett, A.L. Characterization of sea ice types using synthetic aperture radar. IEEE Trans. Geosci. Remote Sens. 1984, GE-22, 431–439. [Google Scholar] [CrossRef]
  21. Nghiem, S.V.; Leshkevich, G.A. Satellite SAR remote sensing of Great Lakes ice cover, part 1. Ice backscatter signatures at C band. J. Great Lakes Res. 2007, 33, 722–735. [Google Scholar] [CrossRef]
  22. Wakabayashi, H.; Matsuoka, T.; Nakamura, K.; Nishio, F. Polarimetric characteristics of sea ice in the sea of Okhotsk observed by airborne L-band SAR. IEEE Trans. Geosci. Remote Sens. 2004, 42, 2412–2425. [Google Scholar] [CrossRef]
  23. Hallikainen, M.; Winebrenner, D.P. The Physical Basis for Sea Ice Remote Sensing. In Microwave Remote Sensing of Sea Ice; American Geophysical Union: Washington, DC, USA, 1992; pp. 29–46. [Google Scholar]
  24. Macdonald, R.W.; Paten, D.W.; Carmack, E.C. The freshwater budget and under-ice spreading of Mackenzie River water in the Canadian Beaufort Sea based on salinity and 18O/16O measurements in water and ice. J. Geophys. Res. 1995, 100, 895–919. [Google Scholar] [CrossRef]
  25. Eicken, H.; Dmitrenko, I.; Tyshko, K.; Darovskikh, A.; Dierking, W.; Blahak, U.; Groves, J.; Kassens, H. Zonation of the Laptev Sea landfast ice cover and its importance in a frozen estuary. Glob. Planet. Chang. 2005, 48, 55–83. [Google Scholar] [CrossRef]
  26. Stevens, C.W. Controls on Seasonal Ground Freezing and Permafrost in the Near-Shore Zone of the Mackenzie Delta, NWT, Canada. Ph.D. Thesis, University of Calgary, Calgary, AB, Canada, 2011. [Google Scholar]
  27. Rignot, E.; Echelmeyer, K.; Krabill, W. Penetration depth of interferometric synthetic-aperture radar signals in snow and ice. Geophys. Res. Lett. 2001, 28, 3501–3504. [Google Scholar] [CrossRef] [Green Version]
  28. Dammann, D.O.; Eriksson, L.E.B.; Mahoney, A.R.; Stevens, C.W.; van der Sanden, J.; Eicken, H.; Meyer, F.J.; Tweedie, C.E. Mapping Arctic bottomfast sea ice using SAR interferometry. Remote Sens. 2018, 10, 720. [Google Scholar] [CrossRef] [Green Version]
  29. Goldstein, R.M.; Engelhardt, H.; Kamb, B.; Frolich, R.M. Satellite radar interferometry for monitoring ice sheet motion: Application to an Antarctic ice stream. Science 1993, 262, 1525–1530. [Google Scholar] [CrossRef] [PubMed]
  30. Rignot, E.; Jezek, K.C.; Sohn, H.G. Ice flow dynamics of the Greenland Ice Sheet from SAR interferometry. Geophys. Res. Lett. 1995, 22, 575–578. [Google Scholar] [CrossRef] [Green Version]
  31. Rignot, E.; Mouginot, J.; Scheuchl, B. Ice flow of the antarctic ice sheet. Science 2011, 333, 1427–1430. [Google Scholar] [CrossRef] [Green Version]
  32. Vincent, F.; Raucoules, D.; Degroeve, T.; Edwards, G.; Abolfazl Mostafavi, M. Detection of river/sea ice deformation using satellite interferometry: Limits and potential. Int. J. Remote Sens. 2004, 25, 3555–3571. [Google Scholar] [CrossRef]
  33. Stevens, C.W.; Moorman, B.J.; Solomon, S.M.; Hugenholtz, C.H. Mapping subsurface conditions within the near-shore zone of an Arctic delta using ground penetrating radar. Cold Reg. Sci. Technol. 2009, 56, 30–38. [Google Scholar] [CrossRef]
  34. Hirose, T.; Kapfer, M.; Bennett, J.; Cott, P.; Manson, G.; Solomon, S. Bottomfast ice mapping and the measurement of ice thickness on tundra lakes using C-band synthetic aperture radar remote sensing. J. Am. Water Resour. Assoc. 2008, 44, 285–292. [Google Scholar] [CrossRef]
  35. Jeffries, M.O.; Morris, K.; Liston, G.E. A method to determine lake depth and water availability on the north slope of Alaska with spaceborne imaging radar and numerical ice growth modelling. Arctic 1996, 49, 367–374. [Google Scholar] [CrossRef] [Green Version]
  36. Strozzi, T.; Luckman, A.; Murray, T.; Wegmüller, U.; Werner, C.L. Glacier motion estimation using SAR offset-tracking procedures. IEEE Trans. Geosci. Remote Sens. 2002, 40, 2384–2391. [Google Scholar] [CrossRef] [Green Version]
  37. Joughin, I. Ice-sheet velocity mapping: A combined interferometric and speckle-tracking approach. Ann. Glaciol. 2002, 34, 195–201. [Google Scholar] [CrossRef] [Green Version]
  38. Sánchez-Gámez, P.; Navarro, F.J. Glacier surface velocity retrieval using D-InSAR and offset tracking techniques applied to ascending and descending passes of sentinel-1 data for southern ellesmere ice caps, Canadian Arctic. Remote Sens. 2017, 9, 442. [Google Scholar] [CrossRef] [Green Version]
  39. Van Wychen, W.; Copland, L.; Jiskoot, H.; Gray, L.; Sharp, M.; Burgess, D. Surface Velocities of Glaciers in Western Canada from Speckle-Tracking of ALOS PALSAR and RADARSAT-2 data. Can. J. Remote Sens. 2018, 44, 57–66. [Google Scholar] [CrossRef]
  40. Singleton, A.; Li, Z.; Hoey, T.; Muller, J.P. Evaluating sub-pixel offset techniques as an alternative to D-InSAR for monitoring episodic landslide movements in vegetated terrain. Remote Sens. Environ. 2014, 147, 133–144. [Google Scholar] [CrossRef] [Green Version]
  41. Wang, C.; Mao, X.; Wang, Q. Landslide displacement monitoring by a fully polarimetric SAR offset tracking method. Remote Sens. 2016, 8, 624. [Google Scholar] [CrossRef] [Green Version]
  42. Gray, L. Using multiple RADARSAT InSAR pairs to estimate a full three-dimensional solution for glacial ice movement. Geophys. Res. Lett. 2011, 38, 1–6. [Google Scholar] [CrossRef]
  43. Fialko, Y.; Simons, M.; Agnew, D. The complete (3-D) surface displacement field in the epicentral area of the 1999 M W 7.1 Hector Mine Earthquake, California, from space geodetic observations. Geophys. Res. Lett. 2001, 28, 3063–3066. [Google Scholar] [CrossRef] [Green Version]
  44. Samsonov, S.; Dille, A.; Dewitte, O.; Kervyn, F.; d’Oreye, N. Satellite interferometry for mapping surface deformation time series in one, two and three dimensions: A new method illustrated on a slow-moving landslide. Eng. Geol. 2020, 266, 105471. [Google Scholar] [CrossRef]
  45. Torres, R.; Snoeij, P.; Geudtner, D.; Bibby, D.; Davidson, M.; Attema, E.; Potin, P.; Rommen, B.Ö.; Floury, N.; Brown, M.; et al. GMES Sentinel-1 mission. Remote Sens. Environ. 2012, 120, 9–24. [Google Scholar] [CrossRef]
  46. Jiang, M.; Li, Z.W.; Ding, X.L.; Zhu, J.J.; Feng, G.C. Modeling minimum and maximum detectable deformation gradients of interferometric SAR measurements. Int. J. Appl. Earth Obs. Geoinf. 2011, 13, 766–777. [Google Scholar] [CrossRef]
  47. Werner, C.; Wegmüller, U.; Strozzi, T.; Wiesmann, A. GAMMA SAR and interferometric processing software. In Proceedings of the 3rd ERS-ENVISAT Symposium, Gothenburg, Sweden, 16–20 October 2000. [Google Scholar]
  48. Samsonov, S.V.; d’Oreye, N. Multidimensional Small Baseline Subset (MSBAS) for Two-Dimensional Deformation Analysis: Case Study Mexico City. Can. J. Remote Sens. 2017, 43, 318–329. [Google Scholar] [CrossRef]
  49. Solomon, S.M.; Fraser, P.; Manson, G.K. Nearshore morphology derived from synthetic aperture radar in the Mackenzie Delta region of the Beaufort Sea. In Proceedings of the 12th Canadian Coastal Conference, Dartmouth, NS, Canada, 6–9 November 2005. [Google Scholar]
  50. Lebedev, V.V. Rost l’do v arkticheskikh rekakh i moriakh v zavisimosti ot otritsatel’ nykh temperatur vozdukha. Probl. Arktiki 1938, 5, 9–25. [Google Scholar]
  51. King, J.; Spreen, G.; Gerland, S.; Haas, C.; Hendricks, S.; Kaleschke, L.; Wang, C. Sea-ice thickness from field measurements in the northwestern Barents Sea. J. Geophys. Res. Ocean. 2017, 122, 1497–1512. [Google Scholar] [CrossRef] [Green Version]
  52. Murfitt, J.C.; Brown, L.C.; Howell, S.E.L. Estimating lake ice thickness in Central Ontario. PLoS ONE 2018, 13, e0208519. [Google Scholar] [CrossRef] [Green Version]
  53. Jeffries, M.O.; Morris, K.; Weeks, W.F. Structural and stratigraphie features and ERS 1 synthetic aperture radar backscatter characteristics of ice growing on shallow lakes in NW Alaska, winter 1991–1992. J. Geophys. Res. Ocean. 1994, 99, 22459–22471. [Google Scholar] [CrossRef]
  54. Gunn, G.E.; Duguay, C.R.; Atwood, D.K.; King, J.; Toose, P. Observing Scattering Mechanisms of Bubbled Freshwater Lake Ice Using Polarimetric RADARSAT-2 (C-Band) and UW-Scat (X- and Ku-Bands). IEEE Trans. Geosci. Remote Sens. 2018, 56, 2887–2903. [Google Scholar] [CrossRef]
  55. Lewis, B.J.; Hutchings, J.K. Leads and Associated Sea Ice Drift in the Beaufort Sea in Winter. J. Geophys. Res. Ocean. 2019, 124, 3411–3427. [Google Scholar] [CrossRef]
  56. Spedding, L.G. Landfast ice motion observed in the Mackenzie Delta region of the southern Beaufort Sea in the 1972/1973 winter. Coast. Eng. 1981, 5, 193–209. [Google Scholar] [CrossRef]
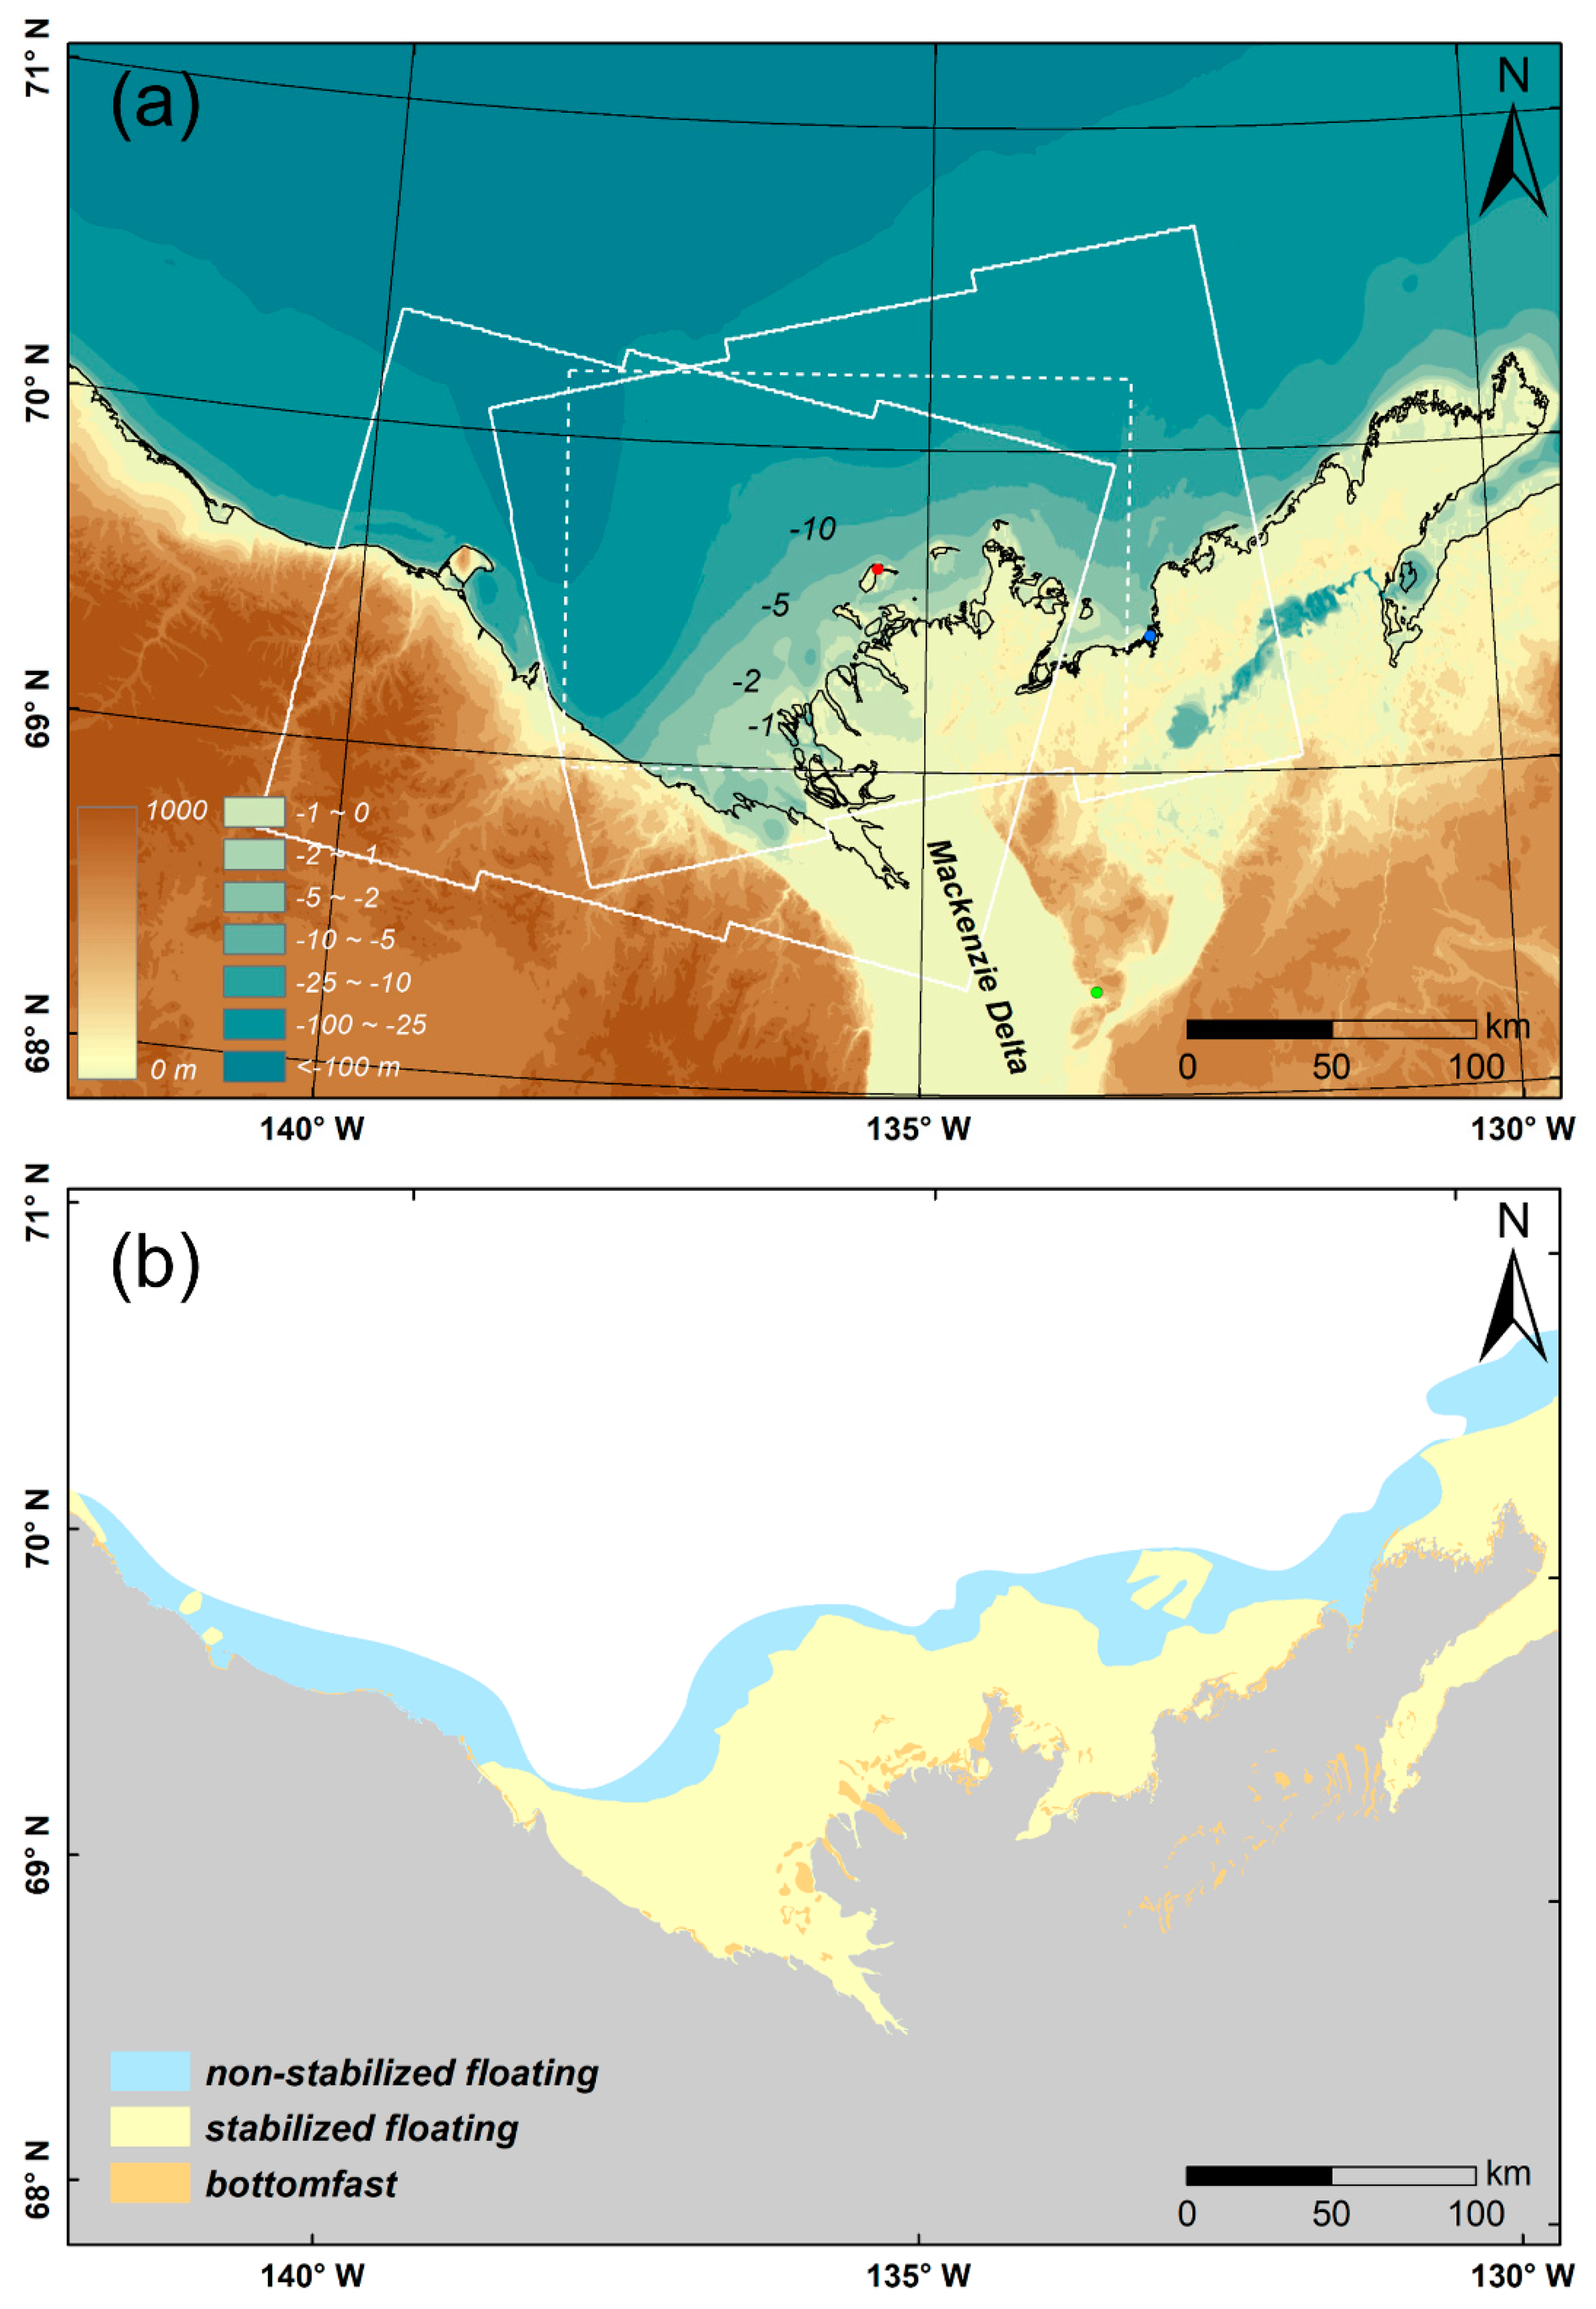
Figure 1. Digital elevation model of the Mackenzie Delta (a) and InSAR-derived landfast ice map modified from Dammann et al. (2019) (b, Land is masked out in grey). The solid white lines are Sentinel-1 ascending and descending coverages used in this study. The dashed white rectangle represents the coverage of Sentinel-1 and Landsat 8 subsets in Figures 3 and 4. The red, green, and blue dots mark the Pelly Island, Inuvik, and Tuktoyaktuk stations, respectively. The DEM was modified from the coastal digital elevation model global mosaic provided by National Oceanic and Atmospheric Administration (NOAA)/National Centers for Environmental Information (NCEI). The 3D SPO in Figure 5 was performed for the overlapped part of ascending and descending coverages.
Remotesensing 13 02168 g001
Figure 2. Landsat 8 and Sentinel-1 observations of landfast ice in the Mackenzie Delta. (a) Landsat 8 true color composite of 20170313 (yyyymmdd). (b) Landsat 8 true color composite of 20170329 showing open water leads after a breakup. (c) SAR intensity image of 20170319. (d) SAR intensity image of 20170331. (e) SAR interferogram of 20170319–20170331 overlaid on the intensity image of 20170319. (f) Unwrapped phase showing discontinuities (black arrows) of 20170319–20170331. The SAR intensity images were linearly stretched between −25 and −5 dB. The orange arrows represent bottomfast ice. The green, light yellow, and light blue dashed lines with double arrows represent the ranges of inner stabilized floating ice, outer stabilized floating ice, and non-stabilized floating saline ice, respectively. The coastline is shown in yellow (c,d) and black (e,f).
Remotesensing 13 02168 g002
Figure 10. Local daily freshwater level (a, from the Mackenzie River Reindeer channel (10MC011) located at 69°01′ N, 135°30′ W) and seawater level (b, from the Tutoyaktuk station located at 69.44° N, 132.99° W). The seawater level was calculated by averaging the hourly water levels at ascending and descending acquisition times.
Remotesensing 13 02168 g010
Table 1. Sentinel-1 SAR datasets for 2017–2018 and 2018–2019 annual cycles 1.
2017–2018 DatasetBT (days)2018–2019 DatasetBT (days)
20171126–20180113
20180113–20180125
20180125–20180206
20180206–20180302
20180302–20180314
20180314–20180326
20180326–20180407
48
12
12
24
12
12
12
20181028–20181203
20181203–20190108
20190108–20190120
20190120–20190201
20190201–20190225
20190225–20190309
20190309–20190321
20190321–20190402
20190402–20190414
20190414–20190426
20190426–20190508
36
36
12
12
24
12
12
12
12
12
12
1BT: temporal baseline.
Publisher’s Note: MDPI stays neutral with regard to jurisdictional claims in published maps and institutional affiliations.