Article

Monitoring Lakes Surface Water Velocity with SAR: A Feasibility Study on Lake Garda, Italy

by
Marina Amadori
1,2,†,
Virginia Zamparelli
3,†,
Giacomo De Carolis
1,
Gianfranco Fornaro
3,
Marco Toffolon
2,
Mariano Bresciani
1,
Claudia Giardino
1 and
Francesca De Santi
1,*
1
IREA-CNR, Institute for Electromagnetic Sensing of the Environment-National Research Council of Italy, 20133 Milan, Italy
2
Department of Civil, Environmental and Mechanical Engineering, University of Trento, 38123 Trento, Italy
3
IREA-CNR, Institute for Electromagnetic Sensing of the Environment-National Research Council of Italy, 80128 Naples, Italy
*
Author to whom correspondence should be addressed.
These authors equally contributed to this work.
Remote Sens. 2021, 13(12), 2293; https://doi.org/10.3390/rs13122293
Submission received: 30 March 2021 / Revised: 17 May 2021 / Accepted: 7 June 2021 / Published: 11 June 2021
(This article belongs to the Special Issue Remote Sensing of the Aquatic Environments)

Abstract

:
The SAR Doppler frequencies are directly related to the motion of the scatterers in the illuminated area and have already been used in marine applications to monitor moving water surfaces. Here we investigate the possibility of retrieving surface water velocity from SAR Doppler analysis in medium-size lakes. ENVISAT images of the test site (Lake Garda) are processed and the Doppler Centroid Anomaly technique is adopted. The resulting surface velocity maps are compared with the outputs of a hydrodynamic model specifically validated for the case study. Thermal images from MODIS Terra are used in support of the modeling results. The surface velocity retrieved from SAR is found to overestimate the numerical results and the existence of a bias is investigated. In marine applications, such bias is traditionally removed through Geophysical Model Functions (GMFs) by ascribing it to a fully developed wind waves spectrum. We found that such an assumption is not supported in our case study, due to the small-scale variations of topography and wind. The role of wind intensity and duration on the results from SAR is evaluated, and the inclusion of lake bathymetry and the SAR backscatter gradient is recommended for the future development of GMFs suitable for lake environments.

Graphical Abstract

1. Introduction

Microwave methodologies based on the use of Synthetic Aperture Radar (SAR) sensors have been widely developed for many Earth surface monitoring applications. In the last decade, images acquired by SAR have been increasingly exploited by the scientific community for deformation surveys [1] even at single facilities scale, that is, buildings and infrastructures [2]. More recently, increasing attention has been paid to the observation of sea surface, complementing the traditional use of optical or multispectral images.
Differently from optical sensors, SAR allows the obtaining of all weather and day–night 2D images of the illuminated area of the Earth’s surface [3]. SAR remote sensing for ocean, seas and coastal applications mostly exploits the amplitude of the backscattered signal for, for example, monitoring oil-spills [4] and sea-ice [5], ship detection [6] and high-resolution wind fields retrieval [7]. However, SAR uses coherent radiation and the complementary information carried in the phase of the received complex signal can be also exploited. An example from land applications is the use of the complex information from a single SAR image to reconstruct infrastructures micro-motion [8]. By analysing the complex backscattered (received) signal, it is possible to measure the Doppler properties of the scatterers. The latter are directly related to the motion of the scatterers along the radar line of sight (LOS) in both land [9] and marine [10] contexts. In ocean applications, these properties are currently used to retrieve near surface wind speed [11] and surface current [12].
Several factors contribute to the measured Doppler frequency, such as the bulk surface current, the wind waves and the wave–current interactions at different scales [13]. The drift current induced by the wind on the sea surface (wind drift) and the sea state (more precisely the high-frequency waves) depend on the near-surface wind field. In this regard, [14] performed a global ocean analysis and and found that an increase of the wind speed (projected along the LOS) corresponds to a first-order increase of the Doppler anomaly. Such a wind-wave bias is empirically estimated and removed to retrieve the radial component of the bulk surface current. To this end, empirical Geophysical Model Functions (GMF) have been determined [12].
This analysis is going toward a consolidated state for oceanic applications, such that surface velocity maps in open waters are distributed by the European Space Agency (ESA) among the second level products of Sentinel 1 [15]. On the contrary, the extension of a similar approach to coastal zones is more delicate. At least two main assumptions of the analysis of the Doppler Centroid Anomaly (DCA) in the open ocean do not hold for coastal areas: (i) uniform surface flow field and (ii) fully developed wind-waves. In the near-shore areas, small- scale variations of topography and wind can cause higher variability in the currents and the waves to develop in fetch-limited condition.Thus, the application to other contexts of the above mentioned methods for the removal of the wind waves bias may not be straightforward as in the open ocean case, although examples along this line are given in the recent literature [10,13,14,16,17,18,19]. At the smaller spatial scale of enclosed basins (e.g., lakes), no studies have yet explored the possibility of inferring surface currents from SAR Doppler frequencies.
More generally, SAR images of lakes have been seldom exploited for several reasons, among which the minor intensity of hydrodynamic processes (e.g., smaller wave heights and currents than in open seas and oceans) and the effect of surrounding topography (e.g., foreshortening and layover effect [20]).
Currently, SAR applications for lakes are limited to the analysis of the backscattered signal amplitude. SAR amplitude images have been used in support of optical or thermal imagery for identifying and mapping inland waters surface features, for example, ice [21] and cyanobacteria blooms [22,23]. A few tests also showed the potentialities of using SAR images for retrieving the size of surface eddies in large lakes [24] and spatially distributed information on wind intensity [25].
The SAR Doppler analysis could represent a useful way to retrieve surface velocity in lakes and would compensate for the lack of synoptic measurements of the key physical quantities determining lake hydrodynamics. Indeed, while the use of remote sensing products is well consolidated to infer lake surface water temperature (LSWT) [26], water velocity, as well as all wind velocity, is traditionally monitored with in-situ point measurements. In most cases, traditional instrumentation requires direct access to the lake, with strong operational limitations, and provide data at single locations. Remote sensing techniques provide instead synoptic coverage, fine spatial detail and repeated regular sampling.
Periodic snapshots of lake surface currents, at the present day, cannot be achieved alternatively than with remote sensing instruments, for example, airborne or space, the latter being traditionally exploited in marine applications [27,28,29]. Few attempts towards the reconstruction of the surface transport from thermal infrared imagery [30] showed encouraging results in this direction, but such approach requires high temporal resolution, which is not always guaranteed. Moreover, the use of thermal infrared remote sensing is hindered by cloud cover. In this regard, the use of SAR images combined with the DCA technique could overcome the technical issues typically encountered for reconstructing the surface flow field in lakes, asides from being rather innovative.
This study aims to investigate the feasibility of extracting the surface velocity from DCA in lakes by considering as test case Lake Garda, a large and deep lake in northern Italy. The test case is a clear oligotrophic lake, thus allowing for neglecting turbidity and algal blooms which might affect the SAR signal.
We analyze and process images acquired by the ENVISAT C-Band sensor. Results are compared with the outputs of a three-dimensional (3D) numerical model validated for Lake Garda [31]. Water surface temperature products from the MODIS (Moderate Resolution Imaging Spectroradiometer) Terra sensor are also considered to further validate the simulation results. The numerical results are used to interpret the SAR retrieved signal and to evaluate the different factors influencing the Doppler shift analysis in the case study. Based on this, we draw some guidelines on the variables to be considered for a future definition of GMFs for lakes.

2. Materials and Methods

In this section we describe the test site (Section 2.1), the sensors and datasets for SAR and thermal infrared images (Section 2.2), the procedure for the analysis of the DCA (Section 2.3) and the adopted numerical models (Section 2.4).

2.1. Case Study

Lake Garda (Figure 1a) is one of the large European perialpine lakes and is the largest lake in Italy by surface extension and volume. It covers an area of 370 km 2 , with a water volume of 50 km 3 and a maximum depth of 346 m. The lake represents an essential water supply for many sectors of the local economy (e.g., agriculture, industry, fishing and drinking [32]). Thanks to its attractive landscape, mild climate and water quality, Lake Garda is also an important resource for recreation and tourism.
The lake has a heterogeneous bathymetry (Figure 1a). A narrow (average width 4 km) and deep (maximum depth 346 m) northern trunk, enclosed between steep mountains, is connected to a southern large (maximum width 18 km) and shallower (average depth 65 m) basin, which is characterized by more gentle slopes and lies in a flat plain.
The typical winds in Lake Garda are thermal breezes [33]. In the northern region, the most frequent provenance direction of high speed winds is along the longitudinal axis of the lake, where winds are channeled by the steep lateral mountains (see the orography in Figure 1a). During summer, northerly and southerly breezes alternate in the night/morning and in the afternoon/evening, respectively [34]. Such breezes are characterized by moderate to high velocities (≈5–10 m/s), alternating directions and not necessarily uniform spatial distribution. During winter and mid-seasons, winds are usually weaker. However, it is not uncommon for this lake to be subject to long-lasting storm winds at a synoptic scale, for example, Föhn winds. These winds frequently come from North-East, have almost uniform spatial distribution on the lake surface, reach speeds of more than 10 m/s and often last for more than one day [35].

2.2. Sensor and Dataset

In the last years, there has been a consistent proliferation of SAR systems with different technical characteristics, that is, resolution, operational frequencies and revisiting time [36]. Among them we selected the ENVISAT, following the experience gained in marine environment with C-Band sensors for the estimation of the surface current velocity. In this work, we adopt a methodology validated in the coastal area of the Gulf of Naples [16,27,37] and the Gulf of Trieste [38]. ASAR ENVISAT operated in C Band (wavelength λ equal to 5.6 cm), in multiple polarization mode (HH/VV,HH/HV,VV/VH). In stripmap mode it covered up to 100 km with a single swath. The spatial resolution of the sensor’s Single Look Complex (SLC) product is 5 m in azimuth and 20 m ground range (see Figure 1b for SAR acquisition geometry). A considerable archive of data exists from the ENVISAT operative period, that is, from 2002 to 2012, on ascending and descending orbits. Within the broad landscape of SAR sensors currently available, data acquired by Sentinel 1 (S1) could also be exploited. S1 operates in C-Band and regularly provides very wide swaths of about 250 km by using the TOPSAR (Terrain Observation with Progressive Scans SAR) operation mode. However, due to the steering of the antenna along the azimuth, this operation mode complicates the estimation of the Doppler Centroid. The presence of discontinuities in the estimated Doppler Anomaly, which in turn affects the retrieved radial velocity, has been already observed [39]. Based on these considerations and on the experience we gained in marine environments, ENVISAT data were chosen for this exploratory study on Lake Garda. The ENVISAT archive was screened to eliminate images characterized by very low backscattering coefficients. We selected six images showing amplitude patterns, that is, sufficiently intense and spatially varying backscattering, potentially associated with interesting hydrodynamic features and fulfilling the wind criteria specified in detail in Section 3.2. The selected images are acquired over ascending orbit, corresponding to evening acquisitions (around 21:00 UTC), and span from 2008 to 2010 in summer, autumn and winter seasons. The choice of ascending acquisitions is due to the favourable acquisition geometry related to the orientation of the lake. In fact, the ground projection of the ascending sensor LOS is more aligned with the longitudinal axis of the lake than the descending one. We note that the longitudinal axis of the lake is expected to be the main direction of lake currents and waves propagation, as it also corresponds with the typical direction of winds (see Section 2.1). The images have been classified based on the wind velocity registered at the acquisition time. In Table 1 the selected dates are listed and their simulated geophysical characteristics are summarized. For a more detailed description of the investigated dates, we refer to Section 3.2.
For the selected dates, thermal images from MODIS were also analyzed to validate the simulations. In particular, we preferred nighttime Level 2 MODIS Terra Sea Surface Temperature (SST) products, because they are closer in time to SAR acquisitions. MODIS images are cloud free for four out of six investigated dates. The four dates are indicated with an asterisk in Table 1.

2.3. SAR Doppler Centroid Anomaly Estimation

For the retrieval of information about the ocean surface velocity from SAR data, two methodologies have been developed: the Along-Track Interferometry (ATI) [18] and the DCA method [14]. Here we exploit the technique of the DCA, which was successfully applied in open oceans [14,40,41] and ocean coastal areas [14,18,42]. The same approach was also adopted for the estimation of water currents in the Mediterranean sea, a semi-enclosed sea, where they show a smaller range of intensity, [16,27,38]. The DCA technique estimates the surface velocity of the illuminated area by measuring the variation that such a velocity produces in the spectrum of the SAR image [14]. The principle is rather well known: let us consider a SAR system acquiring data on a scene where a target is in relative motion with respect to the sensor. When the transmitted radiation hits the target, it is backscattered toward the radar along the antenna pointing direction, also called Line of Sight (LOS) or radial direction (see Figure 1b). If the velocity associated with the motion has a non-zero component along the radial direction ( v r ), this component determines a shift in the azimuth spectrum of the received signal. Such a shift is called Doppler Centroid frequency f D C and is proportional to the radial component of the velocity associated to the relative motion between target and sensor.
Some remarks on the formation of the Doppler shift, which is influenced by the target and sensor motion along the LOS direction, are in order. First of all, the radial direction is influenced by the platform attitude as well as by possible electronic steering introduced to point the beam in a direction different from the broadside one (squinted acquisition). Secondly, the measurement of f D C from the power spectral density allows the estimation of the radial component of the (relative) target motion [43,44]. For each pixel, say with azimuth x and slant range r, f D C ( x , r ) can be considered the sum of two contributions: the Doppler Centroid f D C 0 ( x , r ) and Doppler Centroid Anomaly f D C A ( x , r ) . The first one ( f D C 0 ) corresponds to a stationary scene and is referred to as “background DC”, due to a scene in which all the scatterers move at the same velocity (background motion). The second one ( f D C A ) is the Doppler component associated with the target motion with respect to the background one.
From what is stated above, it follows that for the satellite case the background DC, f D C 0 ( x , r ) , is contributed by both the platform movement and the Earth rotation, in a way that depends on the platform attitude and beam orientation. This term is generally a slow varying function along the space, typically well approximated by a polynomial in r. It is worth noting that, strictly speaking, ionospheric variations could also impact f D C 0 ( x , r ) : this phenomenon is, however, more relevant for low frequency systems, for example, L- and P-Band SAR sensors [45]. The latter are usually not exploited for water surface velocity retrieval, due to the reduced sensitivity associated with the increase of the wavelength.
As for ASAR-Envisat, the term f D C 0 ( x , r ) can be retrieved from the ancillary data through annotated polynomial coefficients, which are computed knowing the platform attitude, the antenna pointing and the scene latitude. Previous experiences carried out with other platforms showed that this information is frequently not sufficiently accurate, especially for the range variation. This fact might be due to inaccurate attitude information, to unexpected beam bending as well as to other spurious effects. Following the strategy adopted in [16] for marine applications, we estimated f D C 0 ( x , r ) directly from the data via a polynomial Least Square fitting along r. More details on the estimation of the background Doppler component associated with the stationary scene are given in [16]. In the same work it is also shown how to handle unwanted azimuth oscillating components, frequently observed for ASAR-ENVISAT acquisitions and evidently not associated with any geophysical process.
The velocity at which the target proceeds toward or away from the radar, with respect to the background scene motion, can be thus obtained by removing from the measured Doppler Centroid its component associated to the stationary scene, as follows:
v r ( x , r ) = λ 2 [ f D C ( x , r ) f D C 0 ( x , r ) ] = λ 2 f D C A ( x , r ) ,
where λ is the sensor wavelength. The scatters’ surface velocity along the ground range direction v gr can be finally obtained from v r by considering that the latter is its projection along the LOS (see also Figure 1b):
v gr = v r sin θ ,
where θ is the incidence angle.
In order to retrieve the actual lake ground range surface velocity, any possible spurious effect, such as the wind-wave bias [12], must be precisely identified, estimated and removed from v gr . Thus, v gr represents a raw variable to be processed with an appropriate GMF to obtain the ground range surface velocity, hereinafter surface velocity. The identification of the spurious effects on v gr is the goal of this study, where no GMFs are used, and it is performed with the help of the numerical model.
In Figure 2a, we summarize the procedure for the generation of v gr maps. After the SAR focusing operation on the raw data, the measurement of f D C is performed pixel by pixel by estimating the azimuth self-correlation function along the azimuth direction [43]. The Doppler spectrum is evaluated on patches, hereafter referred to as Doppler Resolution Cell (DRC), sliding along the whole SAR image. The DRC has been chosen to guarantee a good balance between spatial and spectral resolutions. In particular, we considered patches of width 512 azimuth by 128 range pixels, corresponding to a DRC of 2.5 km × 2.5 km. In this condition the spectral resolution is 2.85 Hz, which corresponds to a velocity resolution of 7.98 cm/s for v r .The Doppler Centroid estimation accuracy can be estimated through the calibration of the radial velocity over the land area (i.e masking out Lake Garda). For all the acquisitions here analyzed (see Table 1) v r has zero mean and a standard deviation ranging from 27 cm/s to 30 cm/s. Note that these values account for the variability of the residual signal all over the scene with the lake only covering a small portion.
Subsequently, the compensation of the stationary component of the Centroid is performed and the final DCA is estimated (Equation (1) and then v gr from Equation (2)). The DCA map is converted to surface velocity and geocoded through a SRTM DEM on a geographical grid with a spacing of about 92.7 m N and 64.9 m E [46]. At this stage, the geocoded surface velocity map is comparable with geo-referred simulations results and MODIS products.
The output product is supplemented by the basckscattering information. A standard calibration procedure is applied to the focused amplitude data to get the normalised measure of the radar cross-section per unit area on the ground, that is, the backscatter coefficient σ 0 . A multi-look algorithm is then applied to reduce the noise (or “speckle”) of SAR images by averaging adjacent pixels. The resulting σ 0 with resolution 100 m × 100 m is finally geo-referred (Figure 1c).

2.4. Numerical Modeling

For simulating the flow field, we use a modeling chain (Figure 2b) composed by three numerical models: an atmospheric, a hydrodynamic and a wave model. In this work, we start from the outputs of an existing model for the case study [35,47] in the configuration presented in [31], which consists of the hydrodynamic model Delft3D [48] fed by the results of the Weather Research and Forecasting (WRF) atmospheric model [48].
The WRF model provides the atmospheric variables as time and space varying fields of wind velocity, air pressure, temperature and relative humidity, incoming shortwave radiation and cloudiness at the lake surface. The resolution of the simulated weather forcing is 2 km in space and 1 h in time.
From the WRF outputs, the hydrodynamic model Delft3D computes the heat fluxes between air and water and wind stress at the lake surface, which are necessary for simulating the flow field, turbulence, heat and mass transport within the lake. The nominal horizontal resolution of the hydrodynamic model is ≈100 m, with smaller cells in the northern and larger cells in the southern part. The vertical layers are 1 m thick near the surface (over the upper 40 m) and smoothly increase their thickness up to 25 m at the deepest point. The outputs of the described model are available over the period 2004–2018 and will be henceforth referred to as “long-run data”. The long-run data are saved on a daily basis at 10:00 UTC.
For the present work, the available long-run data were used to restart ad hoc simulations of the selected dates (Table 1) with the same setup as in [31]. The restart was necessary to produce outputs synchronous with the ENVISAT acquisitions (21:00 UTC) and to couple the Delft3D model with the wave model. We adopted a third-generation wind-wave model known as Simulating Waves Nearshore (SWAN) [49]. The wave spectrum employed in the simulations was composed of 101 logarithmically spaced frequencies in the range of 0.15–3 Hz. The frequency range was specifically chosen to be representative of wave field expected in Lake Garda and therefore included higher frequencies than those typically employed in coastal applications, but neglected very low frequencies that hardly occur in medium-size lakes. Since no data were available for the calibration of the model, the parameters were chosen in consistency with previous experiences in other large and deep lakes (e.g., Lake Constance [50] and Michigan [51]).
The results of the six Delft3D + SWAN simulations were saved at hourly intervals, over the whole computational domain, and covered a period of two days (the SAR image acquisition day plus one day before).

3. Results

In this work we use the model outputs with the aim of interpreting the results obtained from the SAR images. Thus, we rely here on the assumption that the model is capable of reproducing wind fields and surface transport. The reliability of the wind fields simulated by the WRF model has been extensively demonstrated by [31,52]. As for the surface transport, we base our work on [31], who showed that the Delft3D model results are coherent with in-situ and remotely sensed water temperature observations. We stress that [31] provided an indirect verification of the flow field, since in-situ measurements of water velocity are not available. In Section 3.1 we perform a similar verification by comparing the spatial patterns of surface temperature simulated by the model and reconstructed from the MODIS images. In Section 3.2, we introduce the main features of the investigated dates and in Section 3.3 and Section 3.4, we evaluate the outputs of our procedure for the extraction of lake surface currents from SAR.

3.1. Model Verification Against MODIS

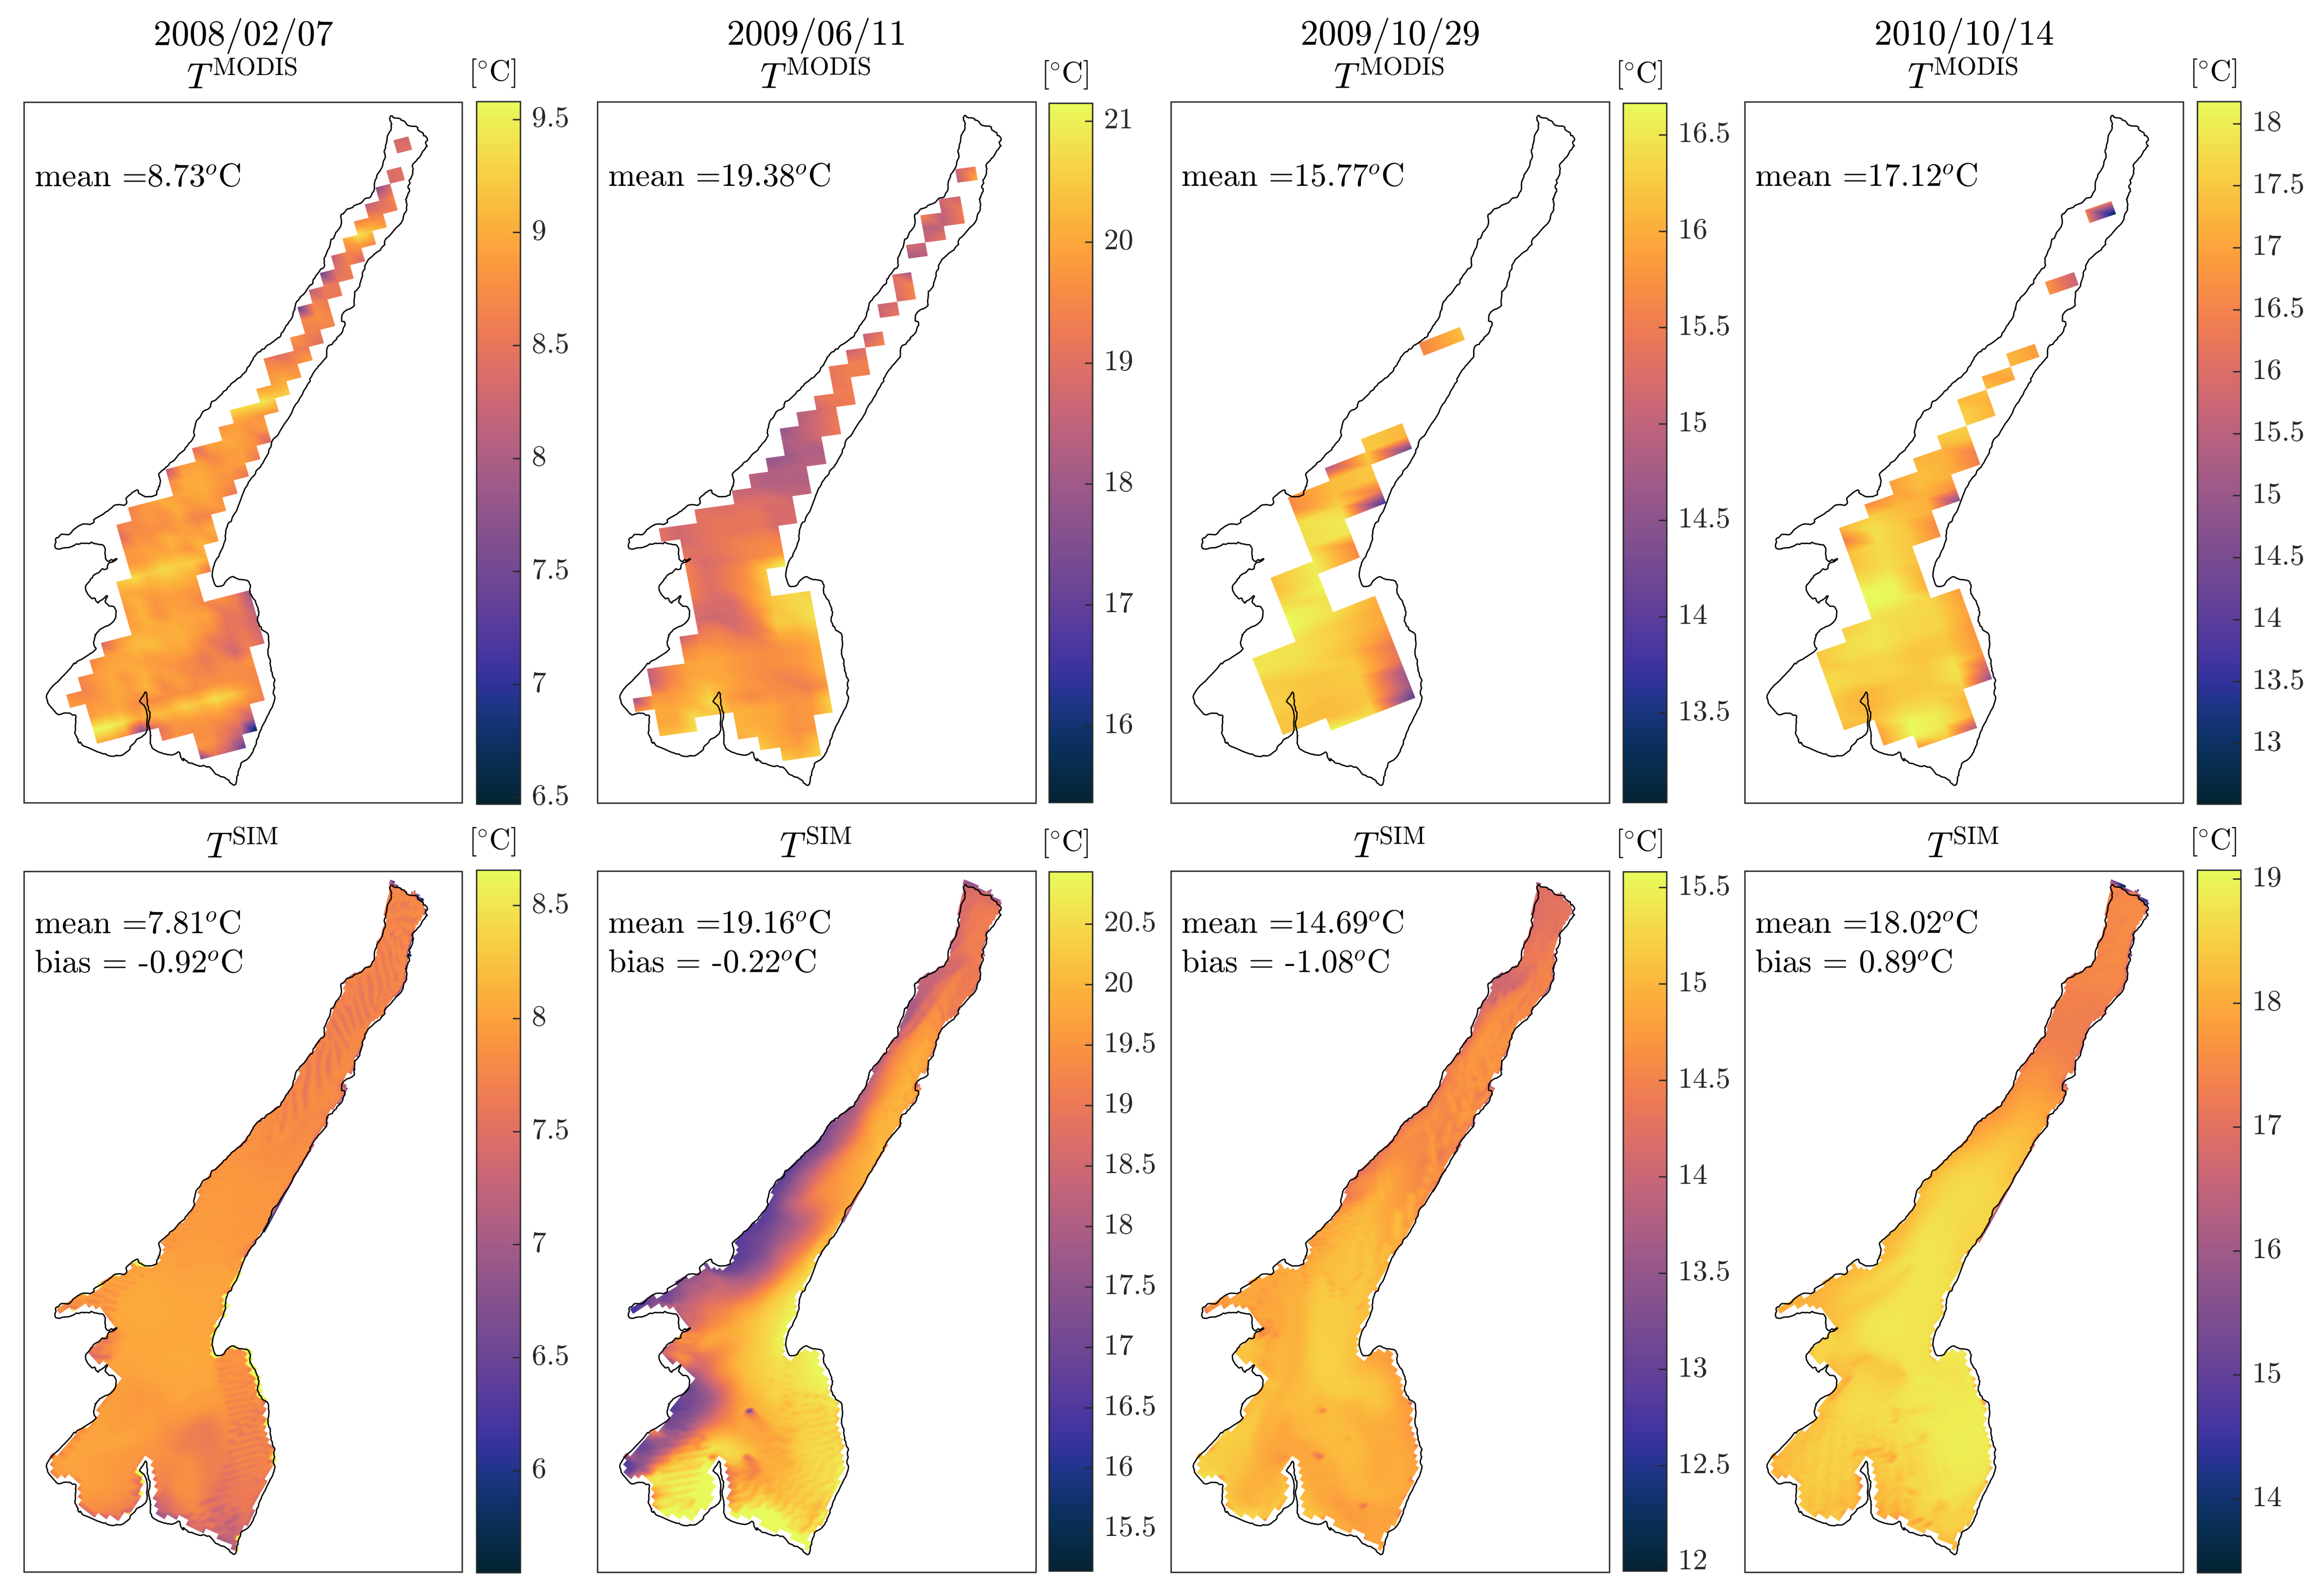
We provide here the comparison between the Level 2 MODIS Terra SST products ( T MODIS ) in Celsius degrees and the simulated lake surface water temperature ( T SIM ). Figure 3 shows that the model correctly reproduces the remotely sensed patterns of lake surface temperature and the spatial variability of this quantity in the different seasons. This confirms that the heat fluxes between atmosphere and lake are well simulated, and that the numerical flow field is coherent with the transport patterns responsible for horizontal anomalies in lake surface temperature. The difference between the spatial mean values of T SIM and T MODIS (reported in each panel of Figure 3) can be due to model errors as well as to the skin-bulk bias [53]. However, in all investigated dates the mean error is below 1 C, well in line with the performances of the long-run model in [31].

3.2. Main Features of Investigated Dates

The wind field has been recognized as playing a major role for the use of SAR in the open ocean [54]. In particular, in order generate capillary waves detectable from C-band sensors, the wind forces have to overcome the viscous ones. A wind speed threshold value for this process to occur is estimated to be about 3.25 m/s (at 10 m above the surface, [55]).
Therefore, we classify the six cases considered in this study (and listed in Table 1) based on the wind intensity. In Figure 4 the daily cycle of wind speed and direction simulated in a mid-lake point (point P in Figure 1) is displayed for the selected dates. The SAR acquisition time is indicated as a red vertical line in the figure panels.
We define “low wind” dates (Figure 4a–c) the three acquisitions in which the spatial mean of the simulated wind speed is equal or smaller than this threshold value (29 October 2009, 5 August 2010, 14 October 2010). In these dates mild evening breezes blew at 21:00 UTC over the lake surface (≈1–3 m/s). This condition is frequent in sunny and warm days, when thermal breezes develop with alternating directions during daylight hours and calm down after the sunset. Under low wind conditions, simulations predict mean surface velocities below 10 cm/s, significant wave heights H s of the order of few cm, and peak wavelengths λ peak of the order of 1 m (Table 1). Such values suggest that gravity effects do not completely dominate the dynamics as surface tension still plays a significant role [56].
The remaining three acquisitions are classified as “high wind” dates (7 February 2008, 13 November 2008, 11 June 2009, Figure 4d–f). On those days, the mean value of wind speed is above 7 m/s and its maximum value exceeds 15 m/s in large regions of the lake. Both the mean and the maximum wind speed values are significantly higher than the above-mentioned threshold. Such high speeds are often due to large scale synoptic winds, blowing almost uniformly over the lake’s surface for more than 12 h. Figure 4d,e shows that the latter is indeed the case for the dates 7 February 2008 and 13 November 2008, when a northerly Föhn wind persistently blew for one day before the SAR acquisition time. On the contrary, the date 11 June 2009 (Figure 4f) coincides with the onset of a similar wind, which started one hour before the acquisition time and lasted all night long (not shown).
The simulated gravity waves on high wind speed days have H s of the order of 50 cm on average (Table 1), overcoming 1 m in some areas of the lake, and λ peak of the order of 10 m. These values are fully consistent with the gravity waves field that can be theoretically expected [57] and observed [58] in a medium-size lake.
In the next two sections, we will provide for all investigated dates the amplitude SAR backscatter image ( σ 0 ), the ground range surface velocity retrieved from SAR DCA (Figure 2a, v gr ) and simulated by the numerical model (Figure 2b, v gr SIM ), and the simulated wind field (direction and ground range component magnitude W gr SIM ). The represented quantities are obtained as follows:
  • σ 0 is processed as described at the end of Section 2.3 expressed in dB to enhance the visibility of its variation over lake;
  • v gr is obtained as in Equation (2).
  • v gr SIM is obtained by computing the component of the simulated surface velocity along the ground range;
  • W gr SIM is obtained by computing the component of the simulated wind velocity vector (at 10 m a.w.s.) along the ground range direction.

3.3. Low Wind Dates

The results for the “low wind” dates are reported in Figure 5. In marine/ocean observations, a low-wind regime corresponds to a low mean amplitude and a limited spatial variation of the backscatter. In our case study, Figure 5 clearly shows a different behaviour. The SAR backscatter retrieved on these dates (first column of the Figure 5, panels a, e, i) shows recurring patterns in all examined images. Higher values are detected in the northwestern basin, lower values in the south-eastern region. A high intensity feature located at the NE edge of the lake is present in all the ascending SAR images analysed. It consists in a cross-track radiometric compression, known as foreshortening effect, which occurs when the radar beam impinges on the foreslope of a mountainous area [20]. The component of surface motion retrieved from SAR DCA v gr is represented in the second column of Figure 5, panels b, f, j. Red and blue colors (redshift and blueshift) indicate a motion towards and away from the radar antenna, respectively. We recall here that the surface velocity has been estimated with a DRC of 2.5 km × 2.5 km (see Section 2.3) and that any variation of the resulting v gr at a smaller spatial scale has to be interpreted with care. While this is not a critical issue along the longitudinal axis of the lake and in the southeastern basin, where both the length and the width of the lake are significantly larger than the DRC size, difficulties arise in the northern trunk of the lake. Here the DRC size is comparable to the width of the lake and the estimation might be affected by the presence of portions of land inside the DRC. For such a reason we recommend caution in the interpretation of the variations of v gr along the crosswise direction.
The spatial patterns of v gr resemble those from σ 0 . In the northern trunk of the lake, v gr shows in all dates a recurring pattern: it overcomes 2 m/s in the central and western region, and is almost null along the eastern shore. This behaviour suggests a south-westward surface transport which is not confirmed by the numerical model (third column of Figure 5, panels c, g, k). In fact, the simulated field of v gr SIM shows significant differences from one date to another, mostly due to the differences in the spatial distribution of the wind field (fourth column of Figure 5, panels d, h, l). Moreover, the simulations show significantly lower surface velocities, below 0.1 m/s, as it is reasonably expected in a lake of the dimensions of Lake Garda under low wind conditions [59].
In the southern sub-basin, similar patterns are found in v gr , retrieved on 29 October 2009 and 14 October 2010 (Figure 5b and j respectively), with high and positive velocities at the center of the sub-basin and almost null or negative velocities close to the shores. The spatial distribution of v gr in this region is similar to that of v gr SIM on the same dates (Figure 5c,k). On 5 August 2010 v gr (Figure 5f) is strongly positive over the entire southern region, while v gr SIM (Figure 5g) is strongly negative. The spatial distribution of v gr SIM on this date reveals a predominant eastward surface transport in the southern basin and an opposite tendency in the northern basin, which is the direct consequence of two divergent wind fields with respect to the ground range direction (Figure 5h).

3.4. High Wind Dates

The results for the “high wind” dates are reported in Figure 6. The SAR backscatter images (Figure 6, panels a,e,i) and the surface velocity v gr (Figure 6b,f,j) present similar patterns, which are in good agreement with the simulated surface velocity v gr SIM (c,g,k), especially in the elongated region.
On all dates σ 0 shows a pattern characterized by increasingly high values as moving south-west in the northwestern basin (Figure 6a,e,i). Such pattern can be observed also in the v gr images (Figure 6b,f,j), with a redshift located mostly along the western shore indicating a south-westerly surface current moving towards the sensor. The value of v gr in this area is higher than 2 m/s and slightly decreases in the southeastern part of the region. This behavior finds qualitative correspondence with the patterns of v gr SIM (Figure 6c,g,k), where the signature of wind waves can be detected from localized peaks of velocity up to 0.5 m/s. The black arrows displayed in Figure 6d,h,l indicate the presence of a wind blowing from north-east to south-west, which is responsible for the surface transport observed both from SAR and the model.

4. Discussion

In all cases examined, the surface ground range velocity retrieved from SAR ( v gr ) is much higher than the simulated v gr SIM . Regardless of the wind intensity, v gr always overcomes ±2 m/s, which is too high for a medium-size lake environment. Despite the empirical relations linking lake surface velocity and wind speed are often site-specific, the order of magnitude of the first quantity is generally assumed to depend on the second. A wind factor can be computed as the ratio between water surface velocity and wind speed. In open waters the wind factor is typically of the order of 3%, but it can also be lower for the nearshore areas [60]. In the investigated dates, the simulated water velocity was found to be, on average, between 2% and 3.5% of the wind speed. Even assuming that the observed v gr is the only component of the surface current (i.e., assuming that the water is moving precisely along the ground range direction), a value of 2 m/s would require a wind speed of more than 60 m/s, which is an absolutely unrealistic wind speed. Such wind speed would be even higher if we take into account also the other component of surface motion, which is likely to exist and contributes to the module of surface current, despite it can not be retrieved with the DCA technique. Hence, the velocity retrieved from SAR is a large overestimation of the actual lake surface velocity.
Such overestimation is also found in open ocean applications [61], where v gr is affected by the surface bulk velocity and by a term of the order of the 30% the ground range component of the wind velocity W gr SIM [14]. The latter term represents a bias to be removed for the effective estimate of the surface ground range velocity. Such bias is typically predicted and removed using an ad hoc geophysical model function (GMF), for example, CDOP [12], which exploits the correlation between DCA and the ground range component of the wind velocity W gr SIM . The key geophysical process underlying this function is represented by wind waves, due to their orbital velocities.
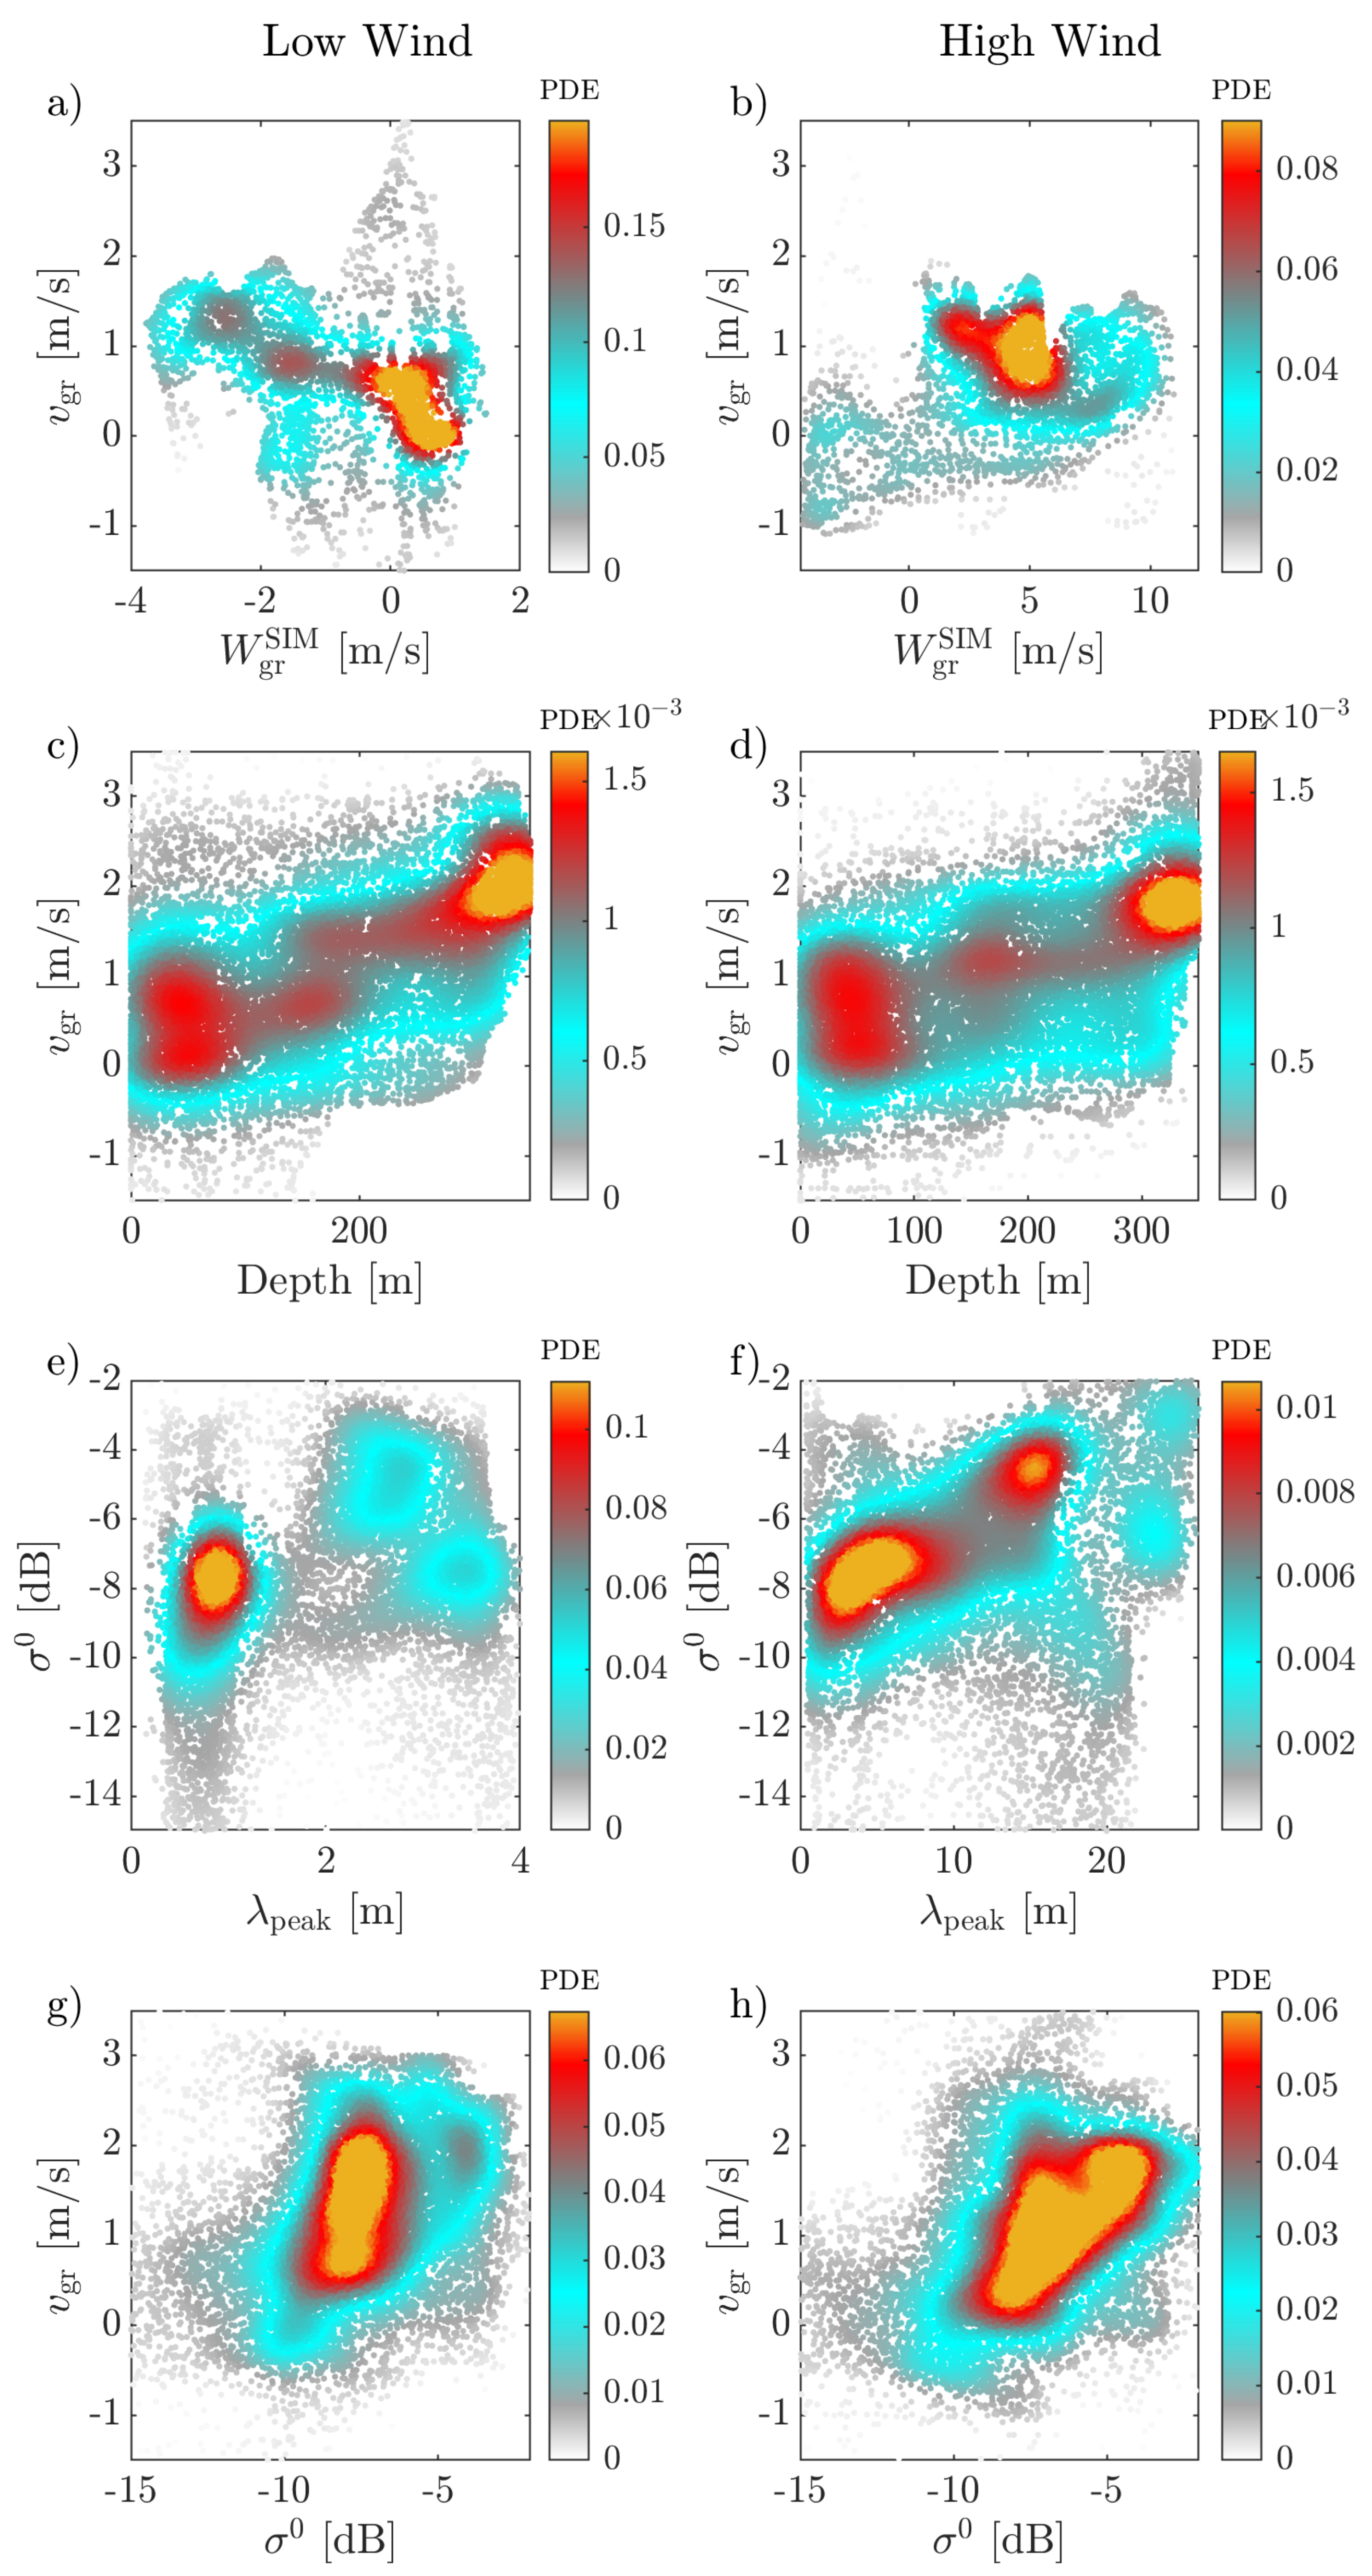
Following this approach, the existence of a correlation between v gr and W gr SIM is investigated. Scatter plots of v gr vs W gr SIM are shown in the first row of Figure 7 (panels a, b from the low and high wind dates respectively). The colour scale reflects the probability density estimation from data computed via a Kernel Density Estimation (KDE) algorithm. The two variables appear not to be correlated in all cases examined here. This was reasonably expected, as in small to medium-size lakes the wind–waves field is typically underdeveloped, with complex dynamics often subject to local effects (such as topography) [57]. Thus, the validated approaches operationally used in the open ocean [10,15] cannot be applied to our case study and other quantities possibly affect v gr .
Patterns observed in Figure 5 and Figure 6 for σ 0 and v gr suggest a possible contribution from bathymetry to the SAR products. Figure 7c,d shows that a correlation between v gr and bathymetry exists in all the investigated dates: higher correlation between v gr and water depth is found the shallower areas (0 to 100 m deep), and in the deepest area (below 300 m). It is recognized that underwater bottom topography can be sensed indirectly via surface effects [62], although the electromagnetic waves emitted by the radar penetrate water only to a depth that is small in comparison to the radar wavelength. In fact, the underwater bottom topography generates short-scale surface roughness variations, which in turn modulate the radar reflectivity. As a complement to the analysis of the correlation between v gr and water depth, we note that the deepest region of the lake (depth > 300 m, where highly correlated values are visible in Figure 7c,d) coincide with the northern narrow area of the lake. In this area, the width of the lake ranges between 3 and 5 km, that is, between one and two times the DRC size (2.5 km). Hence, we assume that an effect of the mixed signals from water and land shall also be considered. To what extent such an effect combines with the bathymetry and the wind waves field and alters the measured v gr is beyond the aims of this work and we recommend further investigation in this sense.
Given the specific geometry of Lake Garda, the observed significance of bathymetry could, in principle, also be ascribed to the presence of longer (meters scale) wind waves. As shown in Figure 7c,d there is a peak of correlated values around ≈170 m depth and v gr 1.5 m/s. Such a feature, in the case of high wind, is likely related to the wave field development. In this regard, in Figure 8a–c we report the peak wavelength map in the high wind dates. As it is clear from the first two days (panels a,b), λ peak reaches its maximum at the end of the northern trunk, where water depth is below the two 150 m isobaths. This area also corresponds to maximum effective fetch for a wind blowing from North-East. The relative weight of the short and long waves also affects v gr and is at the base of the applications of the DCA method to oceans [11,61]. Nevertheless, it cannot be easily quantified in lake applications, despite the fact that it can be inferred from σ 0 variations. According to the Bragg scattering model, the radar backscatter is proportional to the surface wave spectral density at the Bragg wavelength. As these centimeters-scale waves are tilted by longer (meters-scale) waves, σ 0 varies along with such longer wave profiles. This leads to a correlation between σ 0 and the orbital velocities of the peak waves [63]. Theoretical findings predict an average increase in the mean spectral density of the short waves due to the interaction between short “Bragg” waves and meters-scale waves [64]. Such a relationship also holds in the high wind cases analyzed here, as shown in Figure 7f, where a clear correlation exists between σ 0 and λ peak . However, no correlation is found in the case of low wind dates (Figure 7e), when the wave field is not developed.
Figure 7g,h clearly shows that a tight relationship exists between v gr and σ 0 . A remark about the compensation of the effects of the azimuth variation of the backscattering on the DCA is now in order. The Doppler shift is estimated by exploiting the spectral tapering of the azimuth antenna beam pattern. The algorithms for the DC estimation assume a backscattering spectral flatness, that is, a flat backscattering spectral power density [43,44]. Evidently, the presence of azimuth variations of the backscattering within the Doppler Resolution Cell (DRC) can negatively impact this assumption leading to a spatially varying Doppler shift bias, that is, a disturbance in the measured DCA. In [12], this phenomenon was physically explained by referring to the unbalancing, appearing in the presence of a backscattering azimuth gradient, between the contributions to the Doppler Centroid associated with the scatterers ahead and behind the zero Doppler scatter. In [12], the authors proposed a solution to this problem, which is based on the subtraction of the contribution correlated to the azimuth backscattering gradient from the estimated DCA. A detailed analysis of the effect of azimuth backscattering variations on the estimated DCA, as well as its mitigation, is beyond the scope of the present work and is certainly worth future research, especially for the specific application to lakes. The compensation procedure proposed in [12] was not adopted here due to the possible consequences on the cancellation of the useful signal.

5. Conclusions

In recent years, the literature has reflected increasing awareness of the opportunities of satellite-based monitoring of lake surfaces. In this study, we investigate the possibility of inferring lake surface water velocity from existing methods, exploiting the SAR Doppler Centroid Anomaly. To our knowledge, this is the first application of such methodologies to inland waters. The analysis of ENVISAT SAR images and the related DCA maps for Lake Garda returns evident structures with intense and spatially varying values of backscattering and Doppler frequency. These are compared with the results of a numerical model. In the three dates when a high wind blows uniformly over the lake, the spatial patterns retrieved from SAR resemble those from the numerical model, while this is not the case for the low wind dates. In all cases, the surface velocity retrieved from DCA appears to always be significantly overestimated.
The factors potentially influencing the extraction of surface velocity on the investigated dates are identified as are the intensity of the wind forcing, the bathymetry, and the wind waves’ wavelength. The simulated wind waves are also found to be well correlated with the backscatter amplitude. Some hypotheses on the potential biases to be removed are addressed, to preliminarily evaluate the applicability of existing GMFs.
Lake dynamics can be significantly different to those in open seas, especially in medium-size lakes where the response to the wind forcing varies locally. In our case study, wind space and time variability is mainly responsible for the surface flow field [59]. The cases analyzed so far suggest that the GMFs derived for inferring the surface velocity from DCA in open seas [12] cannot be applied to our case study, as they account for the wind vector solely and assume a fully developed wind waves field. Indeed, none of the cases analyzed show a clear correlation between ground range velocity measured from SAR and the correspondent wind component. On the other hand, the data processed suggest that a specific GMF could be defined for our case study, and potentially for the more general case of medium-size lakes. This function should include parameterizations handling the small scale variations associated with wind forcing, bathymetry and waves. The possibility of including the information carried by the SAR backscatter should be evaluated, and the interpretation of the environmental variables signature on the SAR backscatter should be further improved.
The application to lakes of Doppler methods commonly exploited in the open sea is not only challenging for the site related features, for example, specific environmental conditions, hydrodynamic and topographic aspects, but also from the data processing perspective. Further developments shall be carried out in the processing chain to account for possible size limitations of the lake compared to the Doppler resolution cell. Adaptive strategies based on multi-resolution Doppler estimation could be investigated, as well as approaches for the correction of the bias induced by a non-uniform backscattering within the Doppler resolution cell. Such data processing developments are considered priorities for improving the application of SAR-based current estimation methods to lakes.
The results and the interpretations provided in this work must be deeply validated and massive research activity is required, as well as dedicated field campaigns. In this sense, we hope that our contribution will pave the way for the development of a procedure for the extraction of the current signature from SAR that is adequately re-adapted for lakes.

Author Contributions

Conceptualization, M.A., V.Z., G.D.C., G.F. and F.D.S.; Data curation, M.A., V.Z. and F.D.S.; Formal analysis, M.A., V.Z. and F.D.S.; Investigation, M.A., V.Z., G.D.C., G.F. and F.D.S.; Methodology, M.A., V.Z., M.T., M.B. and C.G.; Project administration, F.D.S.; Resources, M.A. and V.Z.; Software, M.A. and V.Z.; Supervision, G.F. and F.D.S.; Visualization, M.A.; Writing—original draft, M.A., V.Z. and F.D.S.; Writing—review & editing, G.D.C., G.F., M.T., M.B. and C.G. All authors have read and agreed to the published version of the manuscript.

Funding

This study has been supported the EU Horizon 2020 project Water-ForCE (grant nr. 101004186).

Institutional Review Board Statement

Not applicable.

Informed Consent Statement

Not applicable.

Data Availability Statement

Data sharing is no applicable to this article.

Acknowledgments

We thank Lorenzo Giovanni for the WRF simulations. We are also thankful to Marco Pilotti, Giulia Valerio and Francesco Serafino for insightful discussions on the potential impacts of this preliminary work.

Conflicts of Interest

The authors declare no conflict of interest.

Abbreviations

The following abbreviations are used in this manuscript:
DCADoppler Centroid Anomaly
DRCDoppler Resolution Cell
ECMWFEuropean Center for Medium-Range Weather Forecast
GMFGeophysical Model Function
KDEKernel Density Estimation
LOSLine Of Sight
S1Sentinel-1
SARSynthetic Aperture Radar
SLCSingle Look Complex
SSTSea Surface Temperature
SWANSimulating WAves Nearshore
WRFWeather Research and Forecasting

References

  1. Noviello, C.; Verde, S.; Zamparelli, V.; Fornaro, G.; Pauciullo, A.; Reale, D.; Nicodemo, G.; Ferlisi, S.; Gulla, G.; Peduto, D. Monitoring Buildings at Landslide Risk With SAR: A Methodology Based on the Use of Multipass Interferometric Data. IEEE Geosci. Remote Sens. Mag. 2020, 8, 91–119. [Google Scholar] [CrossRef]
  2. Cascini, L.; Peduto, D.; Reale, D.; Arena, L.; Ferlisi, S.; Verde, S.; Fornaro, G. Detection and monitoring of facilities exposed to subsidence phenomena via past and current generation SAR sensors. J. Geophys. Eng. 2013, 10, 064001. [Google Scholar] [CrossRef]
  3. Franceschetti, G.; Lanari, R. Synthetic Aperture Radar Processing; CRC Press: Boca Raton, FL, USA, 1999. [Google Scholar]
  4. Trivero, P.; Adamo, M.; Biamino, W.; Borasi, M.; Cavagnero, M.; De Carolis, G.; Di Matteo, L.; Fontebasso, F.; Nirchio, F.; Tataranni, F. Automatic oil slick detection from SAR images: Results and improvements in the framework of the PRIMI pilot project. Deep Sea Res. Part Top. Stud. Oceanogr. 2016, 133, 146–158. [Google Scholar] [CrossRef]
  5. De Carolis, G.; Olla, P.; De Santi, F. SAR image wave spectra to retrieve the thickness of grease-pancake sea ice using viscous wave propagation models. Sci. Rep. 2021, 11, 1–14. [Google Scholar] [CrossRef] [PubMed]
  6. Tello, M.; Lopez-Martinez, C.; Mallorqui, J.J. A novel algorithm for ship detection in SAR imagery based on the wavelet transform. IEEE Geosci. Remote. Sens. Lett. 2005, 2, 201–205. [Google Scholar] [CrossRef]
  7. Lehner, S.; Horstmann, J.; Koch, W.; Rosenthal, W. Mesoscale wind measurements using recalibrated ERS SAR images. J. Geophys. Res. Ocean. 1998, 103, 7847–7856. [Google Scholar] [CrossRef]
  8. Biondi, F.; Addabbo, P.; Ullo, S.L.; Clemente, C.; Orlando, D. Perspectives on the Structural Health Monitoring of Bridges by Synthetic Aperture Radar. Remote Sens. 2020, 12, 3852. [Google Scholar] [CrossRef]
  9. Cerutti-Maori, D.; Sikaneta, I.; Gierull, C.H. Optimum SAR/GMTI Processing and Its Application to the Radar Satellite RADARSAT-2 for Traffic Monitoring. IEEE Trans. Geosci. Remote Sens. 2012, 50, 3868–3881. [Google Scholar] [CrossRef]
  10. Moiseev, A.; Johnsen, H.; Hansen, M.; Johannessen, J. Evaluation of Radial Ocean Surface Currents Derived from Sentinel-1 IW Doppler Shift Using Coastal Radar and Lagrangian Surface Drifter Observations. J. Geophys. Res. Ocean. 2020, 125, e2019JC015743. [Google Scholar] [CrossRef]
  11. Dagestad, K.F.; Horstmann, J.; Mouche, A.; Perrie, W.; Shen, H.; Zhang, B.; Li, X.; Monaldo, F.; Pichel, W.; Lehner, S.; et al. Wind retrieval from synthetic aperture radar-an overview. In Proceedings of the 4th SAR Oceanography Workshop (SEASAR 2012), Tromsø, Norway, 18–22 June 2012; pp. 18–22. [Google Scholar]
  12. Mouche, A.A.; Collard, F.; Chapron, B.; Dagestad, K.F.; Guitton, G.; Johannessen, J.A.; Kerbaol, V.; Hansen, M.W. On the use of Doppler shift for sea surface wind retrieval from SAR. IEEE Trans. Geosci. Remote Sens. 2012, 50, 2901–2909. [Google Scholar] [CrossRef]
  13. Chapron, B.; Collard, F.; Kerbaol, V. Satellite synthetic aperture radar sea surface Doppler measurements. In Proceedings of the 2nd Workshop on SAR Coastal and Marine Applications, 2004, Svalbard, Norway, 8–12 September 2003; pp. 8–12. [Google Scholar]
  14. Chapron, B.; Collard, F.; Ardhuin, F. Direct measurements of ocean surface velocity from space: Interpretation and validation. J. Geophys. Res. Ocean. 2005, 110. [Google Scholar] [CrossRef]
  15. S1 Level 2 OCN: Surface Radial Velocity (RVL) Component. Available online: https://sentinel.esa.int/web/sentinel/technical-guides/sentinel-1-sar/products-algorithms/level-2/products/surface-radial-velocity-component (accessed on 15 February 2021).
  16. Zamparelli, V.; De Santi, F.; Cucco, A.; Zecchetto, S.; De Carolis, G.; Fornaro, G. Surface Currents Derived from SAR Doppler Processing: An Analysis over the Naples Coastal Region in South Italy. J. Mar. Sci. Eng. 2020, 8, 203. [Google Scholar] [CrossRef] [Green Version]
  17. Zamparelli, V.; De Santi, F.; De Carolis, G.; Fornaro, G. On the Analysis of SAR Derived Wind and Sea Surface Currents. In Proceedings of the IGARSS 2020—2020 IEEE International Geoscience and Remote Sensing Symposium, Waikoloa, HI, USA, 26 September–2 October 2020; pp. 5721–5724. [Google Scholar] [CrossRef]
  18. Romeiser, R.; Runge, H.; Suchandt, S.; Kahle, R.; Rossi, C.; Bell, P.S. Quality Assessment of Surface Current Fields from TerraSAR-X and TanDEM-X Along-Track Interferometry and Doppler Centroid Analysis. IEEE Trans. Geosci. Remote Sens. 2014, 52, 2759–2772. [Google Scholar] [CrossRef] [Green Version]
  19. Romeiser, R.; Alpers, W. An improved composite surface model for the radar backscattering cross section of the ocean surface: 2. Model response to surface roughness variations and the radar imaging of underwater bottom topography. J. Geophys. Res. Oceans 1997, 102, 25251–25267. [Google Scholar] [CrossRef]
  20. Gelautz, M.; Frick, H.; Raggam, J.; Burgstaller, J.; Leberl, F. SAR image simulation and analysis of alpine terrain. Isprs J. Photogramm. Remote Sens. 1998, 53, 17–38. [Google Scholar] [CrossRef]
  21. Nghiem, S.V.; Leshkevich, G.A. Satellite SAR remote sensing of Great Lakes ice cover, Part 1. Ice backscatter signatures at C band. J. Great Lakes Res. 2007, 33, 722–735. [Google Scholar] [CrossRef]
  22. Wu, L.; Wang, L.; Min, L.; Hou, W.; Guo, Z.; Zhao, J.; Li, N. Discrimination of Algal-bloom using spaceborne SAR observations of Great Lakes in China. Remote Sens. 2018, 10, 767. [Google Scholar] [CrossRef] [Green Version]
  23. De Santi, F.; Luciani, G.; Bresciani, M.; Giardino, C.; Lovergine, F.P.; Pasquariello, G.; Vaiciute, D.; De Carolis, G. Synergistic Use of Synthetic Aperture Radar and Optical Imagery to Monitor Surface Accumulation of Cyanobacteria in the Curonian Lagoon. J. Mar. Sci. Eng. 2019, 7, 461. [Google Scholar] [CrossRef] [Green Version]
  24. McKinney, P.; Holt, B.; Matsumoto, K. Small eddies observed in Lake Superior using SAR and sea surface temperature imagery. J. Great Lakes Res. 2012, 38, 786–797. [Google Scholar] [CrossRef]
  25. Katona, T.; Bartsch, A. Estimation of wind speed over lakes in Central Europe using spaceborne C-band SAR. Eur. J. Remote Sens. 2018, 51, 921–931. [Google Scholar] [CrossRef] [Green Version]
  26. Pareeth, S.; Bresciani, M.; Buzzi, F.; Leoni, B.; Lepori, F.; Ludovisi, A.; Morabito, G.; Adrian, R.; Neteler, M.; Salmaso, N. Warming trends of perialpine lakes from homogenised time series of historical satellite and in-situ data. Sci. Total Environ. 2017, 578, 417–426. [Google Scholar] [CrossRef] [PubMed]
  27. Jackson, G.; Fornaro, G.; Berardino, P.; Esposito, C.; Lanari, R.; Pauciullo, A.; Reale, D.; Zamparelli, V.; Perna, S. Experiments of sea surface currents estimation with space and airborne SAR systems. In Proceedings of the 2015 IEEE International Geoscience and Remote Sensing Symposium (IGARSS), Milan, Italy, 26–31 July 2015; pp. 373–376. [Google Scholar]
  28. Kersten, P.R.; Toporkov, J.V.; Ainsworth, T.L.; Sletten, M.A.; Jansen, R.W. Estimating Surface Water Speeds With a Single-Phase Center SAR Versus an Along-Track Interferometric SAR. IEEE Trans. Geosci. Remote Sens. 2010, 48, 3638–3646. [Google Scholar] [CrossRef]
  29. Toporkov, J.V.; Perkovic, D.; Farquharson, G.; Sletten, M.A.; Frasier, S.J. Sea surface velocity vector retrieval using dual-beam interferometry: First demonstration. IEEE Trans. Geosci. Remote Sens. 2005, 43, 2494–2502. [Google Scholar] [CrossRef]
  30. Steissberg, T.E.; Hook, S.J.; Schladow, S.G. Measuring surface currents in lakes with high spatial resolution thermal infrared imagery. Geophys. Res. Lett. 2005, 32. [Google Scholar] [CrossRef] [Green Version]
  31. Amadori, M.; Giovannini, L.; Toffolon, M.; Piccolroaz, S.; Zardi, D.; Bresciani, M.; Giardino, C.; Luciani, G.; Kliphuis, M.; van Haren, H.; et al. Multi-scale evaluation of a 3D lake model forced by an atmospheric model against standard monitoring data. Environ. Model. Softw. 2021, 139, 105017. [Google Scholar] [CrossRef]
  32. Salmaso, N.; Mosello, R. Limnological research in the deep southern subalpine lakes: Synthesis, directions and perspectives. Adv. Oceanogr. Limnol. 2010, 1, 29–66. [Google Scholar] [CrossRef]
  33. Giovannini, L.; Laiti, L.; Serafin, S.; Zardi, D. The thermally driven diurnal wind system of the Adige Valley in the Italian Alps. Q. J. R. Meteorol. Soc. 2017, 143, 2389–2402. [Google Scholar] [CrossRef]
  34. Giovannini, L.; Laiti, L.; Zardi, D.; de Franceschi, M. Climatological characteristics of the Ora del Garda wind in the Alps. Int. J. Climatol. 2015, 35, 4103–4115. [Google Scholar] [CrossRef] [Green Version]
  35. Piccolroaz, S.; Amadori, M.; Toffolon, M.; Dijkstra, H.A. Importance of planetary rotation for ventilation processes in deep elongated lakes: Evidence from Lake Garda (Italy). Sci. Rep. 2019, 9, 8290. [Google Scholar] [CrossRef]
  36. Moreira, A. A golden age for spaceborne SAR systems. In Proceedings of the 2014 20th International Conference on Microwaves, Radar and Wireless Communications (MIKON), Gdansk, Poland, 16–18 June 2014; pp. 1–4. [Google Scholar] [CrossRef] [Green Version]
  37. Zamparelli, V.; Jackson, G.; Cucco, A.; Fornaro, G.; Zecchetto, S. SAR based sea current estimation in the Naples coastal area. In Proceedings of the 2016 IEEE International Geoscience and Remote Sensing Symposium (IGARSS), Beijing, China, 10–15 July 2016; pp. 4665–4668. [Google Scholar] [CrossRef]
  38. Zamparelli, V.; Fornaro, G. SAR based sea surface currents estimation: Application to the Gulf of Trieste. In Proceedings of the ISAG-2019 International Symposium on Applied Geoinformatics, Istanbul, Turkey, 7–9 November 2019. [Google Scholar]
  39. Johnsen, H.; Nilsen, V.; Engen, G.; Mouche, A.A.; Collard, F. Ocean doppler anomaly and ocean surface current from Sentinel 1 tops mode. In Proceedings of the 2016 IEEE International Geoscience and Remote Sensing Symposium (IGARSS), Beijing, China, 10–15 July 2016; pp. 3993–3996. [Google Scholar] [CrossRef] [Green Version]
  40. Hansen, M.; Kudryavtsev, V.; Chapron, B.; Johannessen, J.; Collard, F.; Dagestad, K.F.; Mouche, A. Simulation of radar backscatter and Doppler shifts of wave–current interaction in the presence of strong tidal current. Remote Sens. Environ. 2012, 120, 113–122. [Google Scholar] [CrossRef] [Green Version]
  41. Kraemer, T.; Johnsen, H.; Brekke, C. Emulating Sentinel-1 Doppler Radial Ice Drift Measurements Using Envisat ASAR Data. IEEE Trans. Geosci. Remote Sens. 2015, 53, 6407–6418. [Google Scholar] [CrossRef] [Green Version]
  42. Wang, L.; Zhou, Y.; Ge, J.; Johannessen, J.; Shen, F. Mapping sea surface velocities in the Changjiang coastal zone with advanced synthetic aperture radar. Acta Oceanol. Sin. 2014, 33, 141–149. [Google Scholar] [CrossRef]
  43. Madsen, S. Estimating the Doppler centroid of SAR data. IEEE Trans. Aerosp. Electron. Syst. 1989, 25, 134–140. [Google Scholar] [CrossRef] [Green Version]
  44. Bamler, R. Doppler frequency estimation and the Cramer-Rao bound. IEEE Trans. Geosci. Remote Sens. 1991, 29, 385–390. [Google Scholar] [CrossRef] [Green Version]
  45. Meyer, F.J. Performance Requirements for Ionospheric Correction of Low-Frequency SAR Data. IEEE Trans. Geosci. Remote Sens. 2011, 49, 3694–3702. [Google Scholar] [CrossRef]
  46. Sansosti, E. A simple and exact solution for the interferometric and stereo SAR geolocation problem. IEEE Trans. Geosci. Remote Sens. 2004, 42, 1625–1634. [Google Scholar] [CrossRef]
  47. Ghirardi, N.; Amadori, M.; Free, G.; Giovannini, L.; Toffolon, M.; Giardino, C.; Bresciani, M. Using remote sensing and numerical modelling to quantify a turbidity discharge event in Lake Garda. J. Limnol. 2020, 80, 47–52. [Google Scholar] [CrossRef]
  48. Lesser, G.R.; Roelvink, J.A.; Keste, T.M.V.; Stelling, G.S. Development and validation of a three-dimensional morphological model. Coast. Eng. 2004, 51, 883–915. [Google Scholar] [CrossRef]
  49. Booij, N.; Ris, R.C.; Holthuijsen, L.H. A third-generation wave model for coastal regions: 1. Model description and validation. J. Geophys. Res. Oceans 1999, 104, 7649–7666. [Google Scholar] [CrossRef] [Green Version]
  50. Seibt, C.; Peeters, F.; Graf, M.; Sprenger, M.; Hofmann, H. Modeling wind waves and wave exposure of nearshore zones in medium-sized lakes. Limnol. Oceanogr. 2013, 58, 23–36. [Google Scholar] [CrossRef]
  51. Mao, M.; Van Der Westhuysen, A.J.; Xia, M.; Schwab, D.J.; Chawla, A. Modeling wind waves from deep to shallow waters in Lake Michigan using unstructured SWAN. J. Geophys. Res. Oceans 2016, 121, 3836–3865. [Google Scholar] [CrossRef]
  52. Giovannini, L.; Antonacci, G.; Zardi, D.; Laiti, L.; Panziera, L. Sensitivity of simulated wind speed to spatial resolution over complex terrain. Energy Procedia 2014, 59, 323–329. [Google Scholar] [CrossRef] [Green Version]
  53. Wilson, R.C.; Hook, S.J.; Schneider, P.; Schladow, S.G. Skin and bulk temperature difference at Lake Tahoe: A case study on lake skin effect. J. Geophys. Res. Atmos. 2013, 118, 10–332. [Google Scholar] [CrossRef]
  54. Monaldo, F.; Kerbaol, V.; Clemente-Colon, P.; Furevik, B.; Horstmann, J.; Johannessen, J.; Li, X.; Pichel, W.; Sikora, T.; Thompson, D.; et al. The SAR Measurements of Ocean Surface Winds: A White Paper for the 2nd Workshop on Coastal and Marine Applications of SAR, Longyearbyen, Spitsbergen, Norway, 8–12 September 2003. ESA SP 2003, 565. [Google Scholar]
  55. Donelan, M.A.; Pierson, W.J., Jr. Radar scattering and equilibrium ranges in wind-generated waves with application to scatterometry. J. Geophys. Res. Oceans 1987, 92, 4971–5029. [Google Scholar] [CrossRef]
  56. Toffoli, A.; Bitner-Gregersen, E.M. Types of Ocean Surface Waves, Wave Classification. In Encyclopedia of Maritime and Offshore Engineering; American Cancer Society: Hoboken, NJ, USA, 2017; pp. 1–8. [Google Scholar] [CrossRef]
  57. Wüest, A.; Lorke, A. Small scale hydrodynamics in lakes. Annu. Rev. Fluid Mech. 2003, 35, 373–412. [Google Scholar] [CrossRef]
  58. Hofmann, H.; Lorke, A.; Peeters, F. The relative importance of wind and ship waves in the littoral zone of a large lake. Limnol. Oceanogr. 2008, 53, 368–380. [Google Scholar] [CrossRef]
  59. Amadori, M.; Piccolroaz, S.; Giovannini, L.; Zardi, D.; Toffolon, M. Wind variability and Earth’s rotation as drivers of transport in a deep, elongated subalpine lake: The case of Lake Garda. J. Limnol. 2018, 77, 505–521. [Google Scholar] [CrossRef]
  60. Henderson-Sellers, B. The dependence of surface velocity in water bodies on wind velocity and latitude. Appl. Math. Model. 1988, 12, 202–203. [Google Scholar] [CrossRef]
  61. Johannessen, J.A.; Chapron, B.; Collard, F.; Kudryavtsev, V.; Mouche, A.; Akimov, D.; Dagestad, K.F. Direct ocean surface velocity measurements from space: Improved quantitative interpretation of Envisat ASAR observations. Geophys. Res. Lett. 2008, 35. [Google Scholar] [CrossRef] [Green Version]
  62. Alpers, W.; Hennings, I. A theory of the imaging mechanism of underwater bottom topography by real and synthetic aperture radar. J. Geophys. Res. Oceans 1984, 89, 10529–10546. [Google Scholar] [CrossRef]
  63. Wright, J. A new model for sea clutter. IEEE Trans. Antennas Propag. 1968, 16, 217–223. [Google Scholar] [CrossRef]
  64. Lyzenga, D.R. Effects of intermediate-scale waves on radar signatures of ocean fronts and internal waves. J. Geophys. Res. Oceans 1998, 103, 18759–18768. [Google Scholar] [CrossRef]
Figure 1. (a) Location of Lake Garda in northern Italy; orography of the surrounding area in m above sea level (m a.s.l.); lake bathymetry in m below water surface (m b.w.s.). (b) Scheme of the SAR acquisition geometry. (c) Example of an amplitude focused SAR image of an ENVISAT acquisition centered on lake. The SAR image is geocoded and superimposed on the corresponding Google Earth image.
Remotesensing 13 02293 g001
Figure 2. (a) Procedure for the generation of v gr and σ 0 maps from SAR data; (b) modeling chain for the simulation of surface water velocity, temperature and waves field.
Remotesensing 13 02293 g002
Figure 3. Top plots: maps of SST from MODIS Terra on cloud-free investigated dates. Bottom plots: maps of simulated lake surface water temperature. The spatial mean of MODIS and simulated water temperature is displayed together with the existing bias ( T SIM ¯ T MODIS ¯ ). Note: in each panel, colorbar limits are set differently to highlight the spatial patterns. The colorbar limits of bottom plots are set as those from top plots at the corresponding date + the computed bias.
Remotesensing 13 02293 g003
Figure 4. Simulated wind direction and speed on the investigated dates a in-lake point (point P in Figure 1a). The red arrow in each panel corresponds to the wind simulated in P at the SAR acquisition time (i.e., the red line at 21:00 UTC). The sketch at the right displays the location of P and the direction of the wind with respect to the lake geography.
Remotesensing 13 02293 g004
Figure 5. Maps from low wind days (ad) 29 October 2009, (eh) 5 August 2010, (il) 14 October 2010 of: first column (a,e,i) SAR bakcscatter amplitude; second column (b,f,j) v gr estimated from SAR DCA (Equation (2)); third column (c,g,k) v gr SIM simulated by the numerical model; fourth column (d,h,l) ground range component of simulated wind speed W gr SIM . Black arrows in fourth column indicate the wind vector. The ground range direction is displayed by the blue and red arrow at the bottom-right corner of panels.
Remotesensing 13 02293 g005
Figure 6. Maps from high wind days (ad) 7 February 2008, (eh) 13 November 2008, (il) 11 June 2009 of: first column (a,e,i) SAR backscatter amplitude; second column (b,f,j) v gr estimated from SAR DCA (Equation (2)); third column (c,g,k) v gr SIM simulated by the numerical model; fourth column (d,h,l) ground range component of simulated wind speed W gr SIM . Black arrows in fourth column indicate the wind vector. The ground range direction is displayed by the blue and red arrow at the bottom-right corner of the panels.
Remotesensing 13 02293 g006
Figure 7. Scatter plots of v gr vs W gr SIM (a,b); v gr vs depth (c,d); σ 0 vs λ peak (e,f); v gr vs σ 0 (g,h). Panels on left column (a,c,e,g) refer to low wind cases, right column (b,d,f,h) to high wind cases. Color scale reflects the probability density estimate (PDE) computed via the Kernel smoothing function, which evaluates the spatial density of nearby points.
Remotesensing 13 02293 g007
Figure 8. Maps of peak wavelength for high wind dates 7 February 2008 (a), 13 November 2008 (b), 11 June 2009 (c).
Remotesensing 13 02293 g008
Table 1. Mean, standard deviation and maximum of the simulated key geophysical quantities for each date considered. Module of wind speed from WRF ( W SIM ); module of the surface water velocity from Delft3D + SWAN ( v SIM ); significant wave height ( H s ) and peak wavelength ( λ peak ) from SWAN.
ClassDate W SIM [m/s] v SIM [cm/s] H s [cm] λ peak [m]
Mean ± StdMaxMean ± StdMaxMean ± StdMaxMean ± StdMax
low29 October 2009 * 2.3 ± 1.55.58.3 ± 6.830.38.6 ± 5.619.62.04 ± 1.234.40
low5 August 20103.1 ± 0.95.110.6 ± 5.433.511.4 ± 4.217.42.34 ± 0.943.74
low14 October 2010 * 1.3 ± 0.52.13.2 ± 2.013.63.3 ± 0.95.30.81 ± 0.181.14
high7 February 2008 * 8.2 ± 3.216.416.4 ± 8.161.049.7 ± 24.492.49.71 ± 5.0419.24
high13 November 200810.2 ± 5.222.233.1 ± 21.2117.568.1 ± 42.7145.112.79 ± 8.3127.8
high11 June 2009 * 7.9 ± 4.617.217.3 ± 8.453.248.9 ± 35.0109.79.34 ± 7.0029.67
* MODIS product available.
Publisher’s Note: MDPI stays neutral with regard to jurisdictional claims in published maps and institutional affiliations.