Article

Investigating the Role of Green Infrastructure on Urban WaterLogging: Evidence from Metropolitan Coastal Cities

1
Department of Land, Environment, Agriculture and Forestry, University of Padova, 35020 Legnaro, Italy
2
School of Geographical Sciences, Guangzhou University, Guangzhou 510006, China
3
Southern Marine Science and Engineering Guangdong Laboratory, Guangzhou 511458, China
4
MNR Key Laboratory for Geo-Environmental Monitoring of Great Bay Area, Shenzhen 518000, China
*
Author to whom correspondence should be addressed.
Remote Sens. 2021, 13(12), 2341; https://doi.org/10.3390/rs13122341
Submission received: 3 May 2021 / Revised: 4 June 2021 / Accepted: 9 June 2021 / Published: 15 June 2021

Abstract

:
Urban green infrastructures (UGI) can effectively reduce surface runoff, thereby alleviating the pressure of urban waterlogging. Due to the shortage of land resources in metropolitan areas, it is necessary to understand how to utilize the limited UGI area to maximize the waterlogging mitigation function. Less attention, however, has been paid to investigating the threshold level of waterlogging mitigation capacity. Additionally, various studies mainly focused on the individual effects of UGI factors on waterlogging but neglected the interactive effects between these factors. To overcome this limitation, two waterlogging high-risk coastal cities—Guangzhou and Shenzhen, are selected to examine the effectiveness and stability of UGI in alleviating urban waterlogging. The results indicate that the impact of green infrastructure on urban waterlogging largely depends on its area and biophysical parameter. Healthier or denser vegetation (superior ecological environment) can more effectively intercept and store rainwater runoff. This suggests that while increasing the area of UGI, more attention should be paid to the biophysical parameter of vegetation. Hence, the mitigation effect of green infrastructure would be improved from the “size” and “health”. The interaction of composition and spatial configuration greatly enhances their individual effects on waterlogging. This result underscores the importance of the interactive enhancement effect between UGI composition and spatial configuration. Therefore, it is particularly important to optimize the UGI composition and spatial pattern under limited land resource conditions. Lastly, the effect of green infrastructure on waterlogging presents a threshold phenomenon. The excessive area proportions of UGI within the watershed unit or an oversized UGI patch may lead to a waste of its mitigation effect. Therefore, the area proportion of UGI and its mitigation effect should be considered comprehensively when planning UGI. It is recommended to control the proportion of green infrastructure at the watershed scale (24.4% and 72.1% for Guangzhou and Shenzhen) as well as the area of green infrastructure patches (1.9 ha and 2.8 ha for Guangzhou and Shenzhen) within the threshold level to maximize its mitigation effect. Given the growing concerns of global warming and continued rapid urbanization, these findings provide practical urban waterlogging prevention strategies toward practical implementations.

Graphical Abstract

1. Introduction

Urban waterlogging is caused by surface runoff exceeding the local drainage capacity of a city due to short-term heavy rainfall [1,2,3]. With the acceleration of globalization, the natural surface within the city has undergone drastic changes [4,5]. This phenomenon leads to numerous social-environmental-ecological problems [6,7,8,9]. The driving factors and spatial variability of waterlogging have been extensively studied [10,11]. Specifically, the man-made land covers destroy the original urban hydrological cycle, which impedes the natural infiltration of rainwater and reduces the storage capacity of the underlying urban surface. These phenomena have led to the frequent occurrence of urban waterlogging events [12,13,14]. The Intergovernmental Panel on Climate Change (IPCC) fifth assessment report states that the intensity and frequency of extreme precipitation events have increased significantly [15]. Therefore, in the context of climate change and intense human activities, it will undoubtedly lead to the frequent occurrence of urban waterlogging disasters, posing a growing threat to human well-being. For example, in 2017, 104 cities in China suffered from urban waterlogging disasters, affecting 2.18 million people and causing direct economic losses of $2.47 billion [16]. From 21 to 22 July 2012, Beijing suffered the strongest rainstorm and waterlogging disaster in 61 years (460 mm maximum precipitation). The torrential rain triggered flash floods, resulting in 79 deaths, 10,660 houses collapsing, and $1875 billion in losses. Coincidentally, as the youngest city in China, in April 2019, a sudden, instantaneous heavy precipitation (maximum half an hour rainfall, 73.4 mm) caused 11 deaths in Shenzhen. Consequently, strengthening the ability to prevent waterlogging disasters has become an important issue of sustainable urban development and the UN’s 2030 Sustainable Development Goals (SDGs).
The importance of mitigating the risk of urban waterlogging has been widely recognized by society. This requires understanding the mechanisms of urban waterlogging first. Considerable studies have shown that urban waterlogging events are caused by environmental factors and human activities [17,18,19,20]. In terms of environmental factors, urban waterlogging is mainly affected by meteorological conditions and urban microtopography. In the context of global warming, the frequency and intensity of extreme rainstorms have increased [20,21,22]. Moreover, the phenomenon that the precipitation in many cities is significantly higher than that in the surrounding suburbs has become more prominent in recent years, known as the “urban rain island” effect. If the “rain island effect” occurs concentratedly in the rainy season, which is more likely to cause waterlogging disasters. In urban microtopography, the area with higher elevation is less prone to waterlogging. On the contrary, low-lying areas tend to accumulate surface runoff, which is why tunnels and underpasses are prone to waterlogging [10,21,23]. Among anthropogenic factors, drainage facilities and land cover composition have a significant impact on urban waterlogging. However, some studies have pointed out that the drainage facilities in developing countries generally suffer low design standards and inadequate management, which makes it difficult to play an active role in the face of heavy rainstorms [10,21]. In terms of land cover composition, numerous studies have shown that the impact of land use is particularly significant compared to other factors [24,25,26], which has gradually become the major cause of the increasing severity of urban waterlogging disasters.
At present, the Municipal Administration builds underground drainage pipelines and pumping stations to speed up rainwater drainage, thereby reducing the flow of surface runoff. However, this approach only accelerates the discharge rate of surface runoff but cannot reduce the total surface runoff. Surface runoff transfer to other regions in a short period may bring more pressure on the local drainage systems. Furthermore, drainage facilities block the recharge channel for groundwater, leading to a constant decline of groundwater level, threatening urban geological safety [27,28]. Compare with drainage pipelines to accelerate rainwater drainage, the concept of “sponge cities” or “low-impact development methods” has proposed to reduce the total amount of surface runoff. These methods aim to increase the permeable surface (such as green infrastructure) in cities, thereby counteracting the increase of surface runoff [29,30]. Therefore, understanding how urban green infrastructure can alleviate urban waterlogging is of great significance for urban sustainable living environment planning and management.
Urban green infrastructures (UGI) mainly refer to natural vegetation or artificial vegetation, such as urban parks, grassland, wetland, forest, and unmanaged green areas [31,32,33,34]. A considerable number of studies have pointed out the extensive ecological services of UGI, such as reducing stormwater runoff [35,36], regulating local microclimates [37,38], and purifying rainwater [39,40]. In particular, UGI increased the permeability to regulate surface runoff and peak flows. A proliferation of studies have shown that UGI, as a permeable surface, can effectively absorb and store rainwater [41,42,43], and the canopy and rhizome of vegetation can intercept surface runoff, thereby reducing the speed of runoff collection [44,45]. For example, Yang et al. [43] used the improved soil and water conservation service mode to evaluate the average accumulation of urban green space in Yixing city, and their result indicated that the average water storage of urban green space accounted for more than 88% of the annual rainfall. Liu et al. [45] show the effectiveness of UGI in urban flooding reduction at a community scale. These studies all demonstrated that UGI has a positive influence on waterlogging. Furthermore, some studies further examined the impact of UGI composition and spatial pattern on waterlogging [46,47]. As for UGI composition, Armson et al. [48] found that in a sample plot of 9 m2 (the land cover includes grassland, trees, and asphalt), the grassland controlled almost all the surface runoff, and the trees reduced 62% of runoff from asphalt. Richards et al. [49] pointed out that a vegetated area of 7.5% to the catchment area would reduce surface runoff by more than 90%. For the spatial pattern of UGI, a study indicated that the less fragmented urban green spaces are more effective in reducing peak annual average river runoff [41]. In addition to the UGI composition and spatial configuration, the morphology of UGI also had a substantial influence on urban waterlogging mitigation. The study in Shanghai (China) confirmed that the concave green space could effectively mitigate pluvial floods [36]. Similarly, Wen et al. [50] demonstrated that a concave-shaped UGI would significantly reduce the surface runoff and peak flood flows.
The above studies have demonstrated that the impact of UGI on urban waterlogging is associated with various factors, such as UGI composition, spatial configuration, and morphology. Considerable studies have examined the relationship between UGI’s factors and waterlogging through regression coefficients or hydrologic models [41,45,51,52]. However, previous studies mainly focused on the individual effects of UGI factors (composition or spatial configuration) on urban waterlogging; instead, the interactive effects of these factors remain unclear. The influence of UGI on urban waterlogging is not only affected by one factor alone. Only analyzing the individual effect of a UGI factor on urban waterlogging while ignoring the interactive effect may lead to biases, especially for the great heterogeneity urbanized area. From this perspective, some interesting questions emerge: How do the interactions of these UGI factors affect urban waterlogging? Can the interaction between different UGI factors further enhance their effects on waterlogging?
It is widely accepted that increasing the area of UGI may further increase its impact on urban waterlogging, thereby reducing the risk of urban waterlogging. However, will the risk of urban waterlogging continue to decrease as the area of UGI increases? In this context, another research question arises: Is there a threshold level for the effect of UGI on urban waterlogging? Less attention has been paid to investigating the threshold level for the impact of UGI on urban waterlogging. Moreover, given the shortage of urban land resources, it is unrealistic to reduce urban waterlogging by considerably increasing the UGI area. If the effect of UGI has a threshold level, planning a larger area of UGI may not provide a more significant mitigation effect. Therefore, it is necessary to understand the threshold level of UGI affecting urban waterlogging so that the limited UGI resource can be used to minimize the negative influence of urban waterlogging. Additionally, it is worth noting that many studies just involved a single city or region, which present inconsistent results among the studies [41,44]. These inconsistent results are not sufficient to fully examine the effect of UGI on waterlogging, which makes it difficult to apply in UGI planning and urban management. This highlights the urgency of conducting cross-regional comparative studies to further verify the universal effect of UGI on urban waterlogging.
Therefore, this study aims to shed some light on the above two research gaps by taking two waterlogging high-risk Chinese cities for a comparative study to address the following questions: (1) How does the interaction effect of UGI’s factors affect urban waterlogging? Which UGI factors are the dominant factors affecting urban waterlogging? (2) Is there a threshold level for the impact of UGI on urban waterlogging? Answering these questions can help us improve our understanding of the potential mitigation effect of UGI on urban waterlogging and furnish concrete references for UGI design.

2. Materials and Methods

2.1. Study Area and Data

2.1.1. Study Area

Two major cities in the Guangdong–Hong Kong–Macao Greater Bay Metropolitan Region, Guangzhou and Shenzhen cities, are selected for this study (Figure 1). Guangzhou City (112°57′ to 114°30′E, 22°26′ to 23°56′N) is located in the downstream of the Pearl River Basin, the central and southern part of Guangdong Province, with an area of 7434.40 km2. Shenzhen City (113°45′ to 114°37′E, 22°26 to 22°51′N), with an area of 1997.47 km2, is located on the eastern bank of the Pearl River Estuary. The average annual precipitation of Guangzhou and Shenzhen are 1720.6 mm and 1933.3 mm, respectively, belonging to subtropical monsoon climate [53,54]. The two cities are among the four national cities in mainland China, with a permanent resident population of 15.31 million (Guangzhou) and 13.44 million (Shenzhen), respectively, which together account for 47% of Guangdong’s GDP in 2019 ($756 billion; http://www.stats.gov.cn/; access on 8 January 2021).
With the substantial increase of extreme rainfall events, the urban waterlogging events frequently occur in these two low-lying coastal cities [2]. For example, on 22 May 2020, four people were killed in extraordinarily heavy rainfall in Guangzhou, with an average hourly rain intensity exceeding 80 mm, and the maximum precipitation in 3 hours at 288.5 mm. From 29–30 August 2018, a heavy rainstorm occurred in Shenzhen for two consecutive days (269 mm average cumulative precipitation, 97 mm maximum hourly precipitation), the first-ever recorded in local meteorological history. This event resulted in approximately 150 waterlogging events, 10 local riverbank collapses, and 37 landslides. Given the densely populated area and the serious risk of urban waterlogging disaster in this region, selecting these two cities to investigate the effect of UGI on urban waterlogging has a certain practical significance. Guangzhou Water Authority has only recorded the urban waterlogging events in the central urban districts (Liwan, Yuexiu, Tianhe, Haizhu, Baiyun, and Huangpu district). Hence, we select these central urban districts of Guangzhou (1559.82 km2) and Shenzhen city as our study sites.

2.1.2. Dataset

In this study, we concentrate on the period from 2009 to 2015. The data include urban waterlogging records, UAV images, Landsat-8 Operational Land Imager imagery, DEM, precipitation, and drainage facilities (Table 1). As mentioned in previous studies, the waterlogging records obtained from Guangzhou and Shenzhen Water Authority only contain location information [10,55]. Therefore, we utilized ArcGIS Pro to locate the spatial location of urban waterlogging events. Finally, we collected 423 and 353 records in Guangzhou and Shenzhen from 2009 and 2015. The composition and spatial configuration of UGI were obtained from UAV aerial images (spatial resolution 0.5 m). The cloud-free Landsat-8 OLI imageries (path/row: 122-44, 121-44) were utilized in this study to calculate the biophysical parameter of UGI. Subsequently, we utilized DEM (spatial resolution 5 m, vertical accuracy 0.1 m) to generate auxiliary variables, including elevation and slope. Lastly, other auxiliary variables, such as precipitation and drainage density, were also collected. Local water authorities only recorded urban waterlogging events in this period (without a specific year). Therefore, we only selected remote sensing images, DEM data, drainage network, river network, and precipitation data in this period.

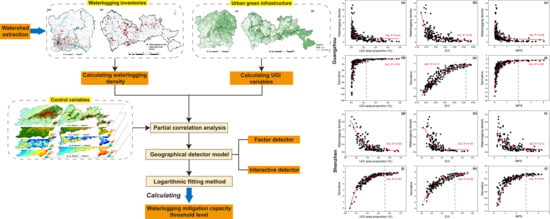
2.2. Integrated Framework

The integrated framework was developed to analyze the interactive effects of UGI factors on waterlogging and quantify the threshold level (Figure 2). Urban waterlogging is a systemic problem. The occurrence of waterlogging is related to the destruction of the hydrological cycle in the watershed unit [55,56,57]. When the rainwater is unbalanced, rainfall or rainwater inflow exceeds the drainage capacity, urban waterlogging events will eventually occur. The watershed unit reflects the hydrological characteristics of an area, which has more natural and ecological significance. It is not appropriate to analyze urban waterlogging from the perspective of a point or a raster grid (buffer zone), as it ignores the hydrodynamics of the surface. Therefore, we investigated the effect of UGI at the watershed level.
First, the density of waterlogging per unit area within each watershed unit was calculated based on the waterlogging record. Several metrics were utilized to measure green infrastructure composition and spatial configuration (area proportion, biophysical parameter, and spatial configuration). Second, other auxiliary variables, including elevation, slope, precipitation, and drainage density, were adopted as control variables. Then, the urban waterlogging density was regarded as a dependent variable, while the UGI composition and spatial configuration were considered explanatory variables. Fourth, the correlation between urban waterlogging density and explanatory variables was examined through partial correlation analysis. Fifth, the interaction effect of UGI’ factors on waterlogging we examined through the geographical detector model. Lastly, we quantified the threshold level of UGI affecting urban waterlogging using the logarithmic fitting method.

2.3. Watershed Unit

According to the method proposed by Yu et al. [55] and successfully applied in Zhang et al. [10], the DEM, urban river and drainage network, and the hydrological analysis module of ArcGIS pro were utilized to divide the watershed units through the D8 algorithm. Although the D8 algorithm is more efficient at the urban scale than other algorithms, including D-Infinity and MFD. Due to the flat topography of the Pearl River Basin, the extracted watershed boundaries need to be modified using urban rivers and drainage networks [57,58]. Finally, we divided the Guangzhou central urban district and Shenzhen into 351 and 276 watershed units (Figure 3).

2.4. Measuring Green Infrastructure Composition and Spatial Configuration

In this study, we mapped the green infrastructure of Guangzhou central urban district and Shenzhen using 0.5 m aerial images. These images were obtained from the Geographical Situation Survey Project (GSSP) in 2012. The flight missions were conducted with DB-2S and IFAUAV-3 platform, and the image forward overlap and image side overlap were set as 83% and 57%. The images and POS information were then imported into Pix4D Mapper to create the stitching project. After performing automatic aerial triangulation, the images were corrected by acquiring ground control point (GCP) data and a third-order polynomial model. Finally, the horizontal RMSE values were 0.763 m and 0.871 m in Guangzhou and Shenzhen, sufficient for green infrastructure extraction.
According to the field research, the woodland, grassland, garden, and cultivated land were defined as UGI in this study. We extracted the green infrastructure through an object-oriented classification method using the eCognition Developer software. The classification accuracy assessment was computed from ground-truthing analysis by randomly selecting over 100 points for each city. Ultimately, the overall accuracy of classification was 85.8%, 81.2%, and the kappa coefficient was 0.78, 0.75, for Guangzhou and Shenzhen, respectively (Figure 4). Subsequently, the area proportion of UGI within different watershed units was calculated.
The UGI area proportion refers to the area ratio of green infrastructure in a watershed unit, however, it could not reflect the biophysical parameter of UGI. Under the same green infrastructure coverage ratio, different vegetation growth statuses or densities have different effects on urban waterlogging. For example, dense vegetation may be more conducive to reducing surface runoff, while sparse vegetation may be less effective. Biophysical parameters should represent these vegetation gradients. Therefore, we used the enhanced vegetation index (EVI) to describe the biophysical parameter of UGI (Figure 5), which derived from the multispectral optical band (blue and red) and near-infrared (NIR) band of the Landsat-8 OLI images (Equation (1)).
E V I = 2.5 × ρ N I R ρ R E D ρ N I R + 6.0 × ρ R E D 7.5 × ρ B L U E + 1
The spatial pattern of land cover features can be described by landscape pattern metrics [59]. In recent decades, the landscape pattern metrics have achieved unprecedented development, plenty of indicators have been developed to reveal the characteristics of landscape spatial patterns [60,61]. In this study, three landscape metrics were selected to reflect the spatial configuration characteristics of UGI, including (1) landscape fragmentation—mean patch size (MPS) and landscape division index (LDI); (2) landscape aggregation—aggregation index (AI). The equation and description of these UGI metrics were shown in Table 2 and were calculated through Fragstats 4.2.

2.5. Control Variables

Urban waterlogging is the result of the combination of environmental conditions and human activities. In addition to the significant influence of land cover composition (UGI) on urban waterlogging, the urban microtopography, rainfall, and drainage facilities also have a non-negligible impact on urban waterlogging [10,21]. In order to accurately quantify the effect of UGI on urban waterlogging, it is essential to exclude the influence of other relevant variables on waterlogging. Therefore, the topography (elevation and slope), average precipitation, and drainage density are adopted as control variables to avoid these distractions (Figure 6). Firstly, the topographic variables of elevation and slope were calculated from the DEM data through ArcGIS Pro. Then, as the urban waterlogging record does not include the specific years, this study used the average cumulative precipitation (Pre) reflecting the spatial distribution difference of rainfall during this period. Lastly, we calculated the drainage network density (DD) by line density module in ArcGIS pro to reflect the drainage capacity.

2.6. Statistical Analyses

2.6.1. UGI and Waterlogging Clusters Extraction

In this study, the spatial autocorrelation analysis Getis-G statistic was adopted to investigate the spatial distribution pattern of UGI and urban waterlogging events. The Getis-G statistic allows us to detect whether the elements (green infrastructure and waterlogging event) are clustered, discrete, or randomly distributed, which has been widely applied in geography and economy [38,62]. This allows to identify the spatial agglomeration effect with statistical significance (99%, 95%, 90% confidence level). In this study, the proportion of UGI and waterlogging density within each watershed unit was used as input attributes to distinguish the spatial agglomeration effect (hot spots or cold spots) of UGI and waterlogging. The calculation formula is as follows:
G = i = 1 n j = 1 n ω i , j x i x j i = 1 n j = 1 n x i x j , j i
where ω i , j is the spatial weight matrix; x i and   x j are the attribute values of the i and   j variables, respectively. The Getis-G statistic will return five values: General G observed value, General G expected value, Z-test, and p-value. A positive Z-test indicates a high value of the attribute (UGI proportion and waterlogging density) spatial clustering (hot spots), which means that the density of urban waterlogging or the area proportion of UGI in the region is relatively large. Conversely, a negative Z-test indicates a low value (UGI proportion and waterlogging density) of spatial clustering (cold spots), which implies that the density of urban waterlogging or the area proportion of UGI in the region is relatively low. There were six main cluster types, and the specific meanings were as follows:
The waterlogging or UGI hot spots at 99%, 95%, 90% confidence level: The density of urban waterlogging events or the area proportion of UGI in the watershed unit and its adjacent watersheds are significantly higher than the average level, indicating that urban waterlogging events or UGI distribution are concentrated in a place.
The waterlogging or UGI cold spots at 99%, 95%, 90% confidence level: The density of urban waterlogging events or the area proportion of UGI in the watershed unit and its surrounding units are relatively lower than the average level, which implies urban waterlogging events and UGI distribution are much fewer in the region.

2.6.2. Partial Correlation Analysis

The partial correlation analysis was first used to reveal the binary correlation of waterlogging and UGI. As urban waterlogging is a systemic problem, the relationship between UGI and urban waterlogging is affected by multiple variables [10,17,21]. For example, improving the condition of green infrastructure or increasing drainage facilities can both reduce the risk of urban waterlogging. Therefore, to accurately measure green infrastructure’s effect on urban waterlogging, the partial correlation analysis with control variables was utilized to examine the correlation and stability between UGI factors and urban waterlogging density. The partial correlation can effectively prevent the correlation between two variables from being contaminated by other correlations. In this case, any influencing factors that have potential effects on urban waterlogging were regarded as control variables for partial correlation analysis. Hence, the elevation, slope, precipitation, and drainage density were adopted as control variables to examine UGI composition and spatial configuration for its partial correlation with urban waterlogging.

2.6.3. Geographical Detector Model

Spatial heterogeneity is a major characteristic of spatial data. The geographical detector model is a spatial statistic tool based on stratified spatial heterogeneity, which has been widely used to investigate spatial heterogeneity and driving forces of geographical phenomena [63,64,65]. The geographical detector model can be divided into four parts according to their specific analytical functions: factor detector, risk detector, ecological detector, and interactive detector [66]. As the main purpose of this study, the factor detector and interactive detector were employed to reveal which green infrastructure factor has a more important impact on urban waterlogging and how these factors interact with each other.
The explanatory power of different factors to the dependent variable can be expressed by the PD value (power determinant) calculated by the factor detector. It compares the total variance of the factor in different subregions with the total variance of the factor in the whole study area to assess the impact of the green infrastructure factor on waterlogging:
PD = 1 h = 1 L N h σ h 2 N σ 2 = 1 S S W S S T
where N is the number of units across the region; Nh indicates the number of units in stratum h, h = 1, 2, …, L; σ2 and σ h 2 represent the global variance in the entire study area and variance in stratum h; SSW and SST refer to the total variance within stratum and across the region. The value of PD ranges from 0 to 1. When PD = 1, the UGI factor fully explains the spatial distribution of urban waterlogging; when PD = 0, the UGI factor has no relationship with the variation of waterlogging.
The interaction detector is used to detect whether the combined effect of two individual factors on a dependent variable is significantly greater or less than the individual effect of a single factor [63]. It is determined by comparing the sum of the PD values of the two factors with the PD values of the two-factor interaction. The interaction detector divides the interactions between two factors into seven categories, as shown in Table 3.

2.6.4. Thresholds Level of UGI Affecting Waterlogging

First, we plot the relationship between waterlogging density and UGI factors to further analyze this complex linking. As shown in Figure 7, we notice that waterlogging density varies with the UGI factors but gradually approaches a stable level. This indicates that urban waterlogging density no longer decreases or increases with the UGI factor when the UGI factor reaches a certain range. For example, the UGI area proportion exceeds a certain range, the decreasing trend of urban waterlogging is gradually gentle (Figure 7a). Therefore, we can consider this value range reached by the UGI factor as the threshold value. Second, we notice that the relationship between waterlogging density and the UGI factor is similar to a logarithmic function. The logarithmic fitting is adapted to reflect the nonlinearity, which can be expressed as:
y = a ln x + b
where y represents the waterlogging density, x is the UGI indicator, a and b are coefficients. Third, we calculate the derivative of the logarithmic fitting expressions to obtain the variation rate of waterlogging density (Figure 7b). According to the variation rate of waterlogging density, we find that at the beginning, the decreasing rate of waterlogging density is very large, but with the increase of UGI indicators, the decline rate gradually tends to be flat. Therefore, we further calculated the unit decline rate of urban waterlogging density for each UGI indicator. When the unit decline rate is less than 0.01, we consider that the urban waterlogging density remains relatively stable, which no longer decreases significantly with the driver. On this basis, we regard the inflection point when the unit decline rate reaches 0.01. Accordingly, the value of the UGI indicators corresponding to the inflection point is considered the threshold value, which is defined as the limits of the impact of each UGI factor on urban waterlogging. For example, the area proportion of UGI corresponding to the inflection point is 24.4% (Figure 7b). This means that when the proportion of UGI exceeds 24.4%, the waterlogging density will not decrease significantly with the increase of the green area. Therefore, the threshold level of the UGI area proportion affecting urban waterlogging is 24.4%. Finally, the logarithmic fitting and derivation are implemented in the R package of “basicTrendline” [67].

3. Results

3.1. Spatial Patterns of UGI and Urban Waterlogging

3.1.1. Spatial Pattern of UGI between Two Cities

As shown in Table 4, within Guangzhou central urban districts, the UGI accounts for 33.92% of the total area, 21.41%, 4.73%, 2.26%, and 5.52%, woodland, grassland, cultivated land, and garden, respectively. For Shenzhen city, the proportion of UGI is much greater than that of Guangzhou, accounting for 45.86% of the city. The woodland, grassland, cultivated land, and garden account for 27.78%, 7.82%, 2.75%, and 7.51%, respectively. Regarding spatial configuration, the MPS and AI values are greater in Shenzhen city, indicating the clustered and continuous distribution of UGI. In contrast, Guangzhou’s MPS and AI values are relatively small, while the LDI value is large, indicating a more scattered and fragmented distribution of UGI in Guangzhou.
The cluster effect of UGI between the two cities is shown in Figure 8. The hot spots of UGI (highlighted as red) in Guangzhou are mainly concentrated in the northwest part where the land cover features are dominated by woodland. In contrast, the cold spots of UGI were concentrated in the Liwan, Yuexiu, and Haizhu districts (southwest part of Guangzhou’s central urban districts). These three districts are part of the historical urban area of Guangzhou and possess a high abundance of impervious surfaces. In Shenzhen, the UGI hot spots were mainly distributed in the Dapeng district, where the Dapeng Peninsula National Geopark is located. Compare with Guangzhou, Shenzhen’s UGI cold spots presents a multicentric distribution pattern, mainly distributed in each urban district (Futian, Luohu, Baoan, Longgang District).

3.1.2. Urban Waterlogging Spatial Agglomeration Effect between Two Cities

The Getis-G statistic shows that the area covered by waterlogging hot spots in Guangzhou is approximately 17.35%, while the area covered by waterlogging cold spots is about 22.19% (Table 5). In Shenzhen, around 23.68% of Shenzhen was covered by urban waterlogging hot spots, and 29.52% by cold spots. Both indicate that urban waterlogging in Guangzhou and Shenzhen has a significant clustering effect.
In Guangzhou, the waterlogging hot spots (highlighted as red) are concentrated in the southwestern part, which has a relatively high proportion of impervious surface (Figure 9). In contrast, the waterlogging cold spots (highlighted as blue) are mainly distributed in the northwestern part with a relatively high UGI abundance. As for Shenzhen, the waterlogging hot spots are sparsely distributed in the urban sub-centres (Futian, Luohu, Longhua, Longgang District), while the urban waterlogging cold spots are mainly clustered in the eastern Dapeng district with better natural conditions. Although both cities show the agglomeration effect of urban waterlogging, the spatial clustering effect is more prominent in Guangzhou; instead, the hot spots and cold spots in Shenzhen present a more dispersed distribution pattern. This phenomenon may be due to the differences in the spatial distribution patterns of UGI between the two cities. Furthermore, a comparison between Figure 8 and Figure 9 reveals that the aggregation effects of UGI and urban waterlogging exhibit a coupling trend. For example, the hot spots of the UGI correspond to the cold spots of urban waterlogging and vice versa.

3.2. Impacts of UGI on Urban Waterlogging

3.2.1. Partial Correlations between UGI and Waterlogging

As shown in Table 6, we found that the UGI area proportion and EVI both presented a significant negative correlation with waterlogging in two cities (p < 0.01). This suggests that UGI such as woodland and grassland play a crucial role in regulating rainfall and reducing surface runoff or that the waterlogging density decreases with the increase of the UGI area proportion or EVI. From the perspective of landscape fragmentation, the MPS shows a negative correlation, while LDI experiences a positive correlation. This result indicates that a UGI with a large mean area or low fragmentation is less prone to waterlogging. As for landscape aggregation, the AI of green infrastructure has a negative effect on waterlogging, which implies that the clustered distribution UGI is also conducive to the mitigation of urban waterlogging. The correlation results suggest that optimizing the spatial arrangement of green infrastructure also matters, which positively alleviates urban waterlogging.

3.2.2. Individual and Interactive Effects of UGI Factors on Urban Waterlogging

The factor detector examined the relative importance (individual effect) of UGI factors on urban waterlogging. As shown in Figure 10, the PD values for all influencing factors ranged from 0.05 to 0.42. First, the UGI compositions (area proportion and EVI) in both cities show the strongest impact on waterlogging, which both have an explanatory power of over 30%. The result indicates that the proportion of UGI and EVI has an almost equally important effect in alleviating urban waterlogging. However, the individual effect of UGI spatial configuration on waterlogging is relatively small. The PD values for MPS in Guangzhou and Shenzhen are 0.142 and 0.171, respectively, while the other spatial conformation indices (LDI and AI) are even smaller. It hints that urban waterlogging is mainly affected by UGI area proportion and EVI, rather than the spatial configuration. Under the background of rapid urbanization and continuous expansion of impervious surfaces, the importance of properly regulating the UGI area proportion and EVI to alleviate the risk of urban waterlogging is highlighted. Second, we notice that the PD value of UGI factors in Shenzhen is generally higher than in Guangzhou. This indicates that the single effect of UGI factors on waterlogging density in Shenzhen is greater than that in Guangzhou. Although there are slight differences in PD values between cities, all confirm that UGI area proportion has the greatest impact on urban waterlogging.
However, it is difficult to further reveal the mechanism of UGI on urban waterlogging through the individual effect. Therefore, the interaction detector was utilized to quantify the interactive effects of UGI factors on waterlogging. As shown in Table 7, the interaction detector calculated the interaction between five factors on urban waterlogging. The results indicate that the interaction of UGI factors greatly enhances their individual effects on waterlogging. In these 10 pairs of interactions, all the factors have strong binary enhancement, and some even show a non-linear enhancement. The largest interaction in Guangzhou and Shenzhen is UGI area proportion interacting with EVI, followed by EVI interacting with MPS. This illustrates the importance of the interaction between the UGI area and its biophysical parameter (reflect vegetation healthy and density). Neither the size of the UGI nor its biophysical parameter can be ignored. Appropriate UGI area combined with good vegetation cover (EVI) will further improve the mitigation of urban waterlogging. Regarding the spatial configuration of Guangzhou, although AI has a relatively lower PD value than UGI area proportion from the single factor detector results, the interactive effect of UGI area proportion and AI factor get 261.61% enhancement compared with the single effect. Additionally, the results of the single factor detector results in Shenzhen show that the impact of LDI is not very important for urban waterlogging. However, the interactive effect of UGI area proportion and LDI accounts for around 274.58% enhancement. Furthermore, the interactive effect of EVI and MPS obtains over 233% and 195% enhancement for Guangzhou and Shenzhen, respectively. These results underscore the importance of the combination of UGI composition (area proportion and EVI) and spatial configuration. Based on a certain percentage of UGI, the interaction of UGI composition and configuration can further enhance its impact on urban waterlogging, which has important implications for the metropolis with a shortage of urban land resources. Lastly, similar to individual effects, most PD values of the Shenzhen interactive effect are higher than those of Guangzhou. This means that there is some variation in the ability of UGI to influence urban waterlogging under different urban backgrounds. Considering the vegetation conditions in Shenzhen (high cover), it can be inferred that UGI can affect urban waterlogging to a greater extent in cities with better vegetation conditions.

3.3. Threshold Level of UGI Affecting Waterlogging

Next, we aimed to better demonstrate the impact of UGI on the urban waterlogging magnitude. According to the relative importance of UGI factors on urban waterlogging, the relationship between UGI factors (UGI area proportion, EVI, MPS) and waterlogging density was plotted (Figure 11). As for UGI area proportion (Figure 11a,g), the nonlinear fitting curve (red line) indicates that as the proportion of green infrastructure increases, the decreasing trend of urban waterlogging gradually becomes more gentle. In Guangzhou, the downward trend of urban waterlogging density is significant when the area proportion is below 15%. However, when the area proportion exceeds 20%, the decreasing rate gradually slows down, and the waterlogging density remains relatively stable. Similarly, we also found that when the proportion of UGI in Shenzhen exceeds 60%, the decreasing trend of urban waterlogging density is also not obvious. This means that if the area of green infrastructure in the watershed exceeds the threshold, continuing to increase the proportion of green infrastructure may not significantly improve its mitigation effect. By deriving the function (Figure 11d,j), we find that when the UGI proportion exceeds 24.4% and 72.1%, the decline rate of urban waterlogging gradually approaches zero. This suggests that urban waterlogging barely declines as the proportion of green space increases. Correspondingly, we can consider that 24.4% and 72.1% of UGI area proportion are the threshold values for Guangzhou and Shenzhen. It hints that the area proportion of UGI within a watershed unit needs to be maintained at a certain level to effectively exert its waterlogging mitigation effect. If the green infrastructure proportion exceeds the threshold, the mitigation effect is no longer enhanced, which indicates the saturation effect of urban waterlogging mitigation. Therefore, the area proportion of UGI within watersheds should be weighed comprehensively regarding the benefits of the urban waterlogging mitigation effect.
As for the biophysical parameter, the EVI also presents a strong logarithmic correlation with waterlogging both in Guangzhou and Shenzhen (Figure 11b,h). The EVI thresholds in Guangzhou and Shenzhen are 0.36 and 0.43 when calculating the derivatives. When the EVI is less than the threshold value, the waterlogging density and the derivative values in Guangzhou and Shenzhen decrease significantly. At the same time, the EVI exceeds the threshold, the decline rate decreases gradually and insignificantly. This result also suggests that vegetation also has a saturation effect in the interception and infiltration of surface runoff.
Regarding the effect of spatial configuration, it can be found that a similar phenomenon also exists in the relationship between spatial configuration (MPS) and waterlogging (Figure 11c,i). In detail, the threshold value of MPS is 1.9 ha (Guangzhou) and 2.8 ha (Shenzhen). The threshold of MPS indicates that each green patch needs to maintain a certain area to achieve the optimal mitigation effect. This means that in addition to controlling the area proportion of UGI within a watershed unit, the size of green infrastructure patches also needs to be weighed.

4. Discussion

4.1. Spatial Variations of Urban Waterlogging

As shown in Figure 9, the urban waterlogging events in Guangzhou and Shenzhen have an obvious cluster effect. The waterlogging hotspots are mainly located in areas with a high proportion of impervious surfaces and low vegetation abundance, which couples with the spatial distribution of UGI hotspots (Figure 8). It hints that urban waterlogging hot spots tend to correspond to cold spots for green infrastructure. Since implementing the "open-door" policy and economic reforms in 1978, many cities in China have experienced rapid urbanization. The selected study areas, Guangzhou and Shenzhen, are representative of rapid urbanization in China. During this process, the underlying surface inside cities has changed dramatically, particularly the southwestern part of Guangzhou and the central and western parts of Shenzhen (with a high proportion of impervious surfaces). Accordingly, increase the risk of urban waterlogging in these regions. However, it is worth noting that the northeastern part of Guangzhou and the eastern part of Shenzhen are less affected by urban expansion, mainly because the urban expansion is strictly restricted in these areas as there are national forest parks. Therefore, the vegetation abundance is relatively high in these areas, which has become the hotspot for green infrastructure distribution. Despite the relatively high average annual rainfall and the low density of the drainage network in these areas (Figure 6), the occurrence of urban waterlogging much lower than that of the city center, becoming the waterlogging cold spots. This phenomenon indirectly confirms the positive effect of green infrastructure on urban waterlogging. Moreover, some studies have pointed out that the influence of drainage facilities on urban waterlogging is not as great as commonly believed [10,23,25,68]. The more important impact is the land cover composition, as our study further confirms. This further explains why urban waterlogging events are less frequent in the suburbs (with ample green areas).
Moreover, the spatial agglomeration effect of urban waterlogging and green infrastructure also provides corresponding enlightenment for waterlogging prevention and reduction. Local authorities can develop local mitigation strategies for waterlogging hotspot regions, such as increasing the green area or optimize the spatial configuration of UGI. Simultaneously, urban development in these areas needs to pay more attention to the proportion of impervious surface area, which avoids further encroachment of impervious surfaces on scarce green areas. In the event of heavy rainfall, these measures can help reduce or even prevent urban waterlogging. Furthermore, with the advent of multisource big data (population mobility data, traffic travel data, population density), the emergency management department can provide early warning to these hotspot regions to minimize the negative impact of waterlogging, such as the evacuation of the elderly or closing the underground parking lot. This will help accurately assess the risk of urban waterlogging and improve early warning and emergency response.

4.2. The Mitigation Effect of UGI on Waterlogging

UGI is often recommended for regulating surface runoff, purifying rainwater, and reducing negative environmental impacts [68,69,70,71]. Our results demonstrated that UGI has a considerable effect on urban waterlogging, even after controlling the impact of urban topography, precipitation, and drainage facilities. This result is consistent with previous studies, which confirmed the role of UGI in mitigating urban waterlogging risk [43,45,47]. However, our results further expand our understanding of the mechanism of green infrastructure alleviating urban waterlogging.
Firstly, we found that choosing the most representative and important UGI metric is crucial in this study. Focusing on the different behavior of various UGI metrics to influence the urban waterlogging magnitude, the results of cross-site evaluation suggest that the area proportion of UGI to be the most dominant factor influencing urban waterlogging. The larger the area of a UGI, the more considerable effect it has in regulating urban waterlogging magnitude. This finding is also consistent with Yao et al. [42] and Yang et al. [43]. However, this study further reveals the relative contribution of different UGI compositions. For the area proportion of UGI, woodland and grassland have the greatest impact on urban waterlogging, which provides implications to urban planners on the importance of preserving woodlands and grasslands in cities.
Additionally, it is interesting to note that the impact of green infrastructure on urban waterlogging also depends on its vegetation status (biophysical parameter). Our result demonstrated that the influence of biophysical parameters (EVI) could not be ignored or simply equated with area proportion. However, most previous studies ignore the influence of biophysical parameters (EVI), which only analyze the effects of different sizes of green infrastructure on urban waterlogging [41,42,43,44,45]. For example, Armson’s study confirmed that when the green patch area reached 9 m2, it could effectively reduce the surface runoff [48]. Coincidentally, Kim et al. [41] pointed out that the larger the green space area, the greater its effect on average runoff. However, ignoring the biophysical parameters of UGI will inevitably lead to some deviation. This is mainly because densely vegetated plots and sparsely vegetated plots have completely different effects on urban waterlogging for the same area. Our discoveries further deepen our understanding of the mechanism of UGI alleviating urban waterlogging, which helps implement more effective UGI planning strategies to mitigate urban waterlogging. For the same UGI area, healthier or denser vegetation (superior ecological environment with high EVI value) can more effectively intercept and store rainwater runoff, thereby contributing to the mitigation of urban waterlogging. Therefore, while increasing the area of UGI, it is also necessary to improve the vegetation conditions (biophysical parameter) of UGI.
Traditionally, urban planners increased the area of UGI to create a more pleasant human settlement [32,45,49]. However, with the rapid urbanization, the land use pressure within cities has increased significantly, showing that impervious surfaces continue to encroach on green infrastructure. Therefore, it is particularly important to optimize the spatial configuration of UGI under limited land resource conditions. Previous studies have also noted the impact of the spatial configuration of UGI on urban waterlogging [41,44,48]. Our study also confirmed the effect of spatial configuration on waterlogging. The mitigation effect of UGI on waterlogging can be increased or decreased through different spatial arrangements while keeping the green infrastructure area constant, which has important implications for the metropolis that lack land resources for UGI construction. For example, for most city centers, after experienced rapid urbanization, there are not enough land resources for UGI construction. Therefore, it is necessary to carry out a spatial reorganization of existing green infrastructure to make it clustered distributed with less fragmentation.
Considerable studies have mainly focused on the individual effect of UGI factors on urban waterlogging [41,44], while neglecting the interactive effect of UGI factors on urban waterlogging. However, our results show that the interaction of UGI factors greatly enhances its impact on urban waterlogging. This will undoubtedly further enhance our scientific knowledge in mitigating waterlogging. For example, the UGI area combined with EVI or spatial configuration will further improve the mitigation of urban waterlogging. These results underscore the importance of the combination of UGI composition and spatial configuration, as the individual effect is not sufficient. This suggests that our proposed method can reveal in more detail how the interaction of UGI composition and spatial configuration affects urban waterlogging. Additionally, this finding refreshes our perception of the importance of the interaction of landscape patterns. In previous studies, the importance of the UGI spatial configuration is often overlooked [41,44,48], mainly due to the spatial configuration having a relatively small individual effect. The interaction effect has led to a renewed awareness of the importance of the UGI landscape patterns for urban waterlogging mitigation. The interaction between spatial configuration and composition can more significantly improve its mitigation capacity of UGI. Therefore, we cannot ignore the role of the spatial configuration due to its relatively small individual effect. This also provides valuable and practical references for the urban planner to optimize the spatial configuration of UGI in urban centers.

4.3. Threshold Level of Waterlogging Mitigation Effect

It is well known that increasing the area proportion of UGI helps alleviate urban waterlogging. Most previous studies have only confirmed that increasing the area of green infrastructure can more effectively alleviate urban waterlogging [41,42,43,44,45,50]. However, this result cannot be practically applied to guide UGI planning, as the land use pressure within the urban centers is too large to increase the green area greatly. Compared with previous studies, our results find that there is a threshold level for the waterlogging mitigation effect (Figure 11). The impact of green infrastructure on urban waterlogging is not a simple linear relationship. As the area proportion of UGI within the watershed exceeds the threshold, the waterlogging density will not continue to decline as the UGI area increases. This provides a new perspective on urban waterlogging mitigation strategies—blindly increasing the area of green infrastructure may not bring much improvement to urban waterlogging mitigation. The excessive proportions of UGI within the watershed unit may lead to a waste of its mitigation effect. Therefore, the area proportion of UGI and its mitigation effect should be considered comprehensively when planning UGI. Moreover, we can infer that under the same area of UGI, replacing a single large-area UGI (exceeding the threshold) with several small green infrastructure patches may provide a more significant mitigation effect for urban waterlogging. At present, some local governments have built a single enormous green area in urban new districts. However, these actions may lead to a great waste of their mitigation effects. It is recommended to control the area proportion of UGI within the threshold value to mitigate urban waterlogging more effectively.
Furthermore, it is necessary to point out that the threshold values of MPS indicate that green infrastructure patches need to be maintained in a certain area. Green infrastructure patches that are too small or too large may not be effective in alleviating urban waterlogging. This means that when replacing a single large-area UGI, it is not advisable to use too small and fragmented patches. At the same time, the biophysical parameters also need to be weighed. In general, this provides practical implementations for urban green infrastructure planning: the proportion of green infrastructure at the watershed scale and the green infrastructure area at the patch scale are recommended not to exceed the threshold.
These results provide considerable implications for UGI management and planning. At present, if UGI in an urban center is occupied by artificial land cover, the loss of UGI area is generally filled by the land resources at the urban fringe (with low land use pressure). However, the UGI area remains relatively balanced at the city level. It is a net loss of the UGI area in the urban center, which undoubtedly negatively affects the management of urban waterlogging. Additionally, the vegetation abundance, biophysical parameter, and spatial configuration of UGI are not consistent during spatial replacement, which further leads to the relative loss of the urban waterlogging mitigation effect. Even if the area of UGI in the entire city remains relatively balanced, this may further worsen the urban waterlogging status. Therefore, despite the great pressure on land use and development in the urban center, it is still necessary to retain an appropriate area of UGI.

4.4. Limitations and Uncertainties

This study provides a potentially valuable idea for investigating the interaction effect and threshold level of UGI on urban waterlogging. However, this study has its limitations and they should be considered in future work. Firstly, the complex relationship between UGI and waterlogging was analyzed in two cities using only the historical record of urban waterlogging. Although we explicitly demonstrate the effect of UGI composition and spatial configuration, we may not apply this across all regions. The mitigation effect of various UGI factors may strongly dependent on the urban background. Revealing the role of UGI in urban waterlogging in other regions may help us confirm the universality of our findings. Secondly, the urban waterlogging data did not record the size (water depth, area), duration, and the specific year of each event. We only analyzed the waterlogging mitigation effect from the whole period, which inevitably brings some uncertainty to the results. Thirdly, only several commonly used UGI metrics were used in this study. Other three-dimensional metrics, such as green volume, were not taken into account. Consequently, in future research, the mitigation effect of UGI can reveal further insights from the perspective of the mitigation intensity and mitigation scale. It is suggested to explore the differences in the mitigation intensity of different compositions and spatial patterns of green infrastructure on urban waterlogging and the scale of this mitigation effect. Moreover, with sufficient data, we can introduce three-dimensional indicators of green infrastructure, as well as the water depth and duration of waterlogging events to investigate the effect of UGI on urban waterlogging more comprehensively.

5. Conclusions

In the context of the UN’s 2030 Sustainable Development Goals, two highly urbanized coastal cities were selected for a cross-regional study to investigate the interaction effect and threshold level of UGI on urban waterlogging. The results support three conclusions.
Firstly, the area proportion and EVI of UGI both have a non-negligible effect in alleviating urban waterlogging. The impact of green infrastructure on urban waterlogging largely depends on its area and vegetation status. Healthier or denser vegetation (superior ecological environment) can more effectively intercept and store rainwater runoff. This finding provides practical insights into UGI planning, i.e., while increasing the area of UGI, more attention should also be paid to the biophysical parameter of vegetation, thereby improving the mitigation effect of green infrastructure from the “size” and “health”. Secondly, the interaction of UGI factors greatly enhances their individual effects on waterlogging. The UGI composition (area percentage and biophysical parameter) and the spatial configuration can effectively alleviate urban waterlogging. This result offers insights into the importance of the interactive enhancement effect between UGI composition and spatial configuration. Under limited area for green infrastructure, it is more necessary to optimize the UGI composition and spatial configuration. Lastly, the impact of UGI on waterlogging presents a threshold phenomenon. Blindly increasing the area of green infrastructure may not greatly improve the alleviation of urban waterlogging. Excessive proportions of UGI within the watershed unit or an oversized UGI patch may lead to a waste of mitigation effects. Therefore, it is necessary to control the UGI area (both in the watershed unit and patch size) within a certain range to play a corresponding role in mitigating urban waterlogging. Since the threshold values of some UGI indicators are different among cities, the thresholds are disturbed by regional characteristics. Therefore, the UGI-based waterlogging prevention strategies should be adapted to local conditions. Given the growing concerns of global warming and continued rapid urbanization, we believe that our findings provide useful enlightenment for local authorities in urban waterlogging prevention, green infrastructure management, and sustainable development.

Author Contributions

Conceptualization, Q.Z. and P.T.; methodology, Q.Z. and P.T.; software, Q.Z.; validation, P.T., Z.W. and Q.Z.; formal analysis, Q.Z.; investigation, Q.Z.; resources, Z.W. and P.T.; data curation, Z.W. and Q.Z.; writing—original draft preparation, Q.Z.; writing—review and editing, P.T. and Z.W.; visualization, Q.Z.; supervision, P.T. and Z.W.; project administration, P.T. and Z.W.; funding acquisition, P.T. and Z.W. All authors have read and agreed to the published version of the manuscript.

Funding

This research was funded by the University of Padova research project, grant number DOR1948955/19; the National Key R & D Program of China, grant number 2018YFB2100702; the NSFC-Guangdong Joint Foundation Key Project, grant number U1901219; and the Team Project of Guangdong Provincial Natural Science Foundation, grant number 2018B030312004.

Institutional Review Board Statement

Not applicable.

Informed Consent Statement

Not applicable.

Data Availability Statement

The remote sensing data and code used in this study are openly available on the website. The high-resolution topographic data are not publicly available due to the confidentiality rules.

Acknowledgments

The authors are grateful for the waterlogging records provided by the Guangzhou and Shenzhen Water Resources Bureau. The authors also would like to thank the Land Resources Technology Center of Guangdong Province and Shenzhen Planning and Natural Resources Bureau for providing basic urban data. We thank the reviewers and editors for their comments.

Conflicts of Interest

The authors declare no conflict of interest.

References

  1. Lin, J.; He, X.; Lu, S.; Liu, D.; He, P. Investigating the influence of three-dimensional building configuration on urban pluvial flooding using random forest algorithm. Environ. Res. 2020, 196, 110438. [Google Scholar] [CrossRef]
  2. Zhang, Q.; Wu, Z.; Guo, G.; Zhang, H.; Tarolli, P. Explicit the urban waterlogging spatial variation and its driving factors: The stepwise cluster analysis model and hierarchical partitioning analysis approach. Sci. Total Environ. 2020, 763, 143041. [Google Scholar] [CrossRef]
  3. Zhao, G.; Pang, B.; Xu, Z.; Peng, D.; Xu, L. Assessment of urban flood susceptibility using semi-supervised machine learning model. Sci. Total Environ. 2019, 659, 940–949. [Google Scholar] [CrossRef] [PubMed]
  4. United Nations. World Urbanization Prospects: The 2018 Revision. Available online: https://www.un.org/development/desa/pd/content/world-urbanization-prospects-2018-revision (accessed on 15 January 2021).
  5. Qiu, J.; Cao, B.; Park, E.; Yang, X.; Zhang, W.; Tarolli, P. Flood Monitoring in Rural Areas of the Pearl River Basin (China) Using Sentinel-1 SAR. Remote Sens. 2021, 13, 1384. [Google Scholar] [CrossRef]
  6. Liquete, C.; Kleeschulte, S.; Dige, G.; Maes, J.; Grizzetti, B.; Olah, B.; Zulian, G. Mapping green infrastructure based on ecosystem services and ecological networks: A Pan-European case study. Environ. Sci. Policy 2015, 54, 268–280. [Google Scholar] [CrossRef]
  7. Le, M.T.; Cao, T.A.T.; Tran, N.A.Q. The role of green space in the urbanization of Hanoi city. In E3S Web of Conferences; EDP Sciences: Ulis, France, 2019; Volume 97. [Google Scholar]
  8. Zhong, Y.D.; Jia, Y.W.; Li, Z.W. Spatial and temporal changes of maximum 1 h precipitation intensity in Beijing region in last 53 years. J. China Hydrol. 2013, 33, 32–37. [Google Scholar]
  9. Lyu, H.M.; Shen, S.L.; Zhou, A.N.; Zhou, W.H. Flood risk assessment of metro systems in a subsiding environment using the interval FAHP-FCA approach. Sustain. Cities Soc. 2019, 50, 101682. [Google Scholar] [CrossRef]
  10. Zhang, Q.; Wu, Z.; Zhang, H.; Dalla Fontana, G.; Tarolli, P. Identifying dominant factors of waterlogging events in metropolitan coastal cities: The case study of Guangzhou, China. J. Environ. Manag. 2020, 271, 110951. [Google Scholar] [CrossRef] [PubMed]
  11. Sofia, G.; Roder, G.; Dalla Fontana, G.; Tarolli, P. Flood dynamics in urbanised landscapes: 100 years of climate and humans’ interaction. Sci. Rep. 2017, 7, 1–12. [Google Scholar] [CrossRef]
  12. Huang, H.; Chen, X.; Zhu, Z.; Xie, Y.; Liu, L.; Wang, X.; Wang, X.; Liu, K. The changing pattern of urban flooding in Guangzhou, China. Sci. Total Environ. 2018, 622, 394–401. [Google Scholar] [CrossRef]
  13. Yang, H.; Dick, W.A.; McCoy, E.L.; Phelan, P.L.; Grewal, P.S. Field evaluation of a new biphasic rain garden for stormwater flow management and pollutant removal. Ecol. Eng. 2013, 54, 22–31. [Google Scholar] [CrossRef]
  14. Amado, L.; Albuquerque, A.; Santo, A.E. Influence of stormwater infiltration on the treatment capacity of a LECA-based horizontal subsurface flow constructed wetland. Ecol. Eng. 2012, 39, 16–23. [Google Scholar] [CrossRef]
  15. IPCC. Climate Change 2014: Impacts, Adaptation, and Vulnerability: Working Group II Contribution to the Fifth Assessment Report of the Intergovernmental Panel on Climate Change; Cambridge University Press: Cambridge, UK, 2014. [Google Scholar]
  16. Ministry of Water Resources of the People’s Republic of China. Available online: http://www.mwr.gov.cn (accessed on 22 January 2021).
  17. Tehrany, M.S.; Jones, S.; Shabani, F. Identifying the essential flood conditioning factors for flood prone area mapping using machine learning techniques. Catena 2019, 175, 174–192. [Google Scholar] [CrossRef]
  18. Wang, C.; Du, S.; Wen, J.; Zhang, M.; Gu, H.; Shi, Y.; Xu, H. Analyzing explanatory factors of urban pluvial floods in Shanghai using geographically weighted regression. Stochastic Environ. Res. Risk Assess. 2017, 31, 1777–1790. [Google Scholar] [CrossRef]
  19. Li, B.; Zhao, Y.; Fu, Y. Spatio-temporal characteristics of urban stormwaterlogging in Guangzhou and the impact of urban growth. Geo Inf. Sci. 2015, 17, 445–450. [Google Scholar]
  20. Zhang, H.; Wu, C.; Chen, W.; Huang, G. Assessing the impact of climate change on the waterlogging risk in coastal cities: A case study of Guangzhou, South China. J. Hydrometeorol. 2017, 18, 1549–1562. [Google Scholar] [CrossRef]
  21. Wu, J.; Sha, W.; Zhang, P.; Wang, Z. The spatial non-stationary effect of urban landscape pattern on urban waterlogging: A case study of Shenzhen City. Sci. Rep. 2020, 10, 1–15. [Google Scholar] [CrossRef]
  22. Huong, H.T.L.; Pathirana, A. Urbanization and climate change impacts on future urban flooding in Can Tho City, Vietnam. Hydrol. Earth Syst. Sci. 2013, 17, 379–394. [Google Scholar] [CrossRef] [Green Version]
  23. Wang, J.; Gao, W.; Xu, S.; Yu, L. Evaluation of the combined risk of sea level rise, land subsidence, and storm surges on the coastal areas of Shanghai, China. Clim. Chang. 2012, 115, 537–558. [Google Scholar] [CrossRef]
  24. Zhao, G.; Pang, B.; Xu, Z.; Yue, J.; Tu, T. Mapping flood susceptibility in mountainous areas on a national scale in China. Sci. Total Environ. 2018, 615, 1133–1142. [Google Scholar] [CrossRef]
  25. Wu, J.S.; Zhang, P.H. The effect of urban landscape pattern on urban waterlogging. Acta Geogr. Sin. 2017, 3, 26–36. [Google Scholar]
  26. Liu, F.; Liu, X.; Xu, T.; Yang, G.; Zhao, Y. Driving Factors and Risk Assessment of Rainstorm Waterlogging in Urban Agglomeration Areas: A Case Study of the Guangdong-Hong Kong-Macao Greater Bay Area, China. Water 2021, 13, 770. [Google Scholar] [CrossRef]
  27. Zhang, B.; Li, N.; Wang, S. Effect of urban green space changes on the role of rainwater runoff reduction in Beijing, China. Landsc. Urban Plan. 2015, 140, 8–16. [Google Scholar] [CrossRef]
  28. Zhang, B.; Xie, G.; Zhang, C.; Zhang, J. The economic benefits of rainwater-runoff reduction by urban green spaces: A case study in Beijing, China. J. Environ. Manag. 2012, 100, 65–71. [Google Scholar] [CrossRef]
  29. Dong, W.; Lian, Y.; Zhang, Y. Sustainable Development of Water Resources and Hydraulic Engineering in China Proceedings for the 2016 International Conference on Water Resource and Hydraulic Engineering; Springer: Cham, Switzerland, 2018. [Google Scholar]
  30. Pour, S.H.; Abd Wahab, A.K.; Shahid, S.; Dewan, A. Low impact development techniques to mitigate the impacts of climate-change-induced urban floods: Current trends, issues and challenges. Sustain. Cities Soc. 2020, 62, 102373. [Google Scholar] [CrossRef]
  31. Palliwoda, J.; Banzhaf, E.; Priess, J.A. How do the green components of urban green infrastructure influence the use of ecosystem services? Examples from Leipzig, Germany. Landsc. Ecol. 2020, 35, 1127–1142. [Google Scholar] [CrossRef] [Green Version]
  32. Yu, Z.; Fryd, O.; Sun, R.; Jørgensen, G.; Yang, G.; Özdil, N.C.; Vejre, H. Where and how to cool? An idealized urban thermal security pattern model. Landsc. Ecol. 2020, 1–10. [Google Scholar] [CrossRef]
  33. Amundsen, O.M.; Allen, W.; Hoellen, K. Green infrastructure planning: Recent advances and applications. In Planners Advisory Service Memo; American Planning Association: Chicago, IL, USA, 2009. [Google Scholar]
  34. Schuch, G.; Serrao-Neumann, S.; Morgan, E.; Choy, D.L. Water in the city: Green open spaces, land use planning and flood management–An Australian case study. Land Use Policy 2017, 63, 539–550. [Google Scholar] [CrossRef] [Green Version]
  35. Lovell, S.T.; Taylor, J.R. Supplying urban ecosystem services through multifunctional green infrastructure in the United States. Landsc. Ecol. 2013, 28, 1447–1463. [Google Scholar] [CrossRef]
  36. Du, S.; Wang, C.; Shen, J.; Wen, J.; Gao, J.; Wu, J.; Lin, W.; Xu, H. Mapping the capacity of concave green land in mitigating urban pluvial floods and its beneficiaries. Sustain. Cities Soc. 2019, 44, 774–782. [Google Scholar] [CrossRef]
  37. Guo, G.; Wu, Z.; Chen, Y. Complex mechanisms linking land surface temperature to greenspace spatial patterns: Evidence from four southeastern Chinese cities. Sci. Total Environ. 2019, 674, 77–87. [Google Scholar] [CrossRef]
  38. Guo, G.; Wu, Z.; Xiao, R.; Chen, Y.; Liu, X.; Zhang, X. Impacts of urban biophysical composition on land surface temperature in urban heat island clusters. Landsc. Urban Plan. 2015, 135, 1–10. [Google Scholar] [CrossRef]
  39. Pickett, S.T.; Cadenasso, M.L.; Grove, J.M.; Boone, C.G.; Groffman, P.M.; Irwin, E.; Warren, P. Urban ecological systems: Scientific foundations and a decade of progress. J. Environ. Manag. 2011, 92, 331–362. [Google Scholar] [CrossRef]
  40. Luan, X.; Yu, Z.; Zhang, Y.; Wei, S.; Miao, X.; Huang, Z.Y.X.; Teng, S.N.; Xu, C. Remote sensing and social sensing data reveal scale-dependent and system-specific strengths of urban heat island determinants. Remote Sens. 2020, 12, 391. [Google Scholar] [CrossRef] [Green Version]
  41. Kim, H.W.; Park, Y. Urban green infrastructure and local flooding: The impact of landscape patterns on peak runoff in four Texas MSAs. Appl. Geogr. 2016, 77, 72–81. [Google Scholar] [CrossRef]
  42. Yao, L.; Chen, L.; Wei, W.; Sun, R. Potential reduction in urban runoff by green spaces in Beijing: A scenario analysis. Urban For. Urban Green. 2015, 14, 300–308. [Google Scholar] [CrossRef]
  43. Yang, L.; Zhang, L.; Li, Y.; Wu, S. Water-related ecosystem services provided by urban green space: A case study in Yixing City (China). Landsc. Urban Plan. 2015, 136, 40–51. [Google Scholar] [CrossRef]
  44. Yang, X.; You, X.Y.; Ji, M.; Nima, C. Influence factors and prediction of stormwater runoff of urban green space in Tianjin, China: Laboratory experiment and quantitative theory model. Water Sci. Technol. 2013, 67, 869–876. [Google Scholar] [CrossRef]
  45. Liu, W.; Chen, W.; Peng, C. Assessing the effectiveness of green infrastructures on urban flooding reduction: A community scale study. Ecol. Model. 2014, 291, 6–14. [Google Scholar] [CrossRef]
  46. Roy, S.; Byrne, J.; Pickering, C. A systematic quantitative review of urban tree benefits, costs, and assessment methods across cities in different climatic zones. Urban For. Urban Green. 2012, 11, 351–363. [Google Scholar] [CrossRef] [Green Version]
  47. Silva, M.M.; Costa, J.P. Urban floods and climate change adaptation: The potential of public space design when accommodating natural processes. Water 2018, 10, 180. [Google Scholar] [CrossRef] [Green Version]
  48. Armson, D.; Stringer, P.; Ennos, A.R. The effect of street trees and amenity grass on urban surface water runoff in Manchester, UK. Urban For. Urban Green. 2013, 12, 282–286. [Google Scholar] [CrossRef]
  49. Richards, P.J.; Farrell, C.; Tom, M.; Williams, N.S.G.; Fletcher, T.D. Vegetable rain gardens can produce food and reduce stormwater runoff. Urban For. Urban Green. 2015, 14, 646–654. [Google Scholar] [CrossRef]
  50. Wen, L.; Weiping, C.; Chi, P. Modeling the effects of green infrastructure on storm water runoff reduction on community scale. Acta Ecol. Sin. 2016, 36, 1686–1697. [Google Scholar]
  51. Du, S.; He, C.; Huang, Q.; Shi, P. How did the urban land in floodplains distribute and expand in China from 1992–2015? Environ. Res. Lett. 2018, 13, 034018. [Google Scholar] [CrossRef]
  52. Pijl, A.; Brauer, C.C.; Sofia, G.; Teuling, A.J.; Tarolli, P. Hydrologic impacts of changing land use and climate in the Veneto lowlands of Italy. Anthropocene 2018, 22, 20–30. [Google Scholar] [CrossRef]
  53. Guangzhou Meteorological Service. Available online: http://www.tqyb.com.cn (accessed on 22 February 2021).
  54. Shenzhen Meteorological Bureau. Available online: http://weather.sz.gov.cn (accessed on 22 February 2021).
  55. Yu, H.; Zhao, Y.; Fu, Y.; Li, L. Spatiotemporal variance assessment of urban rainstorm waterlogging affected by impervious surface expansion: A case study of Guangzhou, China. Sustainability 2018, 10, 3761. [Google Scholar] [CrossRef] [Green Version]
  56. Xue, F.; Huang, M.; Wang, W.; Zou, L. Numerical Simulation of Urban Waterlogging Based on FloodArea Model. Adv. Meteorol. 2016, 2016, 1–9. [Google Scholar] [CrossRef] [Green Version]
  57. Zhang, S.L.; Gan, J.Y.; Zeng, Q.L.; Lu, G.N. Automatic compartmentalization of urban rainwater catchments on water outlet supported by GIS technology. J. Hydraul. Eng. 2007, 38, 325–329. [Google Scholar]
  58. Zuo, D.; Xu, Z.; Yao, W.; Jin, S.; Xiao, P.; Ran, D. Assessing the effects of changes in land use and climate on runoff and sediment yields from a watershed in the Loess Plateau of China. Sci. Total Environ. 2016, 544, 238–250. [Google Scholar] [CrossRef]
  59. McGarigal, K. FRAGSTATS: Spatial Pattern Analysis Program for Quantifying Landscape Structure; US Department of Agriculture, Forest Service, Pacific Northwest Research Station: Corvallis, OR, USA, 1995; Volume 351.
  60. Turner, M.G.; Gardner, R.H.; O’Neill, R.V. Landscape Ecology in Theory and Practice; Springer: New York, NY, USA, 2001; Volume 401. [Google Scholar]
  61. Cushman, S.A.; McGarigal, K.; Neel, M.C. Parsimony in landscape metrics: Strength, universality, and consistency. Ecol. Indic. 2008, 8, 691–703. [Google Scholar] [CrossRef]
  62. Yang, Z.; Sliuzas, R.; Cai, J.; Ottens, H.F. Exploring spatial evolution of economic clusters: A case study of Beijing. Int. J. Appl. Earth Obs. Geoinf. 2012, 19, 252–265. [Google Scholar] [CrossRef]
  63. Wang, J.F.; Li, X.H.; Christakos, G.; Liao, Y.L.; Zhang, T.; Gu, X.; Zheng, X.Y. Geographical detectors-based health risk assessment and its application in the neural tube defects study of the Heshun Region, China. Int. J. Geogr. Inf. Sci. 2010, 24, 107–127. [Google Scholar] [CrossRef]
  64. Zhang, L.; Liu, W.; Hou, K.; Lin, J.; Song, C.; Zhou, C.; Huang, B.; Tong, X.; Wang, J.; Rhine, W.; et al. Air pollution exposure associates with increased risk of neonatal jaundice. Nat. Commun. 2019, 10, 1–9. [Google Scholar] [CrossRef] [PubMed]
  65. Yin, Q.; Wang, J.; Ren, Z.; Li, J.; Guo, Y. Mapping the increased minimum mortality temperatures in the context of global climate change. Nat. Commun. 2019, 10, 1–8. [Google Scholar] [CrossRef] [PubMed] [Green Version]
  66. Wang, J.F.; Zhang, T.L.; Fu, B.J. A measure of spatial stratified heterogeneity. Ecol. Indic. 2016, 67, 250–256. [Google Scholar] [CrossRef]
  67. R Core Team. R: A Language and Environment for Statistical Computing. R Foundation for Statistical Computing, Vienna, Austria. Available online: http://www.R-project.org/ (accessed on 2 May 2021).
  68. Sofia, G.; Prosdocimi, M.; Dalla Fontana, G.; Tarolli, P. Modification of artificial drainage networks during the past half-century: Evidence and effects in a reclamation area in the Veneto floodplain (Italy). Anthropocene 2014, 6, 48–62. [Google Scholar] [CrossRef]
  69. Hansen, R.; Pauleit, S. From multifunctionality to multiple ecosystem services? A conceptual framework for multifunctionality in green infrastructure planning for urban areas. Ambio 2014, 43, 516–529. [Google Scholar] [CrossRef] [Green Version]
  70. Szota, C.; Coutts, A.M.; Thom, J.K.; Virahsawmy, H.K.; Fletcher, T.D.; Livesley, S.J. Street tree stormwater control measures can reduce runoff but may not benefit established trees. Landsc. Urban Plan. 2019, 182, 144–155. [Google Scholar] [CrossRef]
  71. Zhang, H.; Cheng, J.; Wu, Z.; Li, C.; Qin, J.; Liu, T. Effects of impervious surface on the spatial distribution of urban waterlogging risk spots at multiple scales in Guangzhou, South China. Sustainability 2018, 10, 1589. [Google Scholar] [CrossRef] [Green Version]
Figure 1. The location of the Guangzhou central urban districts and Shenzhen city.
Remotesensing 13 02341 g001
Figure 2. The integrated framework of this study.
Remotesensing 13 02341 g002
Figure 3. The urban waterlogging events and watershed units for (a) Guangzhou central urban district and (b) Shenzhen.
Remotesensing 13 02341 g003
Figure 4. (a,b) The land cover maps and (c,d) UGI maps for (a,c) Guangzhou central urban district and (b,d) Shenzhen.
Remotesensing 13 02341 g004
Figure 5. The EVI for (a) Guangzhou central urban district and (b) Shenzhen.
Remotesensing 13 02341 g005
Figure 6. The auxiliary variables for (ad) Guangzhou central urban district and (eh) Shenzhen.
Remotesensing 13 02341 g006
Figure 7. The logarithmic fitting (a) and the derivative (b) between UGI area proportion and waterlogging. The red line indicates the nonlinear fitting curve and the derivative curve, and the blue dashed line represents the threshold value.
Remotesensing 13 02341 g007
Figure 8. The UGI spatial agglomeration map for (a) Guangzhou and (b) Shenzhen.
Remotesensing 13 02341 g008
Figure 9. The waterlogging spatial agglomeration map for (a) Guangzhou and (b) Shenzhen.
Remotesensing 13 02341 g009
Figure 10. The PD values of UGI factors in different cities.
Remotesensing 13 02341 g010
Figure 11. The relationship between UGI variables and waterlogging for (af) Guangzhou and (gl) Shenzhen. The red line indicates the nonlinear fitting curve and the derivative curve, and the blue dashed line represents the threshold value.
Remotesensing 13 02341 g011
Table 1. List of the data sources.
DataFormatTimeDetailSource
Waterlogging locationsShapefile2009–2015PointGuangzhou Water Resources Bureau
Shenzhen Water Resources Bureau
Landsat-8 OLI imageryGeoTIFF201330 m
(122-44, 121-44)
The USGS-EarthExplorer
UAV imagesRaster20120.5 mLand Resources Technology Center of Guangdong Province
Shenzhen Planning and Natural Resources Bureau
Digital Elevation ModelRaster20125 m
(accuracy 0.1 m)
Drainage networkShapefile2012Line
River networkShapefile2012Line
PrecipitationRaster2009–20151 kmGeographical Information Monitoring Cloud Platform
Table 2. List of landscape pattern metrics.
Landscape MetricsEquation *Description
MPS i = 1 n A i n Reflects the average patch size of UGI.
LDI 1 i = 1 n A i S 2 Reflects the degree of fragmentation of green infrastructure.
AI g i m a x g i Measures the spatial distribution pattern of green infrastructure.
* Ai: patch i area, S: total area, n: number of patches, gi: number of adjacent patches.
Table 3. Types of interaction between two factors.
InteractionDescription
Nonlinear weakenPD (A ∩ B) < Min[PD (A), PD (B)]
Unitary weakenMin[PD (A), PD (B)] < PD (A ∩ B) < Max[PD (A), PD (B)]
Binary enhancementPD (A ∩ B) > Max[PD (A), PD (B)]
IndependentPD (A ∩ B) = PD (A) + PD (B)
Nonlinear enhancementPD (A ∩ B) > PD (A) + PD (B)
Table 4. Spatial pattern of UGI in Guangzhou and Shenzhen.
CompositionCity
GuangzhouShenzhen
Woodland21.41%27.78%
Grassland4.73%7.82%
Cultivated land2.26%2.75%
Garden5.52%7.51%
Spatial
configuration
RangeMeanMedianS.D.RangeMeanMedianS.D.
MPS0.01–3.720.770.341.40.29–4.321.521.210.95
LDI0.04–0.870.510.590.230.006–0.630.210.170.15
AI67.94–99.5391.4788.522.8165.17–97.9895.7794.334.26
Table 5. Descriptive statistics of urban waterlogging hot spots and cold spots.
CityArea Percentage (%)General GZ-Scorep-Value
Hot SpotsCold Spots
Guangzhou17.3522.190.0000818.330.00
Shenzhen23.6829.520.0000212.940.00
Table 6. Partial correlation coefficients between UGI and waterlogging.
UGI FactorsCityGuangzhouShenzhen
CompositionEVI−0.338 **−0.445 **
UGI−0.471 **−0.617 **
Woodland−0.428 **−0.536 **
Grassland−0.344 **−0.468 **
Garden−0.232 **−0.359 **
Cultivate land−0.131−0.238 *
Spatial configurationMPS−0.351 **−0.502 **
LDI0.337 **0.407 **
AI−0.278−0.354 **
* Coefficient significant at p < 0.05, ** Coefficient significant at p < 0.01.
Table 7. Partial correlation coefficients between UGI and waterlogging.
Guangzhou CityShenzhen City
FactorInteractive PDEnhancementFactorInteractive PDEnhancement
PD (UGI ∩ EVI)0.525BinaryPD (UGI ∩ EVI)0.557Binary
PD (UGI ∩ MPS)0.446BinaryPD (UGI ∩ MPS)0.483Binary
PD (UGI ∩ LDI)0.424BinaryPD (UGI ∩ LDI)0.442Binary
PD (UGI ∩ AI)0.405BinaryPD (UGI ∩ AI)0.439Binary
PD (EVI ∩ MPS)0.474NonlinearPD (EVI ∩ MPS)0.505Nonlinear
PD (EVI ∩ LDI)0.362BinaryPD (EVI ∩ LDI)0.407Binary
PD (EVI ∩ AI)0.311BinaryPD (EVI ∩ AI)0.374Binary
PD (MPS ∩ LDI)0.252BinaryPD (MPS ∩ LDI)0.308Nonlinear
PD (MPS ∩ AI)0.267NonlinearPD (MPS ∩ AI)0.289Nonlinear
PD (LDI ∩ AI)0.238NonlinearPD (LDI ∩ AI)0.231Nonlinear
Publisher’s Note: MDPI stays neutral with regard to jurisdictional claims in published maps and institutional affiliations.

